Article

Modeling a Logistics Hub Using the Digital Footprint Method—The Implication for Open Innovation Engineering

1
Institute for Regional Economic Studies RAS, 38, Serpukhovskaya Street, 190013 Saint-Petersburg, Russia
2
Graduate School of Service and Trade, Peter the Great St. Petersburg Polytechnic University, 195251 St. Petersburg, Russia
3
King Mongkut’s Institute of Technology Ladkrabang, Bangkok 10520, Thailand
*
Author to whom correspondence should be addressed.
J. Open Innov. Technol. Mark. Complex. 2021, 7(1), 59; https://0-doi-org.brum.beds.ac.uk/10.3390/joitmc7010059
Submission received: 20 January 2021 / Revised: 2 February 2021 / Accepted: 3 February 2021 / Published: 7 February 2021
(This article belongs to the Special Issue Global Challenges of Digital Transformation of Markets (GDTM-2020))

Abstract

:
Optimizing the cargo flows through the nodes of a digital transport corridor is a crucial problem; solving it allows to introduce modern management methods in logistics. This study examines the optimization of the technology of a distribution center as the base node of a third-party logistics network operator. Our objective consisted in theoretically substantiating the application of mathematical formalisms to describing the passage of stochastic goods flows of a complex structure through a node of a logistics network. To solve the problem, we constructed a mathematical model intended as a decision-making block in the Warehouse Management System software. This paper presents the results of calculations carried out using a computer according to the proposed algorithm. Preliminary results allow to conclude that there is a significant resource for reducing construction and maintenance costs of the distribution center. Quantitatively, the savings will range from 10% to 40%, depending on the terms of delivery of goods and the degree of market uncertainty. An example of a practical calculation using the developed mathematical model is given. The calculations were performed for Huawei, a key global provider of ICT infrastructure and smart terminals. The algorithms were designed to account for uncertainty, which allows to use the results for risk management applications. In practice, this theoretical concept can serve as a basis for digital logistics platforms, increasing the speed of delivery of goods and cargo and the profitability of logistics as a result. The solution to this problem will allow to consider the nodes of logistics networks as smart independent divisions with an information interface for interaction built into a digital logistics platform. The role of these nodes is to make the best decisions in handling cargo flows. As the next stage of research, we plan to develop algorithms for coordinating the information flows reflecting transport activities and forming the material flows entering and leaving the distribution centers.

1. Introduction

The modern trend for the development of digital transport corridors makes it possible to put into practice the advantages of machine-to-machine communication technologies and intelligent systems for making management decisions. The basic concepts underlying the research could be considered as follows. Firstly, it is possible to create a transnational logistics network in numerous nodes of which manufacturers, suppliers, transfer points, distribution centers are located. Secondly, when forming a common logistic space for business, it becomes necessary to solve a number of problems, since any commercial activity takes place in conditions of uncertainty [1,2]. The load on logistics also depends on the volume of demand, market situation, seasonal factors and traffic restrictions, on which the range of the spent time depends. If the technical basis for the exchange of information [3] in real time is already available, then the problem of optimizing logistics flows is still being solved fragmentarily. For this purpose, ERP (Enterprise Resource Planning), Customer Relationship Management), SCM (Supply Chain Management), EWM Consulting Solutions and WMS (Warehouse Management System) systems are used [4,5]. The purpose of this study is to develop an algorithmic basis for managing distribution centers. Such logistics hubs are distributed all over the world as the basis of the 3PL (Third Party logistics) logistics outsourcing complex [6]. The efficiency of their work determines such parameters as the time spent on the delivery of goods and cargo, maintaining the necessary stocks, storage costs, including those caused not only by overstocking but also by possible costs for late delivery [7]. To this must be added the limited expire date characteristic of FMCG (fast moving consumer goods) which occupy the maximum share in the total mass of transported goods. To solve this problem, this paper analyzes the current state of research in the field of commercial logistics networks [8], defines the methodological foundations, formulates the problem statement and basic formalisms and applies the method of mathematical modeling. To illustrate the results, a study was carried out on Huawei data and a numerical calculation using a computer is presented. The proposed structure of the paper includes 5 sections: 1. Introduction discloses the purpose of the research and the basic concepts; 2. The theoretical Foundations include both literature review and problem statement as well as the method of the research and mathematical modelling; 3. The result section presents the obtained findings being explained in seven subsections; 4. Discussion section reveals the both the research from the point of view of open innovation concept and the topic for future research; 5. Conclusion presents the contribution of the research in the beginning of the sections and in three subsections.

2. Theoretical Foundations and Methodology

2.1. Literature Review

The research is considered on the basis of the fundamental theory being developed by JinHyo Joseph Yun who suggested the open innovation engineering model, including both open-innovation engineering channels and determining ways of operating the channels through conceptual experiments [9]. The authors find very useful the effects of the mechanism design (fundamental to the study of incentives and information [10]) being expanded and implemented for developing new business model from open innovation and Schumpeterian new combinations [11,12] as well as open innovation based business model design compass [13]. Undoubtedly, the implementation of innovative activities is associated with the implementation of innovative models. It is very interesting that the Christensen’s determinants of open innovation model associated with the industrial dynamics of an industry segment undergoing a process of radical technological innovation [14] unraveling the Chesbrough’s Open Innovation concept which was initially studied by from the company-level perspective (in contrary to the closed innovation old model).
It is customary to represent a commercial network in the form of a directed graph, where the corresponding divisions are located at the nodes. Their activities are related to information [15] and material flows [16]. Analysis of the structure of 3PL providers shows that the optimal solution for the nodes of such a network is, in addition to producers and consumers [17,18], widespread introduction of distribution centers (DC) [19,20]. The role of distribution centers when they are located in nodes is to smooth out flows, as well as to reduce the cost of consumers’ own storage capacity. This makes it possible to implement the concept of JIT Just In Time (J.I.T.) management in practice [21]. First of all, wholesale trading enterprises benefit from this, since their emergent stocks and, consequently, expensive SW (store warehouse) can be minimized. The volume of funds frozen in warehouses of enterprises is also decreasing [22]. In addition, manufacturers also benefit, since the JIT technology can be implemented in both directions of flows. Accordingly, new cross-docking and pick-by-line technologies are being introduced at DC [23]. The criteria for economic efficiency [24] when maximizing the 3PL operator’s profit can be the minimization of costs for the DC scale and the balance between possible costs (for example, for the factors of demurrage and detention or for contractual penalties for non-delivery or late shipment) [25].
The specific strategy chosen for handling cargo and, accordingly, scientifically grounded control algorithms serves as an ideological platform for modeling; respectively, the business model is the same platform for designing and planning business processes [26,27]. The main requirement for building business processes is formulated strictly and concisely: to create value for consumers and exclude any unnecessary or obviously needless activities—it applies to each individual business process and to all of their organizational set of processes that form a particular business [28,29,30,31,32].

2.2. Problem Statement

It is necessary to find an economically optimal management of the flows of goods and cargo based on digital information about their movement, taking into account the stochastic nature of the volumes and directions of flows. At the same time, it is necessary to choose and justify the methodology for calculating the node DC terminals included in the network structure of logistics activities. The obtained set of mathematical relations allows us to simulate the operation of a network distribution center as a node element of a logistics system that functions on the principles of 3PL operator in conditions of stochastic nature of incoming and shipped goods flows. Different project options were considered in the context of digitalization in [33,34,35,36,37].

2.3. Method of Research

The solution to the problems under consideration typically relies on the world experience in organizing network logistics. Open innovation is an emerging concept describing how companies use external ideas as well as internal ideas and internal and external paths to market, as these companies look to advance their technology. Christensen et al. [14] address how the open innovation concept can be analyzed from an industrial dynamics perspective, considering the specific measures that different companies take to manage open innovation from the standpoint of their differential position within the innovation system in question, the nature and stage of maturity of the technological regime and the particular value proposition pursued by companies. The complexity of knowledge could be investigated using the Quadruple Helix model [38] which differs from the fundamental Triple Helix model of innovation by adding a fourth helix as the “media-based and culture-based public” to the “university-industry-government relations” (three helices developed by Etzkowitz and Leydesdorff [39]) generating a national innovation system—academia/universities, industry and state/government. Leydesdorff explains that the metaphor of a Triple Helix could be considered as a basis for making the extensions the model to more than three helices [40]. The abovementioned Quadruple Helix and suggested later the Quintuple Helix being ecologically sensitive [41] could be treated as universal and in a wide sense be extended to N-Tuple Helix model [42]. A concept model of open innovation built up in [9] is intended for exploring the existing open innovation channels, which can be useful to motivate engineering research increasing the development of open innovation and new open business models. A formalized representation of the movement of goods and cargo that reflects real market conditions, including uncertainty factors. Stochastic modeling methods from the theory of random processes are used for the description. To develop optimal solutions, the criterion of minimizing total costs is applied. The choice of performance indicators is based on the balance of logistics and storage costs, demurrage and detention with the maximum profit from logistics activities. Calculations are performed using numerical methods of the mathematical theory of optimal processes computer simulation.

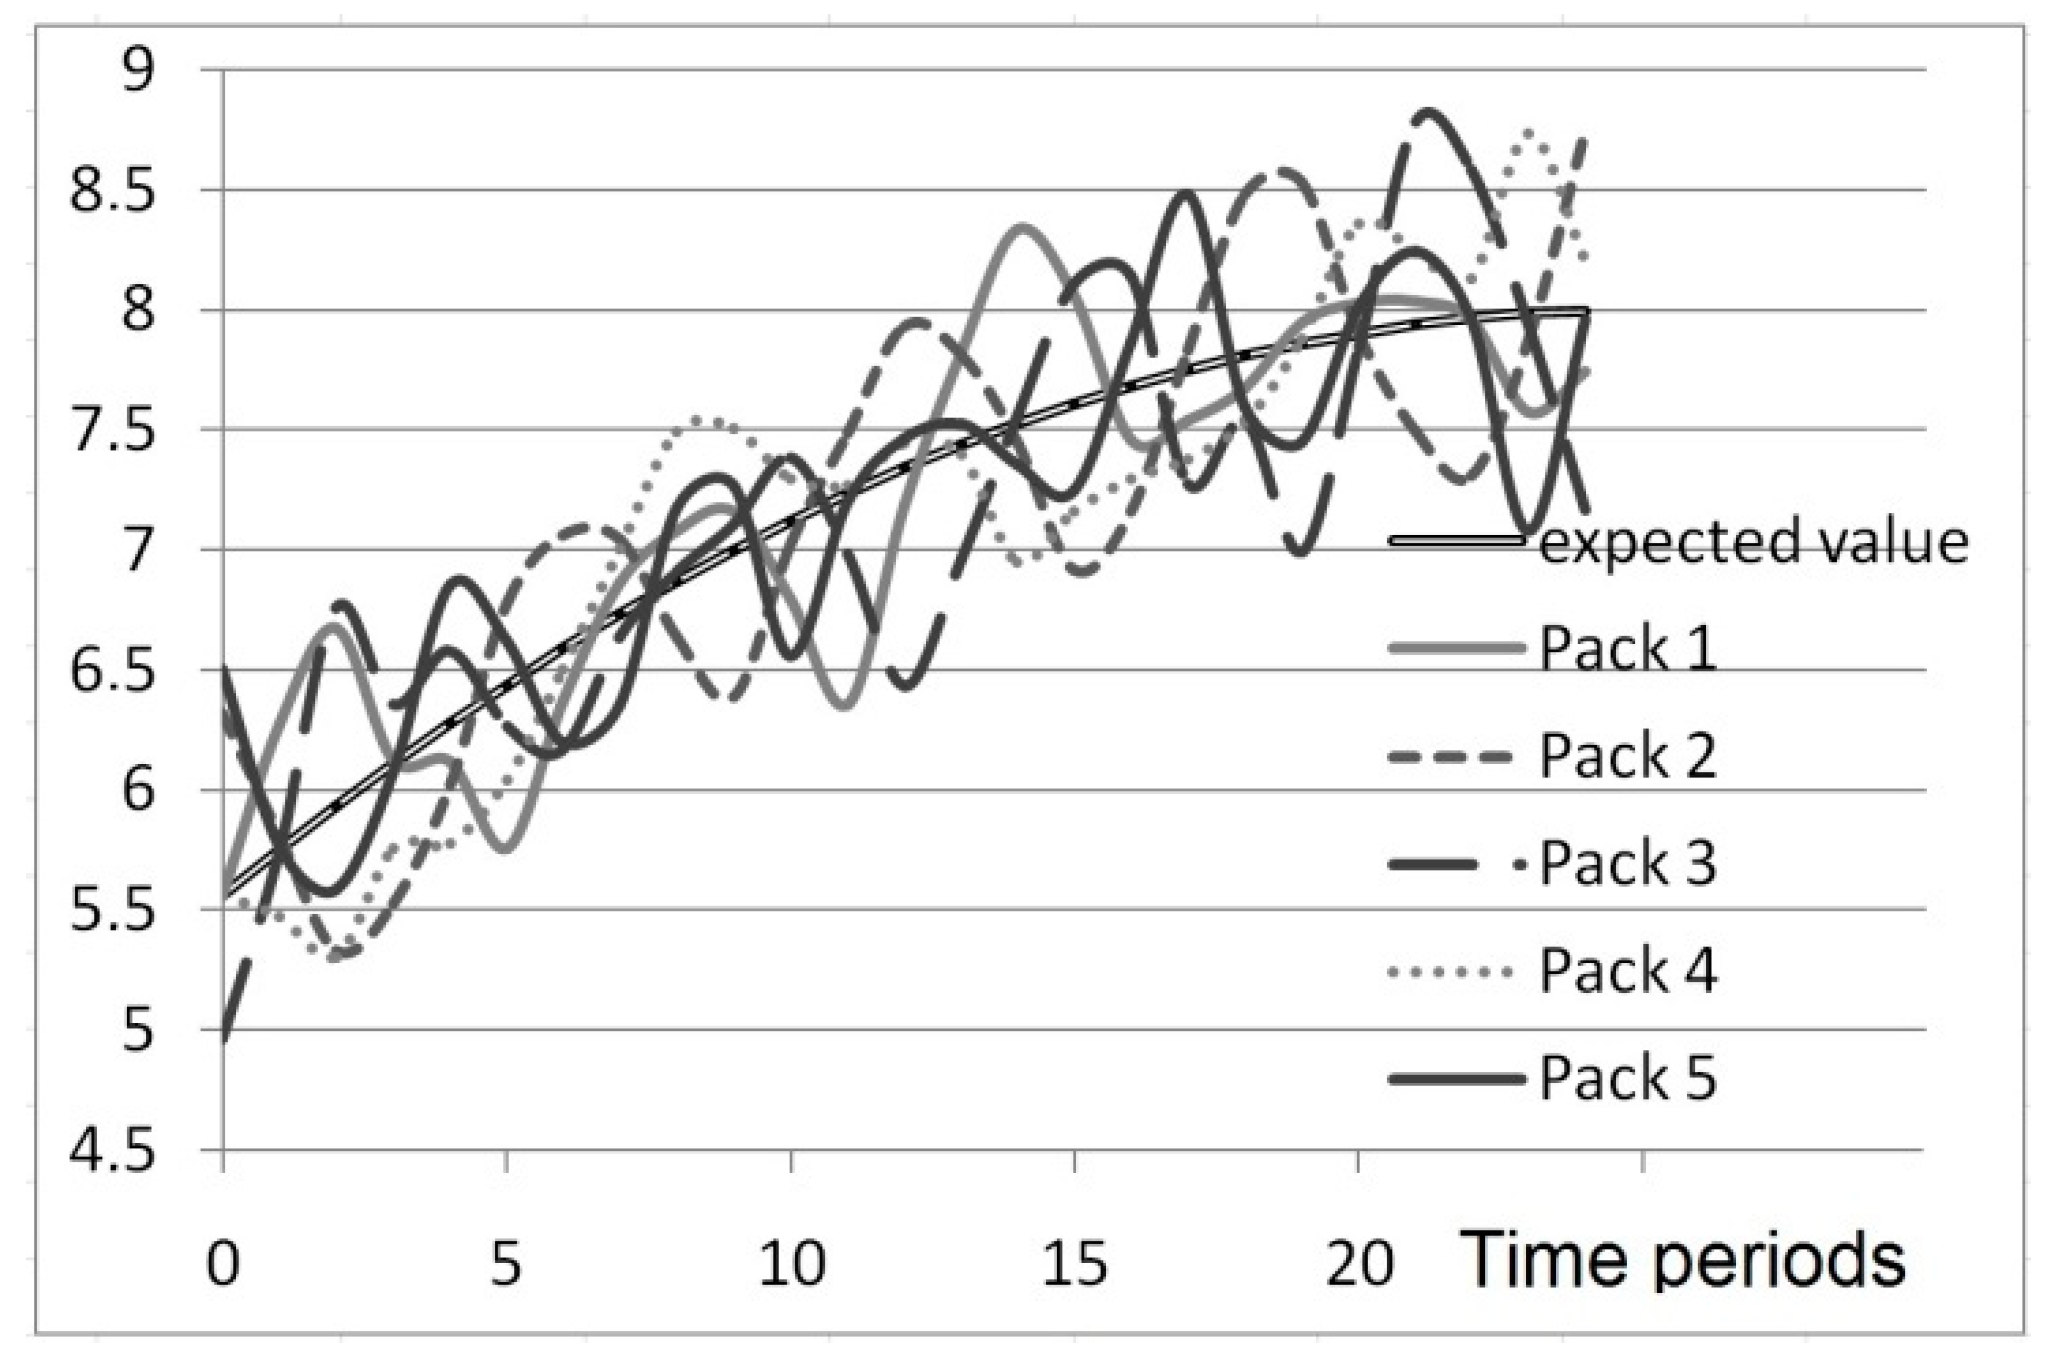
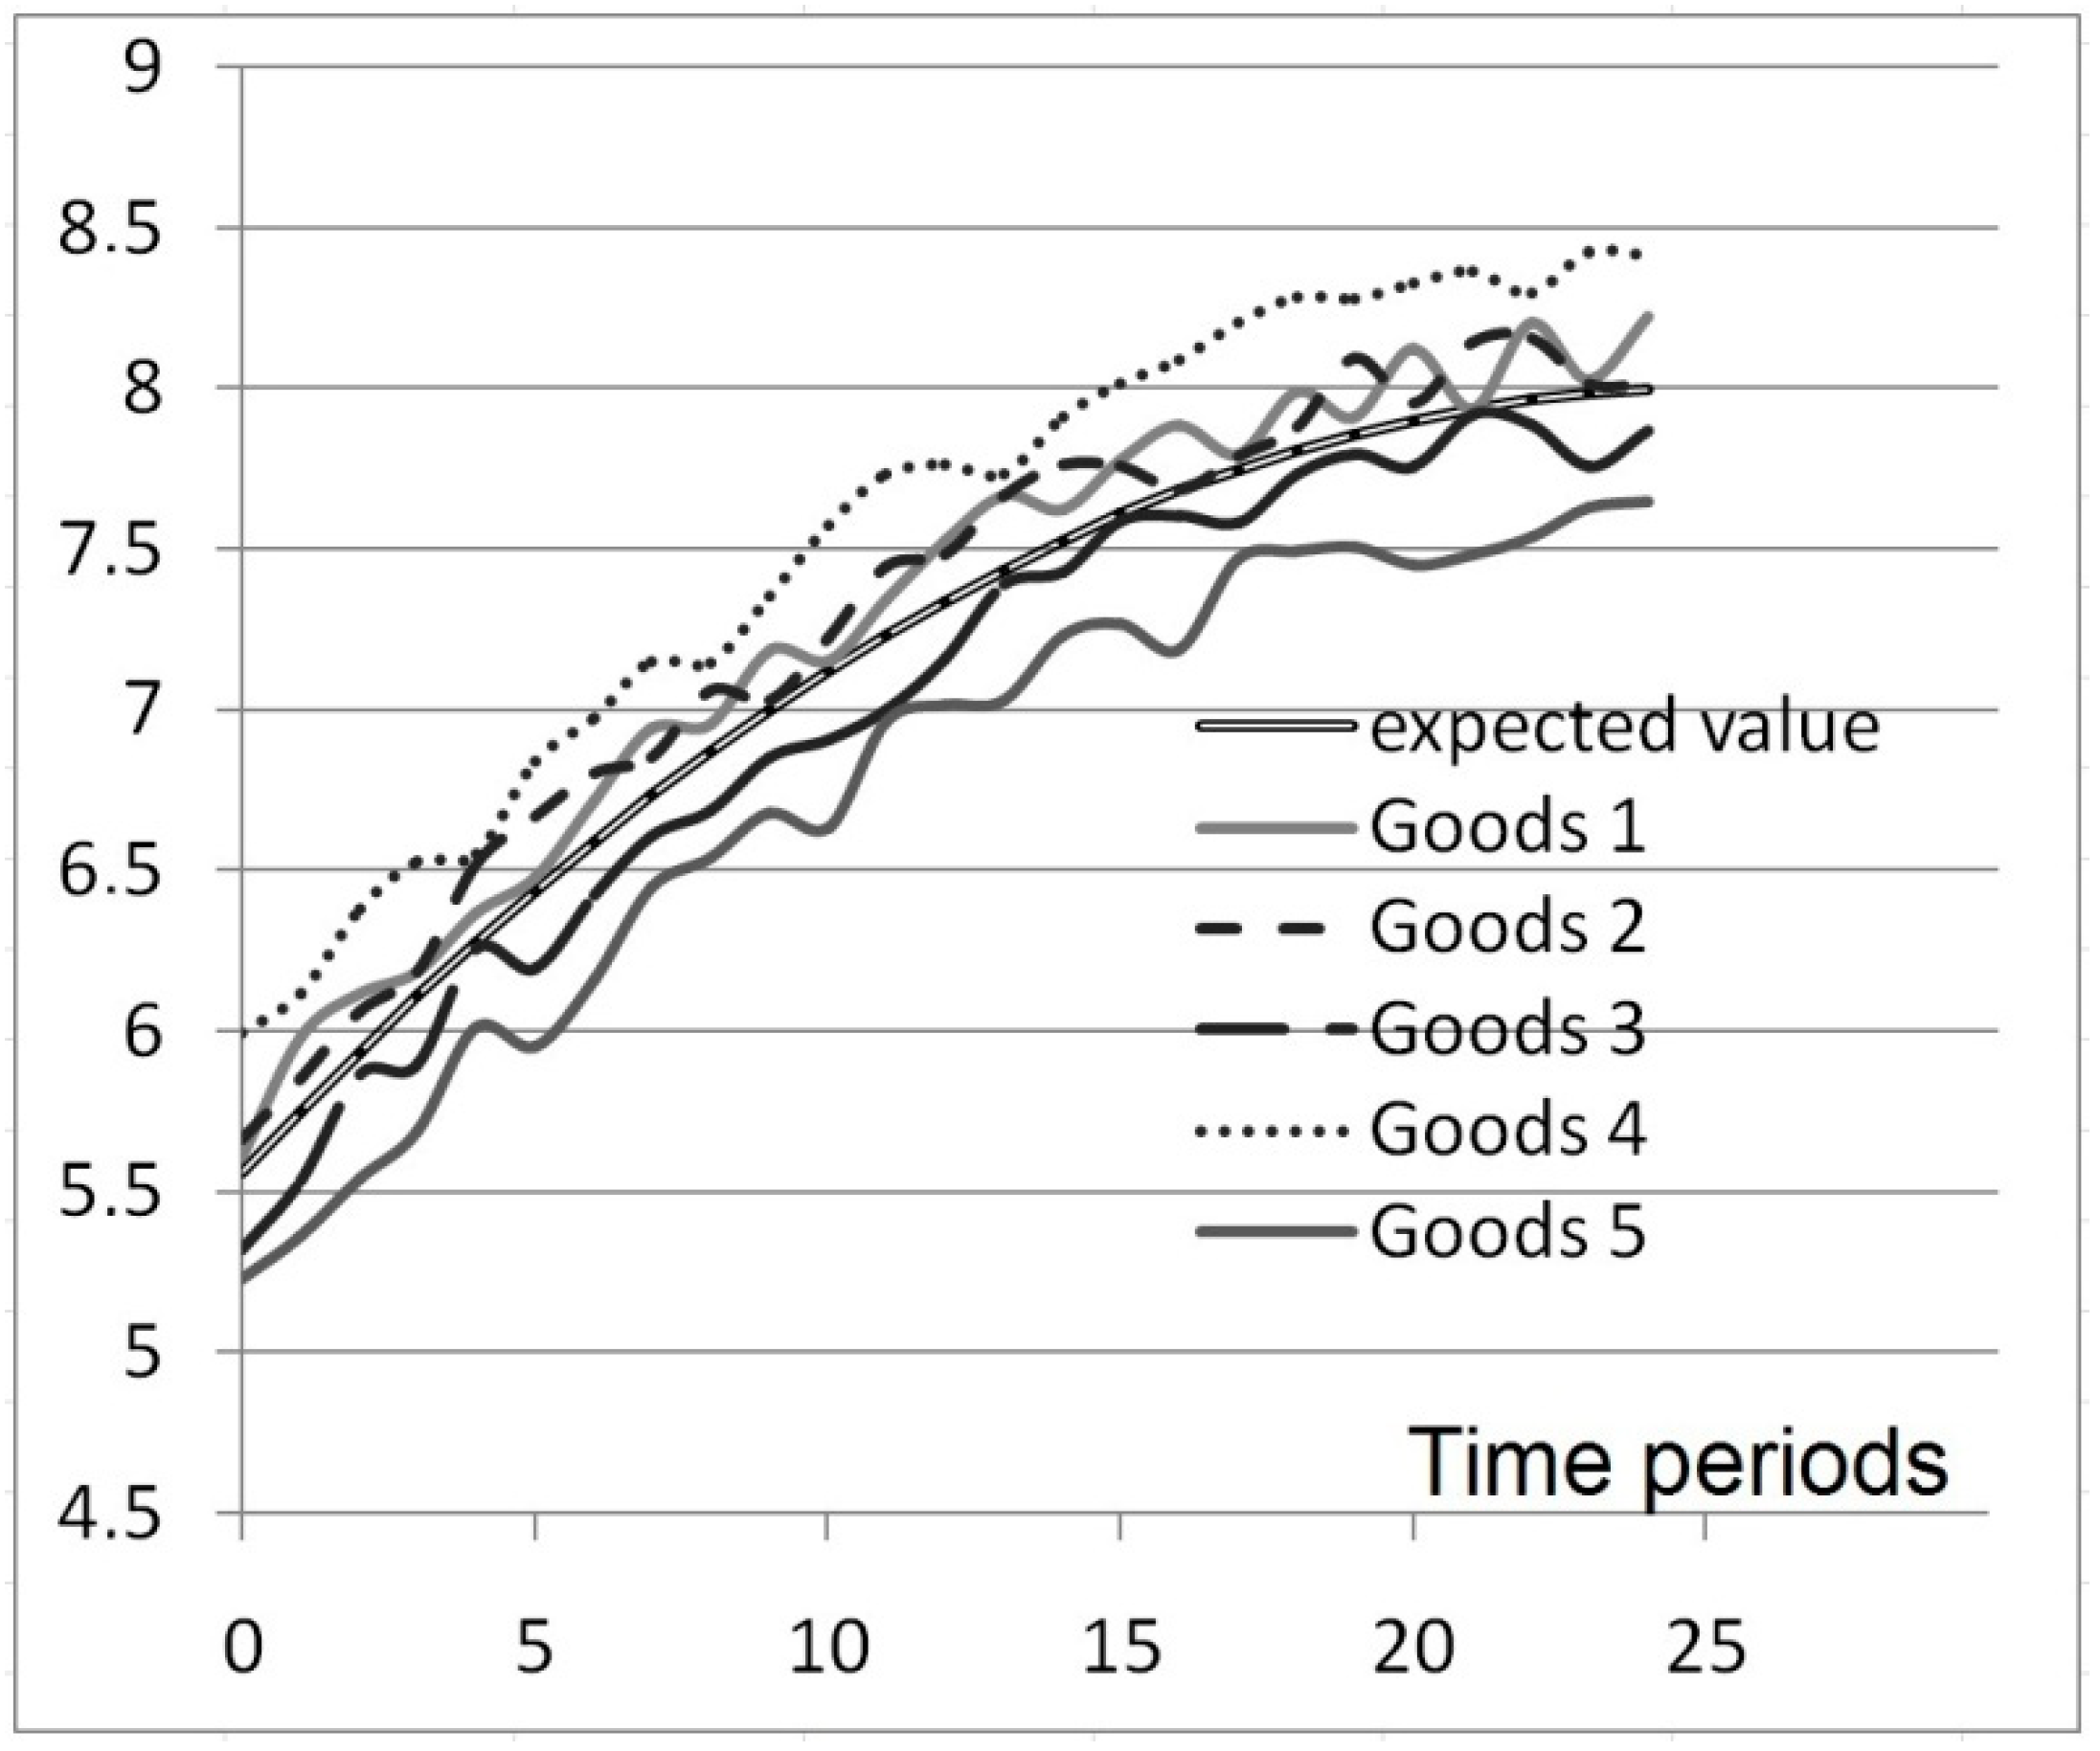
2.4. Mathematical Modeling of Goods and Cargo Flows

Since in the modern organization of the processes of moving goods and cargo at each stage there is a digital footprint, it becomes possible to apply optimization algorithms for the control programs of logistics servers. To describe flows in DC nodes, we use stochastic modeling methods. We introduce the following notation—the range of incoming cargo is equal to n. Flows are described by the law of distribution with probability density λ i , where i = 1 , 2 , , n . Then the distribution density is g ( n ) ( t ) amounts to n threads by time t entrances T 1 , T 2 , , calculated using the formula
g ( n ) ( t ) = ( 1 ) n 1 i = 1 n λ i j = 1 n e λ j t k = 1 k i n ( λ j λ k ) ,   for   ( t   >   0 ) .
Accordingly, we calculate the distribution function as:
G ( n ) ( t ) = 0 t g ( n ) ( t ) = ( 1 ) n 1 i = 1 n λ i j = 1 n 1 e λ j t λ j k = 1 k i n ( λ j λ k ) ,   for   ( t   >   0 ) .
For modeling, we use the characteristics of the Erlang n-th order T ( n ) :
M [ T ( n ) ] = M [ i = 1 n T i ] = i = 1 n 1 λ i ,
D [ T ( n ) ] = D [ i = 1 n T i ] = i = 1 n 1 λ i 2
Since we are interested in DC operation in cross-docking and pick-by-line modes, these characteristics are not enough. If we present the flow plot for these modes on the graph (Figure 1), it is clear that with the same mathematical expectation and variance, the nature of the processes is very different.
For a formalized mathematical description of the processes of movement of goods, it is necessary to additionally know the correlation functions K ( t , t ) . The reason for this is that the pick-by-line technology is more complex. On the one hand, pick-by-line technology provides a significant competitive advantage but requires coordination between the logistics operator, supplier and consumer. First of all, this technology is used in the network retail segment. It is the introduction of digital inter-machine interaction technologies that will allow you to realize all the main advantages of this technology, such as minimal processing time, the speed of receipt of already formed batches from various suppliers to the end user and minimizing SW storage. This factor is also important in connection with the trend to spread the demand for food products without preservatives and harmful additives, which provides for a minimum shelf life.
To a large extent, the distribution centers of 3PL operators also use standard cross-docking (Figure 2). Its technology is much simpler and takes less time but does not have the flexibility of pick-by-line, since cargo spaces are not processed but pass through the entire Joint use of these technologies in the logistics outsourcing operator node is due to both the volume of consumption and the capacity of the transport pool.
To calculate the correlation function, it is necessary to mathematically describe the entire cycle of cargo movement on the DC. Since the process of loading from suppliers and shipping to consumers throughout the assortment matrix is constantly taking place, we use the pseudo-state method to model the dynamics of DC operation. To do this we introduce the time TU that characterizes the process being in a subset U of states U = { s 0 , s 1 , , s n 1 } , where s 0 the state is at t = 0.
It follows immediately that T U = i = 0 n 1 T i and the law of magnitude distribution T u have the form f u = i = 0 n 1 γ i λ i e λ i t ( t > 0 ) , for γ i = k = 0 k i n 1 ( λ k λ i ) provided that i = 0 n 1 γ i = 1 . To be able to predict the DC activity over the extended planning horizon of the logistics operator, we will find the characteristics of the stationary mode of operation. Let us take the notation r m , equal numerically to the probability of finding the system S in a pseudo state U m in stationary mode of operation:
r m = P { S U m } m = 0 , 1 , 2 , . Then we have from the expression:
r m = p m + i = 1 k p m ( i ) = p m + i = 1 k λ 0 λ i p m = p m i = 0 k λ 0 λ i , having accepted that a = i = 0 k λ 0 λ i > 0 , can be found for m = 0 , 1 , 2 , the limit values of probabilities p m . To do this, we write a system of equations for s 0 , s 0 ( k ) , s 1 , s 1 ( k ) , , s m , s m ( k ) , as the following:
λ 0 p 0 = μ p 1 , ( λ 0 + μ ) p 1 = λ k p 0 ( k ) + 2 μ p 2 , ………………… ( λ 0 + m μ ) p m = λ k p m 1 ( k ) + ( m + 1 ) μ p m + 1 , m = 2 , 3 , .
But since the assortment matrix is limited, the last equation will be n μ p n = λ 0 p n 1 and finally we have the expressions: r m = P ( m , α ) R ( n , α ) + P ( n , α ) 1 α α , r n = α 1 P ( n , α ) R ( n , α ) + P ( n , α ) 1 α α , where is the designation accepted: P ( m , α ) = α m m ! e α .
Then it is already possible to find the correlation function K ( t , t ) . K x ( t , t ) = M [ X ( t ) X ( t ) ] m x ( t ) m x ( t ) ; M [ X ( t ) X ( t ) ] = i = 0 i p i ( t ) m x | i ( t , t ) .

3. Results

The proposed approach was implemented for analyzing the case of Huawei Technologies Co., Ltd., legally registered in 1987 in China and headquartered in Shenzhen, Guangdong. Huawei Technologies Co., Ltd. is a private company specializing in communication technologies, which develops and sells telecommunications equipment. Huawei products include Switching networks, wireless and wired fixed access networks, data transmission networks and wireless terminal products in communications networks, hardware, software and Services for telecommunications operators and professional network owners worldwide.
In 2016 the National Federation of Industries and Commerce published the list of Top 500 Chinese Private Enterprises that had a total annual revenue of 395.09 billion yuan. In the first quarter of 2017, Huawei surpassed Cisco in the main router market. By the end of 2017, Huawei was granted 74,307 patent licenses. There are more than 90% patents of invention. According to the Fortune Global 500 Huawei earned USD 78,511 million revenues taking 83rd place in the global ranking as of the year 2017 [43]. In 2018 Huawei was ranked first in 32nd China list of leading companies in the field of electronic information. In 2019 Huawei released the most powerful 5G chip in the Balong5000 passband.
Huawei is the world’s leading infrastructure provider of Information and Communication Technologies and intelligent terminal systems. The company seeks to bring digital technology to every person, family and enterprise and aims to build an intellectual world of Internet. The company provides competitive, safe and reliable products, solutions and services in areas such as communications, information technology, intelligent terminals and cloud services. Huawei also starts cooperating with environment partners to constantly create value for customers, unlock their potential, enrich people’s lives and drive organizational innovations. Huawei insists on constant innovations for customer satisfaction, increasing investment in fundamental research and global progress accumulation.

3.1. Experience-Oriented Solutions. Huawei History

Huawei is committed to using technology and management experience in order to help countries at different levels of development accelerate the global digital economy, enrich people’s lives, increase productive efficiency and national competitiveness. Huawei is focused on annually investing 10% of sales revenue in research and development and promoting innovations in such basic technologies as 5G, cloud computing, artificial intelligence and Internet of things. The company aims for better and more competitive dominant technologies. Huawei produces products and solutions for cloud, network and ultimate information platform that are necessary for digital economy development in different countries. Huawei works with national communication operators, corporate customers and partners through skills development, local capacity building and research and development (R&D) planning. These measures actively catalyze side effects of digital technologies, promote local IT ecosystems, support innovations and facilitate inclusive growth and sustainable development.

3.2. Huawei Business Status

Huawei constantly introduces new products and its operating capability is developing rapidly. The company’s financial overview for 5 years is shown in (Table 1).

3.3. Huawei Perspective, Mission and Strategy

As a result of rapid changes in new technologies and emerging industries (ultrawide-band, cloud computing, big data, Internet of things, artificial intelligence), IT technologies promote outworld and digital world deep integration. Huawei plans to become part of a new era of intelligence with 40 billion terminal systems activating 100 billion connections and producing 180 billion terabytes of data. This project is highly potential and you can see its results right now. Huawei is determined to contribute to human development, initiate and promote smart world.
With the advent of digital technology breakthroughs, Huawei offers better-quality products and services and introduces digital world to daily life. With a focus on IT infrastructure and intelligent terminal systems, the company allows growth of content, applications and clouds that forms customers common platform. The company intends to provide customers with digital services and satisfy demands with technology innovations.
The company’s strategy is to focus on IT infrastructure and intellectual terminals to promote a digital transformation.

3.4. Company Management System

The issue of development of the Huawei management system could arise taking into account open innovation dynamics associated with the implementation of innovative models as well as open innovation engineering models [9] regarding the growing information flows regarding the digitalization and an impact of digital technologies on the business models. The digitalization of the economy could be considered as changing business models and service delivery means and structure, increasing availability of goods and services, raising awareness of participants, increasing safety of business transactions, expanding sales markets and target audiences, reducing the cost of promoting goods and services and transaction costs and so forth [44]. Digital transport corridors are considered by experts as a system for collecting, processing and consolidating information about vehicles, goods and accompanying documents at all stages of transportation, technological operations. The format of the digital transport corridor could be treated as an information system assuming work without territorial restrictions [45]. So, the special features of the digital ecosystems should be noted including the collaboration of the participants of such ecosystems [46] allowing implementation of open innovations with mathematical modeling of logistics processes in dynamics [47].
The innovation approach on the basis of the digital technologies allowed Huawei company to create a global management system to ensure the inheritance of corporate culture and increase effectiveness of business management in order to achieve the following objectives:
  • constant innovations, consumer-oriented and based on their needs and technological leadership, for creation of sure-fire ecosystem;
  • risk control for business continuity;
  • maintaining corporate social responsibility and achieving sustainable social development.
The company quality goal is to make Huawei associated with high quality in the IT field. It released a resolution on integrated development and implementation of total quality management ISO 9000. It clarifies that total quality is based on the ISO 9000 standards. Quality management has to include products, engineering and all other aspects of a company. It also has to focus on the customers’ needs and use strategy to manage the quality of the whole process and value chain. The “quality first” strategy is necessary to implement. Company has to constantly to increase the competitiveness of quality and serious risks. Quality standards are integrated in work process to improve its quality.
Huawei introduces requirements for the management system as part of corporate operations and permanently consolidates consumer-oriented management system, based on value creation, in order to support and improve business development. The company made the complex process system with operational and support processes, based on the best world experience [48,49,50,51,52,53].
The company implemented requirements for all field of business, such as regulation, quality, internal control, cyber security, data security, business continuity, environment, workplace hygiene, occupational safety, corporate social responsibility, sustainable development, market integration, research and development, delivery and service, supply chain, purchasing, manufacture and so forth. Corporate personnel are interested in achieving high quality and contribute to constant improvement of various business systems, due to leadership development, Six Sigma and QCC (quality control charts for continuous, attribute and count data) projects, Huawei quality awards, assessment of the internal and external audit and quality culture building [54].

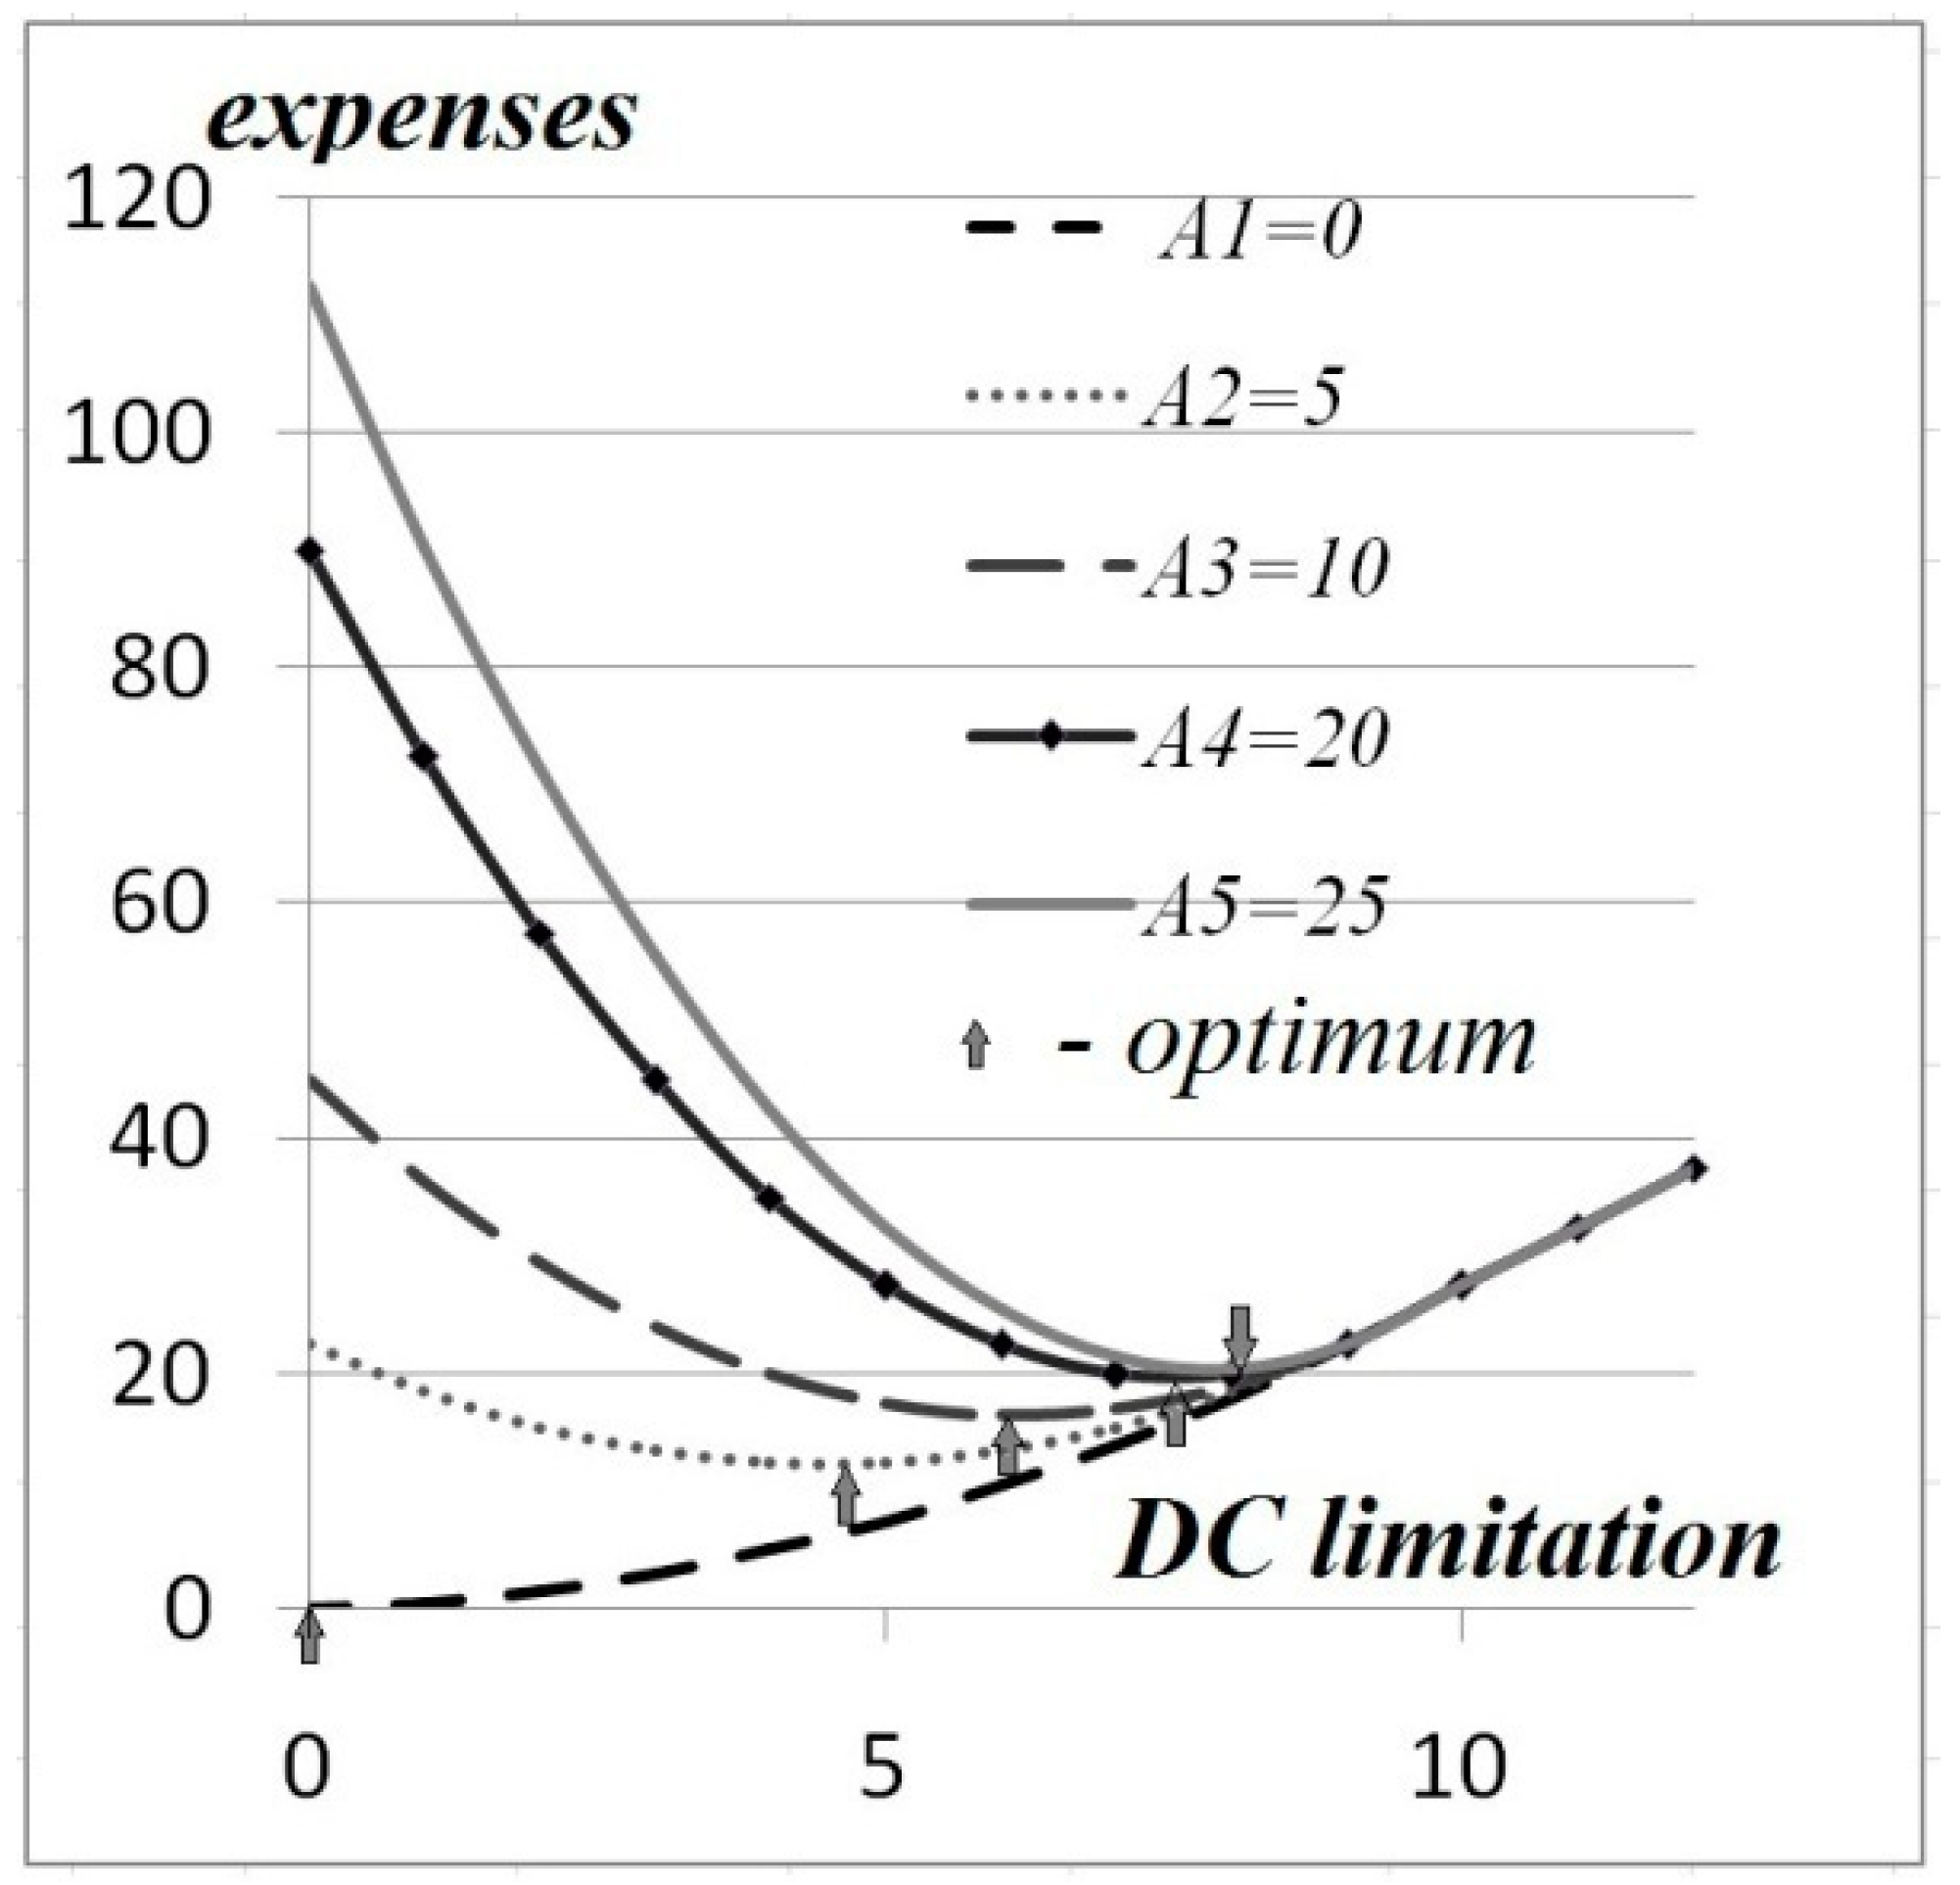
3.5. Mathematical Model of DC Operation

Volume of stocks i-th the product on DC is denoted as r i , i = 1 , 2 , , n ; demand volume distribution function the product z i is marked as p i ( z i ) . The cost of maintaining and processing i-th units both are equal to C i ; costs due to factors such as demurrage and detention or contractual penalties for non-delivery or late delivery are indicated as A i . The overall costs Φ ( R ) , where R = r i can be calculated from the expression:
Φ ( R ) = i = 1 n Φ ( r i ) ,   where
Φ ( r i ) = { 0 r i C i ( r i z i ) p i ( z i ) d z i + r i A i ( z i r i ) p i ( z i ) d z i r i 0 0 A i ( z i r i ) p i ( z i ) d z i r i < 0 .
Since the volume of demand for various items in the assortment matrix is usually seasonally dependent with the period T Σ , then to determine the mathematical expectation of the demand value X ( t ) , it is convenient to apply the Fourier decomposition in the following form:
M [ X ( t ) ] = M 0 + k = 1 μ k cos ( k ω t ) + ν k sin ( k ω t )
by ω = 2 π / T Σ , where M 0 , μ k , ν k - are the coefficients of the decomposition. To solve the problem of modeling DC activity, you can use a set of solutions to equations that are integrable in quadratures.

3.6. Calculation Example

Let us consider the problem of determining an economically optimal distribution center on the example of a bounded dimension. The efficiency criterion is cost minimization. It is clear that it is necessary to find a balance between the volume of storage capacity and the risk of possible losses due to the presence of penalties A i . First we will find the law of distribution of random variables of supply volumes X 1 , X 2 , X 3 provided that they are independent and each distributed evenly: f i ( x i ) = 1 / ( 2 a ) by x i ( a , a ) , i = 1 , 2 , 3 . The choice of the dimension of the range n = 3 will not affect the calculation order, since the formulas are recurrent. Let us introduce the designation Y = X 1 + X 2 + X 3 . Firstly, we define the distribution law of the composition Y 1 , 2 = X 1 + X 2 in:
g 1 , 2 ( y ) = f 1 ( y x 2 ) f 2 ( x 2 ) d x 2 = { 0      | y | > 2 a 2 a | y | 4 a 2    | y | 2 a .
Next, we get the distribution for Y = Y 1 , 2 + X 3 using the Simpson formula:
g ( y ) = g 1 , 2 ( y x 3 ) f 3 ( x 3 ) d x 3 = { 0     | y | > 3 a ( 3 a | y | ) 2 16 a 3    a < | y | 3 a 3 a 2 y 2 8 a 3    | y | a .
In this way, the necessary parameters can be obtained for modeling the distribution function for any dimension of the assortment matrix. The correctness of the mathematical model is determined by the set of formalisms adopted during its formation. In the presented work, we tried to take into account the most significant factors. The demand distribution function reflects the impact of demand volatility, inventory costs reflect operating costs, procurement costs depend on logistics capabilities, the maximum warehouse volume determines capital costs, penalties are a formalized description of important points of contractual obligations and reflect the work in a competitive environment. Validation of a mathematical model implies calculations based on specific data. Since a review of the literature showed that such or similar mathematical models were not used in the design and construction of distribution centers, there is every reason to believe that in reality there is a significant reserve for increasing their economic performance. This requires the collection of data on the market situation and business parameters. In the proposed work, a calculation is carried out using a mathematical model based on typical economic indicators and probabilistic characteristics of changes in market demand.

3.7. Practical Calculation on a Computer Using Mathematical Modeling

We will program the above method assuming the random nature of receipt and shipment of goods to DC. For simplicity, we use relative units of measurement, which will expand the scope of the results.
The values of the optimal volumes of emergent reserves that determine the size of DC storage are marked on the graph (Figure 3). Shown here is a set of calculation results carried out for various conditions of the influence of market uncertainty on the total expenses associated with maintaining the required level of reserves at the distribution center. On the graphs, DC parameters are marked that correspond to the minimum probable costs, which allows the use of calculation algorithms for the design and construction of logistics network nodes. As expected, the degenerate case of no costs for overdue or missing goods at the time of fulfillment of obligations is reflected in zero inventories. In all other cases, the minimum is achieved if a balance is maintained between the volume of work or the cost of maintenance and the likely losses due to partial dissatisfaction with shipment requests. In addition, the results also clearly show that as the relative share of penalty costs increases, the volume of emergent stock increases (Table 2).

4. Discussion

4.1. Discussion: A logistics Hub Using the Digital Footprint Method

Discussing which research gap was present and which research gap was partially or fully closed by the findings in this article, the authors assume the following consideration. In general, the presented mathematical model is intended for use as a decision-making block in the Warehouse Management System (WMS) software. From the point of view of mathematical formalisms, such nodes of a commercial network as distribution centers or local SW of commercial enterprises differ only in the dimension of equations. If we consider such transport hubs as seaports that accept responsible storage, are engaged in the formation of commodity batches and other stevedoring competencies, then this approach also describes their activities using similar algorithms and allows optimization.
The authors suggest a formalized representation of the movement of goods and cargo taking into account real market conditions, including both uncertainty factors and the stochastic nature of the volumes and directions of flows. Stochastic modeling methods from the theory of random processes are used for the description. To develop optimal solutions, the criterion of minimizing total costs is applied. The choice of performance indicators is based on the balance of logistics and storage costs, demurrage and detention with the maximum profit from logistics activities. Calculations are performed using numerical methods of the mathematical theory of optimal processes computer simulation.
The research considers an economically optimal management of the flows of goods and cargo based on digital information about their movement. Since modern production and digital technologies implemented everywhere will allow to supply all cargo with machine-readable markings not only in the form of QR (Quick Response) or barcode but also with RFID (Radio Frequency Identification) tags, this provides a resource for specifying additional information about cargo properties, storage and transportation conditions, as well as expire date.

4.2. Discussion: Open Innovation Engineering from the Digital Footprint Method

The Open innovation concept could be considered from the point of view of the digital footprint method. The article [47] proves the logic of the connection between open innovation concept and logistics processes being developed on the basis of digital technologies which involve the digital footprint method. The set of mathematical relations allows us to simulate the operation of a network distribution center as a node element of a logistics system. The authors offer to discuss the main idea of the contribution of the emerging literature on open innovation by deepening our understanding of the motivations for an exchange of knowledge among different firms. The following issues could be discussed:
-
Open innovation engineering: Preliminary study on new entrance of technology to market;
-
Open R&D and open innovation: exploring the phenomenon;
-
Open innovation and serial entrepreneurs;
-
The fit between firms’ open innovation and business model for new product development speed: a contingency perspective;
-
Bringing open innovation to services;
-
Open innovation in value networks.
Regarding the findings in the article with some other contributions, the authors could prove that the innovation process on the basis of the digital technologies in logistics refers to the general topic of product innovation (and the corresponding process of pioneer market shaping [55]) in the literature on open innovation. The research could be treated from the point of view of the service-dominant product in the form of a software. Generally, the topic of digital transport corridors seems to be a “hot topic” on the agenda of economists and business scholars alike, yet, a lot needs to be done since there are significant research gaps on the agenda. Undoubtedly, the implementation of innovative activities is associated with the implementation of innovative models. So, the discussion should be based on the fundamental theory being developed by JinHyo Joseph Yun who suggested the open innovation engineering model including both open-innovation engineering channels and determining ways of operating the channels through conceptual experiments [9]. The effects of the mechanism design (fundamental to the study of incentives and information [10]) are expanded and implemented for developing new business model from open innovation and Schumpeterian new combinations [11,12] as well as open innovation based business model design compass [13]. The authors take into account the Christensen’s determinants of open innovation model associated with the industrial dynamics of an industry segment undergoing a process of radical technological innovation [14] unraveling the Chesbrough’s Open Innovation concept which was initially studied by from the company-level perspective (in contrary to the closed innovation old model).
The work [56] studies the boundary conditions that determine whether open or closed types of innovation management will actually lead to the highest value for a given firm. The mentioned determinants could be considered as various internal and external constraints (situational factors) from a point of view a contingency perspective. Undoubtedly, it is important to analyze what open innovations’ properties can compensate for the possible negative effect appearing from sharing knowledge with other firms because of going to reduce the potential rarity of the eventual inventions. In this regard the researchers should pay attention to the business model innovation aiming to succeed a competitive advantage on the basis of the sufficiently differentiated business model being hard to replicate for incumbents and new entrants alike [57]. We could agree that Business concept innovation is a central pillar in business model innovation [58].
Open innovation in value networks could be studied by analyzing three main issues [59]:
(a)
how central firms choose between different governance modes when they establish relations with partners;
(b)
studying value constellations being a nexus for the integration of different theoretical perspectives since they are a nexus where value creation, non-arm’s-length transactions, external resource sourcing and inter-organizational networking are welded together;
(c)
analyzing Open Innovation at different levels and that interorganizational networks.
Reference [60] explores the network perspective for both the consideration of business models in action and such main features of business models as value creation and firm networking activities for different firms, small entrepreneurial firms and large companies.
The next steps for improving the results in consideration of future research could be creating software products for control computers in combination with the above-mentioned information about the object parameters with the purpose of developing the detailed mathematical model, the arguments for which are refined using real data. This method is also promising for higher levels of logistics, such as 4PL, 5PL. In these concepts, the logistics service provider is involved in business processes, as well as significantly expands the range of services but the physical interaction with cargo flows and their nature, mathematical description remains completely the same.

5. Conclusions

With the active use of digital technologies in the nodes of logistics networks starting 5–7 years ago, their implementation was carried out on the principle of replacing the people of operators on information flows. There was no scientific approach to optimization of both distribution centers’ operating modes and their sizes. This work provides a mathematical description for the following purposes:
-
Formalize the characteristics of the stochastic flow of goods and cargo through the logistics hub.
-
Assess the parameters of the two main cross-docking and pick-by-line technologies in cargo handling.
The results obtained in the form of a mathematical description are the basis for the predictive determination of the seasonal change in the parameters of the load distribution functions of the nodes of the logistics network and will make it possible to calculate, with the above characteristics of flows, the volume of the distribution center that is optimal from the point of view of minimum costs, taking into account the main economic factors.

5.1. Advantages of the Enterprise

Leading research and development provide Huawei with many advantages. Being one of the best Chinese companies, Huawei can win customers favor and rely on its own technologies. Huawei created 16 research and development centers in Germany, Sweden, India, Russia, Japan, Canada, Turkey, China and so forth. About 70,000 staff members are working on research and development and it is 45% of total number of staff.
By the end of 2017, the company had 74,307 patents, that included 44,168 Chinese, 18,791 foreign and 14,555 international patent applications for PCT. Mastering technologies provides success to the company.
Huawei 4G equipment is common throughout the world in the field of telecommunications and is used in more than 140 countries.
Over the years, network requirements have become very demanding. In 2009, Huawei started the research on related technologies and showcased 5G base station demo to the outside world. In 2019 Huawei released the most powerful 5G chip in the Balong5000 passband and the fastest CPE to support smart-home appliances. With the constant research and development, Huawei released production batch of mobile phones with the folding screen and 5G base stations. Huawei aims for better quality of high technologies and development of competitive solutions, in order to help customers gain commerce success. Huawei released complex 5G solutions, wireless network, data transmission and terminal systems (CPE). It also made commerce products with operators and main manufacturers of terminal chips to finish IODT (Internet of Drone Things) testing and help operators implement 5G in the main cities worldwide.
Corporate business of Huawei is intended to digitize every organization, government and community facilities, finances, power industry, transport, manufacture and other fields all around the world. Huawei is focused on IT infrastructure and uses its technological advantages in the field of cloud computing, big data, Internet of things, artificial intelligence and so forth to provide customers with an open, adaptable and safe cloud of final channels. It promotes digital transformation. Huawei collaborates with environment partners intentionally and maximizes the number of IT platforms, global market platforms, educational and service platforms. The company also promotes industrial standards and decrease digital transformation expenses. Huawei concentrates on integration, innovations for customers and partners and cloud IT system.
At the present time, 197 companies from Fortune 500 and 45 companies from Fortune 100 (such as ICBC, CCB, Deutsche Bahn, Mercedes-Benz and Volkswagen) decided to collaborate with Huawei in the field of digital transformation. Due to the fast development of high quality products and foreign elite market, annual sales revenue came up 70% and the market share headed the top 3 world list.
Huawei business is focused on consumers and pays special attention to improve customer experience throughout the entire life cycle of its products. The company makes active researches on innovative development model of intelligent terminal systems and constantly has success in producing high world class brands.

5.2. Disadvantages of the Enterprise

Huawei’s main disadvantage is the company’s risks while entering target market, owing to policy instability and local conditions on international market. Over the last 20 years, Huawei personnel have been affected due to difficulties at the target market environment. Huawei is an enterprise in developing country, highly influenced by international market in the field of low-budget products and it has an impact on the reputation. Product quality and corporate brand are underestimated. The lack of international market experience and high education expenses also have a negative impact on the company.
Recently, the USA introduced sanctions against Huawei due to economic and market disagreements between the USA and China. Huawei used to implement ARM (Advanced RISC Machine) chips in their products and now ARM ended that partnership. Such changes had a large impact on Huawei mobile phones, computers and other electronic devices. Another major fact is that in 2019 the USA banned Huawei in general and now Huawei financial risks are gradually increasing.

5.3. Model Implementation

The study of the distribution center should be carried out in conjunction with the economic calculation of the results of its activities for a long-time horizon. To do this, we will define a set of factors that affect its indicators and use them as arguments for a formalized description of the dynamics of DC operation.
Successful implementation of digital technologies in logistics depends on the quality of algorithms for managing servers. Online cargo tracking based on digital shadow allows you to not only control the entire forwarding cycle but also forecast it. The complex of information about the shipment from the manufacturer, M2M navigation in the process of moving product flows is supplemented with data on market demand. It is used to calculate the optimal economic activity of 3PL outsourcing. The proposed algorithms are universal and, importantly, scalable and invariant to operating platforms.
The presented mathematical model is intended for use as a decision-making block in the Warehouse Management System of software. Since the uncertainty factor is taken into account when developing algorithms, it is possible to apply the results obtained in risk management applications. In practice, this digital concept will significantly increase the speed of delivery, the cost-effectiveness of logistics activities and provide 3PL operators with additional competitive advantages.

Author Contributions

All authors have contributed substantially to the entire work reported. Conceptualization, A.S., S.B. and S.S.; methodology, S.B., S.S. and A.T.; writing—drafting, A.S.; writing—inputs, all authors; writing—reviewing and editing, all authors. All authors have read and agreed to the published version of the manuscript.

Funding

The study was supported by the Academic Excellence Project 5-100 proposed by Peter the Great St. Petersburg Polytechnic University.

Data Availability Statement

Data available in a publicly accessible repository.

Acknowledgments

The authors would like to thank the anonymous referees for their very useful suggestions.

Conflicts of Interest

The authors declare no conflict of interest.

References

  1. Provotorov, V.V.; Sergeev, S.M.; Part, A.A. Solvability of hyperbolic systems with distributed parameters on the graph in the weak formulation. Vestn. St. Peterbg. Univ. Prikl. Mat. Inform. Protsessy Upr. 2019, 15, 107–117. [Google Scholar] [CrossRef] [Green Version]
  2. de Palma, A.; Picard, N.; de Lapparent, M. Risk and Uncertainty in Urban and Transport Economics. Math. Popul. Stud. 2015, 22, 1–3. [Google Scholar] [CrossRef]
  3. Borisoglebskaya, L.N.; Provotorov, V.V.; Sergeev, S.M.; Kosinov, E.S. Mathematical aspects of optimal control of transference processes in spatial networks. IOP Conf. Ser. Mater. Sci. Eng. 2019, 537, 042025. [Google Scholar] [CrossRef]
  4. Lukashevich, N.; Svirina, A.; Garanin, D. Multilevel prognosis of logistics chains in case of uncertainty: Information and statistical technologies implementation. J. Open Innov. Technol. Mark. Complex. 2018, 4, 2. [Google Scholar] [CrossRef] [Green Version]
  5. Ali, M.; Miller, L. ERP system implementation in large enterprises—A systematic literature review. J. Enterp. Inf. Manag. 2017, 30, 666–692. [Google Scholar] [CrossRef]
  6. Krasnov, S.; Sergeev, S.; Titov, A.; Zotova, Y. Modelling of digital communication surfaces for products and services promotion. IOP Conf. Ser. Mater. Sci. Eng. 2019, 497, 012032. [Google Scholar] [CrossRef]
  7. Faber, N.; De Koster, R.B.M.; Smidts, A. Survival of the fittest: The impact of fit between warehouse management structure and warehouse context on warehouse performance. Int. J. Prod. Res. 2018, 56, 120–139. [Google Scholar] [CrossRef]
  8. Borisoglebskaya, L.N.; Provotorova, E.N.; Sergeev, S.M.; Khudyakov, A.P. Automated storage and retrieval system for Industry 4.0 concept. IOP Conf. Ser. Mater. Sci. Eng. 2019, 537, 032036. [Google Scholar] [CrossRef]
  9. Yun, J.J.; Kim, D.; Yan, M.R. Open innovation engineering—Preliminary study on new entrance of technology to market. Electronics 2020, 9, 791. [Google Scholar] [CrossRef]
  10. Vohra, R.V. Mechanism Design: A Linear Programming Approach; Cambridge University Press: Cambridge, UK, 2011; ISBN 9781107004368. [Google Scholar]
  11. Williams, K.C. The Handbook of Experimental Economics. Edited by John H. Kagel and Alvin E. Roth. Princeton: Princeton University Press, 1995. 721p. $55.00. Am. Political Sci. Rev. 1996, 90, 632–633. [Google Scholar] [CrossRef]
  12. Smith, V.L. Experimental Economics: Induced Value Theory. Pap. Exp. Econ. 2010, 100–105. [Google Scholar] [CrossRef]
  13. Yun, J.J. Introduction BT—Business Model Design Compass: Open Innovation Funnel to Schumpeterian New Combination Business Model Developing Circle; Yun, J.J., Ed.; Springer: Singapore, 2017; pp. 3–14. ISBN 978-981-10-4128-0. [Google Scholar]
  14. Christensen, J.F.; Olesen, M.H.; Kjær, J.S. The industrial dynamics of Open Innovation—Evidence from the transformation of consumer electronics. Res. Policy 2005, 34, 1533–1549. [Google Scholar] [CrossRef]
  15. Borisoglebskaya, L.N.; Provotorova, E.N.; Sergeev, S.M. Promotion based on digital interaction algorithm. IOP Conf. Ser. Mater. Sci. Eng. 2019, 537, 042032. [Google Scholar] [CrossRef]
  16. Maganha, I.; Silva, C.; Ferreira, L.M.D.F. The layout design in reconfigurable manufacturing systems: A literature review. Int. J. Adv. Manuf. Technol. 2019, 105, 683–700. [Google Scholar] [CrossRef]
  17. Sergeev, S.; Kirillova, T.; Krasyuk, I. Modelling of sustainable development of megacities under limited resources. E3S Web Conf. 2019, 91, 5007. [Google Scholar] [CrossRef]
  18. Baruffaldi, G.; Accorsi, R.; Manzini, R. Warehouse management system customization and information availability in 3pl companies. Ind. Manag. Data Syst. 2019, 119, 251–273. [Google Scholar] [CrossRef]
  19. Wang, G.; Gunasekaran, A.; Ngai, E.W.T. Distribution network design with big data: Model and analysis. Ann. Oper. Res. 2018, 270, 539–551. [Google Scholar] [CrossRef]
  20. Green, K.W.; Inman, R.A.; Sower, V.E.; Zelbst, P.J. Comprehensive supply chain management model. Supply Chain Manag. Int. J. 2019, 24, 590–603. [Google Scholar] [CrossRef]
  21. Alcaraz, J.L.G.; Macías, A.A.M.; Luevano, D.J.P.; Fernández, J.B.; López, A.D.J.G.; Macías, E.J. Main benefits obtained from a successful JIT implementation. Int. J. Adv. Manuf. Technol. 2016, 86, 2711–2722. [Google Scholar] [CrossRef]
  22. Krasnov, S.; Sergeev, S.; Zotova, E.; Grashchenko, N. Algorithm of optimal management for the efficient use of energy resources. E3S Web Conf. 2019, 110, 110. [Google Scholar] [CrossRef]
  23. Benrqya, Y. Costs and benefits of using cross-docking in the retail supply chain. Int. J. Retail Distrib. Manag. 2019, 47, 412–432. [Google Scholar] [CrossRef]
  24. Krasnov, S.; Zotova, E.; Sergeev, S.; Krasnov, A.; Draganov, M. Stochastic algorithms in multimodal 3PL segment for the digital environment. IOP Conf. Ser. Mater. Sci. Eng. 2019, 618, 012069. [Google Scholar] [CrossRef]
  25. Rybakov, D.S. Total cost optimisation model for logistics systems of trading companies. Int. J. Logist. Syst. Manag. 2017, 27, 318. [Google Scholar] [CrossRef]
  26. Shcherbakov, V.V.; Silkina, G.Y. Information Toolkit for Digital Transformation of Economy and Management. Econ. Entrep. 2017, 5–1, 1090–1096. [Google Scholar]
  27. Silkina, G.Y. ICT Markets: Innovative Activity and Susceptibility to Innovation. Econ. Entrep. 2016, 7, 55–61. [Google Scholar]
  28. Chen, H.; Dong, Z.; Li, G.; Zhao, H. Joint Advertisement and Trade-In Marketing Strategy in Closed-Loop Supply Chain. Sustainability 2020, 12, 2188. [Google Scholar] [CrossRef] [Green Version]
  29. Silkina, G. From analogue to digital tools of business control: Succession and transformation. IOP Conf. Ser. Mater. Sci. Eng. 2019, 497, 012018. [Google Scholar] [CrossRef]
  30. Stein Dani, V.; Dal Sasso Freitas, C.M.; Thom, L.H. Ten years of visualization of business process models: A systematic literature review. Comput. Stand. Interfaces 2019, 66, 103347. [Google Scholar] [CrossRef]
  31. Geissdoerfer, M.; Morioka, S.N.; de Carvalho, M.M.; Evans, S. Business models and supply chains for the circular economy. J. Clean. Prod. 2018, 190, 712–721. [Google Scholar] [CrossRef]
  32. Shvetsova, O.A.; Rodionova, E.A.; Epstein, M.Z. Evaluation of investment projects under uncertainty: Multi-criteria approach using interval data. Entrep. Sustain. Issues 2018, 5, 914–928. [Google Scholar] [CrossRef]
  33. Schislyaeva, E.; Saychenko, O.; Barykin, S.; Kapustina, I. International Energy Strategies Projects of Magnetic Levitation Transport. In Advances in Intelligent Systems and Computing; Springer: Cham, Germany, 2019; Volume 983, pp. 313–320. ISBN 9783030198671. [Google Scholar]
  34. Ilin, I.; Kalinina, O.; Barykin, S. Financial logistics innovations in IT Project Management. Matec Web Conf. 2018, 193, 5062. [Google Scholar] [CrossRef]
  35. Vilken, V.; Kalinina, O.; Barykin, S.; Zotova, E. Logistic methodology of development of the regional digital economy. IOP Conf. Ser. Mater. Sci. Eng. 2019, 497, 12037. [Google Scholar] [CrossRef]
  36. Bril, A.; Kalinina, O.; Levina, A. Two-stage commercial evaluation of engineering systems production projects for high-rise buildings. E3S Web Conf. 2018, 33, 3004. [Google Scholar] [CrossRef] [Green Version]
  37. Bril, A.; Kalinina, O.; Valebnikova, O. Innovation Venture Financing Projects in Information Technology. In Internet of Things, Smart Spaces, and Next Generation Networks and Systems; Galinina, O., Balandin, S., Koucheryavy, Y., Eds.; Springer International Publishing: Cham, Switherlands, 2016; Volume 9870, pp. 766–775, ISBN 9783319463001; ISBN 9783319463018. [Google Scholar]
  38. Carayannis, E.G.; Campbell, D.F.J. “Mode 3” and “Quadruple Helix”: Toward a 21st century fractal innovation ecosystem. Int. J. Technol. Manag. 2009, 46, 201–234. [Google Scholar] [CrossRef] [Green Version]
  39. Etzkowitz, H.; Leydesdorff, L. The dynamics of innovation: From National Systems and “mode 2” to a Triple Helix of university-industry-government relations. Res. Policy 2000, 29, 109–123. [Google Scholar] [CrossRef]
  40. Leydesdorff, L. The Triple Helix, Quadruple Helix,..., and an N-Tuple of Helices: Explanatory Models for Analyzing the Knowledge-Based Economy? J. Knowl. Econ. 2012, 3, 25–35. [Google Scholar] [CrossRef] [Green Version]
  41. Carayannis, E.G.; Barth, T.D.; Campbell, D.F. The Quintuple Helix innovation model: Global warming as a challenge and driver for innovation. J. Innov. Entrep. 2012, 1, 2. [Google Scholar] [CrossRef] [Green Version]
  42. Park, H.W. Transition from the Triple Helix to N-Tuple Helices? An interview with Elias, G. Carayannis and David, F.J. Campbell. Scientometrics 2014, 99, 203–207. [Google Scholar] [CrossRef] [Green Version]
  43. Global 500. Available online: https://fortune.com/global500/2017/search/?hqcountry=China (accessed on 27 October 2013).
  44. Nikolaeva, I.G.; Rudakova, E.N.; Dmitrieva, O.A.; Vlasov, A.V.; Morkovkin, D.E. Digitalization of the EAEU Transport and Logistics Sector and Its Role in Improving the Euro-Asian Cargo Transportation. In Proceedings of the 4th International Conference on Culture, Education and Economic Development of Modern Society (ICCESE 2020), Moscow, Russia, 13–14 March 2020; Volume 416, pp. 1296–1302. [Google Scholar] [CrossRef]
  45. Koroleva, E.; Sokolov, S.; Filatova, E. Digitalization as a method of implementation EEU transit potential. E3S Web Conf. 2019, 138, 02003. [Google Scholar] [CrossRef]
  46. Barykin, S.Y.; Kapustina, I.V.; Kirillova, T.V.; Yadykin, V.K.; Konnikov, Y.A. Economics of Digital Ecosystems. J. Open Innov. Technol. Mark. Complex 2020, 6, 16. [Google Scholar] [CrossRef]
  47. Barykin, S.Y.; Kapustina, I.V.; Sergeev, S.M.; Yadykin, V.K. Algorithmic foundations of economic and mathematical modeling of network logistics processes. J. Open Innov. Technol. Mark. Complex. 2020, 6, 1–16. [Google Scholar] [CrossRef]
  48. Litvinenko, V.S. Digital Economy as a Factor in the Technological Development of the Mineral Sector. Nat. Resour. Res. 2020, 29, 1521–1541. [Google Scholar] [CrossRef]
  49. Agrawal, V.V.; Atasu, A.; Van Wassenhove, L.N. New opportunities for operations management research in sustainability. Manuf. Serv. Oper. Manag. 2019, 21, 1–12. [Google Scholar] [CrossRef]
  50. Ayaganova, M.; Pritvorova, T.; Mamrayeva, D.; Tashenova, L. Social entrepreneurship: Business models and strategies for their development. Econ. Ann. Xxi 2019, 178, 96–104. [Google Scholar] [CrossRef]
  51. Vynaryk, V.; Hanley, A. Effects of the QMS ISO 9000 Certification on Russian Manufacturing Companies. SSRN Electron. J. 2015. [Google Scholar] [CrossRef] [Green Version]
  52. ISO. The ISO Survey of Management System Standard Certifications—2012. Available online: https://www.iso.org/standard/54534.html (accessed on 27 October 2013).
  53. Snihur, Y.; Wiklund, J. Searching for innovation: Product, process, and business model innovations and search behavior in established firms. Long Range Plan. 2019, 52, 305–325. [Google Scholar] [CrossRef]
  54. Laureani, A.; Antony, J. Leadership and Lean Six Sigma: A systematic literature review. Total Qual. Manag. Bus. Excell. 2019, 30, 53–81. [Google Scholar] [CrossRef]
  55. Erkut, B. The emergence of the ERP software market between product innovation and market shaping. J. Open Innov. Technol. Mark. Complex. 2018, 4, 23. [Google Scholar] [CrossRef] [Green Version]
  56. Torkkeli, M.T.; Kock, C.J.; Salmi, P.A.S. The “open innovation” paradigm: A contingency perspective. J. Ind. Eng. Manag. 2009, 2, 176–207. [Google Scholar] [CrossRef]
  57. Teece, D.J. Business models, business strategy and innovation. Long Range Plan. 2010, 43, 172–194. [Google Scholar] [CrossRef]
  58. Souto, J.E. Business model innovation and business concept innovation as the context of incremental innovation and radical innovation. Tour. Manag. 2015, 51, 142–155. [Google Scholar] [CrossRef]
  59. Chesbrough, H.; Vanhaverbeke, W.; West, J. Chapter 13 Open Innovation in Value Networks. In Open Innovation: Researching a New Paradigm; Chesbrough, H., Vanhaverbeke, W., West, J., Eds.; Oxford University Press: Oxford, UK, 2006. [Google Scholar]
  60. Gay, B. Open innovation, networking, and business model dynamics: The two sides. J. Innov. Entrep. 2014, 3, 2. [Google Scholar] [CrossRef] [Green Version]
Figure 1. Workload of warehouse equipment when handling goods using pick-by-line technology.
Joitmc 07 00059 g001
Figure 2. Workload of warehouse equipment when handling cargo using cross-docking technology.
Joitmc 07 00059 g002
Figure 3. Dependence of expenses on the distribution center (DC) volume limit.
Joitmc 07 00059 g003
Table 1. Huawei financial overview for 5 years.
20142015201620172018
Sales revenue239,025288,197395,009521,574609,621
Operating revenue 239,025 288,197 395,009 47,515 5638
Operating margin 12.2% 11.9% 11.6% 9.1% 9.3%
Margin of profit 21,003 27,866 36,910 37,052 47,455
Operating cash flow 22,554 41,755 52,300 49,218 96,336
Financial resources and short-range investments 81,944 106,036 125,208 145,653 199,943
Operative expenses 75,180 78,566 89,019 116,231 137,576
Total assets 244,091 309,773 372,155 443,634 505,225
Total borrowings 23,033 28,108 28,986 44,799 39,925
Owned capital 86,266 99,985 119,069 140,133 175,616
Assets and liabilities 64.7% 67.7% 68.0% 68.4% 65.2%
Table 2. Results of the calculation on a computer.
PenaltyA1A2A3A4A5
Limitation on stocks held in DCr = 0027.555110137.5
r = 10.4223.346.292.1115.1
r = 21.22038.776.295.2
r = 32.517.5532.5162.5377.6
r = 44.1915.827.5150.8362.55
r = 56.2515.323.7541.2550.1
r = 68.7515.121.2933.7140.3
r = 711.6715.8320.2128.3332.50
r = 81517.520.725.327.51
r = 918.7520.121.223.725.4
r = 1022.9223.3323.7524.5825.02
r = 1127.5127.5127.5127.5127.51
r = 1232.5432.5432.5432.5432.54
min expenses014.218.621.122.3
Publisher’s Note: MDPI stays neutral with regard to jurisdictional claims in published maps and institutional affiliations.

