Article

Sustainable Condition of the Agricultural Sector’s Environmental, Economic, and Social Components from the Perspective of Open Innovation

1
Department of World Economy and Foreign Economic Activity, Ural State University of Economics, 620144 Yekaterinburg, Russia
2
All-Russian Research Institute of Fisheries and Oceanography, 107140 Moscow, Russia
3
Department of Life Safety, Ural Federal University Named after the First President of Russia B.N. Yeltsin, 620002 Yekaterinburg, Russia
4
Department of Taxes and Taxation, Belarus State Economic University, 220070 Minsk, Belarus
5
Department of Public Administration and Law, Moscow Polytechnical University, 107023 Moscow, Russia
6
Department of Public Finance, Financial University under the Government of the Russian Federation, 125993 Moscow, Russia
7
Department of Economics and Finance, North-Eastern Federal University, 677000 Yakutsk, Russia
*
Author to whom correspondence should be addressed.
J. Open Innov. Technol. Mark. Complex. 2021, 7(1), 74; https://0-doi-org.brum.beds.ac.uk/10.3390/joitmc7010074
Submission received: 22 December 2020 / Revised: 16 February 2021 / Accepted: 18 February 2021 / Published: 25 February 2021

Abstract

:
The aim of the study is to elaborate an econometric model to determine the conditions for ensuring the balanced development of environmental, economic, and social components of the Russian agricultural sector within the Eastern European region. The method of fuzzy sets was used to build an integral model for assessing the level of sustainable development of the agricultural sector in Eastern Europe on the basis of economic, environmental, and social sustainability indicators. The control indicators (independent variables) and integral economic, environmental, social sustainability (dependent variables) helped build multifactor linear regression models and calculate the indicators of elasticity of dependent variables from independent variables, which characterize the change in sustainable development indicators with the growth of controlling factors by 1%. This model allows us to define and analyze the levels of sustainable development of the industry, both in a specific country and within the region in general. The study shows that, for Russia and Eastern European countries, innovation is one of the crucial factors in ensuring sustainable development of agriculture in the region, taking into account the current state and level of economic development.

1. Introduction

Agriculture is one of the strategic sectors of economic development for Eastern European countries and for Russia in particular. Despite the fact that the share of agriculture in the region’s GDP has almost halved since 2000 [1], it represents an average of 5% of the region’s GDP [1]. However, it should be noted that agriculture is the most susceptible branch of the economy as far as climate is concerned [2]; global warming and climate change, which according to experts will keep getting worse, pose serious threats to crop and livestock farming in the region [3]. As recent studies show, Europe is warming faster than the rest of the world: by 1.7–1.9 °C compared to 0.94–1.03 °C for 2010–2019, [4] and Eastern Europe is especially dry [5]. In addition, global warming in Russia has occurred at a rate 2.5 times faster than the global average. Russia in the past 10 years has experienced warming by 0.47 °C, while the global average is 0.18 °C [6]. Sustainable agriculture is important for Russia because of the need to ensure food security, the development of areas outside urban settlements, as well as the guarantee of sustainable production [7]. In view of this, the country adheres to the principles of overall sustainable growth and stability in the framework of the strategy of good neighborhoods with the countries of Eastern Europe [8] as strategic partners and a single natural territorial area, stretching from the Baltic to the Black and Adriatic Seas.
Climate change affects the development of the agricultural industry in the region in different ways, which is explained by the level of development of the national economy, predetermining the adaptive capacity of the industry [9,10]. Russia and other Eastern European countries are the most affected by climate change. This is due to the fact that they cannot in practice use exactly the same advanced approaches and technologies to adapt to climate change that are typical for agriculture in Western Europe [11]. According to recent data from the Food Sustainable index 2020 [12], the countries of Eastern Europe, with the exception of Poland, are mainly characterized by the lowest level of agricultural sustainability (below 65 points). Russia’s index is 53.9 points and ranks 62nd out of the 66 countries participating in the ranking [12]. This indicates the priority of increasing agricultural productivity both in Russia and in most Eastern European countries. At the same time, it contradicts the main provisions of the Strategy for Sustainable Development of Rural Areas of the Russian Federation [13], the Concept of Russia’s Development until 2020 [14], and Sustainable Development Goals (SDGs) [15]. Sustainable development of agriculture is essential for achieving most of the strategic goals in the SDGs, so it is important to strengthen the participation of this sector in the national development strategies of Russia and the entire Eastern European region.
The imposition of forced quarantine measures to prevent the spread of the COVID-19 pandemic has created additional economic problems for the Eastern European region [16]. Thus, one cannot deny the fact that the economic success of these countries and the efficiency of agriculture were largely the result of the introduction into global value chains and the movement of many industries from the West to the East of Europe. Foreign direct investment predetermined the level of innovation and technology development in Eastern Europe [17], whereas the global recession caused by the pandemic has seriously threatened the international trade supply networks on which the economies of these countries are highly dependent [18]. Thus, climate change and its impact on the agricultural sector in the region is already evident. Adaptation measures are disjointed and uncoordinated [19], while the introduction of consistent comprehensive interactive approaches at this stage of ensuring the sustainability of the industry in the region is crucial.
Most of the scientific research within the framework of sustainable agricultural development focus on the balance of the three sustainable development components (economic, environmental, and social) [20,21,22,23]. Such a balance is achieved through the active development of innovation in the agricultural sector. It is open innovation and new technologies in the management of agricultural systems in modern conditions that are a determining factor of the qualitative improvement process that includes the capacity for development of the most fertile agricultural land to meet the needs of the growing population [24] and modernization of agricultural production [25] and agricultural systems [26,27,28,29,30]. Indeed, the need for innovative development of the agricultural sector is obvious to ensure sustainable development and prevent potential risks. However, as evidenced by the analysis of practical achievements [31,32], there have been no significant changes in the shaping of innovative agriculture in the region. The problem is not in the lack of high-frequency scientific products but in a much lower level of solvent demand for their development and practical implementation on the part of the agro-industrial sector in comparison with other sectors of the economy in Russia and other Eastern European countries [31,32,33]. This, in turn, is the result of the low level of profitability of agricultural enterprises, the high level of their debt burden, and the lack of own funds. Thus, the potential for sustainable development of the industry in the region is being reduced in both the medium and long term. The emphasis is placed on the search for cheap borrowed funds [34,35] and preferential state financing [7,34,36] rather than on the innovative development of agriculture.
Based on the above, it can be argued that the described results of scientific research are a set of relatively stable features of the innovative development of agriculture. The possibility of influencing them in the framework of the implementation of agricultural policy is not significant. However, in our opinion, it is methodologically important to answer the following questions: How important is it to take into account the specifics of the object (industry, state, level of economic development) where innovative practices are implemented? Are financial factors paramount to the sustainability of the agricultural sector? Is it possible to apply a uniform state innovation strategy without taking into account industry-specific and territorial peculiarities? Therefore, in this paper, we tried to answer these questions. The main contribution of this study is in the econometric estimates of the conditions for achieving sustainable development of agriculture in Russia as a part of the East European region.

2. Literature Review

In the academic literature, the concept of sustainable development embraces both the macro [37,38,39,40,41] and micro levels [42] of agriculture. In general, there are some common features of the concept, which are the identification of the three structural interconnected components of sustainable industry development: environmental, social, and economic [37,38,39]. Environmental factors characterize the quality of inputs and the efficiency of agricultural management [37,38]. Economic factors represent the level of productivity of an industry, as well as its profitability and its payment capacity [37,38], while social factors relate to the local context, the participation of actors in benefit-sharing, and sustainable consumption [37,39]. Within this context, a significant amount of research has focused on the relationship between agriculture, sustainability, and climate change, in terms of both the risks associated with different climate scenarios and regions [37,38,39,40,43,44] as well as the steps that ensure innovations required for the sustainable development [24,45,46].
Many scientists [24,40,46,47,48,49,50,51] believe that balancing factors of production, profitability, environmental protection, and social considerations contributes to the sustainability of the agricultural industry. This has been accompanied by attempts to develop practical systems for measuring sustainability in the different systems of farming, cropping, and livestock raising on which humanity depends for subsistence. Zhen and Routray [48] urge agricultural researchers to recognize the importance of sustainability in agricultural systems, devise ways of measuring sustainability, and examine empirically the sustainability of some well-defined cropping or farming systems and develop methods to measure it. However, it is not always clear to what extent an agricultural system can be considered sustainable. The sustainability of agriculture is not limited to the impact on the ecological system and the impact of environmental factors on the industry. The controversial nature of this issue has been accompanied by attempts to develop practical systems for measuring sustainability in the different systems of farming, cropping, and livestock raising on which humans depend for subsistence [48]; in other words, the question arises as to how agricultural sustainability can be measured.
Many scientists not only have focused on recognizing and justifying the importance of agricultural sustainability in achieving global food security [52], but also have developed an approach to measuring the sustainability of agricultural systems. They have also considered sustainable development to be a form of economic development. Most scientists tend to believe that accurate measurement of agricultural sustainability is not possible because the latter is a dynamic concept and the functioning of the industry is site-specific [24,42]. Sustainability in these dimensions may be difficult to reconcile because each will have a different time-scale and perspective in each context [42]. Moreover, what is defined as “sustainable” depends to some extent on the perspectives of the analysts [37,38,53]. Therefore, many scientists have described the sustainability of the agricultural–industrial complex (AIC) in terms of quality characteristics [38,39,52]. For example, Pancino et al. [52] examined the process of developing multi-stakeholder partnerships for sustainable innovation in the food supply chain and, using qualitative characteristics, justified the most efficient strategies for sustainable innovation. Many studies have also focused on identifying various systems of factors: demographic, natural, socioeconomic, political, institutional, governance, and others, which are drivers of sustainable agriculture [24]. These systems, in conjunction with sustainability indicators, can serve as a basis for the development of efficient agricultural policies that promote sustainability in the industry [24,47].
Modern economic science has accumulated considerable research on the innovative development of agriculture, but most research studies consider innovation as a result of sustainable development of agro-industrial production [29,54,55]. First of all, it is ensuring the formation of new market niches for the consumption of agricultural products and reducing the negative impact on the environment, namely plowing huge territories and clearing forests for fields, the use of chemicals for fertilizers, pollution of waste from livestock, degradation of aquatic ecosystems with eutrophication, etc. [29,54,56]. This viewpoint is based on the fact that a sufficient level of technological change will make it possible to increase agricultural productivity so much by the end of the current century that is easy to achieve in the face of any negative impact from climate change caused by global warming [57]. However, scientists also argue that this is possible with a certain level of economic development that only industrialized, rich countries can afford [57]. These countries can afford serious technological changes in the agricultural industry and ensure its extensive development on an innovation basis [57], whereas the agro-industrial sector in countries with developing economies is not an investment-attractive industry [58,59] and its sustainability and development depend primarily on financial factors, such as the level of state subsidies, the level and possibility of bank lending for agriculture in the country, and the level of foreign investment in the industry [7,58].
Some scientists also tend to regard innovation as a magic pill for ensuring the sustainable development in the agricultural sector, explaining their viewpoint by the slowdown of the “green revolution” [54]. Even if no further slowdown follows, it is very likely that food demand and production growth will proceed at nearly the same rate [54]. Global demand for food is expected to triple by the 2080s due to increases in world population and income [60]. In addition, it seems likely that a significant amount of land area will be converted to biomass production for ethanol fuel [60]. As a consequence, supply and demand are in a rather unsteady equilibrium, which would deteriorate significantly in the case of a major negative shock associated with global warming [60].

3. Methodology

3.1. Agriculture Sustainable Development Indicators

The set of indicators for assessing the sustainable development of the agricultural sector was formed on the basis of the following sources [38,42,53]:
  • Economic sustainability:
    • Food producer price index (in constant prices for 2010, USD), %—Prod_Cost
    • Agricultural products import cost rise index, USD Million, %—Imp
    • Agricultural products export cost rise index, USD Million, %—Exp
    • Growth index of the real value added of agricultural products, USD Million, %—Add_Value_GR
    • AIC gross fixed capital formation growth index, USD Million, %—Accum_Cap
    • Basic capital consumption growth index, USD Million, %—Consump_ Cap
    • Loans disbursed in the AIC growth index, USD Million, %, %—Credit
    • Foreign direct investments in the AIC growth index, USD Million, %—FDI
    • Public expenditure on agriculture, food and rural affairs growth index, USD Million, %—Gov_Spend
    • Public expenditure on environmental protection in the agricultural sector growth index, USD Million, %—Gov_Spend_EP
    • Growth index of the volume of public expenditures on research and development (R&D) carried out in agriculture, %—Gov_Res
    • Growth index of expenditures of enterprises on R&D carried out in agriculture, %—Enter_Res
  • Ecological sustainability:
    • Carbon emissions growth index, gigagrams, %—Emissions_CO2
    • Methane emissions growth index, %—Emissions_CH4
    • Nitrous oxide emissions growth index, %—Emissions_N2O
    • SAR emissions growth index in the sector, %—Emissions_SAR
    • AR5 emissions growth index in the sector, %—Emissions_AR5
    • AR4 emissions growth index in the sector, %—Emissions_AR4
  • Social sustainability:
    • Volume of employment growth index in the sector, %—Employ
    • Customer prices index (2010 = 100%), %—CPI
    • Actual wages growth index in the sector, USD, %—Wages
When calculating price indices, 2010 was used as a point of comparison and calculated at chain growth rates.
In addition to methods of scientific generalization and systematization, the expert assessment method (individual survey) was also used to justify the set of indicators. Fifty representatives of the Federal State Budgetary Institution (FSBI) Federal Legal Expert Center of Agro-industrial Complex, the FSBI Analytical Center of the Ministry of Agriculture of Russia, and the FSBI Center for Strategic Planning in the Sphere of Agro-industrial Complex of the Russian Federation acted as experts. Competence of experts was confirmed by five years of working experience in the field of analytical assessment of the state of Russian agriculture, planning and development strategies for the industry. The experts were invited to assess the expediency of using each individual indicator to assess the sustainable development of the agricultural sector on a 10-point scale.
The experts also assessed the ampleness of the suggested set of indicators for estimating sustainability of agricultural development by components such as economic, environmental and social development. In the 10-point scale, 10 meant that the suggested set of indicators was sufficient for assessing sustainable development of agriculture, as it does not need to be supplemented by other indicators that are not included in the list; 0 meant that it was not appropriate to use the suggested set of indicators for assessment, and that there are more significant indicators, according to experts, that are not included in the list that characterize the sustainable development of agriculture. The threshold score for deciding whether to use the indicator was 8.5 points (85% of the maximum score). To determine the threshold score, we used the factorization index, determined by the method of principal components. A sufficient level of informativity was reached at 80–85% [61].
According to the suggested list, the expediency of using each individual indicator to assess sustainable development was rated an average of 9.1 points (in the range between 8.9 and 10 points), and the adequacy of the entire set of indicators was rated at 8.8 points.
Consistency of experts’ opinions was confirmed by the value of the variation coefficient: 0–6.8% when assessing each individual indicator and 7.8% when assessing the whole set of indicators. Since the values of the variation coefficients did not exceed 10%, this indicates a weak variability of experts’ assessments and, therefore, the consistency of their opinions and the reliability of the expert assessment results. The system of indicators for sustainable development of agriculture was used for the 2001–2019 period in Russia and other Eastern European countries: Belarus, Bulgaria, Czech Republic, Hungary, Poland, Moldova, Romania, Slovakia, Ukraine. Among the information sources are the Federal State Statistics Service [62], Food and Agriculture Organization [1], and OECD.Stat [63].
The possibility of using data from all Eastern European countries to model the sustainable development of Russia’s agricultural sector in time study was confirmed by the same direction and force (with a 5% error probability) of causal relationships among sustainable development indicators of Russia and among sustainable development indicators of other Eastern European countries. Causality between sustainable development indicators was established using the Granger test in the EViews 10 software (IHS Markit, London, UK). The homogeneity of the set of indicators was also confirmed by the identical range of values of integral indicators (environmental, social, and economic components of sustainability) [0; 1] and their calculation method (using fuzzy sets).

3.2. The Model of Assessing Sustainable Development in Agriculture

The method of fuzzy sets served as a methodological basis for constructing a model. This method was used for the following reasons:
  • The possibility of obtaining an integral assessment. This study did not assume the initial deterministic variable characterizing the sustainable development of the agricultural sector but focused on the construction of a synthetic integral value. Obtaining an integral indicator allowed us to combine the three directions of sustainable development (economic, environmental, and social), thereby ensuring the comprehensive character of the study.
  • In addition to the value of the integral indicator of sustainable development, the method allowed us to determine its levels. The use of levels allowed us to carry out a qualitative assessment of the development of the agricultural sector.
  • In determining the integral index, we used not the numerical data of the indicators, but their levels. In this case, there is no possibility of a situation in which excessive values of one indicator compensate for the low values of another. This ensured a balanced assessment.
  • Determination of the levels of private and integral indicators implied a probabilistic assessment. This allowed for a more accurate interpretation of the intermediate values, determining the probabilities of their falling to adjacent levels.
The method implied that the determination of sustainable development indicators levels was the major task. The use of the Student criterion allowed determining statistically significant differences in the value of indicators, which served as a basis for determining quantitative boundaries of the levels of one hundred percent confidence in the classification. Based on the results of Student t-statistics, levels (low, medium, high) and the nature of the classification function were determined. A trapezoidal function for determining the levels of indicators of sustainable agriculture was written as follows:
μ 1 = 1 , X m i n X i X i t 1 X i t 2 X i X i t 2 X i t 1 , X i t 1 < X i < X i t 2 0 , X i t 2 X i X m a x , μ 2 = 0 , X m i n X i X i t 1 , X i t 4 X i X m a x X i X i t 1 X i t 2 X i t 1 ,   X i t 1 < X i < X i t 2 X i t 4 X i X i t 4 X i t 3 , X i t 3 < X i <   X i t 4 1 , X i t 2 X i X i t 3 , μ 3 = 0 , X m i n X i X i t 3 X i X i t 3 X i t 4 X i t 3 , X i t 3 < X i < X i t 4 1 , X i t 4 X i X m a x ,
with μ1 being the probability of attributing i indicator to the low level, μ2 to the medium level, μ3 to the high level;
  • Xi being agricultural sector sustainability indicators;
  • Xmin being a minimal value of i indicator;
  • Xmax being a maximal value of i indicator;
  • [Xmin; Xi(t1)], [Xi(t2); Xi(t3)], [Xi(t4); Xmax], being i indicator values with statistically significant differences of Student coefficient;
  • Xmin < Xi(t1) < Xi(t2) < Xi(t3) < Xi(t4) < Xmax.
Formula (1) was used to calculate integral indicators of sustainability of the agricultural sector, namely economic (Econ_Sust), ecological (Ecol_Sust), and social (Soc_Sust) sustainability, as well as an integral indicator of the industry’s sustainable development (Sustain_Dev) based on Econ_Sust, Ecol_Sust, Soc_Sust indicators. Integral indicators are calculated as an arithmetic mean of the sum of values (qi) for private indicators that are part of the corresponding integrated one:
  • For stimulating indicators: q = 0 (low level), q = 0.5 (medium level), q = 1 (high level);
  • For disincentives q = 0 (high level), q = 0.5 (medium level), q = 1 (low level).
The use of q values of 0.1 or 0.3 for low levels and 0.7 or 0.9 for high levels, as defined in certain papers [64,65], leads to a narrower range of integral indicator values. With such values, it is impossible to obtain the minimum and maximum possible values of 0 and 1, respectively. This makes it difficult to use the t-criterion for determining the levels of integral indicators. Therefore, the values q = 0 for low and q = 1 for high are taken in this study. The levels of integral indicators have been determined using Formula (1).
To determine the power and nature of the influence of control indicators on the level of agriculture development, multifactor linear regression models were built based on the values of indicators for the countries of Eastern Europe for the 2001–2019 period [1,62,63]. Dependent variables were Econ_Sust, Ecol_Sust, Soc_Sust, and independent variables were determined by the graph method. The use of regression analysis was driven by the need to determine the nature and quantitative measurement of the impact of controlled indicators (independent variables) on the economic, environmental, and social sustainability of the industry. The construction of linear regression models became possible due to the confirmed indicators of model adequacy (F and t-criteria) of the linear nature of the relationship between dependent and independent variables. The power of influence of control indicators was estimated by calculating the elasticity coefficient.

4. Results

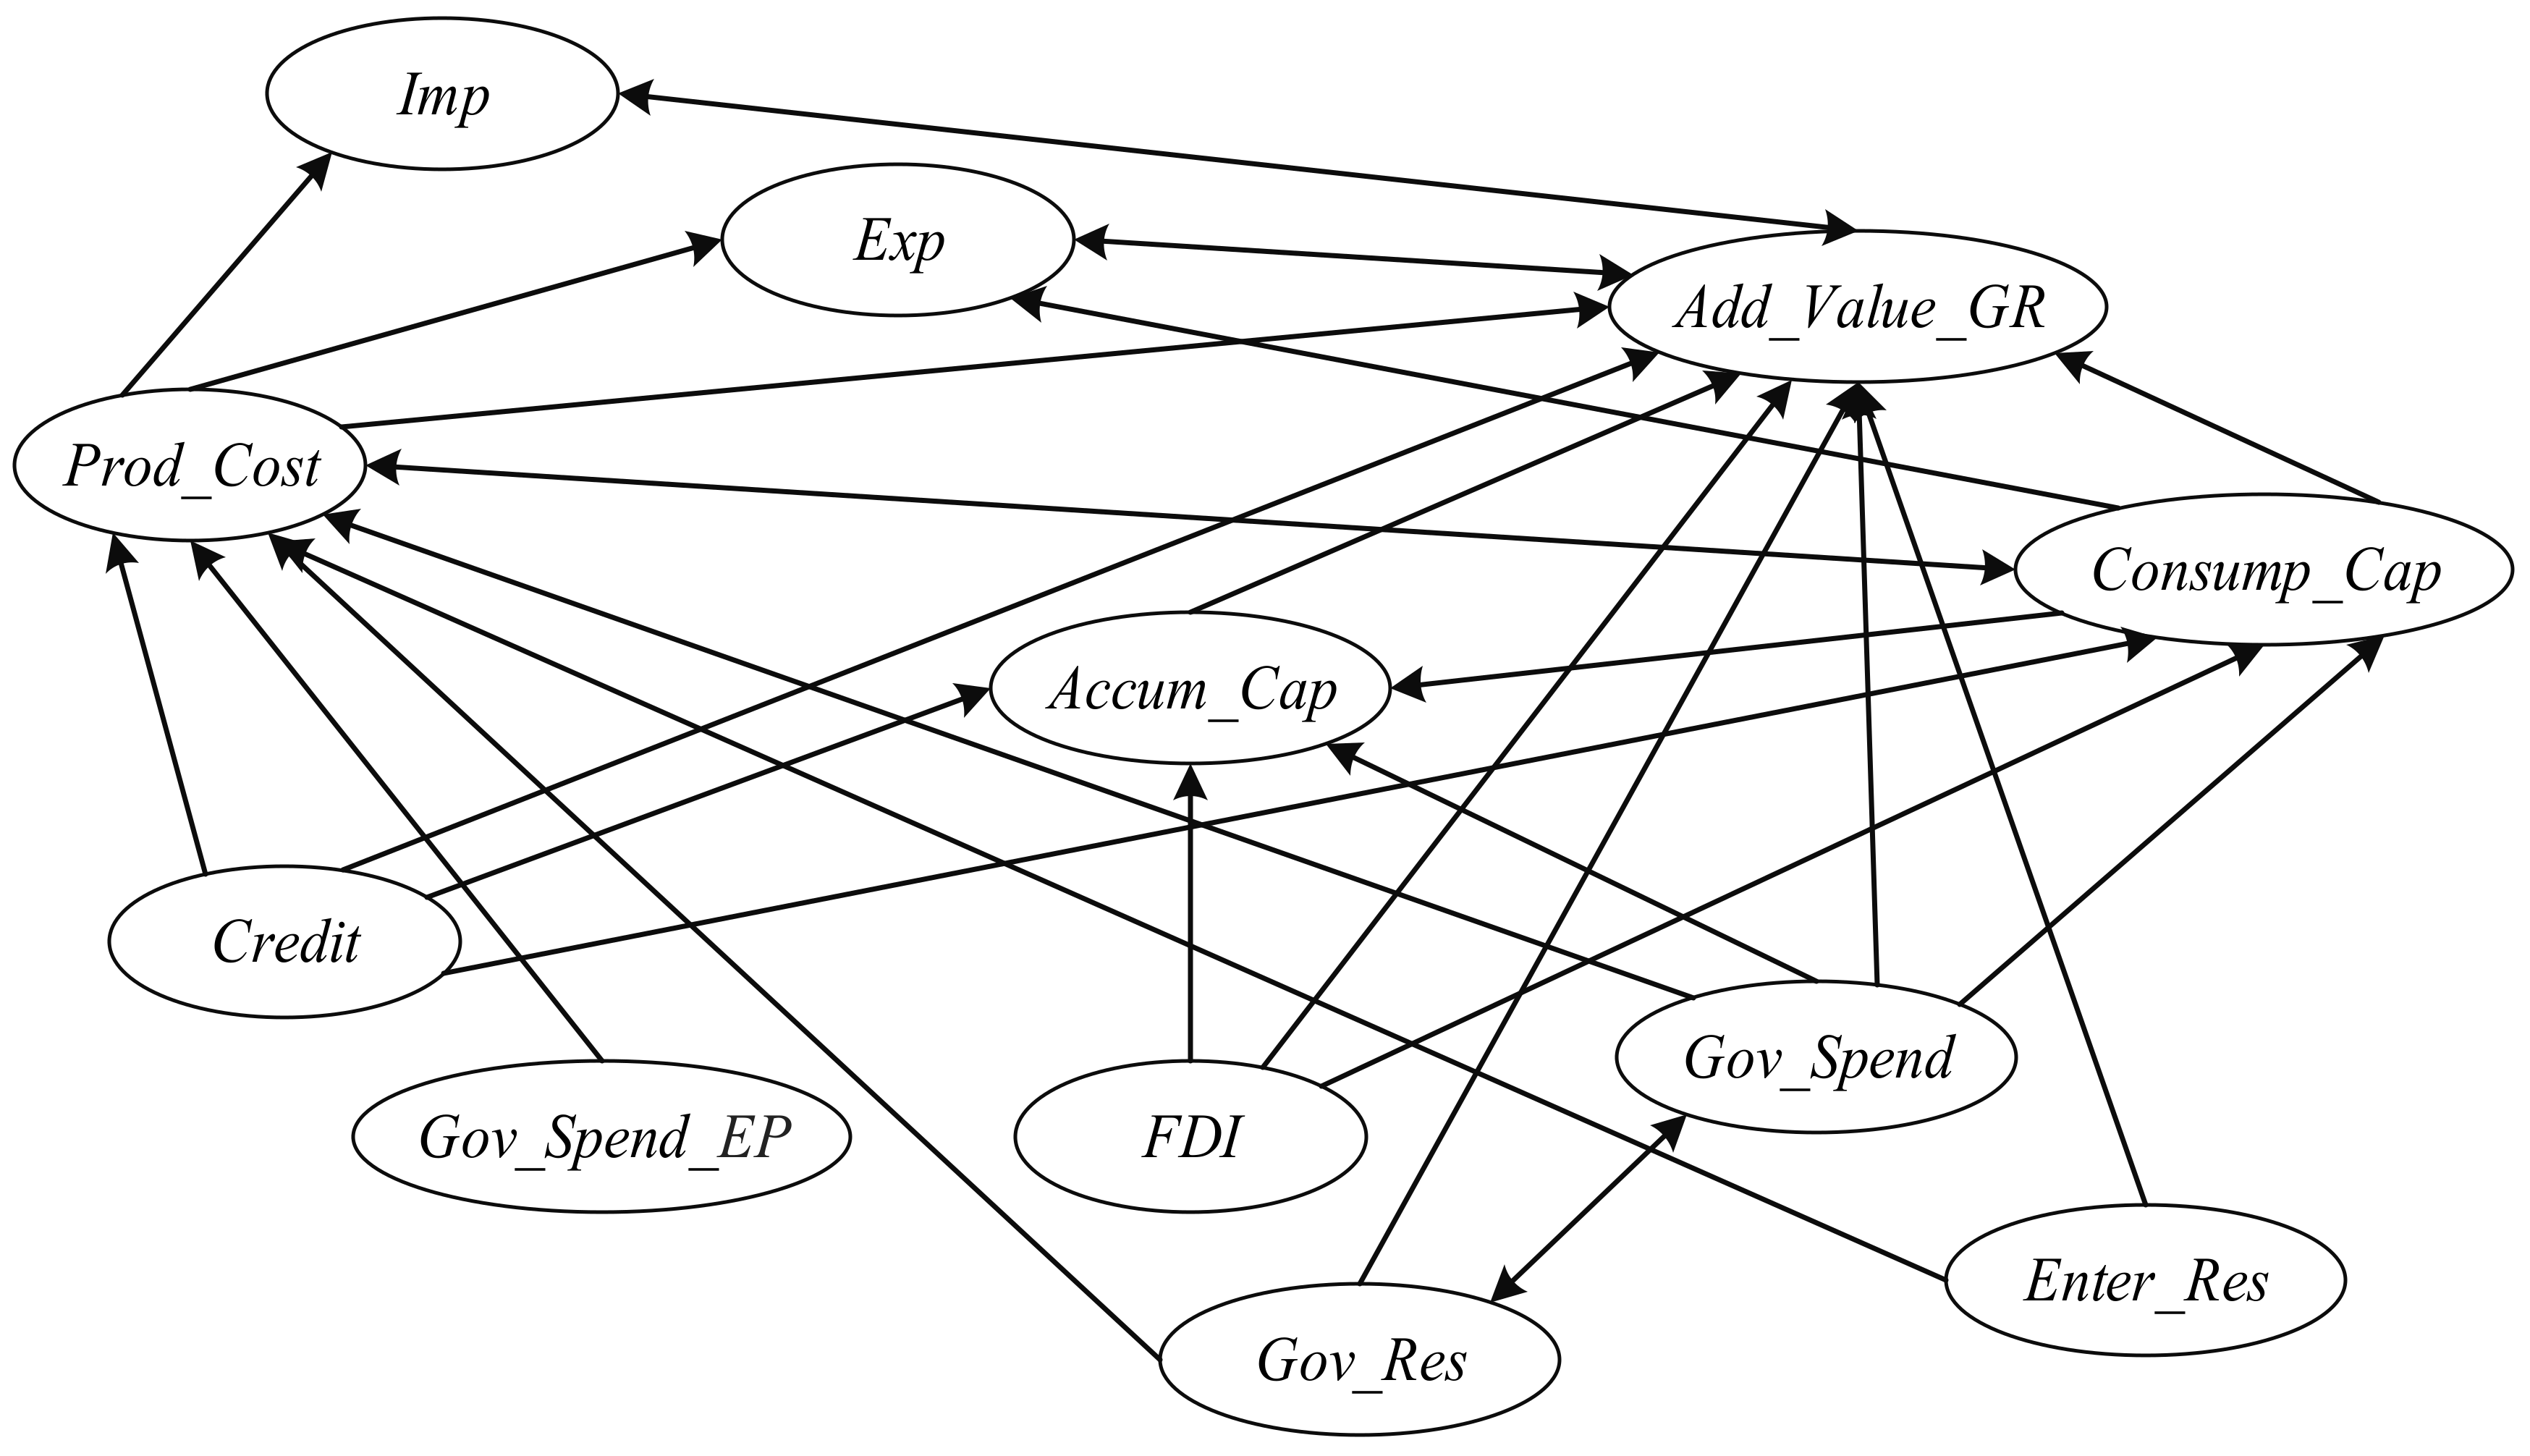
4.1. Verification of Causal Links between Sustainability Indicators in the Agricultural Sector and Their Hierarchy Levels

The system of indicators is formed of interdependent indicators. In this regard, in order to ensure the adequacy of the results of further evaluation and the possibility of their economic interpretation, the set of indicators was tested for causal relationships. For this purpose, the Granger test was used.
The use of the Granger test to check for causal relationships between sustainability indicators in the agricultural industry was made possible by bringing the time series of indicators to a fixed format. Causal links between indicators were identified in three separate groups of economic, environmental, and social development indicators.
Table 1 shows the links between economic indicators that are statistically significant at p = 0.05. In case of significant links between two indicators at different lags, the table shows the more significant ones, for which Prob. = min (using L = 1, L = 2, L = 3, L = 4 lags).
The cause-and-effect graph is based on test results (Figure 1).
In the direction of the edges of the oriented graph, the sets S(zi), P(zi), S(zi)∩P(zi) are defined (Appendix A), and using the method of graphs, the levels of the hierarchy of indicators of economic sustainability of the agricultural sector are defined.
According to the obtained results, the 1st level of the hierarchy formed Credit, FDI, Gov_Spend, Gov_Spend_EP, Gov_Res, Enter_Res indicators. The scope of financing determines the availability of funds, as well as production potential. Sufficient funding for research and development improves the technological process, increases labor productivity and land yield, and reduces emissions. Funding for expanded reproduction creates new jobs increasing employment and real income in the industry. Credit, FDI, Gov_Spend, Gov_Spend_EP, Gov_Res, and Enter_Res indicators influence other economic indicators of the industry, as well as environmental and social indicators. In addition, these indicators can be managed by changing the amount of financing, as well as its sources and uses. Therefore, these indicators have been defined as the managing ones for modeling the conditions for the transition to sustainable agriculture in Russia and Eastern Europe.
Level 5 of the hierarchy was formed by Imp, Exp, Add_Value_GR indicators, which are the result of the impact of Level 1–4 indicators when assessing the sustainable development of the agricultural sector. These indicators are used to determine the levels of the Russian AIC sustainable development.
The 2nd–4th-level indicators were not used in further calculations as they would mediate the impact of management indicators on the resulting ones.
In terms of environmental and social indicators, the application of the Granger test did not allow statistically significant links between them to be established. Therefore, all of the proposed indicators were used to build a model for assessing sustainable development in environmental and social terms, characterizing environmental development (Emissions_CO2, Emissions_CH4, Emissions_N2O, Emissions_SAR, Emissions_AR5, Emissions_AR4) and social development (Employ, CPI, Wages).
This approach to the definition of indicators of sustainable development of the agricultural sector made it possible to distinguish:
(1)
the level of resulting indicators, which reveals the development of the industry in the areas of economy, society, and ecology;
(2)
the level of control indicators, which, when changed, make it possible to alter the trajectory of the agricultural sector development.
The use of relevant scientific literature, expert assessments, and statistical processing methods (Granger test, graph method) in the formation of indicators ensures their representativeness, validity, statistical significance, and applied nature in modeling sustainable development of Russia and other Eastern European countries (Belarus, Bulgaria, Czech Republic, Hungary, Poland, Moldova, Romania, Slovakia, and Ukraine).

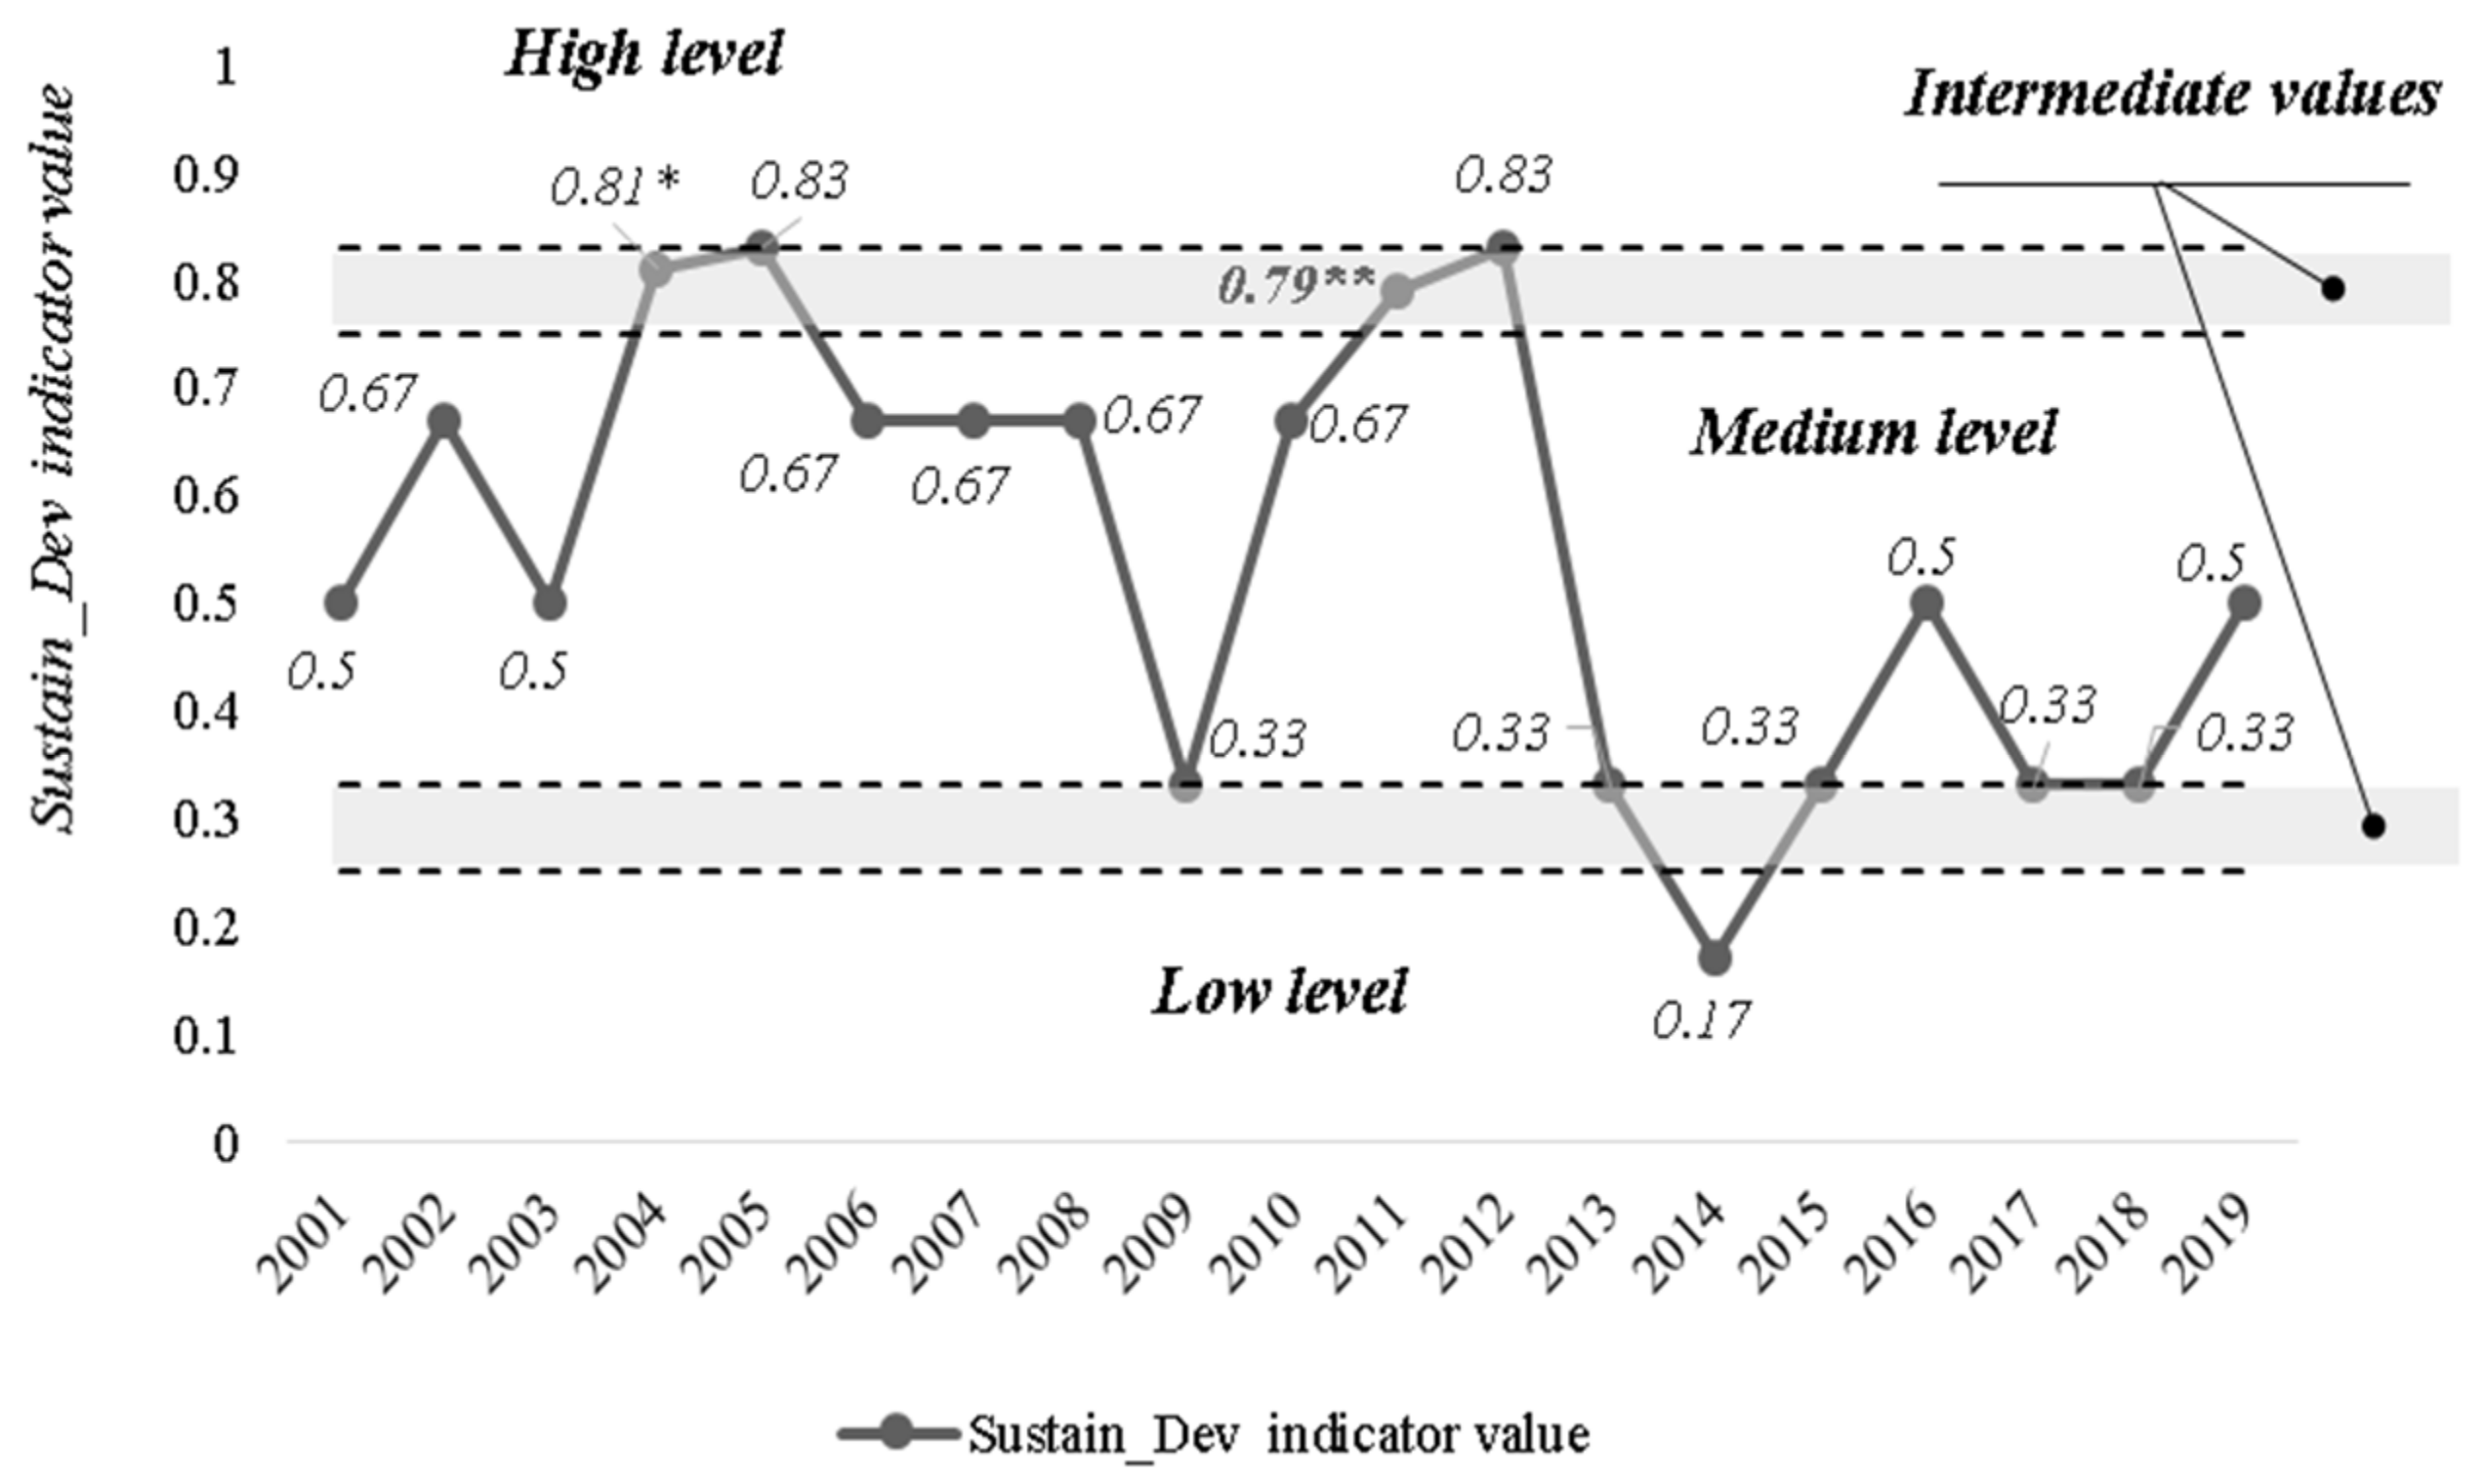
4.2. Assessment of Sustainable Agriculture Development in Russia

Applying the Student’s criterion to the values of sustainable agricultural development indicators made it possible to determine the ranges of values corresponding to the indicator levels. These are ranges for which the probability of attributing an indicator to a certain level is 100% (μi = 1). The functions of the classification of levels of indicators of sustainable development of the industry have been defined (Appendix B).
Function (2) assumes the use of minimum (Xmin) and maximum (Xmax) values as indicators to determine the level ranges. The classification functions are applicable to the full range of sustainable development indicators—[0; +∞].
Indicators of economic (Exp, Add_Value_GR) and social (Employment, Wages) development are the stimulating factors for sustainable development. The impact of the Import Indicator (Imp) is ambivalent [66,67,68], but in this study, import is regarded as having a positive impact on economic development [67,68].
The consumer price index (CPI) indicator is disincentive, as an increase in the price index leads to a decrease in real incomes, solvent demand and living standards. Environmental development indicators are disincentives of sustainable development.
In defining an integral sustainable development indicator (Sustain_Dev), the growth of individual indicators (Econ_Sust, Ecol_Sust, Soc_Sust) promotes sustainable development. Therefore, the Econ_Sust, Ecol_Sust and Soc_Sust indicators are the stimulating ones. The Sustain_Sust values are calculated as arithmetic mean values of private development indicators (Econ_Sust, Ecol_Sust, Soc_Sust) taking into account the q scores that are assigned according to the level.
The ranges of values of the integral sustainable development indicator and its components (economic, environmental, and social development), corresponding to one hundred percent confidence in the classification, are defined according to the following levels:
  • Low level [0; 0.25]
  • Medium level [0.33; 0.75]
  • High level [0.83; 1]
The functions that determine inclusion in the development levels are as follows:
μ 1 = 1 ,   0 I 0.25 0.33 I 0.08 ,   0.25 < I < 0.33 0 ,   0.33 I 1 , μ 2 = 0 ,   0 I 0.25 ; 0.83 I 1 I 0.25 0.08 , 0.25 < I < 0.33 0.83 I 0.08 , 0.75 < I < 0.83 1 ,   0.33 I 0.75 , μ 3 = 0 ,   0 I 0.75 I 0.75 0.08 ,   0.75 < I < 0.83 1 ,   0.83 I 1 .
where I is an integral indicator of the development (Econ_Sust, Ecol_Sust, Soc_Sust, Sustain_Dev).
The results of the assessment showed that Russia has a medium level of sustainable development in agriculture (Figure 2).
In 2014, Russia’s level of sustainable development (Sustain_Dev = 0.17) was characterized as low, and in 2004–2005 and 2012, it was measured at high and medium levels. Among the indicators of economic growth, the lack of stable growth dynamics of agricultural exports was determined to be a disincentive (growth was observed in 2003–2004, 2006–2008, 2010–2013, and 2018, and declines were observed in 2001–2002, 2005, 2009, 2014–2017, and 2019).
Environmental development is also characterized by alternating periods of high and low values of the Ecol_Sust integral indicator. However, since 2013, this indicator has been at medium and low levels due to the growth of all types of pollutant emissions. The consumer price index indicator is also characterized by constant growth (up to 189.2% in 2019), which has a negative impact on the integral social development indicator.

4.3. Conditions for Transition to Sustainable Development in the Agricultural Sector

This analysis shows that there is a lack of stable growth dynamics in the agricultural sector. To ensure sustainable development, at least two out of three individual development indicators (Econ_Sust, Ecol_Sust, Soc_Sust) should be at a high level. A medium level is allowed for one of these indicators. The combination of high and medium level indicators is not relevant, since the Sustain_Dev indicator has the same importance for economic, environmental, and social development indicators. In turn, the high values of integral economic, environmental, and social development indicators are ensured by the high level of two out of three of the private indicators included in the respective integral sustainable development indicators and the average value of one out of three indicators. For the integrated environmental development indicator, which consists of six private indicators, a low level for one indicator is allowed when the others are high.
As shown by the results of the graph method (Appendix A), the controlling factors in the transition to sustainable development are the financing indicators (Credit, FDI, Gov_Spend, Gov_Spend_EP, Gov_Res, Enter_Res). Their impact on the values of integral indices of economic, environmental, and social development has been described using multifactor linear regression models (Table 2). The values of these indicators, converted from percentage values into coefficients, are used as independent variables in regression models. The values of the indicators Econ_Sust, Ecol_Sust, Soc_Sust are used as dependent variables. The models are based on a sample of Eastern European countries (Russia, Belarus, Bulgaria, Czech Republic, Hungary, Poland, Moldova, Romania, Slovakia, Ukraine) for the period of 2001–2019. Based on data [1,62,63]. The number of observations 180 indicates the sufficiency of the sample.
Statistica 12.0 software (StatSoft, Tulsa, OK, USA) was used to build regression models. The influence of the control variables was estimated by calculating the elasticity coefficients, which characterize the percentage change in the dependent variables with a 1% change in the independent variables. Table 2 presents statistically significant regression models. The appropriateness of the constructed regression models is confirmed by values of Fisher’s F-criterion and Student’s t-criterion. The calculated values of these indicators for all models exceed the tabulated values of 2.27 for F-criterion with the number of degrees of freedom df = (5; 174), and 2.43 with the number of degrees of freedom df = (4; 175), and 1.97 for t-criterion with p = 0.05.
Calculations showed that there is no statistically significant relationship between the dynamics of foreign direct investment across the industry and environmental and social development indicators. This suggests that investment is primarily directed towards quantitative growth (expansion of production, exports, and imports) without concern for improving the environmental and social conditions.
The economic development of the sector is determined by the growth of lending, foreign direct investment, government spending, and the amount of funding for R&D carried out in agriculture financed by the state and enterprises. The highest elasticity of the economic development indicator is demonstrated by the volume of spending on R&D in agriculture at the expense of the state (with an average elasticity coefficient of 1.41%) and at the expense of enterprises (with an average elasticity coefficient of 1.50%). The increase in the volume of loans issued by 1% contributes to the growth of the economic development indicator by 0.81%. The 1% increase in foreign direct investment contributes to the growth of the economic development indicator by 0.80%. The 1% increase in public spending contributes to a 0.62% increase in the economic development indicator.
The environmental development indicator is dependent on the dynamics of lending (elasticity coefficient 0.78%), government spending on agriculture in general (elasticity coefficient 0.79%). The environmental development indicator showed the highest elasticity from the amount of government spending on environmental protection (elasticity coefficient value 1.66%), government spending on R&D on agriculture (0.90%), and enterprises’ spending on R&D on agriculture (0.81%).
The social development of the agricultural sector is most significantly affected by the dynamics of lending (elasticity coefficient 0.90%) and government spending on agriculture (0.79%). Positive influence on the level of social development is also provided by the growth in volumes of expenses on research and development of agriculture at the expense of the higher amount of payment for intellectual, high-tech labor, in comparison with the low-tech labor requiring less qualification. The growth of expenditure on R&D in this sector contributes to the industry profitability due to the use of more efficient technologies, growth of the number of investors, creation of new enterprises and, as a consequence, reduction of consumer prices for goods, and growth of employment level, which is a stimulant of social development. A 1% increase in government spending on R&D in agriculture contributes to a 0.56% increase in the social development index, while a 1% increase in enterprise spending on R&D on agriculture leads to a 0.49% increase in the social development index.
Changes of the Integral Sustainable Development Index (Sustain_Dev) in the face of the change in control factors are estimated based on the sum of the percentage change of the indices of managing factors’ impact on indicators of Econ_Sust, Ecol_Sust, Soc_Sust due to the equal importance of these indicators.

5. Discussion

5.1. Sustainable Development of the Agricultural Sector

In this study, we proposed an approach to assess the level of sustainable development of the agricultural sector in Russia in the framework of its development in Eastern Europe. The developed approach is based on balancing the indicators of economic, environmental, and social development and takes into account the influence of controlling factors on the sustainability of the agro-industrial complex, in contrast to the existing research results [40,43,48,49]. This approach allows the current monitoring of the state of agriculture, identifying the destabilizing factors that hinder the development of the industry in interaction. This is a new approach that combines agriculture, economics, and ecology and takes into account compromises and synergies between the sectors and components of sustainability. It also proves that agricultural systems can be defined at different scales.
The model is built on the basis of private indicators with their informativeness proven by expert and statistical methods. This approach differs from the widespread approach [43,49], which estimates the sustainability of development as a ratio of positive effect to potential. This study identified the dominant factors influencing the development of the industry. These are factors that, unlike those in [50,51], are controllable, and by changing them, it is possible to determine the course of sustainable development of the agricultural sector. The proposed approach makes it possible to determine the conditions for the switch of the sector to sustainable development through changes in the structure of R&D funding and sources of financing of the agricultural sector, taking into account the state and level of development of the country’s economy. For the purposes of this study, these countries are Russia and other countries of the Eastern European region (Belarus, Bulgaria, Czech Republic, Hungary, Poland, Moldova, Romania, Slovakia, and Ukraine) that belong to the emerging market countries. The proposed approach made it possible to use econometric methods to substantiate the following debatable issue: taking into account the specifics of the countries’ economic development, the innovation factor is one of the decisive ones in the process of ensuring sustainable development of the agricultural sector along with the factors of state financial support [7,29,54,57]. It should be noted that the system of indicators lacks natural factors, such as climatic conditions, land fertility, and the amount of land used for agriculture. Their use is impractical as they are unmanageable. That is, there is no possibility of modeling the optimal proportions in the sector due to changes in these indicators, and their impact is reflected through the above indicators of economic, social, and environmental development.
Due to the fact that the countries studied in this paper are emerging market countries, government funding is essential for the sustainable development of the agricultural sector. This puts a burden on the state budget and also weakens the motivation for the innovative development of agricultural enterprises. To solve this problem, it is advisable to develop a strategy of open innovation in the agricultural sector of Russia and the entire Eastern European region. The state should stimulate the expansion of cooperation of the agro-industrial complex with research institutes and the system of higher education to move towards the implementation of digital technologies in the industry [69,70]. This in turn will allow taking into account local peculiarities of fields and animals in the region’s countries, natural variability, and the like. This may help reduce resource consumption, increase crop yields and animal productivity, and improve the quality and speed of decision-making to ensure the sustainability of the industry in the long term [71,72].

5.2. Open Innovation as Strategy for Sustainable Development

The intensive development of open innovations in agriculture is one of the main directions in ensuring the sustainability of this sector in Eastern Europe and Russia in particular. The need for open innovation lies in the fact that with the proper organization of active cooperation between farmers and industrial partners, they will be able to access the world’s best technologies and competencies as quickly as possible. They will also be able to use their technologies and competencies for approaching new and diverse threats to the sustainable development of agriculture.
In view of the identified peculiarities of agricultural development in Eastern Europe, it seems advisable to develop a strategy for open innovation in the areas of the introduction of geoinformation technologies and GPS in farming to develop precision agriculture. Using geographic information technologies, farmers will be able to display current and future changes in rainfall, temperature, crop yields, plant health, and more. These technologies also will allow for GPS-based applications to be used along with smart technologies to optimize fertilization and pesticide application and more. Leveraging best practices for satellite and aerial imagery can help provide more accurate yield predictions and near real-time field monitoring to detect a variety of threats to the industry. Furthermore, the agricultural sector should focus on the widespread use of various kinds of digital platforms operating based on satellite monitoring to intensify open innovation strategies. Within the framework of achieving the sustainability of the region’s agricultural sector, these measures will enable it to increase the efficiency of the field monitoring process by not missing the most appropriate moment for field processing, making the fastest and most accurate decisions by farmers, and so on. Thus, open innovation makes it possible to obtain a larger number of effective solutions to the task at hand and shorter time frames for obtaining favorable results, while saving financial costs to achieve sustainable agricultural development in Eastern Europe in the near future. These outcomes will contribute to the counteraction to technogenic and socio-cultural threats, and radically increase the connectedness of agricultural territories.
It should be noted that the economic indicators of Eastern Europe (Russia, Belarus, Bulgaria, Czech Republic, Hungary, Poland, Moldova, Romania, Slovakia, and Ukraine), as emerging economies with lower levels of sector financing and lower levels of adaptive capacity to deteriorating climate conditions compared to Western Europe, were used to form the sample of the econometric model of agricultural sustainability proposed within the study. These differences arise because today, agriculture in Eastern Europe is not at the same high level as in Western Europe and because the options for adaptation to future climate change are not the same in these two regions. Therefore, the proposed approach and the patterns of influence of governing factors on the sustainability of the agricultural sector identified by the results of the study are applicable to all countries of Eastern Europe. In case the proposed approach is used to assess the sustainability of agricultural sector development in other countries, it is necessary to recalculate the levels of economic, environmental and social development indicators and to re-build models of the influence of controlling factors on the sustainability of agricultural sector development in order to identify the patterns of their influence that are specific to these countries.
The proposed approach can also be used to assess the sustainability of any other industry, but in this case, it is also necessary to adjust the list of indicators taking into account the specifics of agriculture, the level of development of the national economy, and its innovation potential.

6. Conclusions

We can conclude that under current conditions, Russia and the rest of Eastern Europe (Belarus, Bulgaria, the Czech Republic, Hungary, Poland, Moldova, Romania, Slovakia, and Ukraine) have unstable dynamics of agricultural sector development, which exacerbates the development of adaptation mechanisms to worsening climatic conditions. In addition, Russia in the Eastern European region is characterized one of the countries with the most pronounced volatility of sustainable agricultural development and is mainly characterized by an average level of development. As the results of the study have shown, the controlling factors in the transition to sustainable agricultural development in the countries of the Eastern European region are the indicators of industry financing, promoting a more active implementation of innovative technologies in the industry, and achieving sustainability of the agro-industrial complex in the shortest possible time. The following results were obtained: a 1% increase in the volume of agricultural lending leads to a 2.50% increase in the sustainable development index; a 1% increase in the volumes of direct foreign investments in the industry leads to a 0.80% increase, a 2.19% increase in government spending on the sector, a 1.66% increase in government spending on environmental protection in the field of agriculture; growth of government spending on R&D in agriculture leads to an increase of 2.87%; and growth of enterprise spending on R&D in agriculture leads to an increase of 2.79%. Therefore, in the current conditions, in order to balance the environmental, social, and economic development of Russia’s agriculture, it is necessary for the sector’s innovation to develop as it leads to mutually supportive economic, ecological, and social growth in the agricultural sector.
Consequently, in modern conditions, to ensure the balance of environmental, social and economic development of agriculture in Russia within the Eastern European region, the most effective way is to provide favorable conditions for lending to economic entities. As a result, there is complementary economic, environmental, and social growth in the functioning of the agricultural sector. In further research, scientific priority will be placed on justification through econometric evaluation of the effectiveness of innovative approaches for Russia and the rest of Eastern Europe in conditions of more dynamic deterioration of the climate and level of development of the national economy, so as to ensure the greatest synergistic effect on the development of agricultural sustainability.

Author Contributions

Conceptualization, A.S.; data curation, L.V.; formal analysis, L.N.; investigation, O.B. and A.V.; methodology, O.B.; project administration, A.S.; resources, A.V.; software, L.V.; supervision, A.S.; validation, L.N. and E.K.; visualization, E.K.; writing—original draft, N.B.; writing—review & editing, N.B. All authors have read and agreed to the published version of the manuscript.

Funding

This research received no external funding.

Data Availability Statement

The information base of the study was the statistical data of the Food and Agriculture Organization [1], Federal State Statistics Service [62], OECD.Stat [63] for the countries of Eastern Europe (Russia, Belarus, Bulgaria, Czech Republic, Hungary, Poland, Moldova, Romania, Slovakia, Ukraine) for the period 2001–2019.

Conflicts of Interest

The authors declare no conflict of interest.

Appendix A

Table A1. Levels of the hierarchy of agricultural economic development indicators.
iS(zi)P(zi)S(zi)∩P(zi)Level
1st iteration
Prod_CostProd_Cost, Imp, Add_Value_GR, ExpProd_Cost, Consump_Cap, Credit, FDI, Gov_Spend, Gov_Spend_EPProd_Cost-
ImpImp, Add_Value_GR, ExpImp, Prod_Cost, Consump_Cap, Credit, FDI, Gov_Spend, Gov_Spend_EP, Add_Value_GR, Accum_Cap, ExpImp, Add_Value_GR, Exp-
ExpExp, Add_Value_GR, ImpExp, Prod_Cost, Consump_Cap, Credit, FDI, Gov_Spend, Gov_Spend_EP, Add_Value_GR, Accum_Cap, ImpExp, Add_Value_GR, Imp-
Add_Value_GRAdd_Value_GR, Imp, ExpAdd_Value_GR, Imp, Exp, Prod_Cost, Consump_Cap, Credit, FDI, Gov_Spend, Gov_Spend_EP, Accum_CapAdd_Value_GR, Imp, Exp-
Accum_CapAccum_Cap, Add_Value_GR, Imp, ExpAccum_Cap, Credit, FDI, Gov_Spend, Consump_Cap, Prod_Cost, Gov_Spend_EPAccum_Cap-
Consump_ CapConsump_Cap, Accum_Cap, Add_Value_GR, Imp, Exp, Prod_CostConsump_Cap, Credit, FDI, Gov_Spend, Prod_Cost, Gov_Spend_EPConsump_Cap, Prod_Cost-
CreditCredit, Consump_ Cap, Accum_Cap, Add_Value_GR, Imp, Exp, Prod_CostCreditCredit1
FDIFDI, Consump_Cap, Accum_Cap, Add_Value_GR, Imp, Exp, Prod_CostFDIFDI1
Gov_SpendGov_Spend, Consump_Cap, Accum_Cap, Add_Value_GR, Imp, Exp, Prod_Cost, Gov_ResGov_Spend, Gov_ResGov_Spend, Gov_Res1
Gov_Spend_EPGov_Spend_EP, Prod_Cost, Imp, Add_Value_GR, ExpGov_Spend_EPGov_Spend_EP1
Gov_ResGov_Res, Prod_Cost, Imp, Add_Value_GR, Exp, Gov_SpendGov_Res, Gov_SpendGov_Res, Gov_Spend1
Enter_ResEnter_Res, Prod_Cost, Imp, Add_Value_GR, ExpEnter_ResEnter_Res1
2nd iteration
Prod_CostProd_Cost, Imp, Add_Value_GR, ExpProd_Cost, Consump_CapProd_Cost-
ImpImp, Add_Value_GR, ExpImp, Prod_Cost, Consump_Cap, Add_Value_GR, Accum_Cap, ExpImp, Add_Value_GR, Exp-
ExpExp, Add_Value_GR, ImpExp, Prod_Cost, Consump_Cap, Add_Value_GR, Accum_Cap, ImpExp, Add_Value_GR, Imp-
Add_Value_GRAdd_Value_GR, Imp, ExpAdd_Value_GR, Imp, Exp, Prod_Cost, Consump_ Cap, Accum_CapAdd_Value_GR, Imp, Exp-
Accum_CapAccum_Cap, Add_Value_GR, Imp, ExpAccum_Cap, Consump_Cap, Prod_CostAccum_Cap-
Consump_ CapConsump_Cap, Accum_Cap, Add_Value_GR, Imp, Exp, Prod_CostConsump_Cap, Prod_CostConsump_Cap, Prod_Cost2
3rd iteration
Prod_CostProd_Cost, Imp, Add_Value_GR, ExpProd_CostProd_Cost3
ImpImp, Add_Value_GR, ExpImp, Prod_Cost, Add_Value_GR, Accum_Cap, ExpImp, Add_Value_GR, Exp-
ExpExp, Add_Value_GR, ImpExp, Prod_Cost, Add_Value_GR, Accum_Cap, ImpExp, Add_Value_GR, Imp-
Add_Value_GRAdd_Value_GR, Imp, ExpAdd_Value_GR, Imp, Exp, Prod_Cost, Accum_CapAdd_Value_GR, Imp, Exp-
Accum_CapAccum_Cap, Add_Value_GR, Imp, ExpAccum_Cap, Prod_CostAccum_Cap-
4th iteration
ImpImp, Add_Value_GR, ExpImp, Add_Value_GR, Accum_Cap, ExpImp, Add_Value_GR, Exp-
ExpExp, Add_Value_GR, ImpExp, Add_Value_GR, Accum_Cap, ImpExp, Add_Value_GR, Imp-
Add_Value_GRAdd_Value_GR, Imp, ExpAdd_Value_GR, Imp, Exp, Accum_CapAdd_Value_GR, Imp, Exp-
Accum_CapAccum_Cap, Add_Value_GR, Imp, ExpAccum_CapAccum_Cap4
5th iteration
ImpImp, Add_Value_GR, ExpImp, Add_Value_GR, ExpImp, Add_Value_GR, Exp5
ExpExp, Add_Value_GR, ImpExp, Add_Value_GR, ImpExp, Add_Value_GR, Imp5
Add_Value_GRAdd_Value_GR, Imp, ExpAdd_Value_GR, Imp, ExpAdd_Value_GR, Imp, Exp5
Note: i—indicator; S(zi)—attainability set; P(zi)—precursor points set.

Appendix B

Table A2. Functions for determining the level of sustainable development indicators in agriculture.
IndicatorClassification Function
Economic Sustainability Indicators
Imp μ 1 = 1 ,   I m p 96.7 97.3 I m p 0.6 , 96.7 < I m p < 97.3 0 ,   97.3 I m p
μ 2 = 0 ,   I m p 96.7 ;   I m p 109.8 I m p 96.7 0.6 , 96.7 < I m p < 97.3 109.8 I m p 1 ,   108.8 < I m p < 109.8     1 ,   97.3 I m p 108.8
μ 3 = 0 ,   I m p 108.8 I m p 108.8 1 , 108.8 < I m p < 109.8 1 ,   I m p 109.8
Exp μ 1 = 1 ,   E x p 96.2 97.1 E x p 0.9 , 96.2 < E x p < 97.1 0 ,   E x p 97.1
μ 2 = 0 ,   E x p 96.2 ;   E x p 108.6 E x p 96.2 0.9 ,   96.2 < E x p < 97.1 108.6 E x p 1.5 , 107.1 < E x p < 108.6 1 ,   97.1 E x p 107.1
μ 3 = 0 ,   E x p 107.1 E x p 107.1 1.5 , 107.1 < E x p < 108.6 1 , E x p 108.6
Add_Value_ GR μ 1 = 1 ,   A d d _ V a l u e _   G R 90.1 92.8 A d d _ V a l u e _   G R 2.7 , 90.1 < A d d _ V a l u e _   G R < 0 ,   A d d _ V a l u e _   G R 92.8 92.8
μ 2 = 0 ,   A d d _ V a l u e _   G R 90.1 ,   A d d _ V a l u e _   G R 106.9 A d d _ V a l u e _   G R 90.1 2.7 , 90.1 < A d d _ V a l u e _   G R < 92.8 106.9 A d d _ V a l u e _   G R 1.5 , 105.4 < A d d _ V a l u e _   G R < 106.9 1 ,   92.8 A d d _ V a l u e _   G R 105.4
μ 3 = 0 ,   A d d _ V a l u e _   G R 105.4 A d d _ V a l u e _   G R 105.4 1.5 , 105.4 < A d d _ V a l u e _   G R < 106.9 1 , A d d _ V a l u e _   G R 106.9
Ecological Sustainability Indicators
Emissions_CO2 μ 1 = 1 ,   Emissions _ CO 2 97.9   98.8 Emissions _ CO 2 0.9 , 97.9 < Emissions _ CO 2 < 0 ,   Emissions _ CO 2 98.8 98.8
μ 2 = 0 ,   Emissions _ CO 2 97.9 ,   Emissions _ CO 2 100.7 Emissions _ CO 2 97.9 0.9 , 97.9 < Emissions _ CO 2 < 98.8   100.7 Emissions _ CO 2 0.4 , 100.3 < Emissions _ CO 2 < 100.7 1 ,   98.8 Emissions _ CO 2 100.3
μ 3 = 0 ,   Emissions _ CO 2 100.3 Emissions _ CO 2 100.3 0.4 , 100.3 < Emissions _ CO 2 < 100.7 1 ,   Emissions _ CO 2 100.7
Emissions_CH4 μ 1 = 1 ,   Emissions _ CH 4 96.1 97.8 Emissions _ CH 4 1.7 , 96.1 < Emissions _ CH 4 < 97.8 0 , Emissions _ CH 4   97.8
μ 2 = 0 ,   Emissions _ CH 4 96.1 , Emissions _ CH 4 101.4 Emissions _ CH 4 96.1 1.7 , 96.1 < Emissions _ CH 4 < 97.8 101.4 Emissions _ CH 4 1.3 , 100.1 < Emissions _ CH 4 < 101.4 1 , 97.8 Emissions _ CH 4 100.1
μ 3 = 0 ,   Emissions _ CH 4 100.1 Emissions _ CH 4 100.1 11.3 , 100.1 < Emissions _ CH 4 < 101.4 1 ,   Emissions _ CH 4 101.4
Emissions_N2O μ 1 = 1 ,   Emissions _ N 2 O 96.4 97.2 Emissions _ N 2 O 0.8 , 96.4 < Emissions _ N 2 O < 0 ,   Emissions _ N 2 O 97.2 97.2
μ 2 = 0 ,   Emissions _ N 2 O 96.4 ,   Emissions _ N 2 O 107.0 Emissions _ N 2 O 96.4 0.8 , 96.4 < Emissions _ N 2 O < 97.2 107.0 Emissions _ N 2 O 1.1 , 105.9 < Emissions _ N 2 O < 107.0 1 ,   97.2 Emissions _ N 2 O 105.9
μ 3 = 0 ,   Emissions _ N 2 O 105.9 Emissions _ N 2 O 105.9 1.1 , 105.9 < Emissions _ N 2 O < 107.0 1 ,   Emissions _ N 2 O 107.0
Emissions_AR5 μ 1 = 1 ,   E m i s s i o n s _ A R 5 97.9 98.1 E m i s s i o n s _ A R 5 0.2 , 97.9 < E m i s s i o n s _ A R 5 < 98.1   0 ,   E m i s s i o n s _ A R 5 98.1
μ 2 = 0 ,   E m i s s i o n s _ A R 5 97.9 ,   E m i s s i o n s _ A R 5 105.1 E m i s s i o n s _ A R 5 97.9 0.2 , 97.9 < E m i s s i o n s _ A R 5 < 98.1 105.1 E m i s s i o n s _ A R 5 0.3 , 104.8 < E m i s s i o n s _ A R 5 < 105.1 1 ,   98.1 E m i s s i o n s _ A R 5 104.8
μ 3 = 0 ,   E m i s s i o n s _ A R 5 104.8 E m i s s i o n s _ A R 5 104.8 0.3 , 104.8 < E m i s s i o n s _ A R 5 < 105.1 1 ,   E m i s s i o n s _ A R 5 105.1
Emissions_SAR μ 1 = 1 ,   E m i s s i o n s _ S A R 96.0 97.0 E m i s s i o n s _ S A R 1 , 96.0 < E m i s s i o n s _ S A R < 0 ,   E m i s s i o n s _ S A R 97.0 97.0
μ 2 = 0 ,   E m i s s i o n s _ S A R 96.0 ,   E m i s s i o n s _ S A R 104.5 E m i s s i o n s _ S A R 96.0 1 , 96.0 < E m i s s i o n s _ S A R < 97.0   104.5 E m i s s i o n s _ S A R 0.6 , 103.9 < E m i s s i o n s _ S A R < 104.5   1 ,   97.0 E m i s s i o n s _ S A R 103.9
μ 3 = 0 ,     E m i s s i o n s _ S A R 103.9 E m i s s i o n s _ S A R 103.9 0.6 , 103.9 < E m i s s i o n s _ S A R < 104.5 1 ,   E m i s s i o n s _ S A R 104.5  
Emissions_AR4 μ 1 = 1 ,   E m i s s i o n s _ A R 4 95.8 96.1 E m i s s i o n s _ A R 4 0.3 , 95.8 < E m i s s i o n s _ A R 4 < 0 ,   E m i s s i o n s _ A R 4 96.1 96.1
μ 2 = 0 ,   E m i s s i o n s _ A R 4 95.8 ,   E m i s s i o n s _ A R 4 103.0 E m i s s i o n s _ A R 4 95.8 0.3 , 95.8 < E m i s s i o n s _ A R 4 < 96.1 103.0 E m i s s i o n s _ A R 4 0.6 , 102.4 < E m i s s i o n s _ A R 4 < 103.0 1 ,   96.1 E m i s s i o n s _ A R 4 102.4
μ 3 = 0 ,   E m i s s i o n s _ A R 4 102.4 E m i s s i o n s _ A R 4 102.4 0.6 , 102.4 < E m i s s i o n s _ A R 4 < 103.0 1 ,   E m i s s i o n s _ A R 4   103.0
Social Sustainability Indicators
Employ μ 1 = 1 ,   E m p l o y 94.6 95.0 E m p l o y 0.4 , 94.6 < E m p l o y < 95.0 0 ,   E m p l o y 95.0
μ 2 = 0 , E m p l o y 94.6 ,     E m p l o y 101.4 E m p l o y 94.6 0.4 , 94.6 < E m p l o y < 95.0 101.4 E m p l o y 0.5 , 100.9 < E m p l o y < 101.4 1 ,   95.0 E m p l o y 100.9
μ 3 = 0 , E m p l o y 100.9 E m p l o y 100.9 0.5 , 100.9 < E m p l o y < 101.4 1 ,   E m p l o y 101.4
CPI μ 1 = 1 ,   C P I 99.0 101.3 C P I 2.3 , 99.0 < C P I < 101.3   0 , C P I   101.3
μ 2 = 0 , C P I 99.0 , C P I 120.3 C P I 99.0 2.3 , 99.0 < C P I < 101.3 120.3 C P I 0.9 , 119.4 < C P I < 120.3 1 ,   101.3 C P I 119.4
μ 3 = 0 , C P I 119.4 C P I 119.4 0.9 , 119.4 < C P I < 120.3 1 , C P I 120.3
Wages μ 1 = 1 ,   W a g e s 97.4 99.0 W a g e s 1.6 , 97.4 < W a g e s < 99.0 0 , W a g e s 99.0
μ 2 = 0 ,   W a g e s 97.4 ,     W a g e s 99.0 W a g e s 97.4 1.6 , 97.4 < W a g e s < 99.0 106.8 W a g e s 1.2 , 105.6 < W a g e s < 106.8 1 ,   99.0 W a g e s 105.6
μ 3 = 0 , W a g e s 105.6 W a g e s 105.6 1.2 , 105.6 < W a g e s < 106.8 1 , W a g e s 106.8
Note: μ1—probability of attributing the indicator to a low level; μ2—probability of attributing the indicator to an average level; μ3—probability of attributing the indicator to a high level.

References

  1. Food and Agriculture Organization. Data. Available online: http://www.fao.org/faostat/en/#data (accessed on 29 January 2021).
  2. Roobavannan, M.; Kandasamy, J.; Pande, S.; Vigneswaran, S.; Sivapalan, M. Sustainability of agricultural basin development under uncertain future climate and economic conditions: A socio-hydrological analysis. Ecol. Econ. 2020, 174, 106665. [Google Scholar] [CrossRef]
  3. Hertel, T.W.; de Lima, C.Z. Viewpoint: Climate impacts on agriculture: Searching for keys under the streetlight. Food Policy 2020, 95, 101954. [Google Scholar] [CrossRef]
  4. The European Environment Agency. Global and European Temperatures. 2020. Available online: https://www.eea.europa.eu/data-and-maps/indicators/global-and-european-temperature-10/assessment (accessed on 29 January 2021).
  5. EcoWatch. Europe’s Hot Summer Weather Could Worsen the Effects of COVID-19. 2020. Available online: https://www.ecowatch.com/europe-hot-summer-covid19-2645699288.html?rebelltitem=3#rebelltitem3 (accessed on 29 January 2021).
  6. Roshydromet. Roshydromet Released a Report on Climate Features in the Russian Federation for 2019. 2020. Available online: http://www.meteorf.ru/press/news/20626/ (accessed on 29 January 2021).
  7. Uzun, V.; Shagaida, N.; Lerman, Z. Russian agriculture: Growth and institutional challenges. Land Use Policy 2019, 83, 475–487. [Google Scholar] [CrossRef]
  8. Thomas, M.; Sullivan, S.; Briant, B. Sustainability and development in the former Soviet Union and Central and Eastern Eu-ropean countries. Int. J. Sustain. Hum. Dev. 2013, 1, 163–176. [Google Scholar]
  9. Climate Change Post. Farmers in Eastern Europe Will Suffer More from Climate Change than Their Colleagues in the West. 2016. Available online: https://www.climatechangepost.com/news/2016/10/31/farmers-eastern-europe-will-suffer-more-climate-ch/ (accessed on 29 January 2021).
  10. Lebedeva, L.G.; Orlova, L.V. The City as a Social Space of Interaction Between Generations. IOP Conf. Ser. Mater. Sci. Eng. 2019, 603, 042062. [Google Scholar] [CrossRef]
  11. United Nations Framework Convention on Climate Change. Technologies for Adaptation in the Agriculture Sector. 2014. Available online: https://unfccc.int/ttclear/misc_/StaticFiles/gnwoerk_static/TEC_column_L/544babb207e344b88bdd9fec11e6337f/bcc4dc66c35340a08fce34f057e0a1ed.pdf (accessed on 29 January 2021).
  12. Food Sustainability Index. BCFN Foundation. Available online: https://foodsustainability.eiu.com/country-ranking/ (accessed on 29 January 2021).
  13. Government of the Russian Federation. On the Approval of the Strategy for Sustainable Development of Rural Territories of the Russian Federation for the Period Up to 2030. 2017. Available online: http://docs.cntd.ru/document/420251273 (accessed on 29 January 2021).
  14. Government of the Russian Federation. The Concept of a Long-Term Socio-Economic Development of the Russian Federation until 2020. 2018. Available online: http://government.ru/info/6217/ (accessed on 29 January 2021).
  15. International Institute for Sustainable Development. Sustainable Development Goals. 2020. Available online: https://www.iisd.org/topics/sustainable-development-goals (accessed on 29 January 2021).
  16. Deloitte. Impact of COVID-19 on the Agri-Food Sector in Central and Eastern Europe. 2020. Available online: https://www2.deloitte.com/nl/nl/pages/consumer/articles/food-covid-19-impact-central-eastern-europe.html (accessed on 29 January 2021).
  17. International Telecommunication Union. Status of Digital Agriculture in 18 Countries of Europe and Central Asia; Telecommunication Development Bureau: Geneva, Switzerland, 2020. [Google Scholar]
  18. Virginia Tech College of Agriculture and Life Science and Virginia Tech Foundation. Supply Chains Can Collapse under the Weight of a Pandemic. 2020. Available online: https://globalagriculturalproductivity.org/supply-chains-can-collapse-under-the-weight-of-a-pandemic/ (accessed on 29 January 2021).
  19. European Environment Agency. Climate Change Adaptation in the Agriculture Sector in Europe; EEA Report No 04/2019; Publications Office of the European Union: Luxembourg, 2019. [Google Scholar]
  20. Niemmanee, T.; Kaveeta, R.; Potchanasin, C. Assessing the Economic, Social, and Environmental Condition for the Sustainable Agricultural System Planning in Ban Phaeo District, Samut Sakhonn Province, Thailand. Procedia Soc. Behav. Sci. 2015, 197, 2554–2560. [Google Scholar] [CrossRef] [Green Version]
  21. Kociszewski, K. Sustainable development of agriculture: Theoretical aspects and their implications. Econ. Environ. Stud. 2018, 18, 1119–1134. [Google Scholar] [CrossRef]
  22. De Gennaro, B.C.; Forleo, M.B. Sustainability perspectives in agricultural economics research and policy agenda. Agric. Food Econ. 2019, 7, 17. [Google Scholar] [CrossRef] [Green Version]
  23. Surya, B.; Abubakar, H.; Sahban, H.; Sakti, H.H. Spatial Transformation of New City Area: Economic, Social, and Environmental Sustainability Perspective of Makassar City, Indonesia. J. Southwest Jiaotong Univ. 2020, 55. [Google Scholar] [CrossRef]
  24. Oliveira, M.; Da Silva, F.G.; Ferreira, S.; Teixeira, M.; Damásio, H.; Ferreira, A.D.; Gonçalves, J.M. Innovations in Sustainable Agriculture: Case Study of Lis Valley Irrigation District, Portugal. Sustainability 2019, 11, 331. [Google Scholar] [CrossRef] [Green Version]
  25. Ditzler, L.; Klerkx, L.; Chan-Dentoni, J.; Posthumus, H.; Krupnik, T.J.; Ridaura, S.L.; Andersson, J.A.; Baudron, F.; Groot, J.C.J. Affordances of agricultural systems analysis tools: A review and framework to enhance tool design and implementation. Agric. Syst. 2018, 164, 20–30. [Google Scholar] [CrossRef]
  26. Yun, J.H.J.; Jeong, E.S.; Zhao, X.; Hahm, S.D.; Kim, K.H. Collective Intelligence: An Emerging World in Open Innovation. Sustainability 2019, 11, 4495. [Google Scholar] [CrossRef] [Green Version]
  27. Yun, J.H.J.; Liu, Z. Micro- and Macro-Dynamics of Open Innovation with a Quadruple-Helix Model. Sustainability 2019, 11, 3301. [Google Scholar] [CrossRef] [Green Version]
  28. Medeiros, G.; Binotto, E.; Caleman, S.; Florindo, T. Open Innovation in Agrifood Chain: A Systematic Review. J. Technol. Manag. Innov. 2016, 11, 108–116. [Google Scholar] [CrossRef] [Green Version]
  29. Berthet, E.T.; Hickey, G.M.; Klerkx, L. Opening design and innovation processes in agriculture: Insights from design and management sciences and future directions. Agric. Syst. 2018, 165, 111–115. [Google Scholar] [CrossRef]
  30. El Bilali, H. Relation between innovation and sustainability in the agro-food system. Ital. J. Food Sci. 2018, 30, 200–225. [Google Scholar] [CrossRef]
  31. Glinskiy, V.; Serga, L.; Alekseev, M.; Samotoy, N.; Simonova, E. The Development of the Food Industry as a Condition for Improving Russia’s National Security. Procedia Manuf. 2018, 21, 838–845. [Google Scholar] [CrossRef]
  32. Rudoi, E.V.; Petukhova, M.S.; Ryumkin, S.V.; Dobryanskaya, S.L.; Molyavko, A.V. Crop production in Russia 2030: Scenarios based on data from the scientific and technological development of the sector. Data Brief 2019, 25, 103980. [Google Scholar] [CrossRef] [PubMed]
  33. Ujj, A.; Bálint, C.; Goda, P.; Jancsovszka, P.; Mutua, K. Development of the Agricultural Innovation Brokerage Concept in Eastern European Countries, Based on a Hungarian Situation Analysis. Eur. Countrys. 2020, 12, 67–84. [Google Scholar] [CrossRef]
  34. Udalov, A.; Udalova, Z.; Postnikova, L.; Postnikova, D. Foreign experience in the development of agricultural business. IOP Conf. Ser. Earth Environ. Sci. 2019, 403, 012148. [Google Scholar] [CrossRef]
  35. Onegina, V.; Megits, N.; Antoshchenkova, V.; Boblovskyi, O. Outcome of capital investment on labor productivity in agriculture sector of Ukraine. J. East. Eur. Central Asian Res. 2020, 7, 12–25. [Google Scholar] [CrossRef]
  36. Shik, O.V. Public expenditure for agricultural sector in Russia: Does it promote growth? Russ. J. Econ. 2020, 6, 42–55. [Google Scholar] [CrossRef] [Green Version]
  37. Mensah, J. Sustainable development: Meaning, history, principles, pillars, and implications for human action: Literature review. Cogent Soc. Sci. 2019, 5, 1653531. [Google Scholar] [CrossRef]
  38. Duran, D.; Gogan, L.; Artene, A.; Duran, V. The Components of Sustainable Development—A Possible Approach. Procedia Econ. Financ. 2015, 26, 806–811. [Google Scholar] [CrossRef] [Green Version]
  39. Campagnolo, L.; Carraro, C.; Eboli, F.; Farnia, L.; Parrado, R.; Pierfederici, R. The Ex-Ante Evaluation of Achieving Sustainable Development Goals. Soc. Indic. Res. 2018, 136, 73–116. [Google Scholar] [CrossRef]
  40. Whitcraft, A.K.; Becker-Reshef, I.; Justice, C.O.; Gifford, L.; Kavvada, A.; Jarvis, I. No pixel left behind: Toward integrating Earth Observations for agriculture into the United Nations Sustainable Development Goals framework. Remote Sens. Environ. 2019, 235, 111470. [Google Scholar] [CrossRef]
  41. Ghodsvali, M.; Krishnamurthy, S.; Vries, B. Review of transdisciplinary approaches to food-water-energy nexus: A guide towards sustainable development. Environ. Sci. Policy 2019, 101, 266–278. [Google Scholar] [CrossRef]
  42. Sajjad, H. Assessing farm-level agricultural sustainability using site-specific indicators and sustainable livelihood security index: Evidence from Vaishali district, India. Community Dev. 2016, 47, 602–619. [Google Scholar] [CrossRef]
  43. El Chami, D.; Daccache, A. Assessing sustainability of winter wheat production under climate changescenarios in a humid climate—An integrated modelling framework. Agric. Syst. 2015, 140, 19–25. [Google Scholar] [CrossRef]
  44. Abdallah, S.B.; Elfkih, S.; Parra-López, C. A sustainability comparative assessment of Tunisian organic and conventional olive growing systems based on the AHP methodology. New Medit 2018, 3, 51–68. [Google Scholar] [CrossRef]
  45. Dhraief, M.Z.; Bedhiaf, S.; Dhehibi, B.; Oueslati-Zlaoui, M.; Jebali, O.; Ben-Youssef, S. Factors affecting innovative technologies adoption by livestock holders in arid area of Tunisia. New Medit 2019, 4, 3–18. [Google Scholar] [CrossRef] [Green Version]
  46. Elias, M.; Marsh, R. Innovations in Agricultural and Food Systems Sustainability in California. Case Stud. Environ. 2020, 4, 1–14. [Google Scholar] [CrossRef]
  47. Martinho, V.J. Best management practices from agricultural economics: Mitigating air, soil and water pollution. Sci. Total Environ. 2019, 688, 346–360. [Google Scholar] [CrossRef] [PubMed]
  48. Zhen, L.; Routray, J.K. Operational Indicators for Measuring Agricultural Sustainability in Developing Countries. Environ. Manag. 2003, 32, 34–46. [Google Scholar] [CrossRef] [PubMed] [Green Version]
  49. Struik, P.; Kuyper, T. Sustainable intensification in agriculture: The richer shade of green. A review. Agron. Sustain. Dev. 2017, 37, 39. [Google Scholar] [CrossRef]
  50. Elawama, A.S.A.B. The Influence of Natural and Human Factors on the Sustainability of Agriculture in Azzawia Libya. Ph.D. Thesis, Universiti Sains Malaysia, Penang, Malaysia, April 2016. [Google Scholar]
  51. Li, M.; Wang, J.; Chen, Y. Evaluation and Influencing Factors of Sustainable Development Capability of Agriculture in Countries along the Belt and Road Route. Sustainability 2019, 11, 2004. [Google Scholar] [CrossRef] [Green Version]
  52. Pancino, B.; Blasi, E.; Rappoldt, A.; Pascucci, S.; Ruini, L.; Ronchi, C. Partnering for sustainability in agri-food supply chains: The case of Barilla Sustainable Farming in the Po Valley. Agric. Food Econ. 2019, 7, 13. [Google Scholar] [CrossRef] [Green Version]
  53. Sebestyén, V.; Bulla, M.; Rédey, Á.; Abonyi, J. Data-driven multilayer complex networks of sustainable development goals. Data Brief 2019, 25, 104049. [Google Scholar] [CrossRef]
  54. El Bilali, H. Innovation-Sustainability Nexus in Agriculture Transition: Case of Agroecology. Open Agric. 2019, 4, 1–16. [Google Scholar] [CrossRef]
  55. Sumardjo, A.F. Organic medical plants urban farming based on family empowerment on Bekasi, West Java. J. Hunan Univ. Nat. Sci. 2020, 47, 34–41. [Google Scholar]
  56. Pigford, A.-A.E.; Hickey, G.M.; Klerkx, L. Beyond agricultural innovation systems? Exploring an agricultural innovation ecosystems approach for niche design and development in sustainability transitions. Agric. Syst. 2018, 164, 116–121. [Google Scholar] [CrossRef]
  57. Zilberman, D.; Lipper, L.; McCarthy, N.; Gordon, B. Innovation in Response to Climate Change. In Climate Smart Agriculture. Natural Resource Management and Policy; Lipper, L., McCarthy, N., Zilberman, D., Asfaw, S., Branca, G., Eds.; Springer: Cham, Switzerland, 2018; Volume 52, pp. 49–74. [Google Scholar] [CrossRef] [Green Version]
  58. Figueiredo, P.N. New challenges for public research organisations in agricultural innovation in developing economies: Evidence from Embrapa in Brazil’s soybean industry. Q. Rev. Econ. Financ. 2016, 62, 21–32. [Google Scholar] [CrossRef] [Green Version]
  59. Saleh, H.; Abubakar, H.; Suriani, S. Determining Factors Affecting the Interest in Investment in Bulukumba Area of South Sulawesi. J. Southwest Jiaotong Univ. 2020, 55. [Google Scholar] [CrossRef]
  60. Cline, W.R. Global Warming and Agriculture. International Monetary Fund. 2008. Available online: https://www.imf.org/external/pubs/ft/fandd/rus/2008/03/pdf/cline.pdf (accessed on 28 November 2020).
  61. Menke, W. Factor Analysis. In Geophysical Data Analysis, 4th ed.; Academic Press: New York, NY, USA, 2018; pp. 207–222. [Google Scholar]
  62. Federal State Statistics Service. 2020. Available online: https://rosstat.gov.ru/folder/10705 (accessed on 10 November 2020).
  63. OECD.Stat. Available online: https://stats.oecd.org// (accessed on 10 November 2020).
  64. Nedosekin, A.O.; Frolov, S.N. Linguistic analysis of histograms of economic factors. Proc. Voronezh State Univ. Ser. Econ. Manag. 2008, 2, 48–55. [Google Scholar]
  65. Krawczak, M.; Szkatuła, G. On matching of intuitionistic fuzzy sets. Inf. Sci. 2020, 517, 254–274. [Google Scholar] [CrossRef]
  66. Bakari, S.; Ahmadi, A. Why is South Africa Still a Developing Country? Int. Acad. J. Econ. 2018, 5, 1–19. [Google Scholar] [CrossRef]
  67. Bakari, S.; Mabrouki, M. Impact of exports and imports on economic growth: New evidence from Panama. J. Smart Econ. Growth 2017, 2, 67–79. [Google Scholar]
  68. Saeed, J.A.A.; Hussain, A.M. Impact of exports and imports on economic growth: Evidence from Tunisia. J. Emerg. Trends Econ. Manag. Sci. 2015, 6, 13–21. [Google Scholar]
  69. Dharmawan, L.; Muljono, P.; Hapsari, D.R.; Purwanto, B.P. Digital information development in agriculture extension in facing new normal era during COVID-19 pandemics. J. Hunan Univ. Nat. Sci. 2020, 47, 64–73. [Google Scholar]
  70. Yakhneeva, I.V.; Agafonova, A.N.; Fedorenko, R.V.; Shvetsova, E.V.; Filatova, D.V. On collaborations between software producer and customer: A kind of two-player strategic game. In Digital Transformation of the Economy: Challenges, Trends and New Opportunities. Advances in Intelligent Systems and Computing; Ashmarina, S., Mesquita, A., Vochozka, M., Eds.; Springer: Cham, Switzerland, 2020; Volume 908, pp. 570–580. [Google Scholar]
  71. Ageeva, N.A.; Shapoval, G.N.; Vlasova, V.N.; Kartashova, E.A.; Safronenko, A.V.; Sidorenko, Y.A. High level of legal awareness formation in medical students. Way from competencies to competence. Espacios 2019, 40, 11. [Google Scholar]
  72. Abdullayeva, K.; Trushev, A.; Ergaliev, K.; Erlanova, A. Linguistic picture of the world in the poetry of M. Kopeev. Utopía Prax. Latinoam. 2020, 25, 14–28. [Google Scholar]
Figure 1. Cause-and-effect graph of the links between agricultural economic sustainability indicators in Russia and other Eastern European countries.
Joitmc 07 00074 g001
Figure 2. Integral assessment of sustainable development of agriculture in Russia. Note: 0.81 *—intermediate level of Sustain_Dev indicator (25%—probability of relating to a medium level, 75%—probability of relating to a high level); 0.79 **—intermediate level of Sustain_Dev indicator (50%—probability of relating to a medium level, 50%—probability of relating to a high level).
Joitmc 07 00074 g002
Table 1. Indicators of the significance of causal links between the indicators of economic sustainability of agriculture in Russia and Eastern European countries.
LinksProb.LLinksProb.L
Prod_CostImp0.00071CreditConsump_Cap0.00201
Prod_CostExp0.00021FDIAdd_Value_GR0.00061
Prod_CostAdd_Value_GR0.00091FDIAccum_Cap0.00161
Prod_CostConsump_Cap0.00121FDIConsump_Cap0.00211
ImpAdd_Value_GR0.00191Gov_SpendProd_Cost0.00291
ExpAdd_Value_GR0.00201Gov_SpendAdd_Value_GR0.00111
Add_Value_GRImp0.00011Gov_SpendAccum_Cap0.00201
Add_Value_GRExp0.00001Gov_SpendConsump_Cap0.00231
Accum_CapAdd_Value_GR0.00301Gov_SpendGov_Res0.00011
Consump_ CapProd_Cost0.00251Gov_Spend_EPProd_Cost0.00041
Consump_ CapExp0.00281Gov_ResProd_Cost0.01061
Consump_ CapAdd_Value_GR0.00161Gov_ResAdd_Value_GR0.00011
Consump_ CapAccum_Cap0.00051Gov_ResGov_Spend0.00011
CreditProd_Cost0.00071Enter_ResProd_Cost0.02671
CreditAdd_Value_GR0.00021Enter_ResAdd_Value_GR0.00011
CreditAccum_Cap0.00131
Note: Prob.—probability of accepting the hypothesis that there are no causal links between indicators; L—number of lags.
Table 2. Characteristics of models of the influence of financing indicators on the sustainability of agriculture development of Eastern European countries.
Dependent VariableIndependent VariableModelModel Adequacy Indicators (Calculated Criteria Values)Elasticity Coefficients of Dependent Variable on Independent Variable, %
F-Criteriont-Criterion
Econ_SustCreditEcon_Sust = 0.37 × Credit + 0.65 × FDI + 0.28 × Gov_Spend + 0.67 × Gov_Res + 0.72 × Enter_Res − 2.1238.413.300.81
FDI3.250.80
Gov_Spend3.010.62
Gov_Res4.611.41
Enter_Res4.701.50
Ecol_SustCreditEcol_Sust = 0.37 × Credit + 0.37 × Gov_Spend + 0.78 × Gov_Spend_EP + 0.44 × Gov_Res + 0.40 × Enter_Res − 1.6819.383.130.78
Gov_Spend3.170.79
Gov_Spend_EP4.921.66
Gov_Res3.510.90
Enter_Res3.320.81
Soc_ SustCreditSoc_Sust = 0.45 × Credit + 0.39 × Gov_Spend + 0.29 × Gov_Res + 0.26 × Enter_Res − 0.9822.043.490.90
Gov_Spend3.180.79
Gov_Res2.560.56
Enter_Res2.490.49
Publisher’s Note: MDPI stays neutral with regard to jurisdictional claims in published maps and institutional affiliations.

