Emotional Impact of Dishes versus Wines on Restaurant Diners: From Haute Cuisine Open Innovation

 ,
,  , and
, and
Abstract
:1. Introduction
2. Materials and Methods
2.1. Objectives
2.2. Research Instrument
2.3. Sample
2.4. Data Collection and Analysis
3. Results
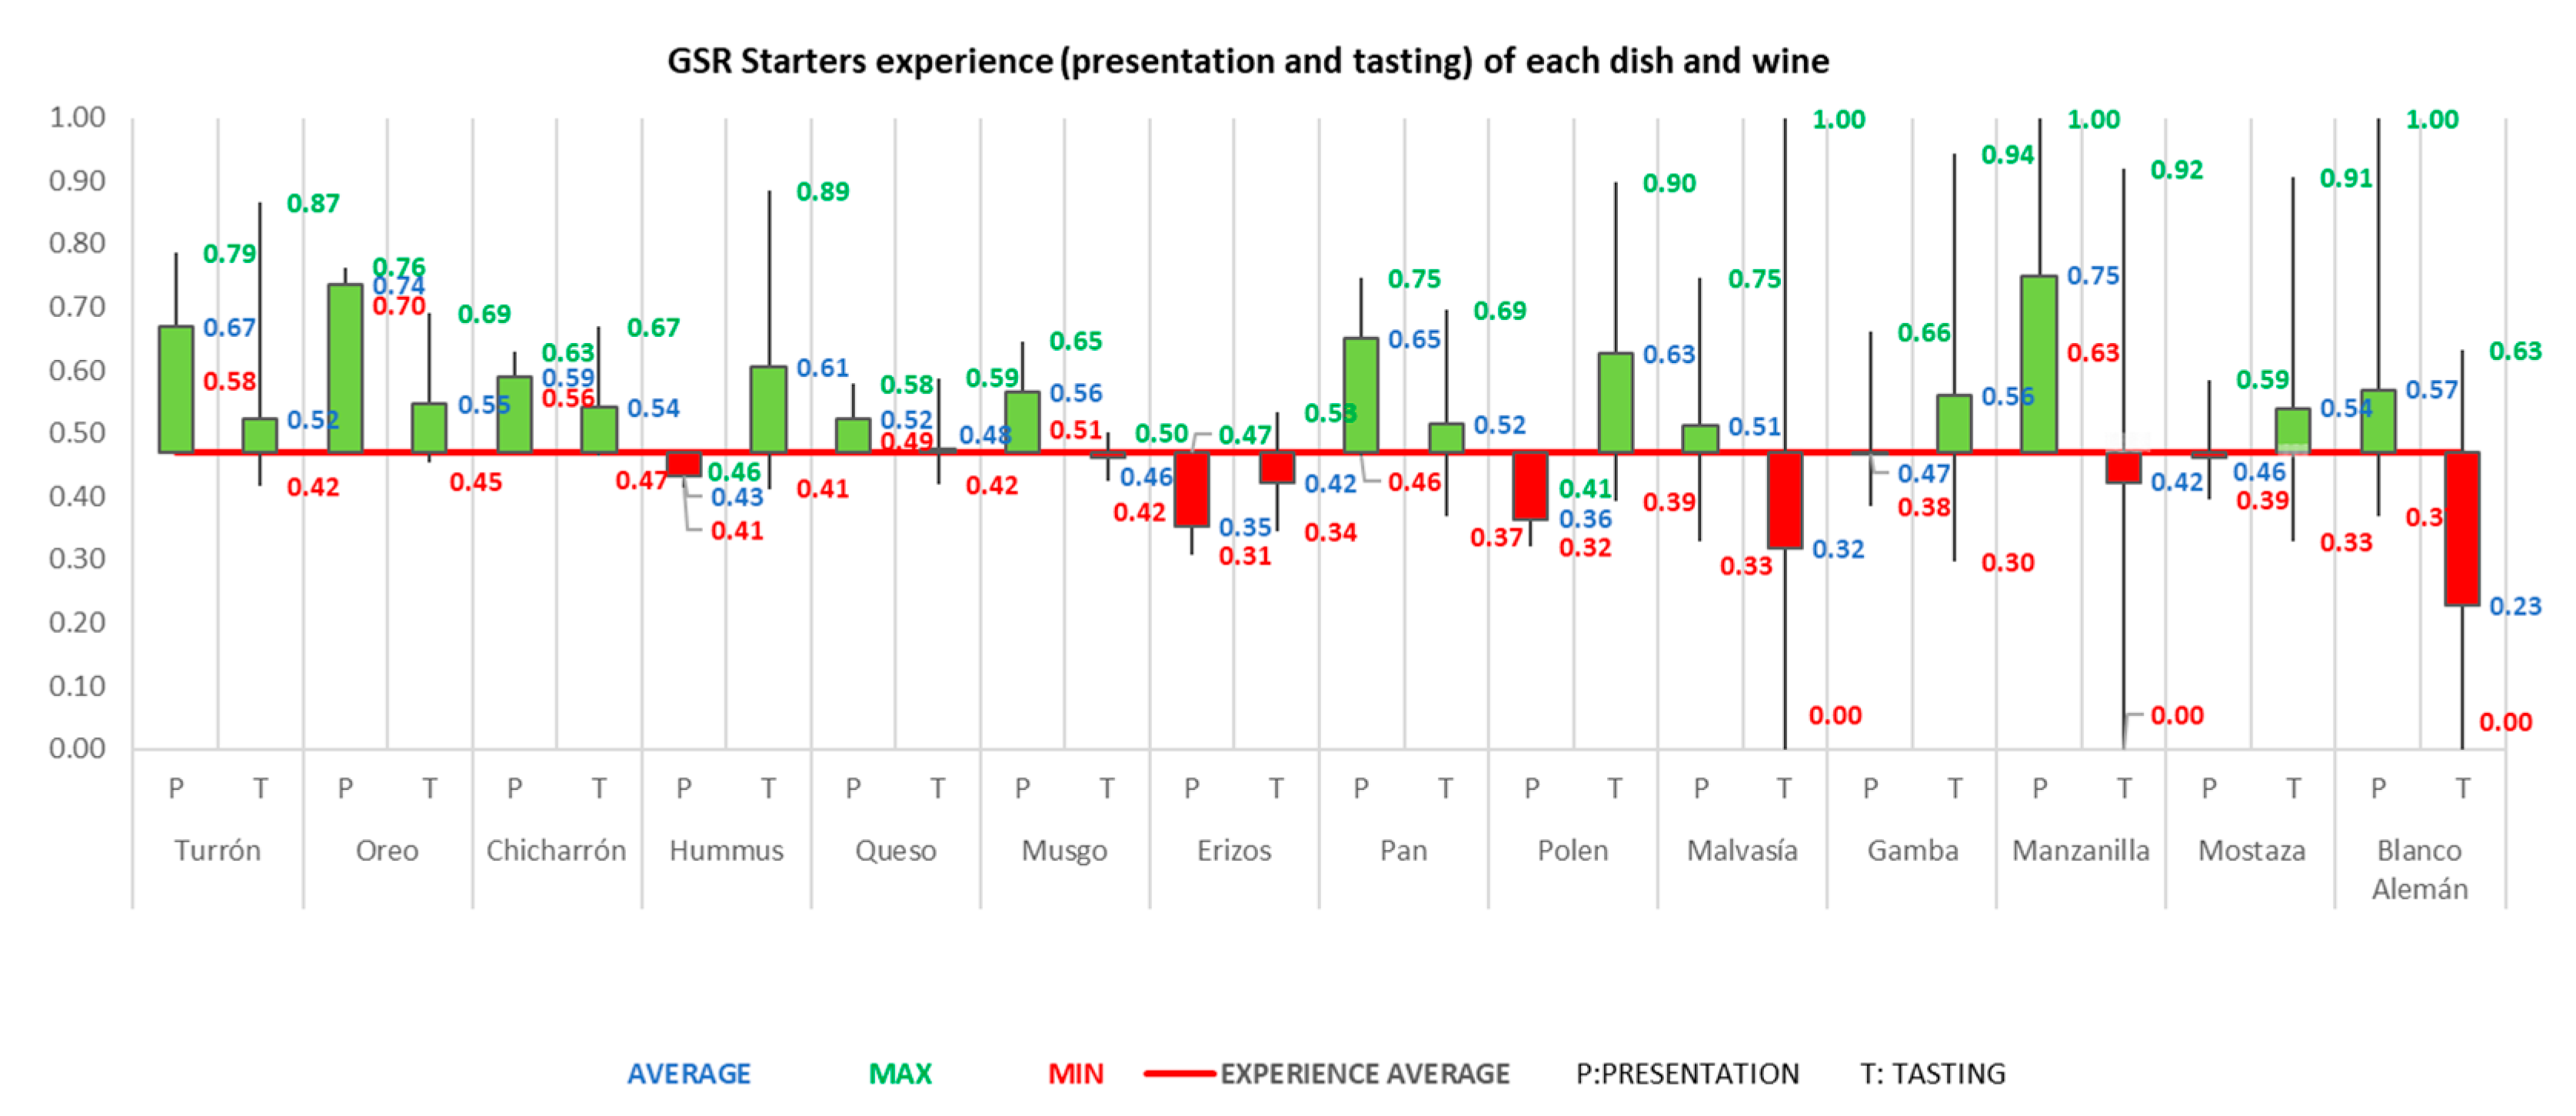
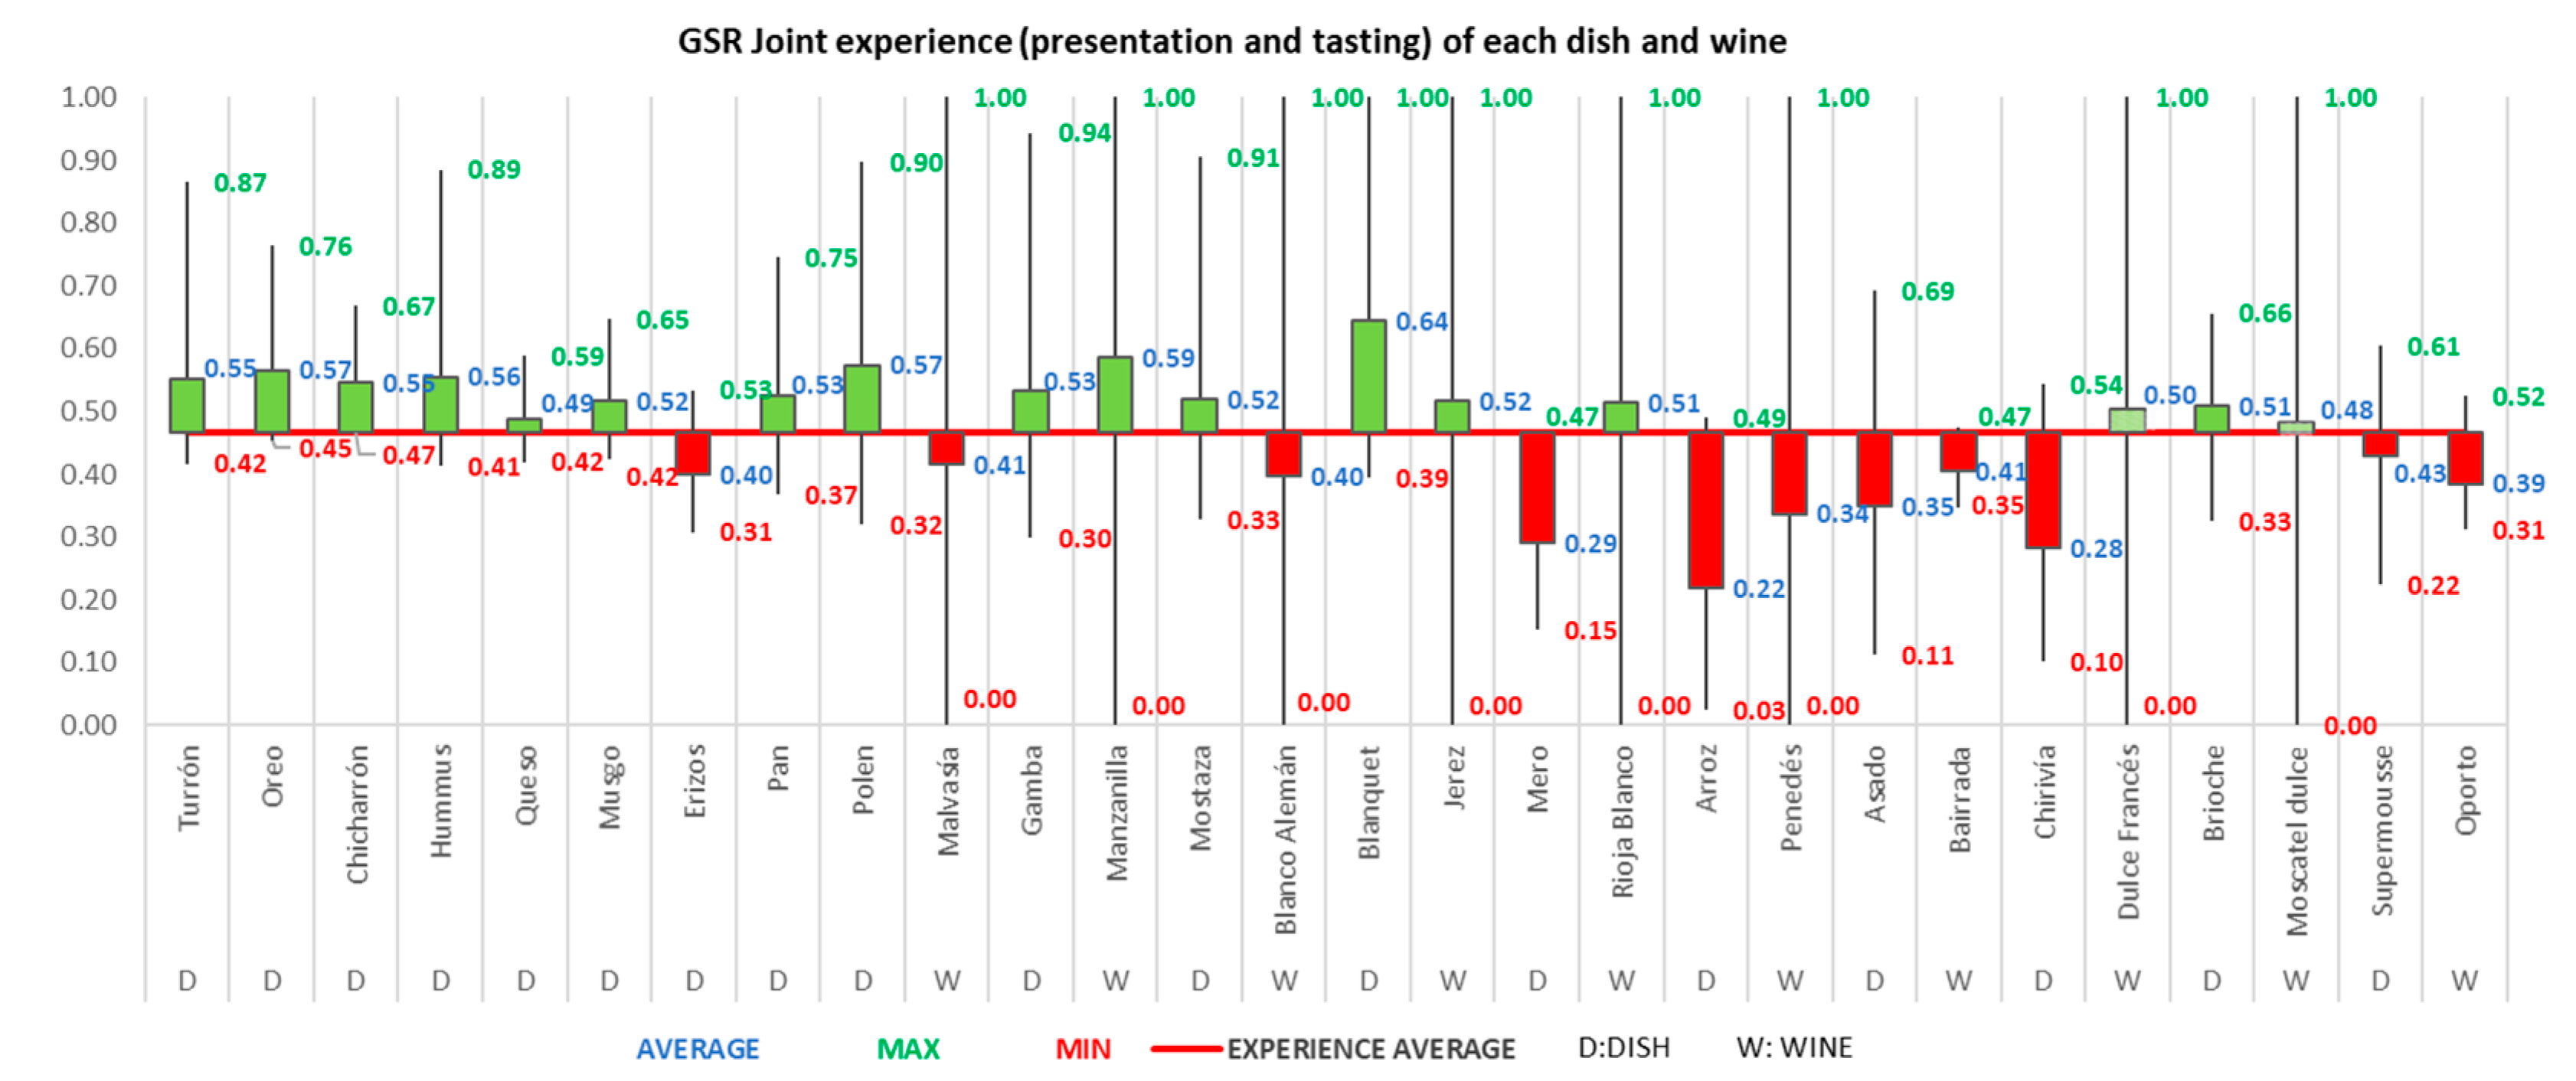
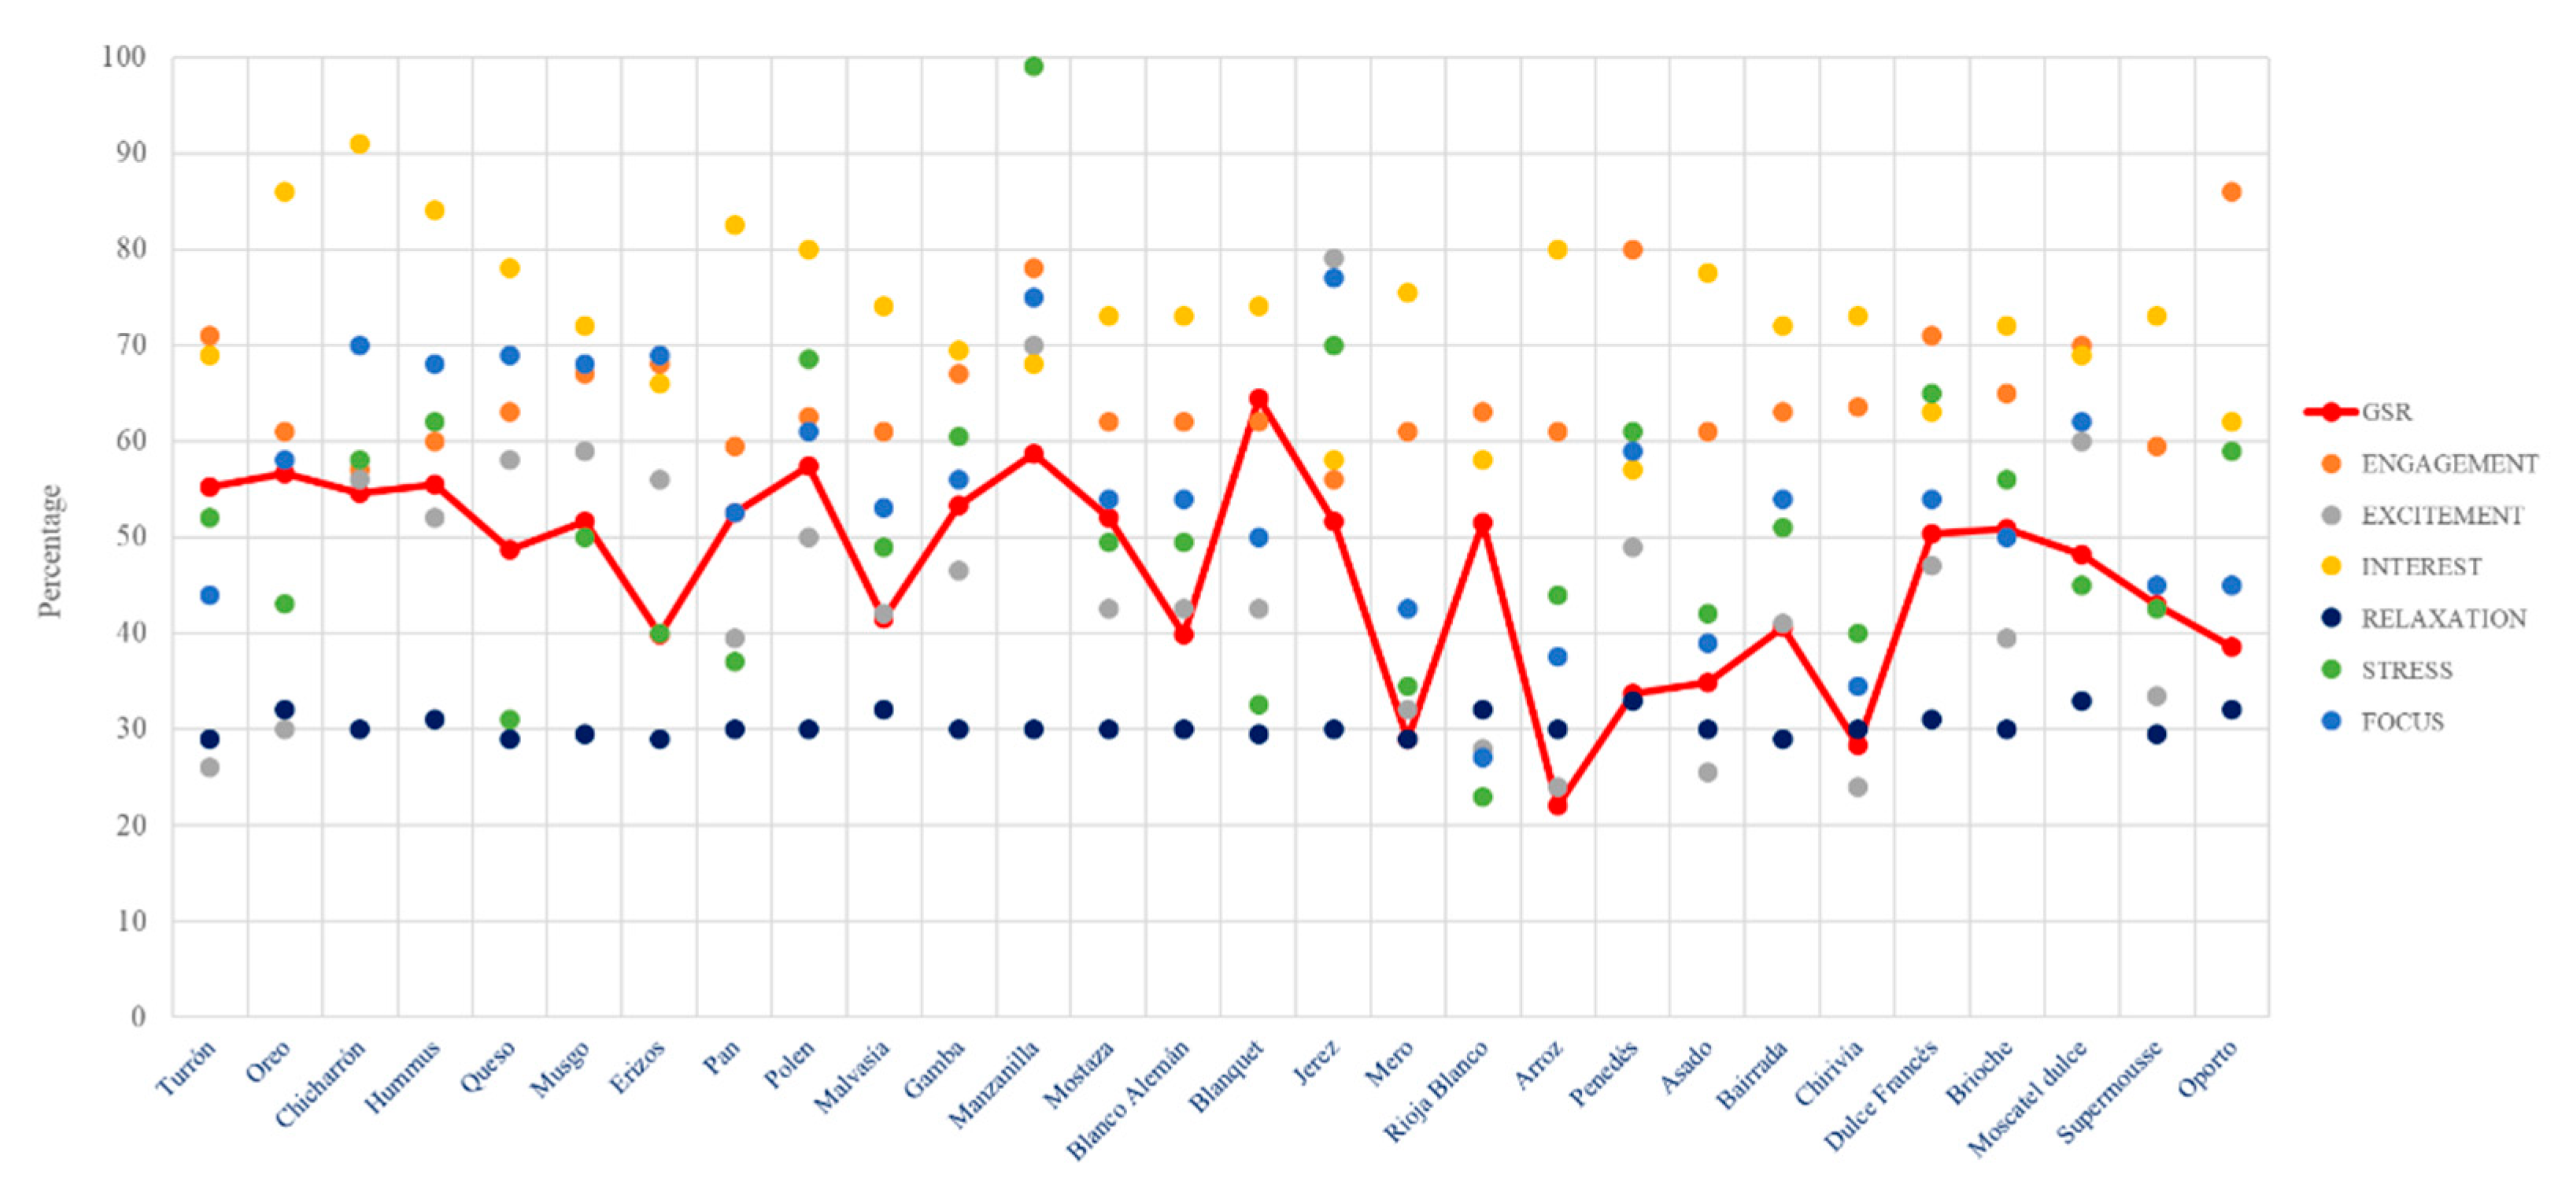
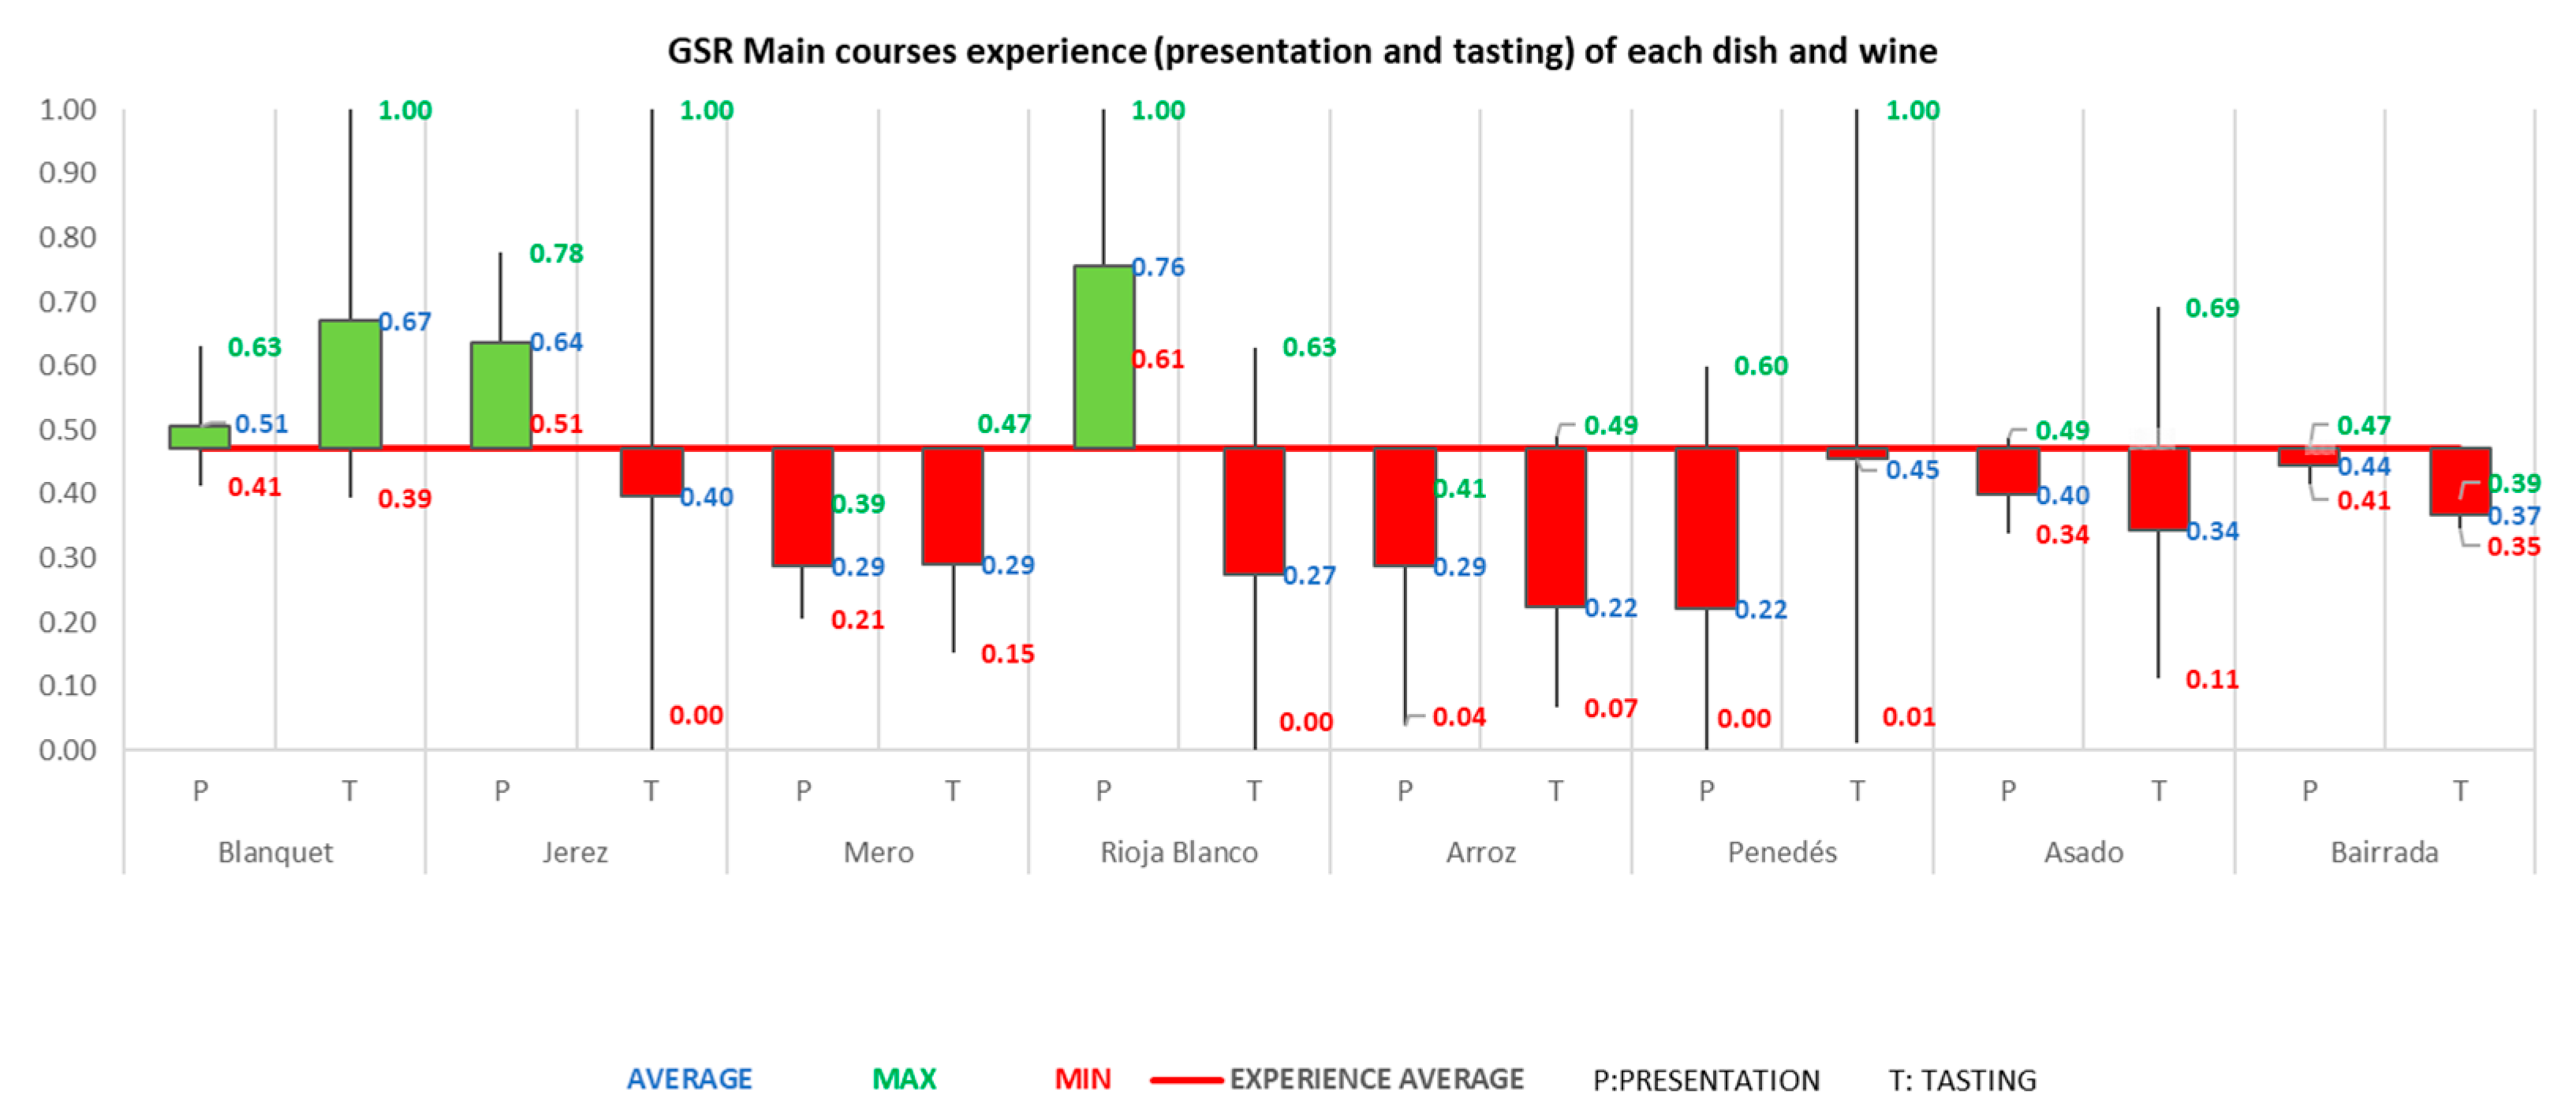
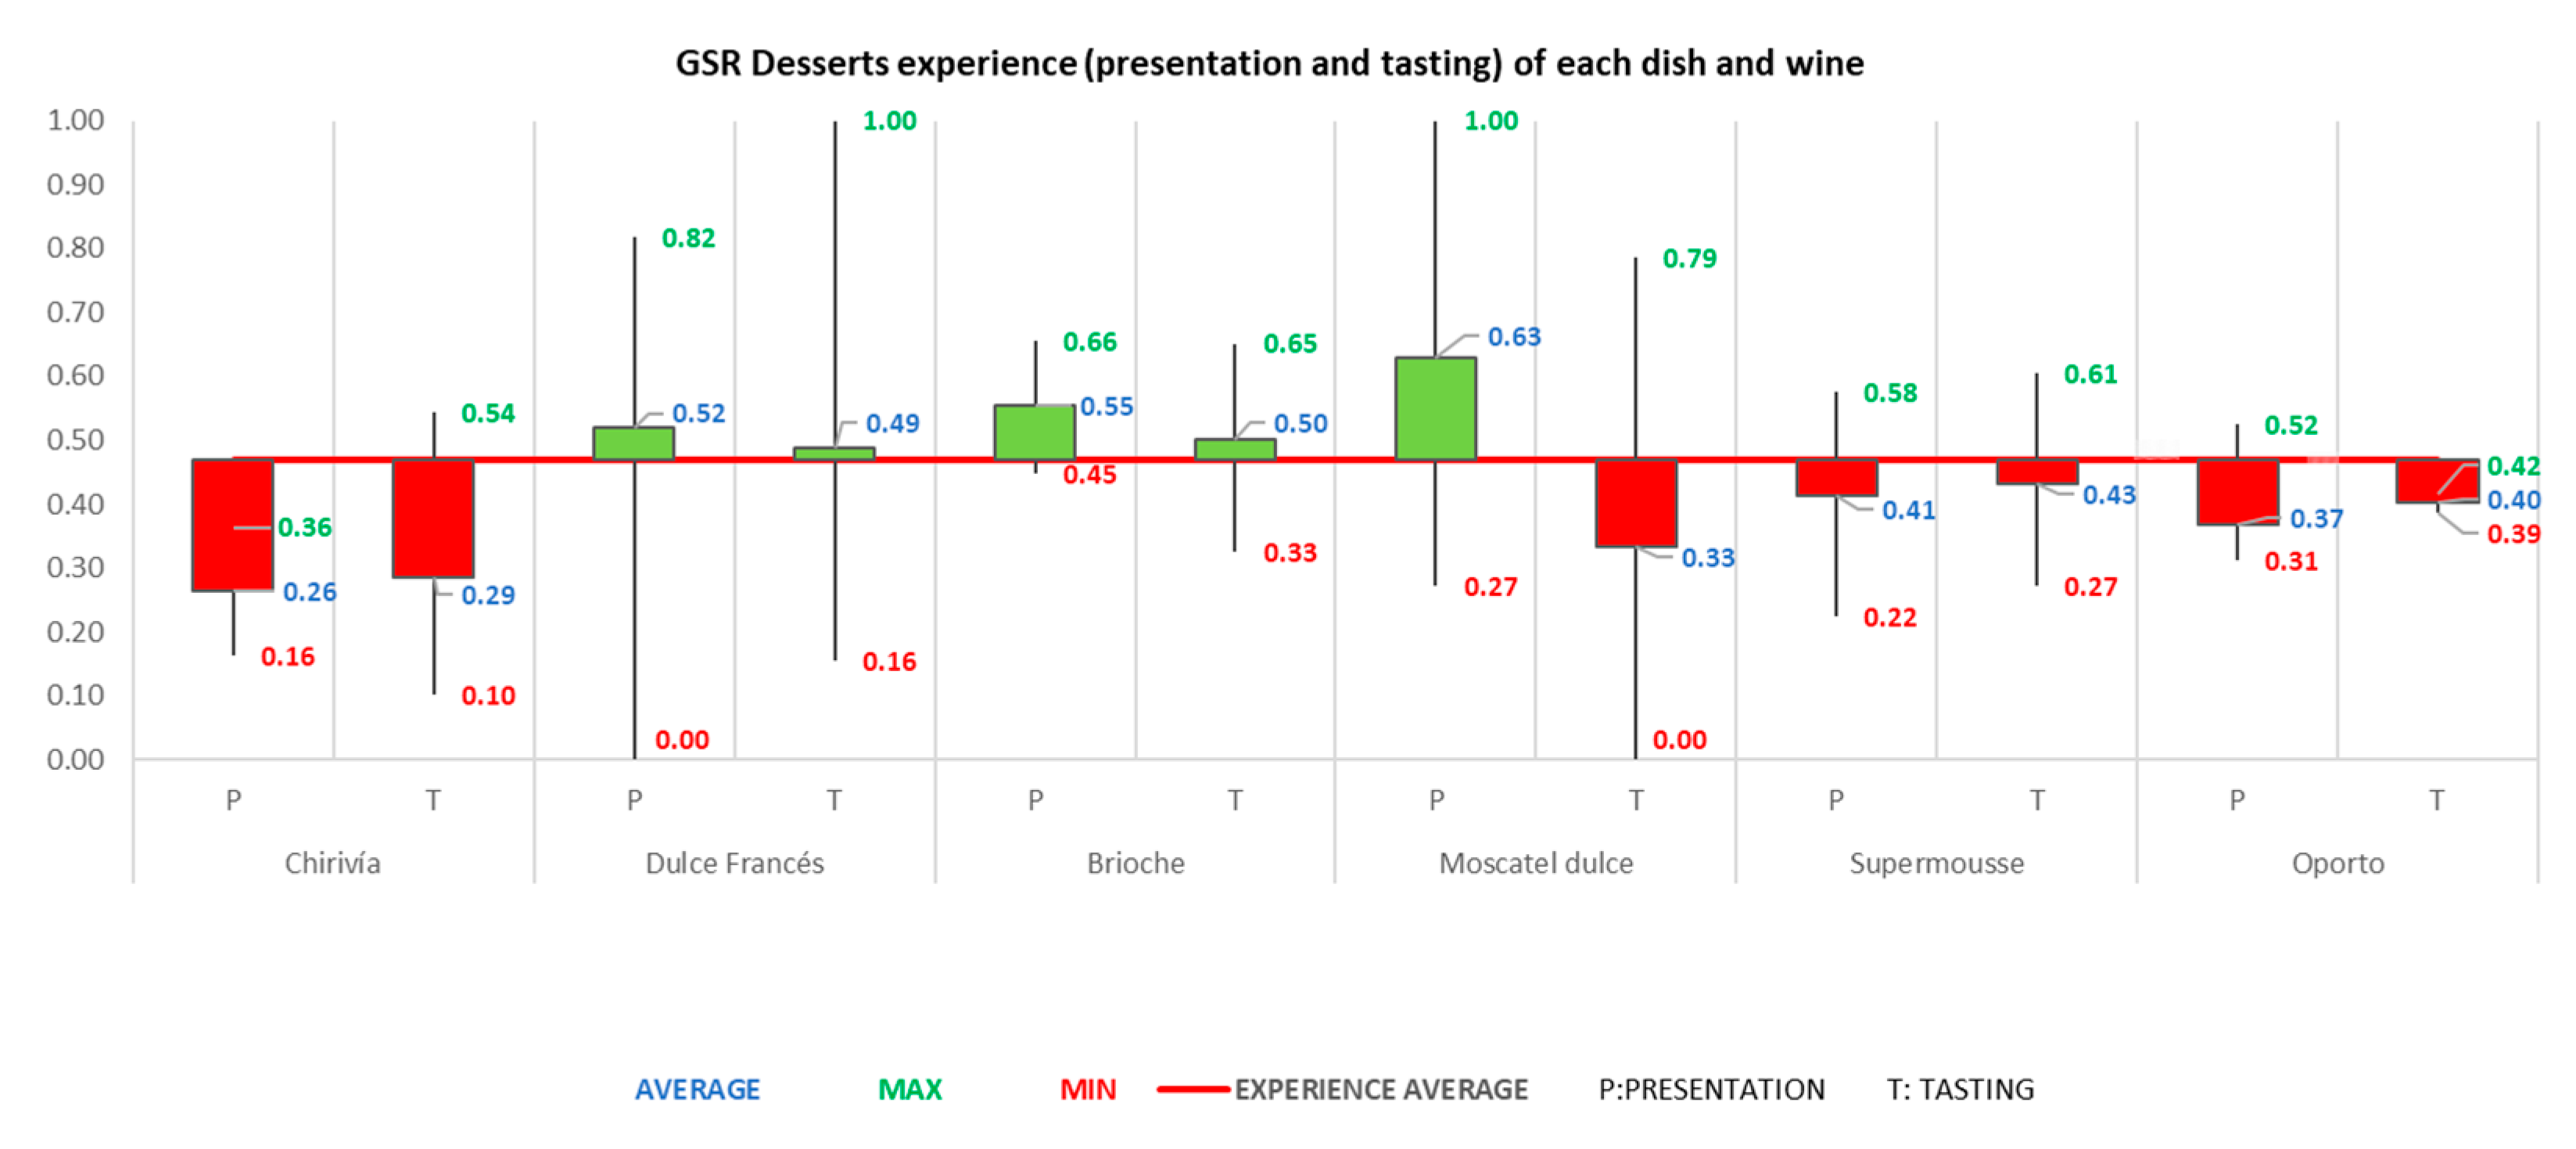
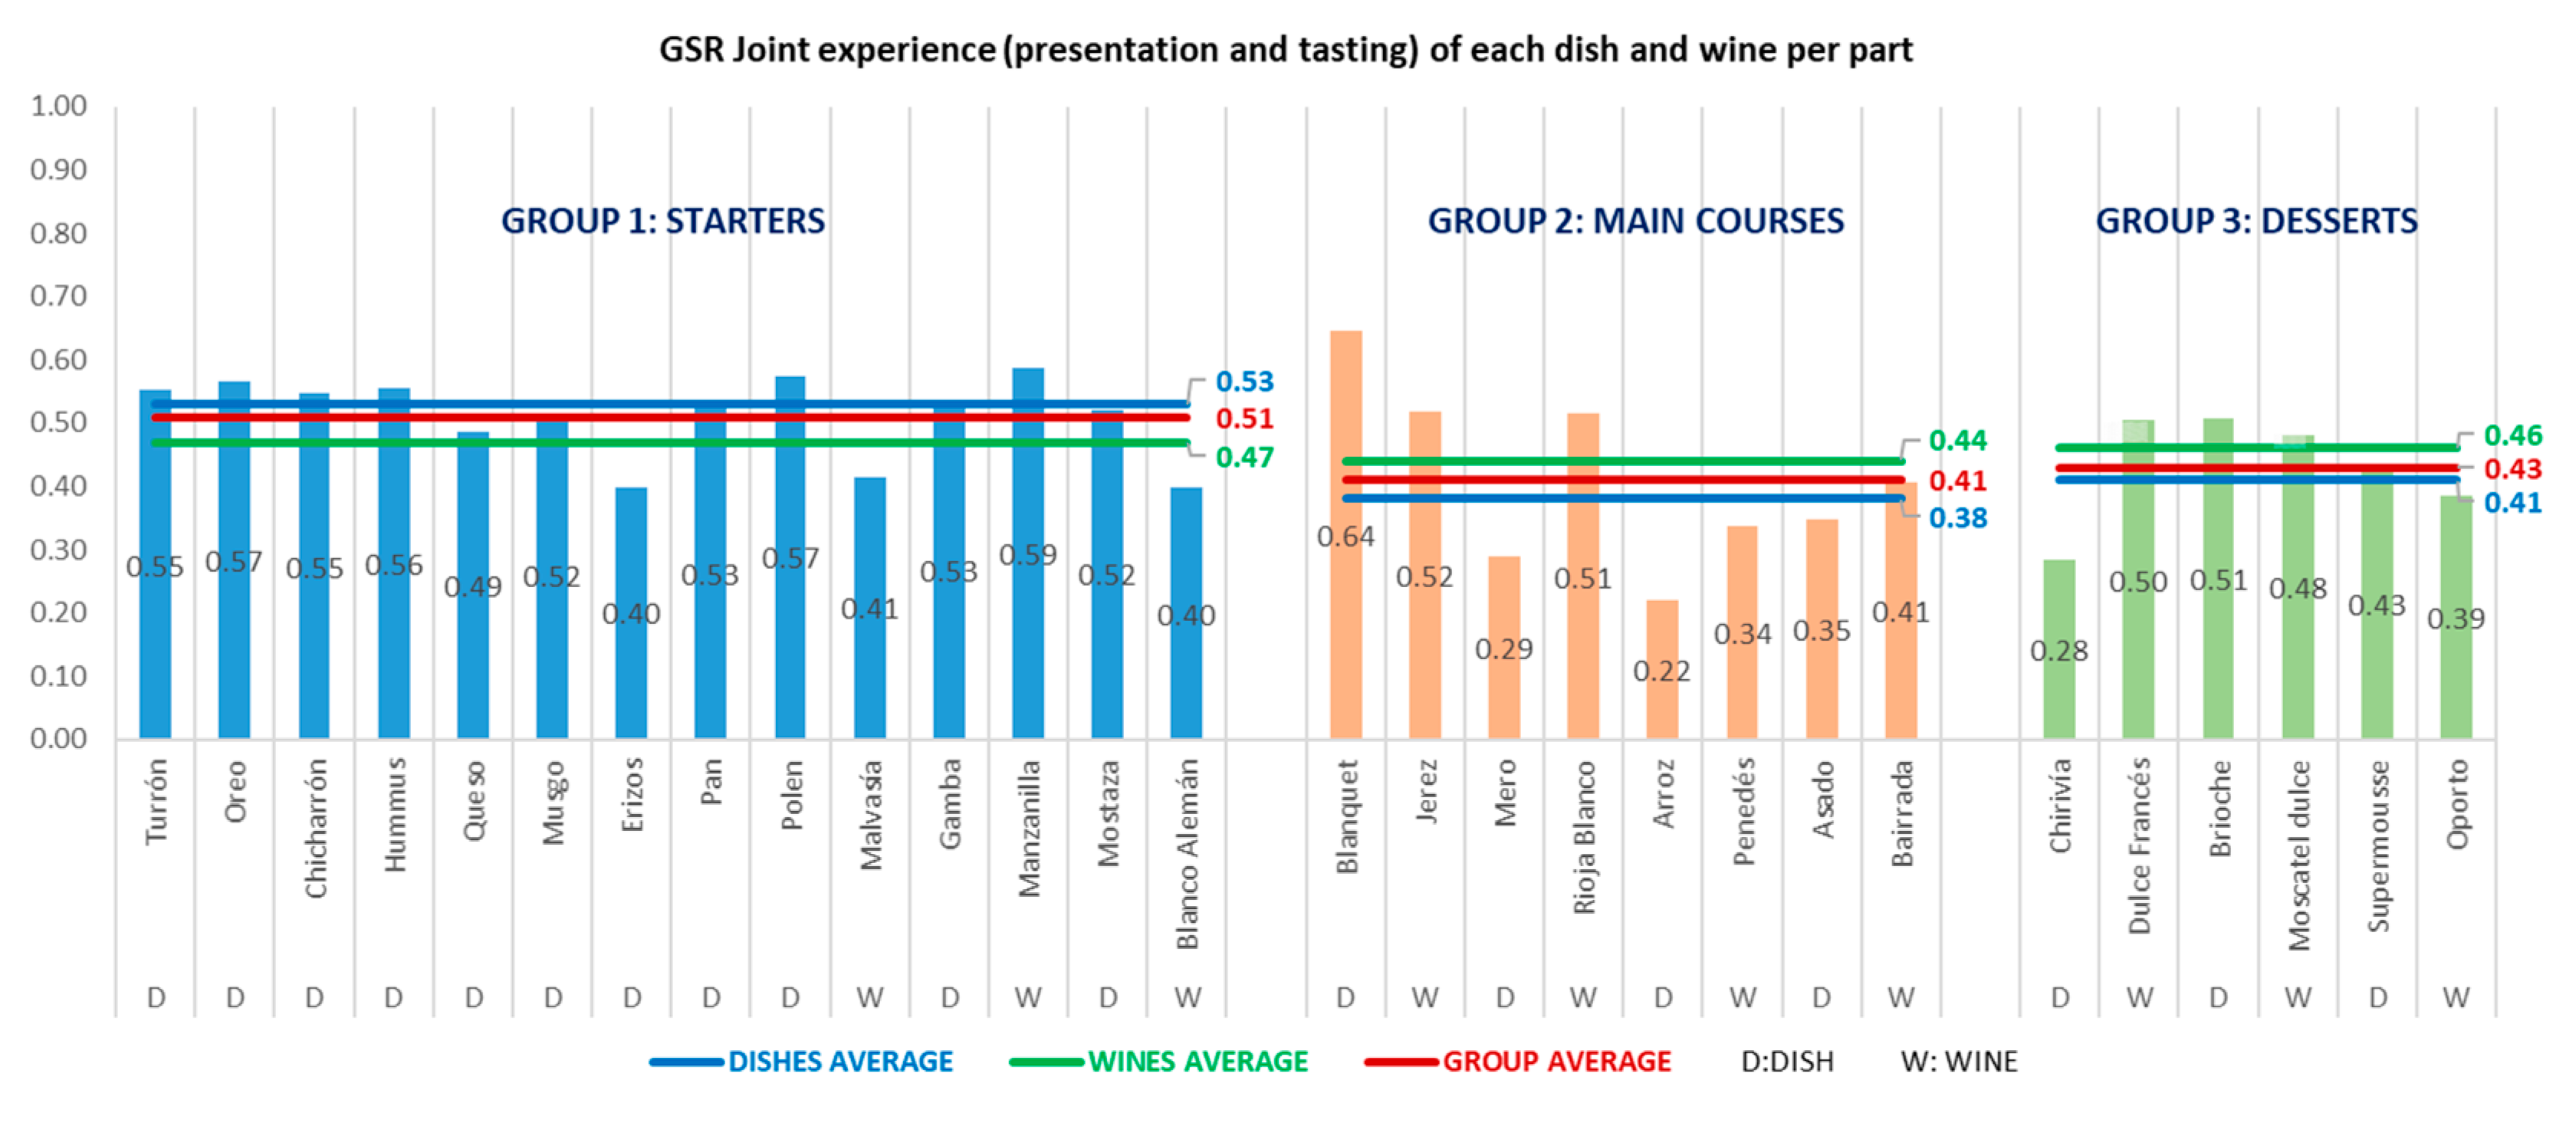
Arousal Analysis for Each Dish and Wine (Presentation and Tasting Phases)
4. Discussion
4.1. Haute Cuisine; the Emotional Impact of Dishes versus Wines on Restaurant Dinners
4.2. Haute Cuisine and Open Innovation in Restaurant Industry
5. Conclusions
Author Contributions
Funding
Data Availability Statement
Conflicts of Interest
Ethics Statement
References
- Hipp, C.; Grupp, H. Innovation in the service sector: The demand for service-specific innovation measurement concepts and typologies. Res. Policy 2005, 34, 517–535. [Google Scholar] [CrossRef]
- Chesbrough, H.; Vanhaverbeke, W.; West, J. Open Innovation: Researching a New Paradigm; Oxford University Press on Demand: Oxford, UK, 2006. [Google Scholar]
- Chesbrough, H.W. Open Innovation: The New Imperative for Creating and Profiting from Technology; Harvard Business School Press: Boston, MA, USA, 2003. [Google Scholar]
- Chesbrough, H.; Bogers, M. Forthcoming, Explicating open innovation: Clarifying an emerging paradigm for understanding innovation. In New Frontiers in Open Innovation; Oxford University Press: Oxford, UK, 2014; pp. 3–28. [Google Scholar] [CrossRef] [Green Version]
- West, J.; Salter, A.; Vanhaverbeke, W.; Chesbrough, H. Open innovation: The next decade. Res. Policy 2014, 43, 805–811. [Google Scholar] [CrossRef]
- Hervas-Oliver, J.-L.; Sempere-Ripoll, F.; Boronat-Moll, C. Technological innovation typologies and open innovation in SMEs: Beyond internal and external sources of knowledge. Technol. Forecast. Soc. Chang. 2021, 162, 120338. [Google Scholar] [CrossRef]
- Tirmizi, S.M.A.; Malik, Q.A.; Hussain, S.S. Invention and Open Innovation Processes and Linkages: A Conceptual Framework. J. Open Innov. Technol. Mark. Complex. 2020, 6, 159. [Google Scholar] [CrossRef]
- Bogers, M.; Chesbrough, H.; Strand, R. Sustainable open innovation to address a grand challenge: Lessons from Carlsberg and the Green Fiber Bottle. Br. Food J. 2020, 122, 1505–1517. [Google Scholar] [CrossRef]
- Buera, F.; Kaboski, J. The Rise of the Service Economy. Rise Serv. Econ. 2009, 102, 2540–2569. [Google Scholar]
- Rubalcaba, L.; Gago, D.; Maroto, A. Relationships between globalization and services: Competitive advantages of European and Spanish services in international trade. Inf. Comer. Esp. -Mon. Ed. 2005, 824, 93. [Google Scholar]
- Porter, M.E. Competitive Advantage of Nations: Creating and Sustaining Superior Performance; Simon and Schuster: New York, NY, USA, 2011. [Google Scholar]
- Sheehan, J. Understanding service sector innovation. Commun. ACM 2006, 49, 42–47. [Google Scholar] [CrossRef]
- Nam, K.W.; Kim, B.Y.; Carnie, B.W. Service Open Innovation; Design Elements for the Food and Beverage Service Business. J. Open Innov. Technol. Mark. Complex. 2018, 4, 53. [Google Scholar] [CrossRef] [Green Version]
- Yun, J.J.; Park, K.; Del Gaudio, G.; Della Corte, V. Open innovation ecosystems of restaurants: Geographical economics of successful restaurants from three cities. Eur. Plan. Stud. 2020, 28, 2348–2367. [Google Scholar] [CrossRef]
- Bunghez, C.L. The importance of tourism to a destination’s economy. J. East. Eur. Res. Bus. Econ. 2016, 2016, 1–9. [Google Scholar] [CrossRef]
- Guerrero-Sánchez, D.L. El impacto de la capacidad de absorción potencial del conocimiento sobre la innovación en marketing. Contaduría Adm. 2021, 66, 1–25. [Google Scholar] [CrossRef]
- Bertoch, M. Prospects for the Restoration in Europe for 2018 (Perspectivas de la Restauración en Europa Para 2018); The NPD Group: New York, NY, USA, 2018. [Google Scholar]
- Restaurants, T.W.B. The Worlds 50 Best Restaurants; William Reed Business Media Ltd.: Crawley, UK, 2018. Available online: https://www.theworlds50best.com/ (accessed on 24 November 2018).
- Mengual-Recuerda, A.; Tur-Viñes, V.; Varón, D.J. Neuromarketing in Haute Cuisine Gastronomic Experiences. Front. Psychol. 2020, 11, 1772. [Google Scholar] [CrossRef]
- Kim, E.; Nicolau, J.L.; Tang, L. (Rebecca) The Impact of Restaurant Innovativeness on Consumer Loyalty: The Mediating Role of Perceived Quality. J. Hosp. Tour. Res. 2021. [Google Scholar] [CrossRef]
- Romero, I.; Gómez, I.P.; Zabala-Iturriagagoitia, J.M. ‘Cookpetition’: Do restaurants coopete to innovate? Tour. Econ. 2019, 25, 904–922. [Google Scholar] [CrossRef]
- Presenza, A.; Abbate, T.; Sánchez, A.V.; Harrison, T. Creativity and innovation: The case of haute cuisine. Int. J. Entrep. Innov. Manag. 2018, 22, 562. [Google Scholar] [CrossRef]
- Tan, T.F.; Netessine, S. At your service on the table: Impact of tabletop technology on restaurant performance. Manag. Sci. 2020, 66, 4496–4515. [Google Scholar] [CrossRef]
- Blöcher, K.; Alt, R. AI and robotics in the European restaurant sector: Assessing potentials for process innovation in a high-contact service industry. Electron. Mark. 2020, 1–23. [Google Scholar] [CrossRef]
- Schwark, N.; Tiberius, V.; Fabro, M. How Will We Dine? Prospective Shifts in International Haute Cuisine and Innovation beyond Kitchen and Plate. Foods 2020, 9, 1369. [Google Scholar] [CrossRef]
- Moreno, M. El Marketing Experiencial en la Cocina; Branward S.L.: Barcelona, Spain, 2015. [Google Scholar]
- Lawrence, T.B.; Phillips, N. Understanding cultural industries. J. Manag. Inq. 2002, 11, 430–441. [Google Scholar] [CrossRef]
- Simatupang, T.M.; Schwab, A.; Lantu, D. Introduction: Building Sustainable Entrepreneurship Ecosystems. SSRN Electron. J. 2015, 26, 389–398. [Google Scholar] [CrossRef]
- Meneguel, C.R.D.A.; Mundet, L.; Aulet, S. The role of a high-quality restaurant in stimulating the creation and development of gastronomy tourism. Int. J. Hosp. Manag. 2019, 83, 220–228. [Google Scholar] [CrossRef]
- Michelin Guides Worlwide. 2019. Available online: https://guide.michelin.com/en/michelin-guides-worldwide (accessed on 10 April 2019).
- Cancela, A. Michelin Guide Collection (Colección Guías Michelin); A. Cancela & J. Cancela: Coruna, Spain, 2020; Available online: https://www.cancela.org/ (accessed on 20 June 2020).
- Cambio16. Cambio16. 2017. Available online: www.cambio16.com (accessed on 18 June 2020).
- Armitage, J. Luxury and Visual Culture; Zed Books Ltd.: London, UK, 2019. [Google Scholar]
- Santos, C. The Influence of Advertising on Youth Consumption of Clothing and Footwear Brands: A case study. Int. J. Mark. Commun. 2016, 4, 85–105. [Google Scholar]
- Lučić, A.; Dabić, M.; Finley, J. Marketing innovation and up-and-coming product and process innovation. Int. J. Entrep. Small Bus. 2019, 37, 434–448. [Google Scholar] [CrossRef]
- Dixon, S.-M.; Shankar, A. Footwear with feeling: A cultural approach to product development. J. Mark. Manag. 2018, 34, 536–537. [Google Scholar] [CrossRef]
- Fugate, D.L. Marketing services more effectively with neuromarketing research: A look into the future. J. Serv. Mark. 2008, 22, 170–173. [Google Scholar] [CrossRef]
- Hammou, K.A.; Galib, H.; Melloul, J. The Contributions of Neuromarketing in Marketing Research. J. Manag. Res. 2013, 5, 20. [Google Scholar] [CrossRef] [Green Version]
- Glimcher, P.W.; Camerer, C.F.; Fehr, E.; Poldrack, R.A. (Eds.) Chapter 1—Introduction: A Brief History of Neuroeconomics; Academic Press: London, UK, 2009; pp. 1–12. [Google Scholar]
- Crone, E.A.; Ridderinkhof, K.R. The developing brain: From theory to neuroimaging and back. Dev. Cogn. Neurosci. 2011, 1, 101–109. [Google Scholar] [CrossRef] [Green Version]
- Morin, A.J.; Scalas, L.F.; Vispoel, W.; Marsh, H.W.; Wen, Z. The Music Self-Perception Inventory: Development of a short form. Psychol. Music. 2016, 44, 915–934. [Google Scholar] [CrossRef]
- Lăzăroiu, G.; Pera, A.; Ștefănescu-Mihăilă, R.O.; Mircică, N.; Negurită, O. Can Neuroscience Assist Us in Constructing Better Patterns of Economic Decision-Making? Front. Behav. Neurosci. 2017, 11, 188. [Google Scholar] [CrossRef] [PubMed]
- Vecchiato, R.; Roveda, C. Strategic foresight in corporate organizations: Handling the effect and response uncertainty of technology and social drivers of change. Technol. Forecast. Soc. Chang. 2010, 77, 1527–1539. [Google Scholar] [CrossRef]
- Thomas, J.M.; Liu, J.; Robinson, E.L.; Aveyard, P.; Herman, C.P.; Higgs, S. The Effects of Liking Norms and Descriptive Norms on Vegetable Consumption: A Randomized Experiment. Front. Psychol. 2016, 7, 442. [Google Scholar] [CrossRef] [PubMed] [Green Version]
- Velasco, C.; Wan, X.; Knoeferle, K.; Zhou, X.; Salgado-Montejo, A.; Spence, C. Searching for flavor labels in food products: The influence of color-flavor congruence and association strength. Front. Psychol. 2015, 6, 301. [Google Scholar] [CrossRef] [Green Version]
- Fehse, K.; Simmank, F.; Gutyrchik, E.; Sztrókay-Gaul, A. Organic or popular brands-food perception engages distinct functional pathways. An fMRI study. Cogent Psychol. 2017, 4, 1284392. [Google Scholar] [CrossRef]
- Biswas, D.; Szocs, C.; Chacko, R.; Wansink, B. Shining Light on Atmospherics: How Ambient Light Influences Food Choices. J. Mark. Res. 2017, 54, 111–123. [Google Scholar] [CrossRef]
- Plassmann, H.; Ramsøy, T.Z.; Milosavljevic, M. Branding the brain: A critical review and outlook. J. Consum. Psychol. 2012, 22, 18–36. [Google Scholar] [CrossRef]
- Madan, C.R. Neuromarketing: The next step in market research? Eureka 2010, 1, 34–42. [Google Scholar] [CrossRef]
- Zajonc, R.B. Feeling and thinking: Preferences need no inferences. Am. Psychol. 1980, 35, 151–175. [Google Scholar] [CrossRef]
- Juárez-Varón, D.; Tur-Viñes, V.; Rabasa-Dolado, A.; Polotskaya, K. An Adaptive Machine Learning Methodology Applied to Neuromarketing Analysis: Prediction of Consumer Behaviour Regarding the Key Elements of the Packaging Design of an Educational Toy. Soc. Sci. 2020, 9, 1–23. [Google Scholar] [CrossRef]
- Baron, A.S.; Zaltman, G.; Olson, J. Barriers to advancing the science and practice of marketing. J. Mark. Manag. 2017, 33, 893–908. [Google Scholar] [CrossRef]
- Ariely, D.; Berns, G.S. Neuromarketing: The hope and hype of neuroimaging in business. Nat. Rev. Neurosci. 2010, 11, 284–292. [Google Scholar] [CrossRef] [PubMed] [Green Version]
- Torreblanca, F.; Juarez, D.; Sempere, F.; Mengual, A. Neuromarketing: Emotionality and creativity oriented to consumer behavior. 3C Empresa 2012, 1, 1–11. Available online: https://www.3ciencias.com/wp-content/uploads/2012/09/2.neuromarketing.pdf (accessed on 18 June 2020).
- Hsu, M. Neuromarketing: Inside the Mind of the Consumer. Calif. Manag. Rev. 2017, 59, 5–22. [Google Scholar] [CrossRef]
- Molchanov, N.N.; Muraveve, O.; Galay, N.; Korableva, O.N. Neuromarketing as an Innovative Approach to Market Research of Consumer Behavior. In Proceedings of the 29th International Business Information Management Association Conference-Education Excellence and Innovation Management through Vision 2020: From Regional Development Sustainability to Global Economic Growth, Vienna, Austria, 3–4 May 2017; Soliman, K.S., Ed.; pp. 2489–2499. [Google Scholar]
- Thaler, R.H. From Homo Economicus to Homo Sapiens. J. Econ. Perspect. 2000, 14, 133–141. [Google Scholar] [CrossRef] [Green Version]
- Kahneman, D. Thinking, Fast and Slow; Farrar, Straus and Giroux: New York, NY, USA, 2011. [Google Scholar]
- Mackie, D.M.; Worth, L.T. Processing deficits and the mediation of positive affect in persuasion. J. Personal. Soc. Psychol. 1989, 57, 27–40. [Google Scholar] [CrossRef]
- Filser, M. Marketing sensoriel: La quête de l’intégration théorique et managériale. Rev. Française du Mark. 2003, 194, 5–12. [Google Scholar]
- Manzano, R. Sensory Marketing: Communicate with the Senses at the Point of Sale: (Marketing Sensorial: Comunicar con los Sentidos en el Punto de Venta); Pearson: London, UK, 2011. [Google Scholar]
- Daucé, B.; Rieunier, S. Le marketing sensoriel du point de vente. Rech. et Appl. en Mark. French Ed. 2002, 17, 45–65. [Google Scholar] [CrossRef] [Green Version]
- Krishna, A. (Ed.) Sensory Marketing: Research on the Sensuality of Products; Routledge: London, UK, 2011; pp. 1–13. [Google Scholar]
- Li, Q.; Wang, X. A Study on the Influence of Engagement Marketing Strategy on Customer Perceived Support and Willingness to Customer Engagement. In Proceedings of the 2017 IEEE 14th International Conference on e-Business Engineering (ICEBE), Shanghai, China, 4–6 November 2017; pp. 166–171. [Google Scholar]
- Smith, A. The Theory of Moral Sentiments; Penguin: London, UK, 2010. [Google Scholar]
- Wilson, T.D.; Gilbert, D.T.; Centerbar, D.B. Making sense: The causes of emotional evanescence. Psychol. Econ. Decis. 2003, 1, 209–233. [Google Scholar]
- Oatley, K. Brain Mechanisms and Motivation. Nat. Cell Biol. 1970, 225, 797–801. [Google Scholar] [CrossRef]
- VanItallie, T.B. Sleep and energy balance: Interactive homeostatic systems. Metabolism 2006, 55, S30–S35. [Google Scholar] [CrossRef]
- Stasi, A.; Songa, G.; Mauri, M.; Ciceri, A.; Diotallevi, F.; Nardone, G.; Russo, V. Neuromarketing empirical approaches and food choice: A systematic review. Food Res. Int. 2018, 108, 650–664. [Google Scholar] [CrossRef] [PubMed]
- Stoica, I.; Popescu, M.; Orzan, M. Consumer preferences for organic food. A case study of neuromarketing methods and tools. J. Environ. Prot. Ecol. 2015, 16, 1142–1148. [Google Scholar]
- Velasco, C.; Obrist, M.; Petit, O.; Spence, C. Multisensory Technology for Flavor Augmentation: A Mini Review. Front. Psychol. 2018, 9, 8. [Google Scholar] [CrossRef] [PubMed] [Green Version]
- Sturiale, L.; Scuderi, A. Interaction between the Emotional and Rational Aspects in Consumer Buying Process for Typical Food Products of Italy. Adv. Bus. Strategy Compet. Advant. 2017, 142–162. [Google Scholar] [CrossRef]
- Rybanska, J.; Nagyova, L.; Kubelakova, A. Sensory marketing strategy: Use of the sense of taste on the global market of food. Globalization and Its Socio-Economic Consequences. In Proceedings of the 16th International Scientific Conference Proceedings, Rajecke Teplice, Slovak Republic, 5–6 October 2016; Pts, I.-V., Kliestik, T., Eds.; pp. 1912–1918. [Google Scholar]
- Bornstein, R.F.; D’agostino, P.R. Stimulus recognition and the mere exposure effect. J. Personal. Soc. Psychol. 1992, 63, 545. [Google Scholar] [CrossRef]
- Ramele, R.; Julia, V.; Miguel, S. EPOC Emotiv EEG Basics; ResearchGate GmbH: Berlin, Germany, 2012; Available online: https://www.researchgate.net/publication/332514530_EPOC_Emotiv_EEG_Basics#fullTextFileContent (accessed on 18 June 2020).
- Sanei, S.; Chambers, J. EEG Signal Processing; John Wiley & Sons, Inc.: Hoboken, NJ, USA, 2007. [Google Scholar]
- Varón, D.J.; Tur-Viñes, V.; Recuerda, A.M. Análisis del diseño de packaging de juguete educativo, mediante neuromarketing. Cuad. Latinoam. Adm. 2019, 15, 1–25. [Google Scholar] [CrossRef] [Green Version]
- Emotiv. Emotiv. 2021. Available online: www.emotiv.com (accessed on 25 February 2021).
- Shimmer. Shimmer Sensing. 2021. Available online: https://www.shimmersensing.com/products/shimmer3-wireless-gsr-sensor (accessed on 25 February 2021).
- Gazepoint. Gazepoint. 2021. Available online: http://gazepoint.com/ (accessed on 25 February 2021).
- Juárez Varón, D.; Viñes, V.T.; Recuerda, A.M. Neuromarketing Applied to Educational Toy Packaging. Front. Psychol. 2020, 11, 2077. [Google Scholar] [CrossRef] [PubMed]
- Añaños-Carrasco, E. Eyetracker technology in elderly people: How integrated television content is paid attention to and processed. Comunicar 2015, 23, 75–83. [Google Scholar] [CrossRef] [Green Version]
- Visnjic, I.; Wiengarten, F.; Neely, A.D. Only the Brave: Product Innovation, Service Business Model Innovation, and Their Impact on Performance. J. Prod. Innov. Manag. 2016, 33, 36–52. [Google Scholar] [CrossRef] [Green Version]
- Yusheng, K.; Ibrahim, M. Service innovation, service delivery and customer satisfaction and loyalty in the banking sector of Ghana. Int. J. Bank Mark. 2019, 37, 1215–1233. [Google Scholar] [CrossRef]
- Chen, C.-L. Service providers’ sustainable service innovation: Service-dominant logic. Serv. Ind. J. 2017, 37, 628–656. [Google Scholar] [CrossRef]
- Jin, H.Y.; Fei, Y.; Ji, K.M. A Study of the Relations among Driving Force of Service Innovation, Service Innovation Types and Consumer Satisfaction of Service Enterprise: Focusing on Chinese Hotel Industry. Korean Bus. Educ. Rev. 2019, 34, 91–113. [Google Scholar] [CrossRef]
- Cerea, E.; Rurale, A. Haute Cousine System and Its Cultural Dimension: When Chefs Are the New Artists. University of Philadelphia Press: Pennsylvania, PA, USA, 2010. Available online: https://papers.ssrn.com/sol3/papers.cfm?abstract_id=1692084 (accessed on 18 June 2020).
- Olders, P. Acquired taste or acquired knowledge? Experience, talent and popularity in creating French superstar Cuisine. In Proceedings of the DRUID Society Conference, Copenhagen, Denmark, 16–18 June 2014. [Google Scholar]
- Ohme, R.; Matukin, M.; Pacula-Lesniak, B. Biometric Measures for Interactive Advertising Research. J. Interact. Advert. 2011, 11, 60–72. [Google Scholar] [CrossRef]
- Bloch, P.H. Seeking the ideal form: Product design and consumer response. J. Mark. 1995, 59, 16–29. [Google Scholar] [CrossRef] [Green Version]
- Ungureanu, F.; Lupu, R.G.; Cadar, A.; Prodan, A. Neuromarketing and Visual Attention Study Using Eye Tracking Techniques. In Proceedings of the 2017 21st International Conference on System Theory, Control and Computing, Sinaia, Romania, 19–21 October 2017; Kloetzer, M., Ferariu, L., Eds.; pp. 553–557. [Google Scholar]
- Parker, P.M.; Tavassoli, N.T. Homeostasis and consumer behavior across cultures. Int. J. Res. Mark. 2000, 17, 33–53. [Google Scholar] [CrossRef]
- Sterner, R. Modelling interactions of food quality and quantity in homeostatic consumers. Freshw. Biol. 1997, 38, 473–481. [Google Scholar] [CrossRef]
- Fakhruzzaman, M.N.; Riksakomara, E.; Suryotrisongko, H. EEG Wave Identification in Human Brain with Emotiv EPOC for Motor Imagery. Procedia Comput. Sci. 2015, 72, 269–276. [Google Scholar] [CrossRef] [Green Version]
- Carvalho, F.R.; Moors, P.; Wagemans, J.; Spence, C. The Influence of Color on the Consumer’s Experience of Beer. Front. Psychol. 2017, 8, 2205. [Google Scholar] [CrossRef] [PubMed]
- Duchowski, A.T. Eye Tracking Methodology: Theory and Practice; Springer International Publishing: Berlin/Heidelberg, Germany, 2003; Volume 328, pp. 2–3. [Google Scholar]
- Ran, Y.; Wei, H.; Li, Q. Forgiveness from Emotion Fit: Emotional Frame, Consumer Emotion, and Feeling-Right in Consumer Decision to Forgive. Front. Psychol. 2016, 7, 1775. [Google Scholar] [CrossRef] [PubMed] [Green Version]
- Kim, W.; Kim, B. Consumption Motivation of Limited Edition Product in Reselling Open Market. J. Open Innov. Technol. Mark. Complex. 2020, 6, 133. [Google Scholar] [CrossRef]
- Bigliardi, B.; Galati, F. Models of adoption of open innovation within the food industry. Trends Food Sci. Technol. 2013, 30, 16–26. [Google Scholar] [CrossRef]
- Chesbrough, H.W. The era of open innovation. Manag. Innov. Chang. 2006, 127, 34–41. [Google Scholar]
- Sarkar, S.; Costa, A. Dynamics of open innovation in the food industry. Trends Food Sci. Technol. 2008, 19, 574–580. [Google Scholar] [CrossRef]
- Chesbrough, H.; Kim, S.; Agogino, A. Chez Panisse: Building an Open Innovation Ecosystem. Calif. Manag. Rev. 2014, 56, 144–171. [Google Scholar] [CrossRef]
- Gross, J.J.; Thompson, R.A. Emotion regulation: Conceptual foundations. In Handbook of Emotion Regulation; Gross, J.J., Ed.; Guilford Press: New York, NY, USA, 2007; pp. 3–24. [Google Scholar]
- Morin, C. Neuromarketing: The New Science of Consumer Behavior. Society 2011, 48, 131–135. [Google Scholar] [CrossRef] [Green Version]


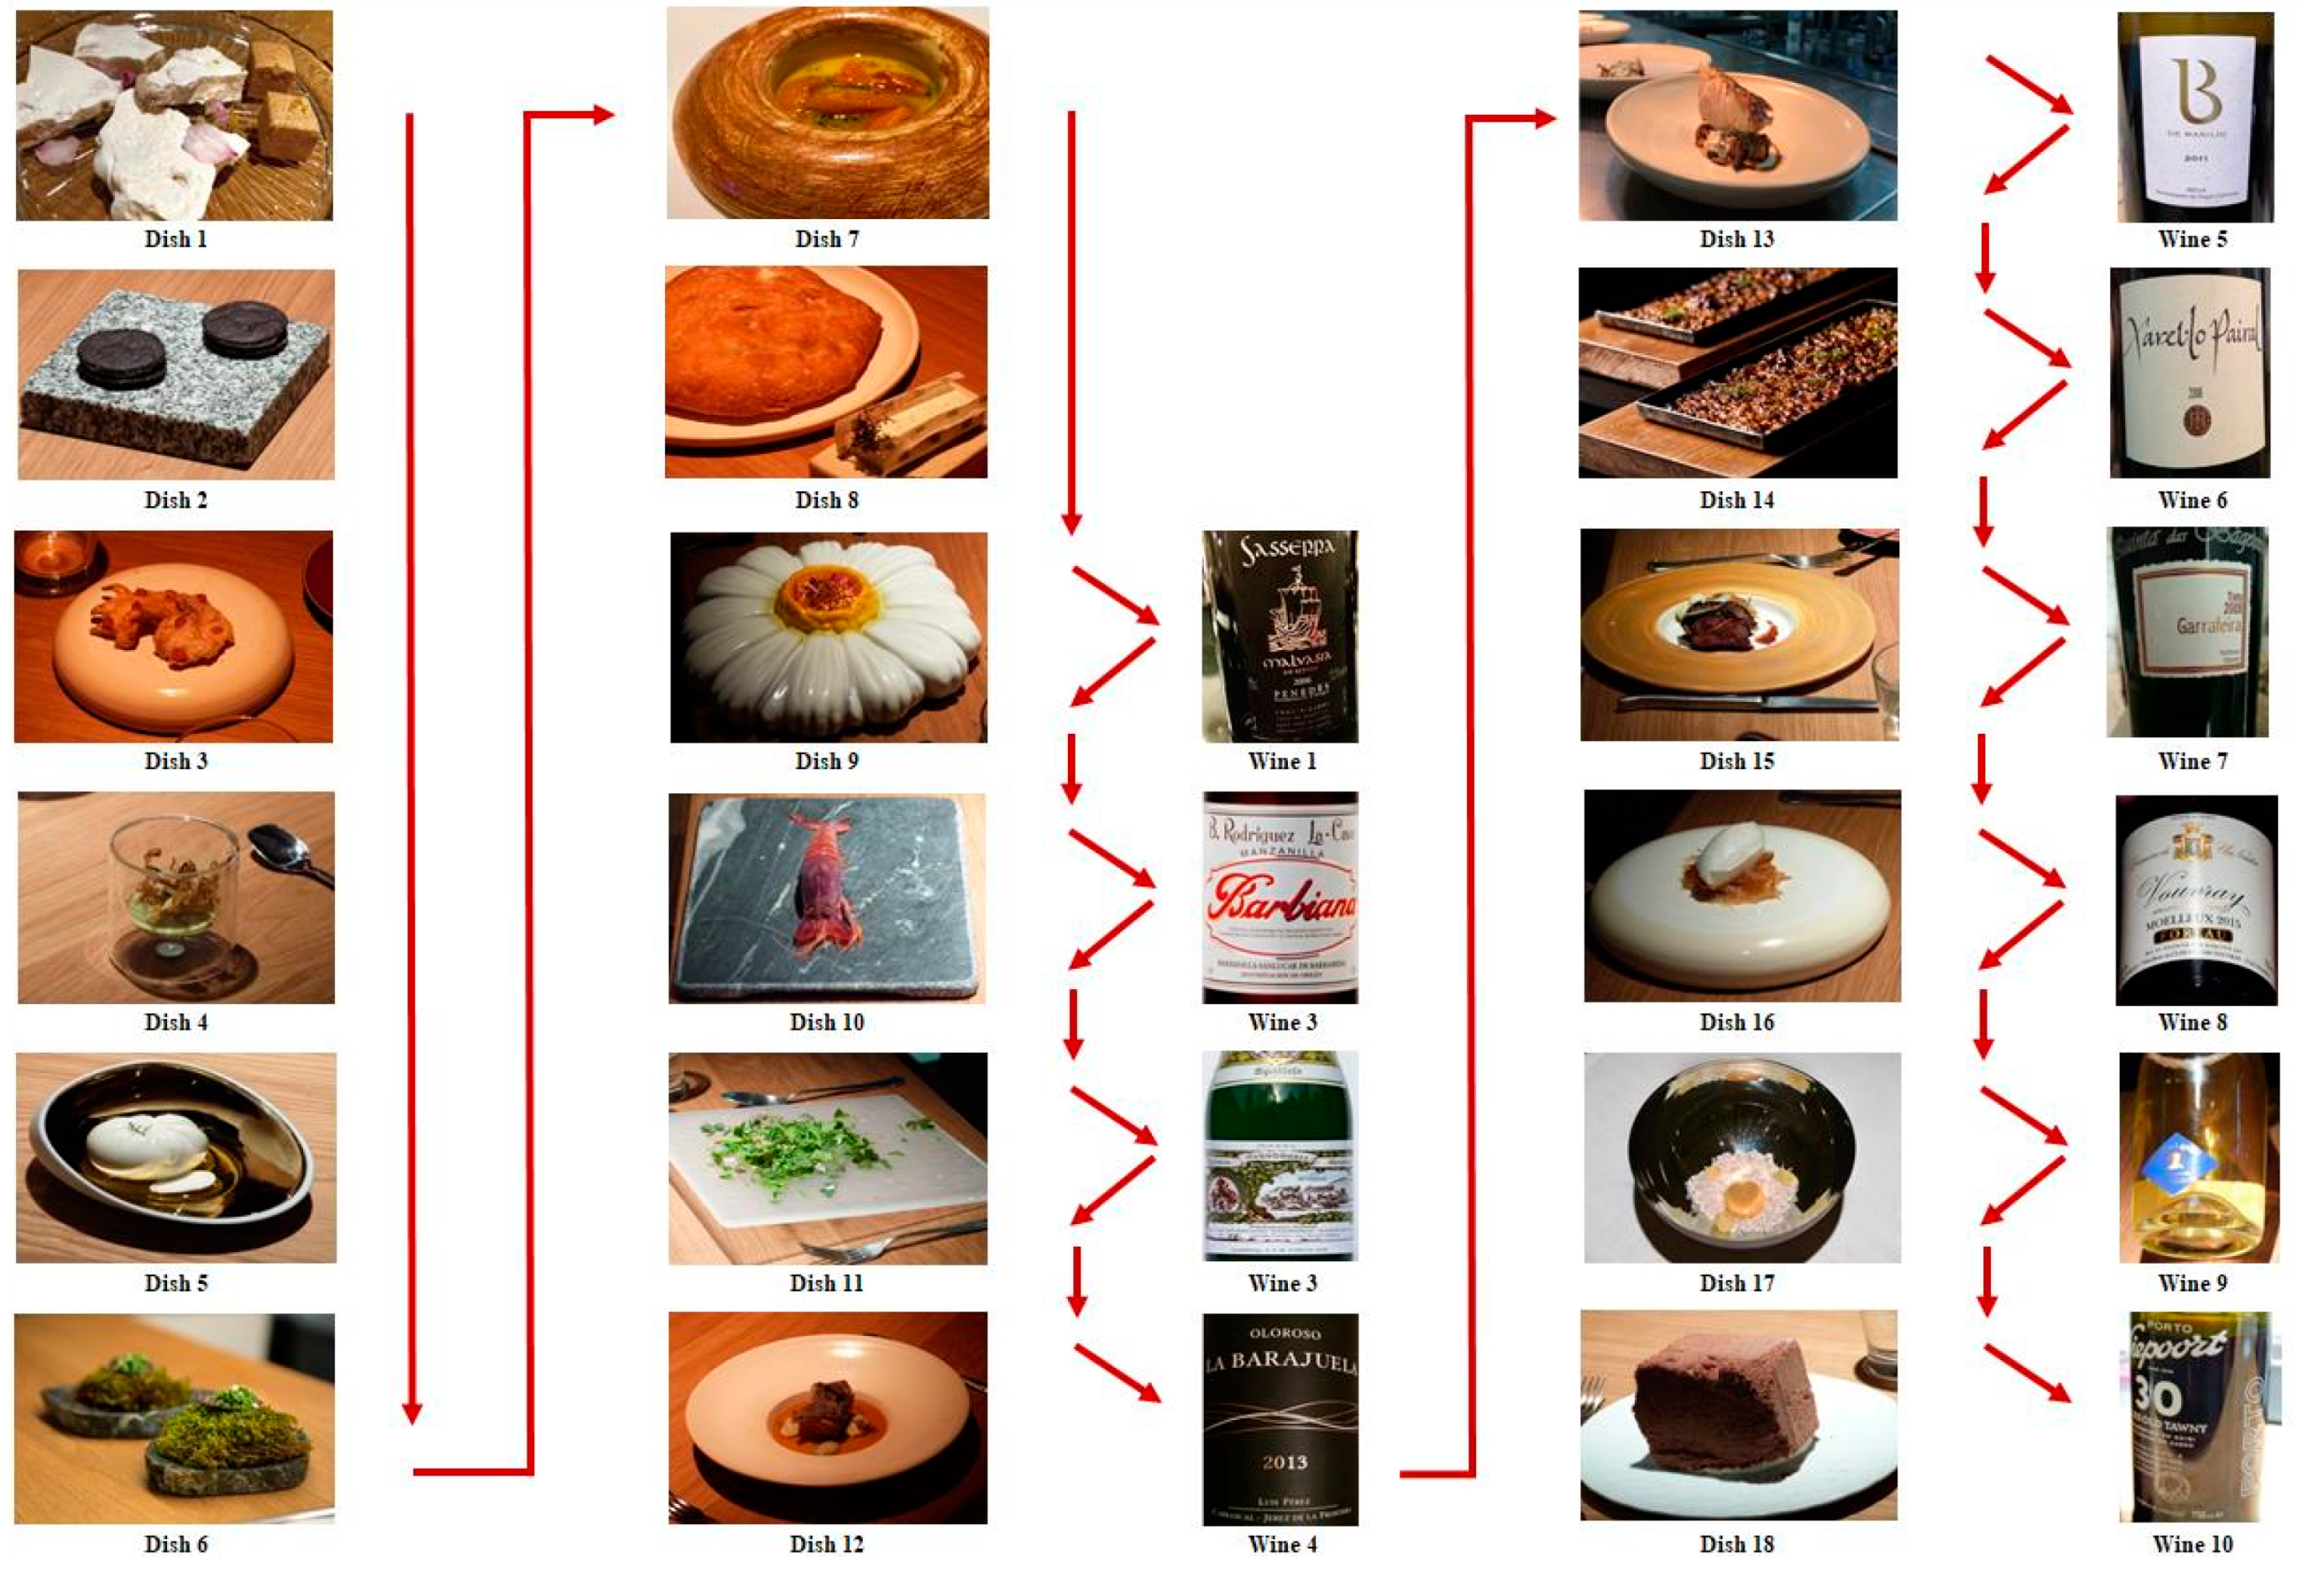
| Moment | Dish nº | Description | Abbreviation |
|---|---|---|---|
| Snacks and starters | Dish 1 | Alicante savory nougat/turron (Turrón salado Alicante y Jijona) | Turrón |
| Dish 2 | Oreo de ajo (Black and White Garlic Oreo) | B&W Oreo | |
| Dish 3 | Chicharrón de pollo (Chicken cracklings and egg yolk) | Chicharrón | |
| Dish 4 | Hummus de alcachofas (Artichoke hummus) | Hummus | |
| Dish 5 | Queso fresco de almendras (Fresh almond cheese) | Queso | |
| Dish 6 | Musgo (Moss) | Musgo | |
| Dish 7 | Erizos (Pumpkin hedgehogs) | Erizos | |
| Dish 8 | Pan con mantequilla de hierbas (Sourdough bread with regional herb butter) | Pan | |
| Dish 9 | Sabayón de azafrán con polen fresco y flores (Saffron sabayon with fresh pollen and flowers) | Polen | |
| Wine 1 | Vega de Ribes Saserra 2006. Penedés | Malvasía | |
| Dish 10 | Gamba roja (Salted red shrimp) | Gamba | |
| Wine 2 | Delgado Zuleta Rodríguez La-Cave Barbiana. SanLúcar | Manzanilla | |
| Dish 11 | Crema de mostaza salvaje con hierbas recién cortadas (Wild mustard cream with freshly cut herbs) | Mostaza | |
| Wine 3 | Maximin Grünhaus Abtsberg Riesling Spätlese 2009. Ruwer | Blanco Alemán | |
| Main courses | Dish 12 | Blanquet (White sausage with butterbean and black truffle) | Blanquet |
| Wine 4 | Luis Pérez La Barrajuela Oloroso 2013. Jerez | Jerez | |
| Dish 13 | Mero con setas (Grilled grouper with mushrooms and hazelnut butter dressing) | Mero | |
| Wine 5 | Basilio Izquierdo B de Basilio 2011. Rioja | Rioja Blanco | |
| Dish 14 | Arroz al cuadrado (Dry cuttlefish rice with broad beans and artichokes) | Arroz | |
| Wine 6 | Can Ràfols dels Xarel·lo Pairal 2006. Penedés | Penedés | |
| Dish 15 | Tira de asado (Strip of roast lamb lacquered in its juices with grilled aubergines) | Asado | |
| Wine 7 | Quinta des Bágeiras Garrafeira 2009. Bairrada | Bairrada | |
| Desserts | Dish 16 | Helado de chirivía con cabello de ángel (Parsnip ice cream with pumpkin cream and muscat vinegar) | Chirivía |
| Wine 8 | Domaine du Clos Naudin Moelleux 2015. Loira | Dulce Francés | |
| Dish 17 | Espíritu de un brioche (Spirit of a Brioche) | Brioche | |
| Wine 9 | Gutiérrez de la Vega Furtiva Lágrima Cavatina 2012. Alicante | Moscatel dulce | |
| Dish 18 | Supermousse (Chocolate with coffee and hazelnut) | Supermousse | |
| Wine 10 | Neipoort 30 Years Old Tawny. Porto | Oporto |
| Arousal (Parts per Unit) | ||||||
|---|---|---|---|---|---|---|
| Dishes Average | Wines Average | Group Average | ||||
| Moment | Dish nº | Abbreviation | Joint Experience | |||
| SNACKS AND STARTERS | Dish 1 | Turrón | 0.55 | 0.53 | 0.47 | 0.51 |
| Dish 2 | Oreo | 0.57 | ||||
| Dish 3 | Chicharrón | 0.55 | ||||
| Dish 4 | Hummus | 0.56 | ||||
| Dish 5 | Queso | 0.49 | ||||
| Dish 6 | Musgo | 0.52 | ||||
| Dish 7 | Erizos | 0.40 | ||||
| Dish 8 | Pan | 0.53 | ||||
| Dish 9 | Polen | 0.57 | ||||
| Wine 1 | Malvasía | 0.41 | ||||
| Dish 10 | Gamba | 0.53 | ||||
| Wine 2 | Manzanilla | 0.59 | ||||
| Dish 11 | Mostaza | 0.52 | ||||
| Wine 3 | Blanco Alemán | 0.40 | ||||
| MAIN COURSES | Dish 12 | Blanquet | 0.64 | 0.38 | 0.44 | 0.41 |
| Wine 4 | Jerez | 0.52 | ||||
| Dish 13 | Mero | 0.29 | ||||
| Wine 5 | Rioja Blanco | 0.51 | ||||
| Dish 14 | Arroz | 0.22 | ||||
| Wine 6 | Penedés | 0.34 | ||||
| Dish 15 | Asado | 0.35 | ||||
| Wine 7 | Bairrada | 0.41 | ||||
| DESSERTS | Dish 16 | Chirivía | 0.28 | 0.41 | 0.46 | 0.43 |
| Wine 8 | Dulce Francés | 0.50 | ||||
| Dish 17 | Brioche | 0.51 | ||||
| Wine 9 | Moscatel dulce | 0.48 | ||||
| Dish 18 | Supermousse | 0.43 | ||||
| Wine 10 | Oporto | 0.39 | ||||
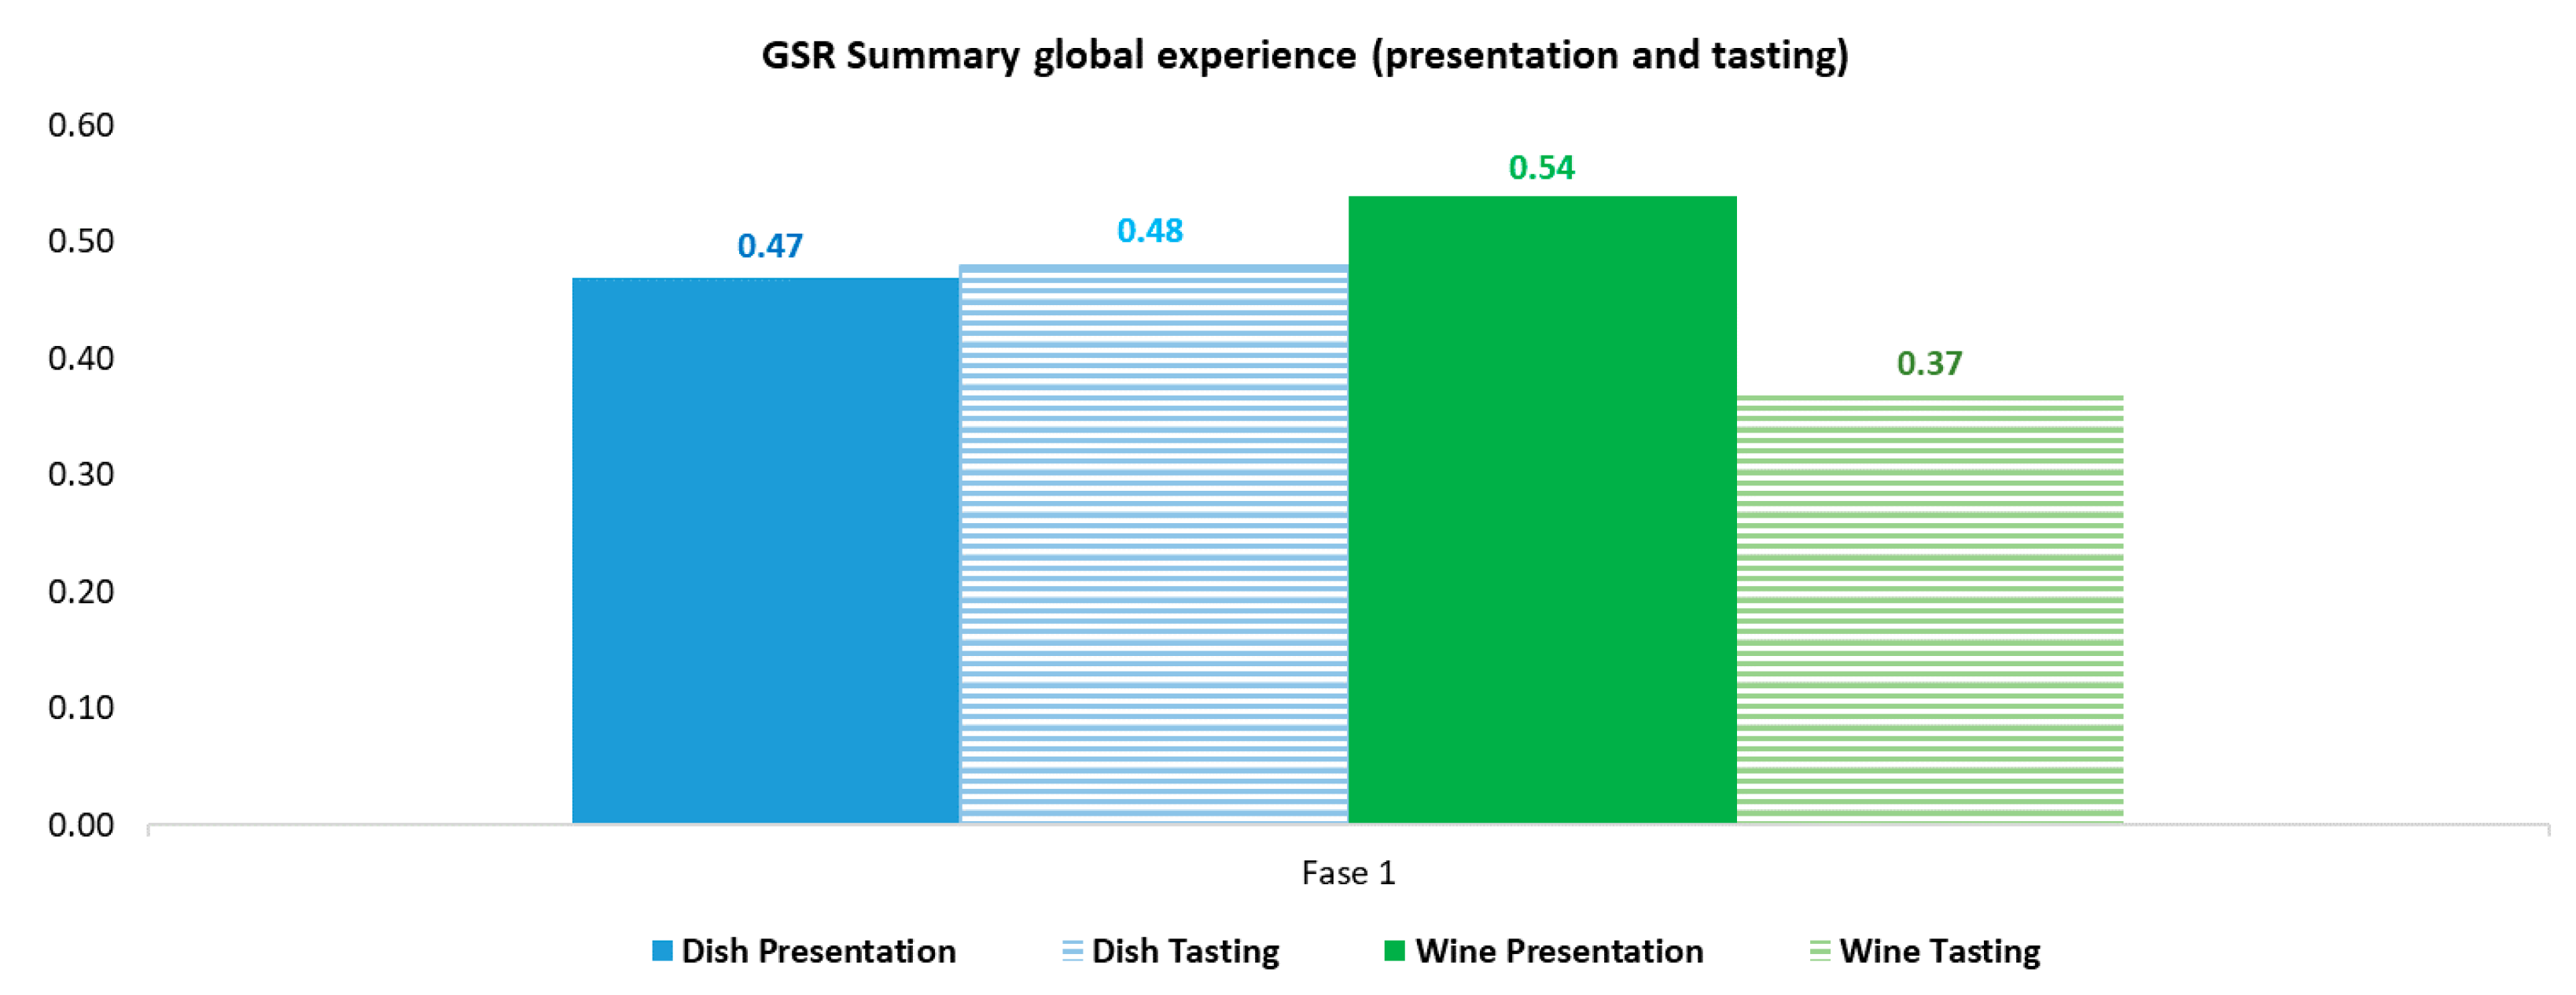
| Global experience of dish presentation | 0.47 | |||||
| Global experience of dish tasting | 0.48 | |||||
| Global experience of wine presentation | 0.54 | |||||
| Global experience of wine tasting | 0.37 | |||||
| Dish/Wine | GSR | Engagement | Excitement | Interest | Relaxation | Stress | Focus | |||||||
|---|---|---|---|---|---|---|---|---|---|---|---|---|---|---|
| Turrón | 55.2 | (1.2) | 71.1 | (4.8) | 26.1 | (1.5) | 69.1 | (4.2) | 29.1 | (1.1) | 52.1 | (1.5) | 44.1 | (0.8) |
| Oreo | 56.6 | (5.8) | 61.1 | (3.7) | 30.1 | (0.8) | 86.1 | (2.9) | 32.1 | (1.7) | 43.0 | (2.5) | 58.1 | (1.5) |
| Chicharrón | 54.6 | (0.6) | 57.1 | (2.6) | 56.1 | (3.5) | 91.0 | (5.4) | 30.0 | (1.8) | 58.0 | (1.8) | 70.0 | (0.9) |
| Hummus | 55.5 | (1.6) | 60.0 | (1.7) | 52.0 | (2.5) | 84.0 | (2.8) | 31.0 | (0.8) | 62.0 | (2.5) | 68.0 | (1.5) |
| Queso | 48.7 | (0.5) | 63.0 | (2.1) | 58.0 | (2.6) | 78.0 | (4.7) | 29.0 | (1.5) | 31.0 | (1.7) | 69.0 | (0.7) |
| Musgo | 51.7 | (0.7) | 67.0 | (4.1) | 59.0 | (1.5) | 72.0 | (8.6) | 29.5 | (0.8) | 50.0 | (4.3) | 68.0 | (1.5) |
| Erizos | 39.9 | (0.7) | 68.0 | (1.1) | 56.0 | (3.3) | 66.0 | (0.9) | 29.0 | (0.7) | 40.0 | (0.9) | 69.0 | (1.8) |
| Pan | 52.6 | (0.8) | 59.5 | (0.8) | 39.5 | (3.4) | 82.5 | (2.2) | 30.0 | (0.3) | 37.0 | (0.6) | 52.5 | (4.8) |
| Polen | 57.4 | (1.4) | 62.5 | (0.8) | 50.0 | (4.3) | 80.0 | (1.4) | 30.0 | (0.4) | 68.5 | (2.4) | 61.0 | (1.5) |
| Malvasía | 41.5 | (1.1) | 61.0 | (0.1) | 42.0 | (0.8) | 74.0 | (1.6) | 32.0 | (0.6) | 49.0 | (1.7) | 53.0 | (1.7) |
| Gamba | 53.3 | (1.6) | 67.0 | (5.7) | 46.5 | (1.2) | 69.5 | (0.7) | 30.0 | (2.8) | 60.5 | (3.5) | 56.0 | (0.8) |
| Manzanilla | 58.7 | (0.7) | 78.0 | (0.8) | 70.0 | (0.6) | 68.0 | (1.4) | 30.0 | (2.7) | 99.0 | (0.6) | 75.0 | (2.4) |
| Mostaza | 52.1 | (1.6) | 62.0 | (2.7) | 42.5 | (2.4) | 73.0 | (4.9) | 30.0 | (0.8) | 49.5 | (1.4) | 54.0 | (1.1) |
| Blanco Alemán | 39.8 | (0.4) | 62.0 | (2.1) | 42.5 | (1.4) | 73.0 | (0.8) | 30.0 | (0.6) | 49.5 | (0.8) | 54.0 | (0.4) |
| Blanquet | 64.4 | (1.7) | 62.0 | (0.1) | 42.5 | (2.1) | 74.0 | (7.1) | 29.5 | (0.7) | 32.5 | (2.1) | 50.0 | (1.4) |
| Jerez | 51.7 | (0.7) | 56.0 | (0.4) | 79.0 | (0.6) | 58.0 | (0.6) | 30.0 | (1.6) | 70.0 | (1.4) | 77.0 | (0.8) |
| Mero | 29.0 | (0.7) | 61.0 | (1.4) | 32.0 | (1.2) | 75.5 | (1.6) | 29.0 | (1.4) | 34.5 | (0.6) | 42.5 | (0.7) |
| Rioja Blanco | 51,5 | (1.4) | 63.0 | (0.7) | 28.0 | (1.7) | 58.0 | (2.1) | 32.0 | (1.7) | 23.0 | (2.1) | 27.0 | (1.6) |
| Arroz | 22.0 | (1.0) | 61.0 | (1.4) | 24.0 | (0.9) | 80.0 | (1.6) | 30.0 | (0.1) | 44.0 | (0.8) | 37.5 | (0.6) |
| Penedés | 33.7 | (0.6) | 80.0 | (2.7) | 49.0 | (1.4) | 57.0 | (2.7) | 33.0 | (2.1) | 61.0 | (1.6) | 59.0 | (0.9) |
| Asado | 34.9 | (1.3) | 61.0 | (1.4) | 25.5 | (0.4) | 77.5 | (1.6) | 30.0 | (0.2) | 42.0 | (3.9) | 39.0 | (2.7) |
| Bairrada | 40.6 | (0.8) | 63.0 | (0.6) | 41.0 | (1.6) | 72.0 | (0.8) | 29.0 | (2.4) | 51.0 | (0.6) | 54.0 | (0.8) |
| Chirivía | 28.3 | (1.1) | 63.5 | (0.7) | 24.0 | (1.4) | 73.0 | (0.8) | 30.0 | (0.1) | 40.0 | (0.7) | 34.5 | (3.4) |
| Dulce Francés | 50.4 | (2.7) | 71.0 | (0.7) | 47.0 | (0.6) | 63.0 | (1.4) | 31.0 | (1.4) | 65.0 | (0.6) | 54.0 | (0.8) |
| Brioche | 50.8 | (0.8) | 65.0 | (0.1) | 39.5 | (0.9) | 72.0 | (0.7) | 30.0 | (0.1) | 56.0 | (0.1) | 50.0 | (5.7) |
| Moscatel dulce | 48.2 | (2.1) | 70.0 | (0.6) | 60.0 | (2.1) | 69.0 | (1.7) | 33.0 | (2.1) | 45.0 | (2.1) | 62.0 | (0.6) |
| Supermousse | 42.9 | (0.9) | 59.5 | (2.1) | 33.5 | (3.5) | 73.0 | (0.8) | 29.5 | (0.7) | 42.5 | (0.7) | 45.0 | (1.4) |
| Oporto | 38.5 | (0.6) | 86.0 | (1.4) | 45.0 | (1.4) | 62.0 | (0.4) | 32.0 | (0.6) | 59.0 | (1.7) | 45.0 | (2.4) |
| Average | 47.2 | (11.8) | 62.8 | (3.5) | 40.9 | (12.4) | 76.4 | (6.5) | 29.9 | (0.7) | 46.8 | (10.9) | 53.8 | (11.9) |
Publisher’s Note: MDPI stays neutral with regard to jurisdictional claims in published maps and institutional affiliations. |
© 2021 by the authors. Licensee MDPI, Basel, Switzerland. This article is an open access article distributed under the terms and conditions of the Creative Commons Attribution (CC BY) license (http://creativecommons.org/licenses/by/4.0/).
Share and Cite
Mengual-Recuerda, A.; Tur-Viñes, V.; Juárez-Varón, D.; Alarcón-Valero, F. Emotional Impact of Dishes versus Wines on Restaurant Diners: From Haute Cuisine Open Innovation. J. Open Innov. Technol. Mark. Complex. 2021, 7, 96. https://0-doi-org.brum.beds.ac.uk/10.3390/joitmc7010096
Mengual-Recuerda A, Tur-Viñes V, Juárez-Varón D, Alarcón-Valero F. Emotional Impact of Dishes versus Wines on Restaurant Diners: From Haute Cuisine Open Innovation. Journal of Open Innovation: Technology, Market, and Complexity. 2021; 7(1):96. https://0-doi-org.brum.beds.ac.uk/10.3390/joitmc7010096
Chicago/Turabian StyleMengual-Recuerda, Ana, Victoria Tur-Viñes, David Juárez-Varón, and Faustino Alarcón-Valero. 2021. "Emotional Impact of Dishes versus Wines on Restaurant Diners: From Haute Cuisine Open Innovation" Journal of Open Innovation: Technology, Market, and Complexity 7, no. 1: 96. https://0-doi-org.brum.beds.ac.uk/10.3390/joitmc7010096