1. Introduction
What is logistics? If we put it simply, logistics is the science of minimizing the costs of human, material and other resources with the optimization of all processes.
This paper considers logistics in its broad sense as a modern methodology for managing all types of flows that appear in the course of economic activities. Logistics as the science of flow management is a paradigm of doing business that implies, in contrast to previous approaches, general principles in relation to various types of flows: material, information, energy, financial and labor flows.
Similarly to how Yun, Won, and Park [
1] present today’s economy as three sub-economies, we model the modern economy in the form of the following types of logistic systems: megalogistic, macrologistic, and micrologistic systems.
The types of logistic systems can be perceived as open innovation. Open innovation is a new innovative trend, which is being gradually accepted by large companies all over the world. The types of logistic systems, in this sense, are a model for managing business for innovation.
Megalogistic systems are global logistics systems that include national economies as economic systems or regional economic integration of countries. Examples of such systems are the European Union (EU), North American Free Trade Agreement (NAFTA), Eurasian Economic Union (EAEU), Global Economy (or World Economy).
A macrologistic system is a large system for managing material flows, human, energy, information and financial resources, covering enterprises and organizations of the economy, intermediary, trade and transport organizations of various institutions located in different districts, regions of the country or in different countries.
Micrologistic systems cover the scope of individual enterprise activity. They are built from the standpoint of strategic goals of firms and optimization of basic processes and provide solutions to local issues within the framework of individual functional elements of logistics systems. These can be industrial or commercial enterprises, or territorial production complexes.
New technologies, new means of communication, the ubiquity of the Internet, and Industry IV technologies create new opportunities for business development and have a revolutionary impact on logistics systems [
2,
3,
4]. Companies have to respond to new challenges and introduce digital innovative technologies by changing the patterns of communication with customers, methods of products selling and delivering and their own organizational structure [
5,
6].
Open innovation can be a form of socioeconomic activities and business in logistic system, which implies, in contrast to the existing approaches to creating and using innovation, a more flexible policy in terms of R&D and intellectual property.
Open innovation is a model for managing socioeconomic activity and business for innovation, which contributes to cooperation with people and organizations outside the company. In this respect, this innovative model becomes viable if the company recognizes that there are a lot of bright professionals and more profound knowledge outside the organization.
Companies can use the practice of open innovation for digital transformation in many ways, such as alliances between companies, research departments at universities, competitions for crowdsourcing and innovative ecosystems.
Using open innovation as a model for managing business, digital transformation of logistic systems can become a reality. Such a development of digital transformation can be already observed in various countries and companies around the world.
All industrially developed countries have adopted the Industry 4.0 development programs. They include using AI technology, the Internet of Things in production industry, the Cyber-Physical System in production processes, as well as applying Augmented Reality, Big Data, Cloud Technologies, autonomous robots, horizontal and vertical integration of systems, information security, and digital modelling [
7].
The study
The assessment of the digital economy development in the countries of the European Union [
8] analyzed the development and influence of digital transformation on the global logistic system, which the European Union can be referred to, according to the concept discussed in the paper. It was concluded that the model of digital economy development in the EU countries is nothing but Open Innovation.
In this context, we can see how digital technologies actively penetrate into all spheres of life of our society, which means that it is important and necessary to analyze how digital transformation affects the development of the logistic system. The business community and the governments of various countries around the world realize that the processes of digitalization and digital transformation of the economy must be accelerated, and so analytical, scientific and methodological studies have to be carried out to see how such changes can be introduced.
Based on the above, the paper is aimed at discussing the methodological principles that can be used to assess the impact of digital transformation on the indicators of the logistic system.
The results of the research study are put down in the following sequence: the relevance of the research study and its purpose are formulated; a literature review on the knowledge of the problem is presented; the methodology is provided for assessing the impact of digital information technology on the development of a logistic system; Salesforce company is selected for the case study to assess the impact of digital information technology on the development of a logistic system; a model is built to evaluate the effect of digitalization; results are obtained and discussed, and conclusions are made.
The formulated methodological principles are generalized and can be applied to assessing the impact that digitalization makes on the development of any type of a logistic system: megalogistic, macrologistic, or micrologistic.
The new result of the research study is the methodology suggested for a comprehensive assessment of the impact that digitalization has on a totality of interrelated and interdependent resulting indicators of a logistic system.
A comprehensive assessment of the impact that digitalization has on a totality of interrelated indicators of a logistic system is understood as a change of the indicators caused by digitalization. Such a change of the indicators is obtained as a result of solving a system of interdependent econometric equations. The methodology was tested on a micrologistic system for which Salesforce company was chosen as an example. The source data for the system of interrelated econometric equations, the variables and the stages of the methodology are presented in
Appendix A,
Appendix B,
Appendix C,
Appendix D.
The model can be quite easily reproduced, because the authors have worked out a methodology for selecting the parameters of the model and tested it on some logistic systems, including that of Salesforce. Such models can be applied without difficulty in any sphere where endogenous and exogenous variables can be chosen.
2. Literature Review
The literature review covers the development of cutting-edge digital production and information technologies. The maturity level of these technologies is very heterogenous. The authors did not intend to assess the relative impact of each technology on the development of micrologistic systems. The review is aimed at demonstrating that digital technology is developing and, consequently, there is need for assessing the impact they make on logistic systems.
The main trend of modern technological development is the convergence of advanced production and digital information technologies [
9,
10]. The development of intelligent sensors has triggered a breakthrough in this field. A distinctive feature of intelligent sensors is their ability for self-recovery after a single failure. Sensors of this type are referred to as ‘smart sensors’ in the English-speaking scientific community [
11]. Today, there are intelligent sensors with built-in electronics, including a microprocessor, a digital signal processor, and a digital interface that supports network protocols for communication. The intelligent sensor can be embedded into a wireless or wired sensor network, due to the self-identification function in the network with other devices. The capabilities of intelligent sensors and the convergence of advanced manufacturing and digital information technologies allow for the creation of social–cyberphysical systems [
12,
13].
The following technologies have the greatest influence on the development of a micrologistics systems of various levels and types: Internet of things and production automation [
14]; digital design and modeling [
15]; virtualization and cloud computing technologies (virtual cloud infrastructure for business) [
16]; mobile technologies and cross-channel communications [
17]; technology of unmanned aerial systems [
18]; artificial intelligence technologies, big data analytics, robotics, 3D printing and various types of digital Internet platforms [
19,
20,
21].
The examples of advanced manufacturing technologies with integrated digital information technologies are the following: automated design and engineering, flexible manufacturing centers, robots, automated guided vehicles, automated storage and retrieval systems. All of them can be connected into a single flexible production system and ultimately be integrated into a single automated enterprise or an integrated computer production system [
22,
23]. The convergence of production technologies with digital information technologies leads to increased productivity, the emergence of new markets and the creation of new business models and services [
24,
25,
26].
Digital transformation of logistics systems is a multifaceted process where digital technologies are introduced at different stages of the production chain, as well as in management systems at the level of companies and government agencies. As technologies evolved, automation processes have been augmented with elements of informatization and digitization. In fact, all these components have become an integral basis for digital transformation at the level of micro-logistics systems, at the level of macro-logistics systems, and at the level of mega-logistics systems. Digital transformation of logistics systems is a multifaceted process where digital technologies are introduced at different stages of the production chain, as well as in management systems at the level of companies and government agencies. As technologies evolved, the automation processes have been augmented with elements of informatization and digitization. In fact, all these components have become an integral basis for digital transformation at the level of micro-logistics systems, at the level of macro-logistics systems, and at the level of mega-logistics systems.
In any case, the efficiency with which these systems can operate is a crucial factor for any type of systems involving digital transformation technologies. Efficiency is one of the most general economic concepts that does not yet have a universally accepted definition.
The efficiency of introducing digital transformation technologies is typically assessed in several stages. This includes the choice of indicators that adequately characterize the processes occurring, and the analysis of the effects, that is, the different results, which may be technological, economic, social, environmental, etc.
In particular, other effects include human-oriented and social results of innovations, such as creation of new jobs; improving working conditions; creation of humane relations within the working teams by introducing novel managerial methods; accelerating the processing of orders and improving control over all processing phases; “transparency” of costs and benefits for the management of the enterprise; increasing the flexibility of the enterprise and the speed of reaction in terms of adaptation to changing external conditions.
Maintaining high development rates and high levels of profitability, decreasing the number of personnel, including highly qualified personnel, decreasing the labour intensity also serve as efficiency criteria.
An important indicator influencing the effectiveness of introducing digital transformation technologies is the level of competition in the sales market for the goods planned to be produced using this technology. This level can be assessed using various indicators, in particular, the number of competing enterprises taking into account the market share owned by each of them.
Urbach and Ahlemann [
27] believe that the effectiveness of adopting digital technologies should be considered from the standpoint of creating new value based on information technologies. The inflow of external investments at a given level of liquidity is viewed as a factor creating the new value. Furthermore, as postulated in [
28], in addition to tracing the sequence, speed, and quality of operations, it is possible to calculate and budget the costs of low-level operations.
Fereidouni et al. [
29] assumed that activities related to digital technologies extend the opportunities available to enterprises by allowing them to create networks based on interdependence and interconnectivity. At the same time, the main effects from introducing these technologies are associated with direct and indirect costs of the network constructed.
Bouwman et al. [
30] analyzed the existing literature, developing their own model for measuring the effectiveness of integrating digital technologies for small and medium-sized enterprises. The model is based on a set of individual indicators measuring the duration of the experiment, budget, sales growth, profitability growth, market value growth, market share, etc. A factorial model (IBM SPSS v.24 package, IBM, Armonk, NY, USA) was built, where individual selected indicators were taken as independent variables (factors). The overall performance of the company was selected as a dependent variable characterizing the efficiency of implementing digital technologies in small and medium-sized enterprises, which was measured subjectively. In fact, these authors structure a certain set of indicator estimates into factors.
König et al. [
31] conducted an empirical study of 242 enterprises, comparing digital and non-digital innovative enterprises. It is concluded that digital enterprises bring their business to the market at an early stage and look for investments after that in order to achieve success. Non-digital innovative enterprises need investments to create products to be tested in the market. The indicator of transaction costs with customers, suppliers, financiers and other parties was selected as a criterion for achieving success for digital enterprises. It seems that this criterion can also be considered as an indicator for assessing the efficiency of implementing digital technologies. This conclusion is confirmed in [
32], presenting a study on the effectiveness of transition from traditional reporting between business and government to digital reporting for three jurisdictions, the Netherlands, the UK, and Australia. Digital reporting reduces transaction costs without compromising regulatory efficiency.
Burchardt and Maisch [
33] suggest evaluating digital business strategies through open innovation, where the development process is open to other stakeholders. Marjanovic et al. [
34] offer crowdsourcing as a form of digital open innovation. The strategy and program for digital transformation can be based on the assessment of digital maturity of an enterprise in five integrated areas: strategy and business model, consumers, organizational culture and personnel, operational processes and information technology.
Boyd [
35] builds a community trust model for the eBay online auction. The eBay online auction regards the community as the foundation of security based on the values of an honest and transparent environment.
Stressing the clear advantages and irreversibility of implementing digital technologies in various processes, individual products and business models, many researchers observe significant problems for the business itself [
36].
Sorensen [
37] estimates that digitalization and some of its key features such as network effects, big data and algorithms pose a number of risks associated with competition. One such risk is that digitization and using algorithms, price robots, and artificial intelligence can contribute to both explicit and implicit collusion.
Gallipolia and Makridis [
38] make a valid observation that introducing digital technologies changes the structure of markets, with the service sector developing while the share of industry is decreasing. Sauter [
39] describes the risks of digital dominance based on data, network effects, platforms, and user advantage. These risks can lead to unfair treatment of competitors, suppliers and consumers, for example, to discrimination.
At the end of the literature review, we present an analysis of sources showing the relationship between the subject of the article and the methodology for causal assessment of the impact of digital transformation on company performance. The causal impact of digital transformation on company performance is presented in the Simultaneous equations model. Let us name the main provisions of the methodology for the causal assessment of the impact of digital transformation on company. Two provisions of the methodology are significant: (a) the structure of the company’s ties in the context of digital transformation; (b) defining the parameters of the model. The structure of the company’s connections in the context of digital transformation must be displayed in the model. The task is to display the mutual influence of digital technology indicators and company indicators. Digital technologies influence the growth and development of the company. The growth and development of the company affects digital technologies, allowing them to use the additional profit from growth on new technologies. Such thoughts can be found in [
40] on the example of the development of the nickel market. In [
41], a model of a simultaneous system of two equations is presented. This study presents an estimate of the joint determination of labor market status and educational attainment in Australia. Study [
42] focuses on the three-way causality between income, trade openness, and energy consumption through the use of the simultaneous-equation panel data models (SEPDM) for 24 middle- and high-income countries. The problem of determining the parameters of the model is also reflected in the literature. The authors of [
43] emphasize that identifying the parameters in a simultaneous equations model (SEM) is typically a crucial step when employing SEMs for economic analysis. Monte Carlo simulations are used to explore the small sample properties of the asymptotically valid methods. In [
44], the maximum likelihood estimation of the parameters of a Multilevel Simultaneous Equation Model (MSEM) is considered. Using simulated data under the model assumptions, the performance of the maximum likelihood estimator (MLE) is assessed with regard to other conventional alternatives such as two-stage least squares estimator (2SLS).
3. Methodology
3.1. Review of Approaches to Assessing the Impact of Digital Transformation on the Indicators of the Micrologistic System
The intensive digitalization of the economy has given rise to the illusion that the introduction of single digital information technology is well enough for the comprehensive development. The experience has shown that only an integrated approach with the simultaneous use of production and digital information technologies brings the desirable effect.
The article discusses the provisions to assess the benefits of the digital economy for the company from using digital information technology. In the classical economic literature, the main indicators of efficiency are the following: the economic effect, the economic efficiency from capital investments and the payback period of capital investments. Such an approach should be used when justifying financial efficiency, budget efficiency, and determining the social effect [
45,
46,
47].
The article applies a multi-criterial approach to assessing the impact of digital economy technologies on the development of a company [
48,
49].
The principles for evaluating the effectiveness of digital technologies are as follows:
- (a)
the projects are implemented taking into account technical and economic feasibility;
- (b)
the costs of introducing digital technologies should include the costs of all technologies, hardware and software systems involved in the implementation of digital technologies [
50];
- (c)
the comprehensive assessment of digital technologies’ effectiveness should take into account the synergy of the impact on all indicators related to the results of activities [
51,
52].
One of the important components of the efficiency of digital transformation technologies is the efficiency of capital investments. The efficiency of capital investments is a fairly well studied problem, both in theoretical and practical terms. It is expressed as the ratio of the effect obtained to the capital investments that caused this effect. In other words, it is the economic effect per unit of investment providing this effect. This subject was considered in numerous publications for a diverse range of examples.
The efficiency of capital investments is measured by a set of indicators including the overall effect of capital investments, their rate of return, payback period, efficiency metric, and others. The indicators of the economic efficiency of capital investments are used to compare alternative investment projects and select the optimal project.
The methodology for assessing economic efficiency for digital transformation technologies for different types of logistics systems is universal and is determined by the ratio of discounted costs for developing digital technologies and benefits (results) from using these technologies; however, the methods for performing such an assessment may differ for different particular cases of logistics systems.
At the same time, the methodology for assessing the economic efficiency of any digital transformation technologies for different types of logistics systems is oriented towards estimating the local results for certain effects and criteria or indicators. For example, the technological effects associated with reducing the number of personnel when introducing remote accounting systems, including the automation of equipment control processes, are local. The environmental effects associated with using unmanned aerial vehicles for monitoring oil spills are local as well. In other words, the author chose the traditional methodology for assessing economic efficiency as a theoretical basis, applying a local approach to assessing efficiency.
However, introducing digital transformation technologies for different types of logistics systems can have multiple effects, i.e., has a systemic character. As digital solutions are introduced in different types of logistics systems, the influence of these solutions is transmitted along the technological chain and (to some extent) changes the production parameters of objects in the logistics system, affecting the parameters of the logistics system as a whole. Most of the technological effects are systemic, although some of them can be conditionally assumed to be local in terms of the strength of their influence on the parameters of the logistic system. For example, a decrease in volumes and a change in demand for a micro-logistics system are reflected in the production volumes required, changing in the short term the workload on the production equipment, and in the long term the volume of investments. Reducing losses along the technological chain as a result of introducing digital solutions also eliminates the need for to manufacture additional products to compensate for the losses. Preventing accidents and reducing the amount of repairs for production equipment through implementing digital solutions allows to reduce the volume of redundant production facilities.
A quantitative assessment of this effect, which has a systemic nature, is a complex challenge for research and for practical applications; this problem can be tackled by breaking down the solution into several stages, using different model tools for each stage. The first stage consists of technical and economic assessment of the efficiency of implementing digital solutions for a certain type of logistics system. In this case, it is not the individual technologies comprising the digital solutions that are considered (for example, a cloud computing system or remote monitoring of equipment), but complex digital solutions combining different digital technologies that can modify the parameters selected for the given type of logistics system. The change in the selected parameters of the logistics system is determined in the course of this assessment.
At the second stage, the impact of individual digital transformation technologies on the scale of the logistics system is assessed. The mutual influence of individual digital transformation technologies is analyzed along with the influence of these technologies on the parameters of the logistics system. This assessment covers the changes in the selected parameters of the logistics system occurring provided the mutual influence of individual digital transformation technologies.
This methodology and research study have some constraints. The constraints of the methodology include the problems related to short time series. The main problems arising when time series are short are as follows:
- (1)
with a short time series, it is impossible to reveal the development of a process;
- (2)
the assessments of the model parameters are unreliable;
- (3)
the adequacy criteria become inapplicable;
- (4)
when short series are analyzed, there is no point in using complex models, since large samples are needed to assess them.
The constraint of this research is that the empiric testing of the suggested methodology of comprehensive assessment of the impact made by digitalization on a totality of interrelated and interdependent resulting indicators was carried out only for the micro-logistic system. The empirical testing of the suggested methodology of comprehensive assessment of the impact made by digitalization on a totality of interrelated and interdependent resulting indicators was not conducted for megalogistic and macrologistic systems.
The methodology for assessing the impact of digital transformation on a micrologistics company, proposed by the authors, can also be used to assess the impact of digital transformation on a megalogistics and macrologistics company. The methodology for assessing the impact of digital transformation on any company is the same.
The criterion for classifying a company as a micrologistic, megalogistic or macrologistic company is the amount of revenue from the company’s activities, as well as the size of the employees in the company. Assessing the impact of digital transformation on any company consists in choosing the resulting indicators of the company, among which we choose technological, social and economic. For a mathematical model, these indicators are endogenous variables. The impact of digital transformation in a logistics company is the change in these endogenous variables under the influence of digital technology.
3.2. Methodology of Assessing the Impact of Digital Information Technology on the Development of the Company
The methodology for assessing the impact of digital economy technologies on the development of a company is based on causal relationships, which make it possible to verify the relationship of economic indicators. Methods of economic modelling, the morphology of the conceptual apparatus, comparison, synthesis of statistical data are applied. For example, structural equation modeling (SEM) is a combination of factor analysis and multiple regression analysis, and it is used to analyze the structural relationship between measured variables and hidden constructs. This concept should not be confused with the corresponding concept of structural models in econometrics and with structural models in economics [
53,
54,
55].
The use of SEM is justified in the social sciences because of the ability to identify relationships between unobservable structural information constructions (latent variables) and observable variables [
53]. In psychology, SEM is a popular tool [
54].
In the presented article, the concept of structural models is used, in which the endogenous variables of the model are functions of other endogenous variables plus their past values plus exogenous variables. The concept of structural models is used to model a multidimensional dynamic production and economic system, which include logistics systems.
The requirements for the mathematical model of a multidimensional dynamic production and economic system are as follows:
a model of a production and economic system is a formalized description of several processes in the form of a mathematical expression of the dependence of endogenous variables on exogenous variables and parameters;
the mathematical model is built on the basis of the observed data;
the dynamics of the process in the mathematical model is displayed by a time series;
the mathematical model takes into account the interaction and interdependence of processes;
the mathematical model takes into account the prehistory of the process and its impact on the current state of the process;
the model uses lags-exogenous or endogenous variables, dated to previous points in time and in an equation with the current variables.
Both the dependent variables and the independent variables are time series, i.e., the model is dynamic. If we describe one equation, we can say that the current values of the series depend both on the past values of this series and on the current and past values of other time series.
This representation of the model is known as structural form. The structural form of the model shows all the cause and effect relationships of the investigated multidimensional dynamic production and economic system. When calculating the estimates of the equation in such cases, the usual least squares method gives biased results [
56].
The computational methods that are used to compute the scores are two-step least squares (2SLS or TSLS), indirect least squares, three-step least squares (3SLS). For this, the structural system of equations is transformed into a reduced form. After evaluating the coefficients of the reduced form, the model must be returned to the structural form. In the transition from the reduced form of the model to the structural one, the researcher is faced with the problem of identification.
Identification is the uniqueness of the correspondence between the structural and reduced forms of the model. It is necessary to identify the structural parameters of the model [
57].
After describing the novelty of the model, we describe the problem, formulate the prerequisites and axiomatics of building an econometric model [
58], justify endogenous variables for evaluating the company’s activities and justify the choice of exogenous variables for each endogenous variable.
The authors’ methodology that is applied to select the indicators for assessing the maturity of a logistic system is based on dividing the indicators into production, financial, and socioeconomic ones. With this approach various areas where a logistic system is operating can be embraced and the capabilities of the logistic system during its development can be pointed out.
The literature review shows that in order to assess the stability in development of various systems, quite a big number of various indicators are used [
59,
60,
61,
62]. As a rule, the following approaches can be applied: ratio analysis, Technique for Order of Preference by Similarity to Ideal Solution (TOPSIS), Complex Proportional Assessment (COPRAS), Data Envelopment Analysis (DEA).
The advantage of the method used in the suggested methodology to select indicators is the consideration of the interrelation and interdependence of the indicators. This reflects the real life of various socioeconomic systems where all resulting indicators are interdependent and affect each other.
The dependent variables used are variables namely Revenues, Marketing costs, Equity, Number of employees, Net income, Market capitalization (
Appendix A,
Table A1).
The independent variable used in this research is R&D Expenses for the development of digital technology.
In addition to the main independent variable of R&D Expenses, several control variables are used, namely Share capital, Earnings per share, GDP of the USA, Net national income of the USA, Inflation of the USA (CPI) (
Appendix A,
Table A2).
Table 1 shows the dependent variables for building a model assessing the impact of digital information technologies,
Table 2 shows the independent variable.
Secondly, we use special methods of parameterization due to the violation of the prerequisites of the least-squares method.
Then we check the time series of variables for stationarity using the Dickey–Fuller test;
Next, we make a structural form of the model in the general view. The structural view of the model is based on the following statements:
- (a)
The process of development of a logistic system is assessed with indicators—a set of endogenous variables (denoted as ), selected according to the procedure proposed by the authors;
- (b)
There is a prehistory of the process of development of the logistic system, i.e., each endogenous variable is affected by the values of the previous periods of the endogenous variable denoted as (;
- (c)
The endogenous variables mutually influence each other;
- (d)
Each endogenous variable is affected by internalities and externalities, evaluated by the exogenous variables (denoted as ).
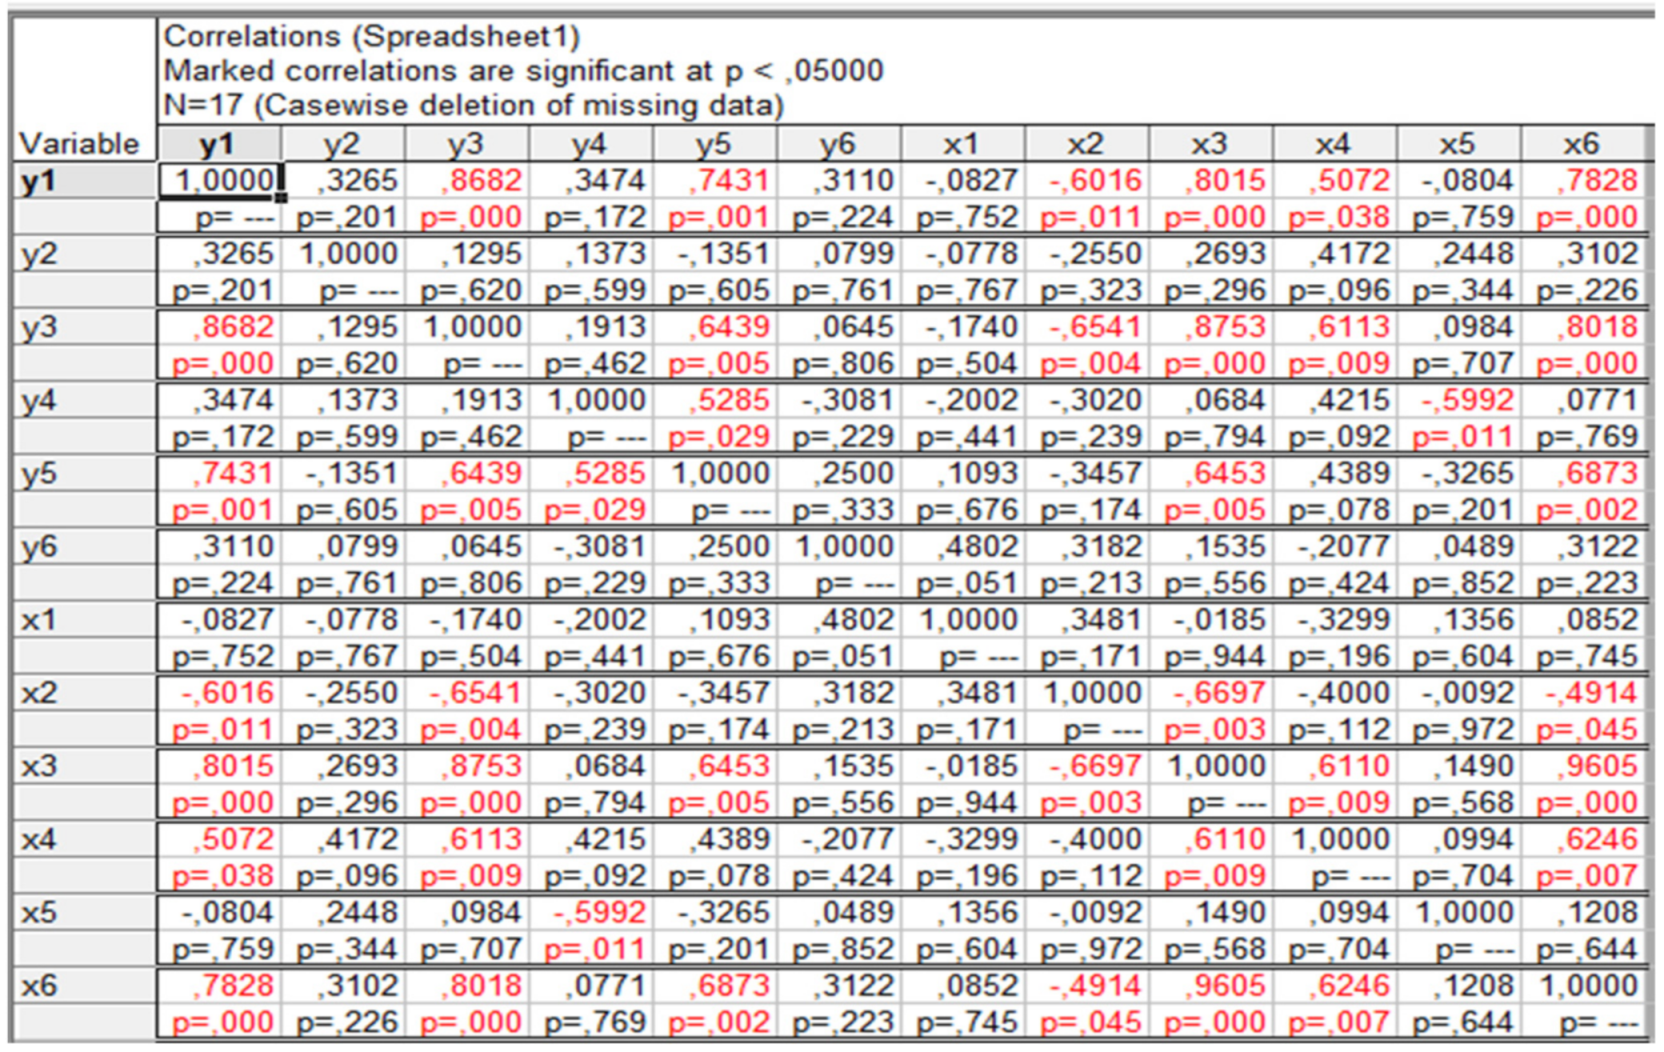
For each equation, we check endogenous and exogenous variables for multicollinearity based on the correlation matrix.
Next, we select lags of the endogenous variable that have a strong correlation with the value of the variable at the last stage and check the autocorrelation coefficients using Ljung–Box Q-test.
The system of equations in the structural form based on the analysis of variables is to be written (
Appendix C).
Then, we consider the identifiability of the system of equations (
Appendix D).
We bring the structural form of the model to the reduced formulae using linear transformations.
The coefficients of each equation of the model are determined using the method of least squares (
Appendix E).
The reliability of the determination coefficient by Fisher’s F-criterion is determined.
The values of endogenous variables for equations are obtained.
Based on the model obtained, we forecast the values of endogenous variables within a selected range.
4. Results
4.1. Analysis of the Company Salesforce Innovation and Technological Activities
Salesforce widely introduces modern digital technologies [
63,
64]. Salesforce has introduced the Internet of Things cloud.
The Internet of Things is the new passion of Mark Benioff, the Salesforce Chief [
65]. Recently, the company introduced Salesforce IoT Cloud, a platform through which companies can use the Internet of things to improve relationships with customers. How? New Salesforce Mantra: Customer Relationships imply the relationships with customers and their things, firstly, with the things that you sold to him. For example, the car sold to a customer should have sensors connected to the Internet that send a signal to CRM when it is time for its maintenance. Secondly, a client’s smartphone independently, or with the help of its owner, sends signals to the Internet (for example, messages to social networks), which should be processed by your CRM and turned into useful information or actions (for example, sending an SMS message) [
66].
Salesforce has launched Community Cloud.
To date, Salesforce has had three products referred to as a cloud: Sales Cloud, Marketing Cloud, and Service Cloud. Now there is a fourth one, Community Cloud. In fact, this is only a remake of the Salesforce Communities system (which was launched a year ago). However, raising the status of this product in the Salesforce hierarchy and the fact that it now stands above the social Chatter intranet means that Salesforce considers it very important. Unlike Chatter, which was designed to organize communication and collaboration within a company, Community Cloud allows you to create a single communication space for customers, partners and employees-something like LinkedIn’s own network. The Community Cloud is also connected with other Salesforce clouds. In particular, community discussions can be tied to customer profiles in the Sales Cloud or to tickets in the Service Cloud. The basic cost of Community Cloud starts at $500 per month.
Salesforce is now connected with SharePoint and OneDrive.
Salesforce (with Microsoft) launched the Salesforce Files Connect module, which allows users of its CRM system to access files stored in SharePoint or Microsoft OneDrive. Other file storages (Dropbox, Box, Google Drive) are expected to be added, but so far Salesforce does not set any dates, apparently, to work out the agreements achieved with Microsoft. Salesforce Files Connect allows you to view, search, and share internal and external files in a single interface environment [
67].
Salesforce has introduced a sales accelerator.
Salesforce introduced Performance Accelerator-an add-on to the cloud-based CRM system Sales Cloud, which, as the company states, can increase the performance of the sales department by 28% compared to using the Sales Cloud without this add-on. Performance Accelerator is a combination of a database of contacts/companies from the Data.com service and the Work.com employee motivation management system integrated into the Sales Cloud. Thus, each employee of the sales department is given a list of potential customers. With the goal set, they can compete with each other and receive ratings and bonuses. The video shows how it all works.
Salesforce has launched its own Chatter messenger.
In December 2009, GroupSwim was acquired, and on its basis, Salesforce Chatter was launched in 2010, providing its own messaging and collaboration service.
4.2. Testing Methods for Assessing the Impact of Digital Information Technology
General view of the system of equations:
Structural form of the model is as follows:
,
,
,
,
are the coefficients of the structural form of the model.
To obtain the reduced form from the structural one, we analyze the identification of the system of equations in order to determine the method of least squares, by which we will find the coefficients of the equations.
Following this methodology, we obtain the system of reduced equations.
All equations are statistically relevant and the regression equations are reliable (for the significance level α = 0.05).
Thus, the system of simultaneous econometric equations, which reflects the influence of digital technologies on the resulting indicators, is as follows:
The model obtained reflects the dependence of the resulting performance indicators of the Salesforce company in the global economy environment on the factors influencing it. This model makes it possible to identify the factors that influence the main indicators reflecting the Salesforce activity and the intensity of this influence.
This model also allows to forecast the values of indicators over a given time interval.
Appendix E explains how the model equations are derived. The equation parameters and test statistics are shown in
Table A10,
Table A11,
Table A12,
Table A13,
Table A14,
Table A15,
Table A16,
Table A17,
Table A18,
Table A19,
Table A20 and
Table A21: (a) test statistics, which are used in the calculation of the coefficients of the equations of the structural form of the model; (b) the criteria used to justify the selected equations. These are the well-known test statistics that allow us to judge the objective properties of the general population based on the results of our sample. Let us explain the information contained in the tables.
Table A10,
Table A12,
Table A14,
Table A16,
Table A18 and
Table A20 contain estimates of the coefficients of the equations of the structural form of the model, the standard error (SE) of an estimate of a parameter (coefficients), value t-Student’s criterion, p-level, confidence limits (lower and upper) of the confidence interval of the deviation of the values of the equation coefficients.
The equation is written under each table, to which the information in the table applies. Test statistics, which are used to substantiate the selected equations and assess the reliability of the equations of the structural form of the model, are written in
Table A11,
Table A13,
Table A15,
Table A17,
Table A19 and
Table A20: total sum of squares, the number of degrees of freedom, mean of the squares of a set of numbers, the F Statistic and
p Value.
The ratio of the value of the Fisher’s F-test of the general population (F theor.) and the value of the F-Fisher’s test of the sample (F real.) is written under each table.
5. Discussion
5.1. The Ability to Simulate the Impact of Digital Transformation in Mega-Systems
In the course of this research, we considered the performance characteristics of the Salesforce, analyzed the markets in terms of current trends and characteristic features and reviewed the sector of the world economy in which the company operates. The analysis of these features allowed for the selection of the indicators, with the help of which the economic model of the company’s activity was developed. This model made it possible to analyze the company’s operation in the global economy and assess the impact of R&D Expenses to digital technologies on such indicators of the company performance as total income, total assets, the acquisition of intangible assets and fixed assets, number of employees, net profit and market capitalization.
Within the framework of the section on Discussion, we attempt to outline the direction for the development of digital innovations in the global economy.
Yun and Zhao [
68] suggest a model of sustainable innovation in business models as a new combination between technologies and market (protected technology, protectable technology, and social technology). An innovative method for changing the existing business models is proposed as a means for modern assessment of the company’s activities in the global economy.
The criterion of sustainability based on different parameters was chosen as the main criterion for assessing the company’s activities. Zhuravlyov et al. [
69] propose to model the factors of sustainable development of a company, serving to construct tools for strategic assessments based on the concept of the company’s life cycle. The industrial specifics and the financial indicators are also taken into account [
70].
Models describing the functioning of innovative ecosystems are one of the basic directions for building a corporate strategy in the modern period. Examples of such innovative ecosystems include the inter-agency interaction of countries leading to sustainable development [
71], as well as the emergence of innovative leaders and followers [
72] of innovative production in the key industries. Internal research and development, as well as cross-sectoral network cooperation are typically considered as the main systemic factors in the formation and development of such innovative ecosystems [
73,
74,
75].
The factors characterizing digital technologies were most relevant for our study. Digital technologies were represented by such indicators as the cost of digital marketing technology and the total cost of research and development for the introduction of digital innovation technologies.
Evidently, the development of the digital economy affects various systems. The factors for assessing the impact of digital information technologies on the development of companies, the national economy and the global economy were described and substantiated in numerous studies.
In particular, Alkhatib et al. [
76] discuss the factors influencing the voluntary introduction of digital reporting into the official reporting practice of small-sized businesses. It has been explained why the main factors that have a positive effect on voluntary adoption of digital reporting are the company’s technological competence and support from top management. There is also an inverse effect, where the more sophisticated accounting systems and the cost of technology in turn influence the voluntary adoption of digital reporting. In this regard, it seems interesting to explore the extent to which the increase in R&D and technology expenses can have a positive impact on the company’s development in the future.
Mariani and Wamba [
77] presented a conceptual framework for innovation in the companies producing consumer goods. They proposed a mechanism by which customers can evaluate products, services and brands in real time using controlled online consumer reviews (OCRs) and advanced machine learning (ML) in order to predict demand and determine the market potential of the company’s new products.
Martínez-Caro et al. [
78] suggest evaluating a company’s efficiency in terms of the role of digital organizational culture. A research model is proposed, assuming that the development of the digital organizational culture contributes to both the process of digitizing the business and creating value via digital tools, with the ultimate goal of increasing the efficiency of the organization. It is concluded that introducing digital technologies into various business processes of a company does not bring automatic qualitative changes in these business processes by itself. A digital organizational culture should be adopted in addition to digitization of business. We believe that introducing digital organizational culture and maintaining digital strategies of companies should be parallel processes, generating a new digital corporate culture based on the principles of open social innovation.
The possibilities for transition from closed economic systems to open socio-economic systems in the context of the developing technologies of digital economy are considered in [
79]. The evolution of the economic system will be unstable if any of the sub-economies are too large or too small. In our opinion, the mid-term growth of market open innovation by SMEs and start-ups will balance the ratio of the other two sub-economies.
We have formulated the methodological principles for assessing the impact from implementing digital technologies on the enterprise’s development at the initial stages of introducing digital technologies into different business processes.
Based on the obtained model, the forecast of the above indicators was carried out for the period from 2017 to 2021, and the future trends were highlighted.
Analyzing the predicted values of such an indicator as total income, we can conclude that it tends to grow and that the econometric model we have built quite accurately reflects the impact of R&D costs on the company’s performance.
Let us give an example of a general description of a model belonging to megalogistic systems. The process of the impact made by digital transformation on the social sphere of the world economy is simulated. Let us take six indicators as the ones which assess the maturity of the social sphere of the world economy. These are endogenous variables for a system of interrelated (joint, simultaneous) equations:
Yt1 is the average value of the total world GDP per capita in the t-th year;
Yt2 is the average labor productivity in the world per capita in the t-th year;
Yt3 is the growth in population in the world in the t-th year;
Yt4 is the average inflation rate in the world in the t-th year;
Yt5 is the unemployment rate in the world in the t-th year;
Yt6 is the poverty rate in the world in the t-th year.
Let us choose six indicators affecting the maturity of the social sphere of the world economy and evaluating the development of digital transformation. These are exogenous variables for a system of interrelated (joint, simultaneous) equations:
Xt1 is the Networked Readiness Index (NRI), which is published by The World Economic Forum and the international school of business INSEAD every year since 2002.
Xt2 is the UN E-Government Development Index (EGDI).
Xt3 is the ICT Development Index (IDI), developed by the The International Telecommunication Union in 2007.
Xt4 is the World Digital Competiveness Index (WDCI), developed by the Swiss Montreux Business School.
Xt5 is the Digital Evolution Index (DEI), which is calculated according to the study of cross-cultural differences conducted by the Fletcher School’s Institute for Business in the Global Context (Tufts University, USA) in partnership with Mastercard.
Xt6 is the Digital Economy and Society Index (DESI), developed by the European Union (28 countries) to monitor the overall digital performance in EU countries.
The overall functional dependence of the system of interrelated (joint, simultaneous) equations is shown below.
It can be noted that the type of functional dependence (4) is identical to the functional dependence for the micrologistic system presented above. Micrologistic systems as well as megalogistics systems and macrologistic systems comply with the conceptual statements for simulation, developed by the authors. The model of a megalogistic system was not analyzed on real data. This is to be done in further research.
5.2. Digital Transformation in Logistics Systems, and Open Innovation
The digital transformation of the economy is objective and inevitable. It also takes place in logistics systems of all levels in the context of Industry 4.0. Logistics systems are complex technical and economic systems. Management of material, information, financial flows is carried out in order to maximize the satisfaction of the market demand for a specific product, for information about a product, for the possibilities of satisfying customer demand in such systems. Elements of logistics systems form a supply chain that ensures the movement of material, information, financial flows from initial sources to final sinks.
Modern logistics systems must be flexible, responsive to market changes, resistant to the influence of uncertainty factors, efficient and competitive. This can be achieved by supporting a continuous information exchange of up-to-date data, monitoring operational changes, information support for decision-making, and the introduction of rapid response algorithms. In other words, digital transformation is the dominant direction in the development of logistics systems at all levels.
Many organizations have begun to actively rebuild their operations and business models to prepare for these changes. A digital transformation of logistics processes is taking place on a global scale. An initiative called the Cloud Strategy has developed in the United States. The cloud strategy should allow the implementation of modern technological initiatives in the areas of creating “smart” industrial plants, shops, cities and transport systems, and grid technologies. At the same time, the most popular will be “cloud” and supercomputer solutions designed for social interaction, e-commerce, monitoring of supply chains of goods (including global logistics flows).
The drivers of digital transformation in logistics systems are “Industry 4.0 technologies: distributed ledger technologies (“blockchain”) in supply chain management; big data technologies; global navigation, satellite communications and onboard supply chain systems; systems and technologies of automatic identification; barcode and radio frequency (RFID) identification; “Internet of Things”; artificial Intelligence; robotics; unmanned vehicles; intelligent information control systems. The new digital logistics mechanism is the digital platform. A digital platform is an organizational and technological mechanism for creating a “corporate” unified digital environment.
In the context of the digital transformation of the economy, the concept of open innovation is gaining more and more popularity. Among the driving forces behind open innovation are the following:
- −
rapid dissemination of new knowledge with the free exchange of information by participants in the innovation process;
- −
free exchange of information allows you to determine the value and relevance of information;
- −
the use of diverse business models in the activities of logistics companies;
- −
creation of an appropriate infrastructure in the form of information platforms, online magazines;
- −
formation of value chains of an innovative product and expanding the range of commercialization of scientific research, development and technology.
These prerequisites led to the transition to an open model of innovation. Open innovation is a paradigm for R&D in business, a more flexible intellectual property policy. Open innovation is the concept of using knowledge to accelerate time to market for innovation. The key component of the open innovation model is the innovative interaction of subjects performing R&D. In the literature, we find a description of the process of jointly launching new products and services to the market, creating new commercial opportunities through the exchange of knowledge between partners. In recent years, this practice of innovation has become more widespread. The prerequisites for its emergence are the growing global competition, and the form of implementation is the creation of value by combining networks and knowledge. According to research [
80] in the European Union, the share of innovative companies operating in the field of open innovation at the end of the 2000s was 42%. The Open Innovation in value network issue is reflected in a large number of scientific publications.
In a study [
81] shows the various threads of relationships between knowledge providers and applicants that make the system truly reciprocal, responsible and responsive. When systems become open, the cost of finding inclusive innovation automatically decreases, and the knowledge system also becomes more symmetrical and inclusive. In the article [
82] analyzes the dynamics of open social enterprises. The authors identified the success factors of open social innovation, as well as the specific dynamics that underlie it. “The success of social enterprises depends on how much they strive to move towards open innovation” is an important finding of the study. Contributing to the promotion of open innovation in innovation management for logistics service providers (LSPs) talked about by article authors [
83]. Although comparatively much knowledge already exists about LSP innovation management, it is not integrated. More comprehensive research is required on innovation processes and innovation management systems in logistics service providers (LSPs).
An interesting quantitative analysis of the impact of information services to support small and medium-sized enterprises (SMEs) in South Korea on SME business performance is given in [
84]. Correlation-regression analysis was carried out for a sample of 487 firms. The authors’ research model shows the possibility of using quantitative analysis to assess the impact of open innovation on the performance of firms.
The diffusion of open innovation practices across the value chain by small and medium-sized manufacturers is outlined in [
85]. The author conducted a quantitative survey of 293 US small and medium-sized manufacturing companies. The study showed widespread use of open innovation methods throughout the firm’s value chain.
A wide range of questions about open innovation is presented in article [
86]. This article is an Introduction to the Special Issue on ‘Technology, Open Innovation, Markets and Complexity’. Its value is in a review of 10 articles published in this special issue. These articles cover policy related to innovation, innovation value chain/supply chain aspects, collaboration aspects, innovation in organizations of different sizes that exist between collectivism and individualism. The authors analyze the dynamic relationship between individualism and collectivism in open innovation. Referring to [
87], the authors emphasized the definition of ‘open innovation’ as ‘a distributed innovation process based on purposively managed knowledge flows across organizational boundaries, using pecuniary and non-pecuniary mechanisms in line with the organization’s business model’. This definition extends the scope of open innovation from a company to a consumer, industry, society or community. It also provides an answer to the research question: “How can we overcome the limits of the growth of capitalism?” An arsenal of science and technology, using the concept of open innovation, is seen as a powerful growth solution.
6. Conclusions
In this research we studied how digital transformation affects the indicators of a logistic system. The problem is acute, since digital technology is used everywhere. The key technologies on which digital transformation relies include the Internet of Things, (IoT), Augmented Reality (AR), Virtual Reality (VR), Machine Learning (ML), Artificial Intelligence (AI), Robotics, 3D-Printing, Big Data. The most amazing thing about digital transformation is that all these technologies can be used together. Technologies that increase communicative capabilities and improve access to financial, commercial and state services can bring about lots of opportunities to the public and improve the well-being of people.
Key findings of the study.
A. Based on the research, it can be concluded that the picture of the impact of digital transformation on various companies can be modeled using the Simultaneous equations model. Dependent variables in some equations of the model are on the left side (i.e., they act as indicative results), while in other equations they are on the right side of the equation (i.e., they act as indicative influencing factors). This has been proven by the example of a micro-logistics company. In the future, this will need to be done for other types of companies.
B. Simultaneous equations model is a tool to prove or disprove a hypothesis, which is formulated as follows: digital transformation improves company performance. At the same time, the Simultaneous equations model shows quantitative estimates of the impact of digital technologies on the company’s indicators. We can see how the endogenous variables of the model, taken as the resulting indicators of the company, change.
C. Simultaneous equations model displays the mutual influence and interdependence of digital transformation indicators and company indicators. The company uses digital technologies. Digital technologies affect the company’s indicators: competitiveness increases, revenue increases, profits, dividends, etc. grow. At the same time, digital technologies affect all indicators of the company at the same time. At the same time, company indicators influence digital technology. Competitiveness, additional profit, and revenue allow to increase R&D costs for digital transformation and use new digital technologies. In other words, the provisions of the methodology for the causal assessment of the impact of digital transformation on the company indicators presented in the article are workable.
D. Simultaneous equations model is a quantitative method for analyzing the relationships between company indicators in a digital transformation. The ability to simultaneously analyze a large number of indicators, as well as the “transparency” of the technique, make it possible to say that this is a reliable tool for quantitative analysis.
The practical meaning of the research results.
E. The coefficients of the model equations, which are calculated as a result of the analysis for each exogenous variable, show the strength and type of relationship of the exogenous variable with respect to the endogenous one. And exogenous variables are specific digital technologies that are used in a company. We also see a measurement of the relationship between an endogenous variable and several exogenous variables, i.e., several digital technologies. Therefore, the practical meaning of the Simultaneous equations model is that it allows you to model, validate, investigate, and quantify the impact of digital technology.
F. Item E referred to one company. You can compare several companies in terms of the power of influence of the same digital technologies.
G. Simultaneous equations model can also be useful for forecasting. We simulate the impact of digital technologies to predict their impact in the future, i.e., several years after the period of time, on the information of which the coefficients of the equations were found. The main goal is to build a predictive model that is both robust and accurate. Simultaneous equations model allows you to do this.
Limitations and future research.
H. Future studies should explore in more detail the possibility of getting rid of some of the limitations, such as the use of short time series in the model. Monte Carlo simulation begs for this purpose. The Monte Carlo method allows you to model the interdependent relationships between the original variables. To obtain reliable information, it is necessary to understand in which cases, with an increase in some factors, others correspondingly increase or decrease.
Moreover, the methodology assumed that the number of endogenous and exogenous variables in the model is the same. This assumption can be expanded and further investigated.
J. Further research may provide a more complete explanation of the Simultaneous equations model. Further refinement of this model will take into account the influence of a larger number of factors reflecting the technologies of the digital economy at various stages of the company’s life cycle. Such factors may include the degree of innovative activity and openness of innovations, the degree of the company’s adaptability to digital technologies, the level of the company’s technological competence. Ultimately, this will allow the creation of innovative ecosystems. According to Schiuma and Carlucci [
88], innovation ecosystems are aimed at supporting the development of the entrepreneurial and innovative potential of companies. We find a similar answer in studies [
89,
90,
91].
The main conclusion that can be drawn is that the results of this study confirm the possibility of using an interconnected system of econometric equations to analyze the impact of digital transformation on the indicators of the micrologistics system.


