Article

Detecting and Analyzing Fraudulent Patterns of Financial Statement for Open Innovation Using Discretization and Association Rule Mining

by
Siriporn Sawangarreerak
1 and
Putthiporn Thanathamathee
2,*
1
School of Management, Walailak University, Nakhon Si Thammarat 80160, Thailand
2
School of Engineering and Technology, Walailak University, Nakhon Si Thammarat 80160, Thailand
*
Author to whom correspondence should be addressed.
J. Open Innov. Technol. Mark. Complex. 2021, 7(2), 128; https://0-doi-org.brum.beds.ac.uk/10.3390/joitmc7020128
Submission received: 5 April 2021 / Revised: 2 May 2021 / Accepted: 6 May 2021 / Published: 9 May 2021
(This article belongs to the Special Issue Financial Open Innovations for Sustainable Economic Growth)

Abstract

:
Identifying fraudulent financial statements is important in open innovation to help users analyze financial statements and make investment decisions. It also helps users be aware of the occurrence of fraud in financial statements by considering the associated pattern. This study aimed to find associated fraud patterns in financial ratios from financial statements on the Stock Exchange of Thailand using discretization of the financial ratios and frequent pattern growth (FP-Growth) association rule mining to find associated patterns. We found nine associated patterns in financial ratios related to fraudulent financial statements. This study is different from others that have analyzed the occurrence of fraud by using mathematics for each financial item. Moreover, this study discovered six financial items related to fraud: (1) gross profit, (2) primary business income, (3) ratio of primary business income to total assets, (4) ratio of capitals and reserves to total debt, (5) ratio of long-term debt to total capital and reserves, and (6) ratio of accounts receivable to primary business income. The three other financial items that were different from other studies to be focused on were (1) ratio of gross profit to primary business profit, (2) ratio of long-term debt to total assets, and (3) total assets.

1. Introduction

The growth of businesses involves efficient corporate management, an understanding of economics, and social and political support. However, one of the problems that makes businesses unsuccessful and causes bankruptcy is fraud—an intentional act by individuals or groups, including corporate executives, who have a responsibility to appropriately govern employees or third parties but behave fraudulently to gain an illegal or unfair advantage. Accounting fraud is the misstatement of information in financial statements and is of two types: (1) the preparation of fraudulent financial reports and (2) the improper use of assets. Although an auditor could suspect fraud or identify a complicated event of fraud, they might have limited ability to detect fraudulent financial statements due to a lack of experience [1], such as the case of Enron’s and WorldCom’s accounting fraud, which were offenses committed by the companies’ management [2].
In the past few years, fraud in financial statements has frequently occurred in Thailand [3]. For example, Picnic Corporation Public Company Limited reported incorrect revenue by recording the gas tank deposit as revenue. Singha Paratech Public Company Limited, Circuit Electronic Industries Public Company Limited, and Roynet Public Company Limited showed inflated income. Power-P Public Company Limited reported unrealized revenue. Such actions may be caused by manipulated numbers in financial statements to allow for the unsustainability and limit of growth of the business. Due to these cases, the Securities and Exchange Commission, Thailand (SEC, Thailand) decided to revise financial statements.
The financial statements of a company, including statements of financial position, income statements, cash flow statements, and others, are documents with basic information that reflects the financial status of the company. The financial statements of all listed companies must be submitted annually and quarterly. Managers can use them to analyze the company’s finances in advance, investors can use them to analyze the risk associated with a company [4], and financial institutions can use them to analyze credit. Carefully presented financial statements can indicate whether the company is being run smoothly or is in crisis. If a company is in crisis, its financial statements can indicate what problems it is facing. Too much pressure put on a company to achieve financial stability or profitability may result in fraudulent financial statements. Therefore, an analysis of factors that may cause fraud in financial statements will enable the users of financial statements to employ the information in financial statements and the auditor’s report for timely and efficient analysis and decision making. However, the use of traditional internal auditing methods may not lead to the discovery of fraud and the auditor may lack experience [5]. Therefore, in data analysis, it is necessary to use an automated tool for analysis that can identify factors involved in the detection of fraudulent data in financial statements using data analytics, such as management data analysis, in order to obtain in-depth information and knowledge and identify interesting patterns from large amounts of data. This process uses statistical principles, mathematics, artificial intelligence, data mining, and machine learning techniques that involve the principles of data analytics, which are applied in many areas related to financial analysis. For example, they are used in bankruptcy prediction, credit card authorization, credit decisions, and stock analysis [4]. Most studies use traditional statistical multivariate analysis, especially logistic regression analysis [6,7,8,9]. Traditional statistical methods require compliance with the constraints of specific assumptions, such as the avoidance of collinearity of independent variables and their distribution. However, Chen [10] explains that empirical financial variables cannot meet relevant statistical conditions; therefore, the application of machine learning makes it possible to analyze and detect fraud in financial statements. Yao et al. [1] proposed to detect financial statement fraud based on 17 financial and 7 non-financial variables by using a support vector machine (SVM), classification and regression tree (CART), back-propagation neural network (BP-NN), logistic regression (LR), Bayes classifier (Bayes), and K-nearest neighbor (KNN). SVMs have the highest accuracy of detection, with 13 significant variables. Ravisankar et al. [2] used data mining principles related to prediction—e.g., multilayer feed-forward neural network (MLFF), SVMs, genetic programming (GP), group method of data handling (GMDH), LR, and probabilistic neural network (PNN) techniques—to identify companies committing fraud in financial statements. Each technique was tested on a dataset of 202 Chinese companies. The PNN technique performed better than all the techniques without characterization. When the trait was extracted, GP and PNN techniques were the most effective at detecting fraud in financial statements. Lin et al. [4] examined all aspects of the fraud triangle by using data mining and publicly available information to assess pressures, motives, opportunities, and attitudes. Rationalization is an examination of expert advice regarding financial fraud investigation. The authors also used an expert questionnaire and data mining (logistic regression decision trees (LDGT) and artificial neural network (ANN)) to distinguish various fraud factors. The prediction accuracy was 92.8%; the LDGT method provided a 90.3% prediction accuracy, which was 88.5% more than the logistic regression method. Chen [11] created a fraudulent auditing model. Both corrupt and non-corrupt financial statements between 2002 and 2013 were tested using classification and regression trees (CARTs) and a chi-squared automatic interaction detector (CHAID). CARTs and the CHAID were combined with classification methods using a naive Bayesian support vector machine and neural network techniques to create a fraudulent financial audit model. The detection efficiency of the CHAID–CART model was the best, with an overall accuracy of 87.97% (fraudulent financial statement detection accuracy was 92.69%). Song et al. [12] studied bulk cargo theft at ports using the Bayesian network method. They also applied a feature ranking method for selecting the important features of relevant risk. Jan [13] used an ANN and an SVM to screen important variables and found a superior model to detect financial statement fraud by spotting early signs. A CART, a CHAID, C5.0, and a quick unbiased efficient statistical tree (QUEST) were then applied to construct classification models.
According to the literature review, the following research questions were proposed in this study:
RQ1: When applying data analytics, what methods can be used to identify fraudulent patterns in financial statements?
RQ2: When using association rule mining to find fraudulent patterns and items of financial statements, how do we know that the associated patterns are fraudulent?
RQ3: Can the resulting fraudulent patterns be applied to detect fraud in other businesses?
Overall, based on previous research, this study makes the following contributions to the literature. First, the results give a better understanding of the relationship of associated patterns between financial items for detecting and analyzing fraud using association rule mining. Second, to further clearly identify the range of financial items, we applied binning discretization to determine the appropriate range of each financial item and find an associated pattern in the financial items.
Based on the research questions, this study will help financial statement users (human experts) analyze financial information via a financial instrument method and calculate financial ratios by analyzing each financial item. It is necessary to analyze how each financial item relates to other factors. Such analysis involves data that are affected by human bias. Therefore, actual data are not analyzed. This study uses data analytics to identify fraudulent patterns and financial items associated with fraudulent financial statements. The resulting relationship pattern is an open innovation for auditors, investors, and users that helps with analyzing and identifying fraudulent financial statements for decision making. This study proposes the analysis of financial items related to financial statements on the Stock Exchange of Thailand, including financial ratios reflecting liquidity and the levels of security, profitability, and efficiency of a company.

2. Materials and Proposed Methods

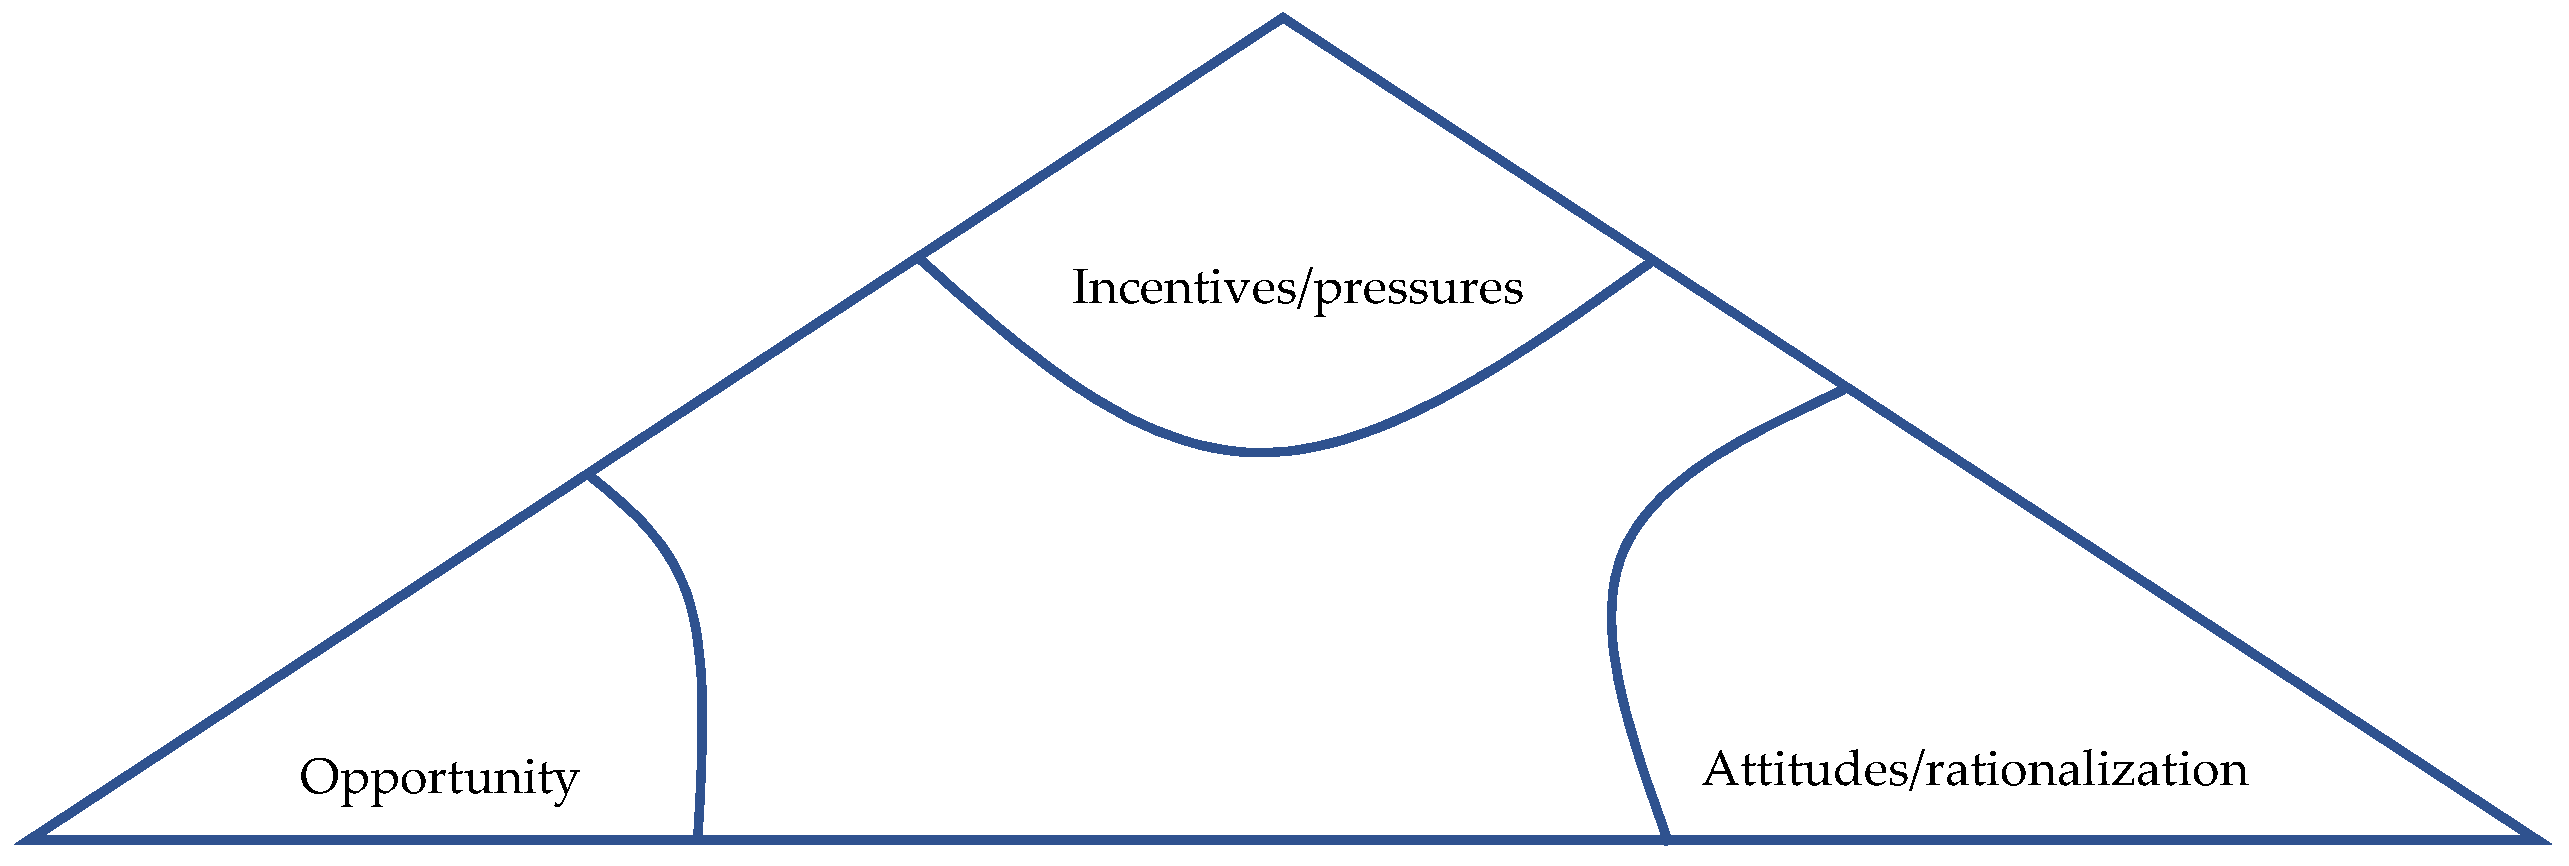
2.1. Fraud Detection

The US Association of Certified Fraud Examiners (ACFE), which was created to oppose fraud in business practices, defines fraud as an intention to use a position or profession for the benefit of improper use of the organization’s resources or assets. Fraud is classified into six categories: (1) misrepresentation of financial information, (2) misuse of company assets or misappropriation, (3) improper support or credit, (4) improper acquisition of assets or income, (5) avoidance of recognition of improper expenses or fees, and (6) improper financial arrangements by management or the board [11].
Cressey [14] developed and introduced the fraud triangle, as shown in Figure 1.
This is a model theory used to explain why most fraud occurs. This theory states that fraud is more likely to occur due to the availability of one or more elements of the fraud triangle: (1) opportunity; (2) incentives/pressures that result in fraud, such as insufficient financial pressure on spending and problems of insolvency from gambling; and (3) attitudes/rationalization, i.e., having attitudes or rational thoughts that are not appropriate and lead one to rely on gaps in the internal control system to conduct fraud.
In the accounting profession, it is the auditor’s responsibility to assess the risks of distorted financial reporting. Understanding the fraud triangle is important for assessing financial fraud [15]. The fraud triangle describes the probability of reporting fraud based on the three aforementioned factors: opportunities, incentives/pressures, and attitudes/rationalization. Regarding rationalization, Gozman and Currie [16] suggested that fraud often increases when the incentive is a need to achieve a goal or to avoid losing. Management faces incentives or pressures to turn to fraudulent practices. Opportunities exist, e.g., ineffective controls or controls that open up the possibility of manipulating fraud. Rationalization depends on the person and the situation they are facing, and it arises when the perpetrator finds a reason for fraud. Morales et al. [17] created the fraud triangle, which was initially developed after the creation of the fraud examination discipline. Machado and Gartner [18] proposed the theoretical framework of agency theory, of criminology, and of the economics of crime, combined with the fraud triangle, to investigate the occurrence of corporative fraud in Brazilian banking institutions.
According to Lokanan [19], using only the fraud triangle is not a sufficiently reliable model for antifraud professionals. Therefore, financial ratios are also used to detect financial fraud [20]. The use of financial ratios is an easy way to analyze numbers in financial statements and identify the strengths and weaknesses of a business. They can also help answer questions about data and how the business is performing, such as whether the business is carrying debt or inventory, whether customers will pay the debt according to the set conditions, whether operating costs are too high, and whether the company’s assets are used appropriately to generate income [2]. Kanapickienė and Grundienė [21] proposed a model of fraud detection by means of financial ratios and showed that profitability, liquidity, activity, and structure ratios are analyzed most often. Kourtis et al. [22] showed fraudulent earnings management practices that altered disproportionally artificially specific financial data. Climent et al. [23] identified 25 annual financial ratio series for commercial banks in the Eurozone that may help anticipate banks’ financial distress. De Luca and Meschieri [24] focused on accounting ratios to predict the financial distress status of a company based on linear discriminant analysis. Jiang and Jones [25] used 90 predictor variables, including financial ratios, market returns, macro-economic indicators, valuation multiples, audit quality factors, shareholder ownership/control, executive compensation variables, corporate social responsibility metrics, and others, to predict corporate distress with TreeNet®. In this study, the following financial ratios were used to analyze information in financial statements.

2.1.1. Liquidity Ratios

  • The current ratio is the ratio between current assets and current liabilities. It measures the ability to pay short-term obligations.
    Current   ratio = Current   assets Current   liabilities
  • The quick ratio, or acid test, is the adjusted version of the current ratio. The calculation does not include inventory with current assets, e.g., cash, accounts receivable, and marketable assets. Therefore, the quick ratio measures the ability to pay debts better than the current ratio.
    Quick   ratio = Current   assets     Inventory Current   liabilities
  • The cash ratio measures the liquidity of an entity.
    Cash   ratio = Cash   +   Cash   Equivalents Current   liabilities
  • Accounts receivable turnover is the number of times that an entity collects cash from sales. Therefore, this ratio gives information about policies of giving credit to debtors.
    Accounts   receivable   turnover = Net   sales Average   accounts   receivable
  • The collection period is the amount of time it takes for an entity to receive cash from sales in terms of the accounts receivable.
    Collection   period = Accounts   receivable   turnover 365
  • Inventory turnover measures the performance of the ability to sell goods.
    Inventory   turnover = Cos t   of   goods   sold Average   inventory
  • The holding period is the number of times an entity is able to sell its inventories.
    Holding   period = Inventory   turnover 365
  • The cash conversion cycle is the number of days that an entity will receive cash from its operations.

2.1.2. Efficiency Ratios

  • The total asset turnover measures how well asset management is used to turn sales or sales revenue over to an entity.
  • The net fixed asset turnover ratio shows the efficiency of an operation. It determines whether an entity is performing effectively in a given accounting period.

2.1.3. Profitability Ratios

  • The gross profit margin shows the sales and profitability performance after deducting the costs of goods sold, where a higher gross profit margin is better.
Gross   profit   margin = Net   income Net   sales
  • The operating profit margin measures the profitability of an investment after the total price has been calculated.
Operating   profit   margin = Operating   profit Net   sales
  • The net profit margin presents the profitability of an entity as a percentage of the sales.
Net   profit   margin = Net   profit Net   sales
  • The return on assets (ROA) shows the ability to make a profit from assets. It shows what an entity can do with its assets and how much income comes from asset control.
ROA = Net   income Total   assets
  • The return on equity (ROE) shows the return on investment in the equity of operation.
ROE = Net   income Average   shareholders   equity

2.1.4. Debt Management

  • The debt-to-asset ratio compares an entity’s debts and assets.
    Debt - to - assets   ratio = Total   liabilities Total   assets
  • The debt-to-equity ratio (D/E) shows which assets are borrowed and which come from the capital of the entity.
    D / E = Total   liabilities Shareholders   equity
  • The interest coverage ratio compares the operating profit with interest expenses.
    Interest   coverage   ratio = Earnings   before   interest   and   taxes Interest   expense
In this study, 35 financial items were collected to analyze the nature of the items that reflect fraud in financial statements [2], as shown in Table 1.

2.2. Association Rule Mining

Association rule mining is one of the most popular data mining processes. The relationship rule is used to correlate two or more sets of data within larger data groups [26] using several algorithms. For example, market basket analysis is used to find product relationships in customers who tend to buy when a promotional campaign is run based on correlation rules, the percentage of confidence, and the support costs incurred. The form of the correlation rule is A → B, where A is a condition and B is the result. All correlation rules must have a contribution and confidence greater than the required minimum. The rule estimate uses support and confidence values, where the support value is the probability that Y occurs when X occurs within the datasets. The confidence value is the conditional probability that Y is generated when X is generated (X → Y) [27].
Support ( x y ) = P ( x y )
Confidence ( x y ) = P ( y | x ) = P ( x y ) P ( x )
Lift is a value used to measure interest or verify relevance in established relationship rules. If one event occurs, how many other events also occur? If lift is greater than 1, then the two rules are related, but if lift is less than 1, the rules are not related or not dependent (i.e., independent) [27].
Relationship rules are accepted only when they have a support value (X∪Y) greater than or equal to the minimum support value and a confidence value (X → Y) greater than or equal to the minimum confidence value. Creating an association rule means creating a rule from all frequent item sets that are obtained by separating each frequent item set into a rule. For example, if i = beer, j = egg, and k = chicken, then item set {k,f,p} rules can be created as follows:
{i,j}→{k},
{i,k}→{j},
{j,k}→{i},
{i}→{j,k},
{j}→{i,k},
{k}→{i,j}.
From these rules, the number of antecedent items, when combined with the consequent items, must be equal to the number of frequent item sets, considering the sizes of both antecedent and consequent. They can be increased or decreased, but if one number is increased, the other numbers have to be decreased. Most importantly, the number of antecedent and consequent items must not be equal to 0. The confidence values are calculated and compared with the minimum support value if the rule is acceptable.

2.3. Frequent Pattern Growth (FP-Growth) Algorithm

Han et al. [28] developed an algorithm to reduce the number of readings from the database. A new data structure called an FP tree, or the FP-Growth algorithm, only reads data from the database twice and does not create a challenger group to reduce the processing time and work faster. The principle of the FP-Growth algorithm is shown in Algorithm 1.
Algorithm 1. FP-Growth Algorithm
Input: FP tree
Output: The complete set of frequent patterns
Method: Call FP-Growth (FP tree, null)
Procedure FP-Growth ( T r e e ,   α )
{
(1) if T r e e contains a single path P
(2) then for each combination (denoted as β ) of the nodes in the path P do
(3) generate pattern β α with support = minimum support of nodes in β ;
(4) else for each a i in the header of T r e e do {
(5) generate pattern β = a i   α with s u p p o r t = a i . s u p p o r t ;
(6) construct β ‘s conditional pattern base and then β ‘s conditional
FP tree t r e e β
(7) if t r e e β  
(8) then call FP-Growth ( T r e e ,   α ) }
}

2.4. Discretization

Discretization is the process of converting continuous data attributes into discrete data attributes to help reduce the size and complexity of the data. This study selected unsupervised discretization because the data did not have classes for classifying fraud data. The discretization techniques included binning with equal width and binning with equal frequency.

2.4.1. Binning with Equal Width

Binning with equal width is the process of dividing data by setting the data width to be the same for all layers of all attributes, called the k -value, where k is assigned by the user. The working procedures [29] are as follows:
(1)
Sort the data of continuous characteristic values ( v ) .
(2)
Calculate the minimum value of each characteristic ( v m i n ) .
(3)
Calculate the maximum value of each characteristic ( v m a x ) .
(4)
Obtain the range or number of layers using Equations (18) and (19):
interval = ( v m a x v m i n ) k ,
boundaries = v m i n + ( i + interval )
The boundaries are from i = 1 to k 1 .

2.4.2. Binning with Equal Frequency

Binning with equal frequency is similar to binning with equal width, but the characteristic values differ. A single value is used if there are duplicate data [29], where the number of layers the data are divided into is determined by the user, i.e., n, and each class member is calculated using Equation (20):
interval   frequency = nb _ unique _ values n ,
where nb _ unique _ values is the amount of data that do not repeat.

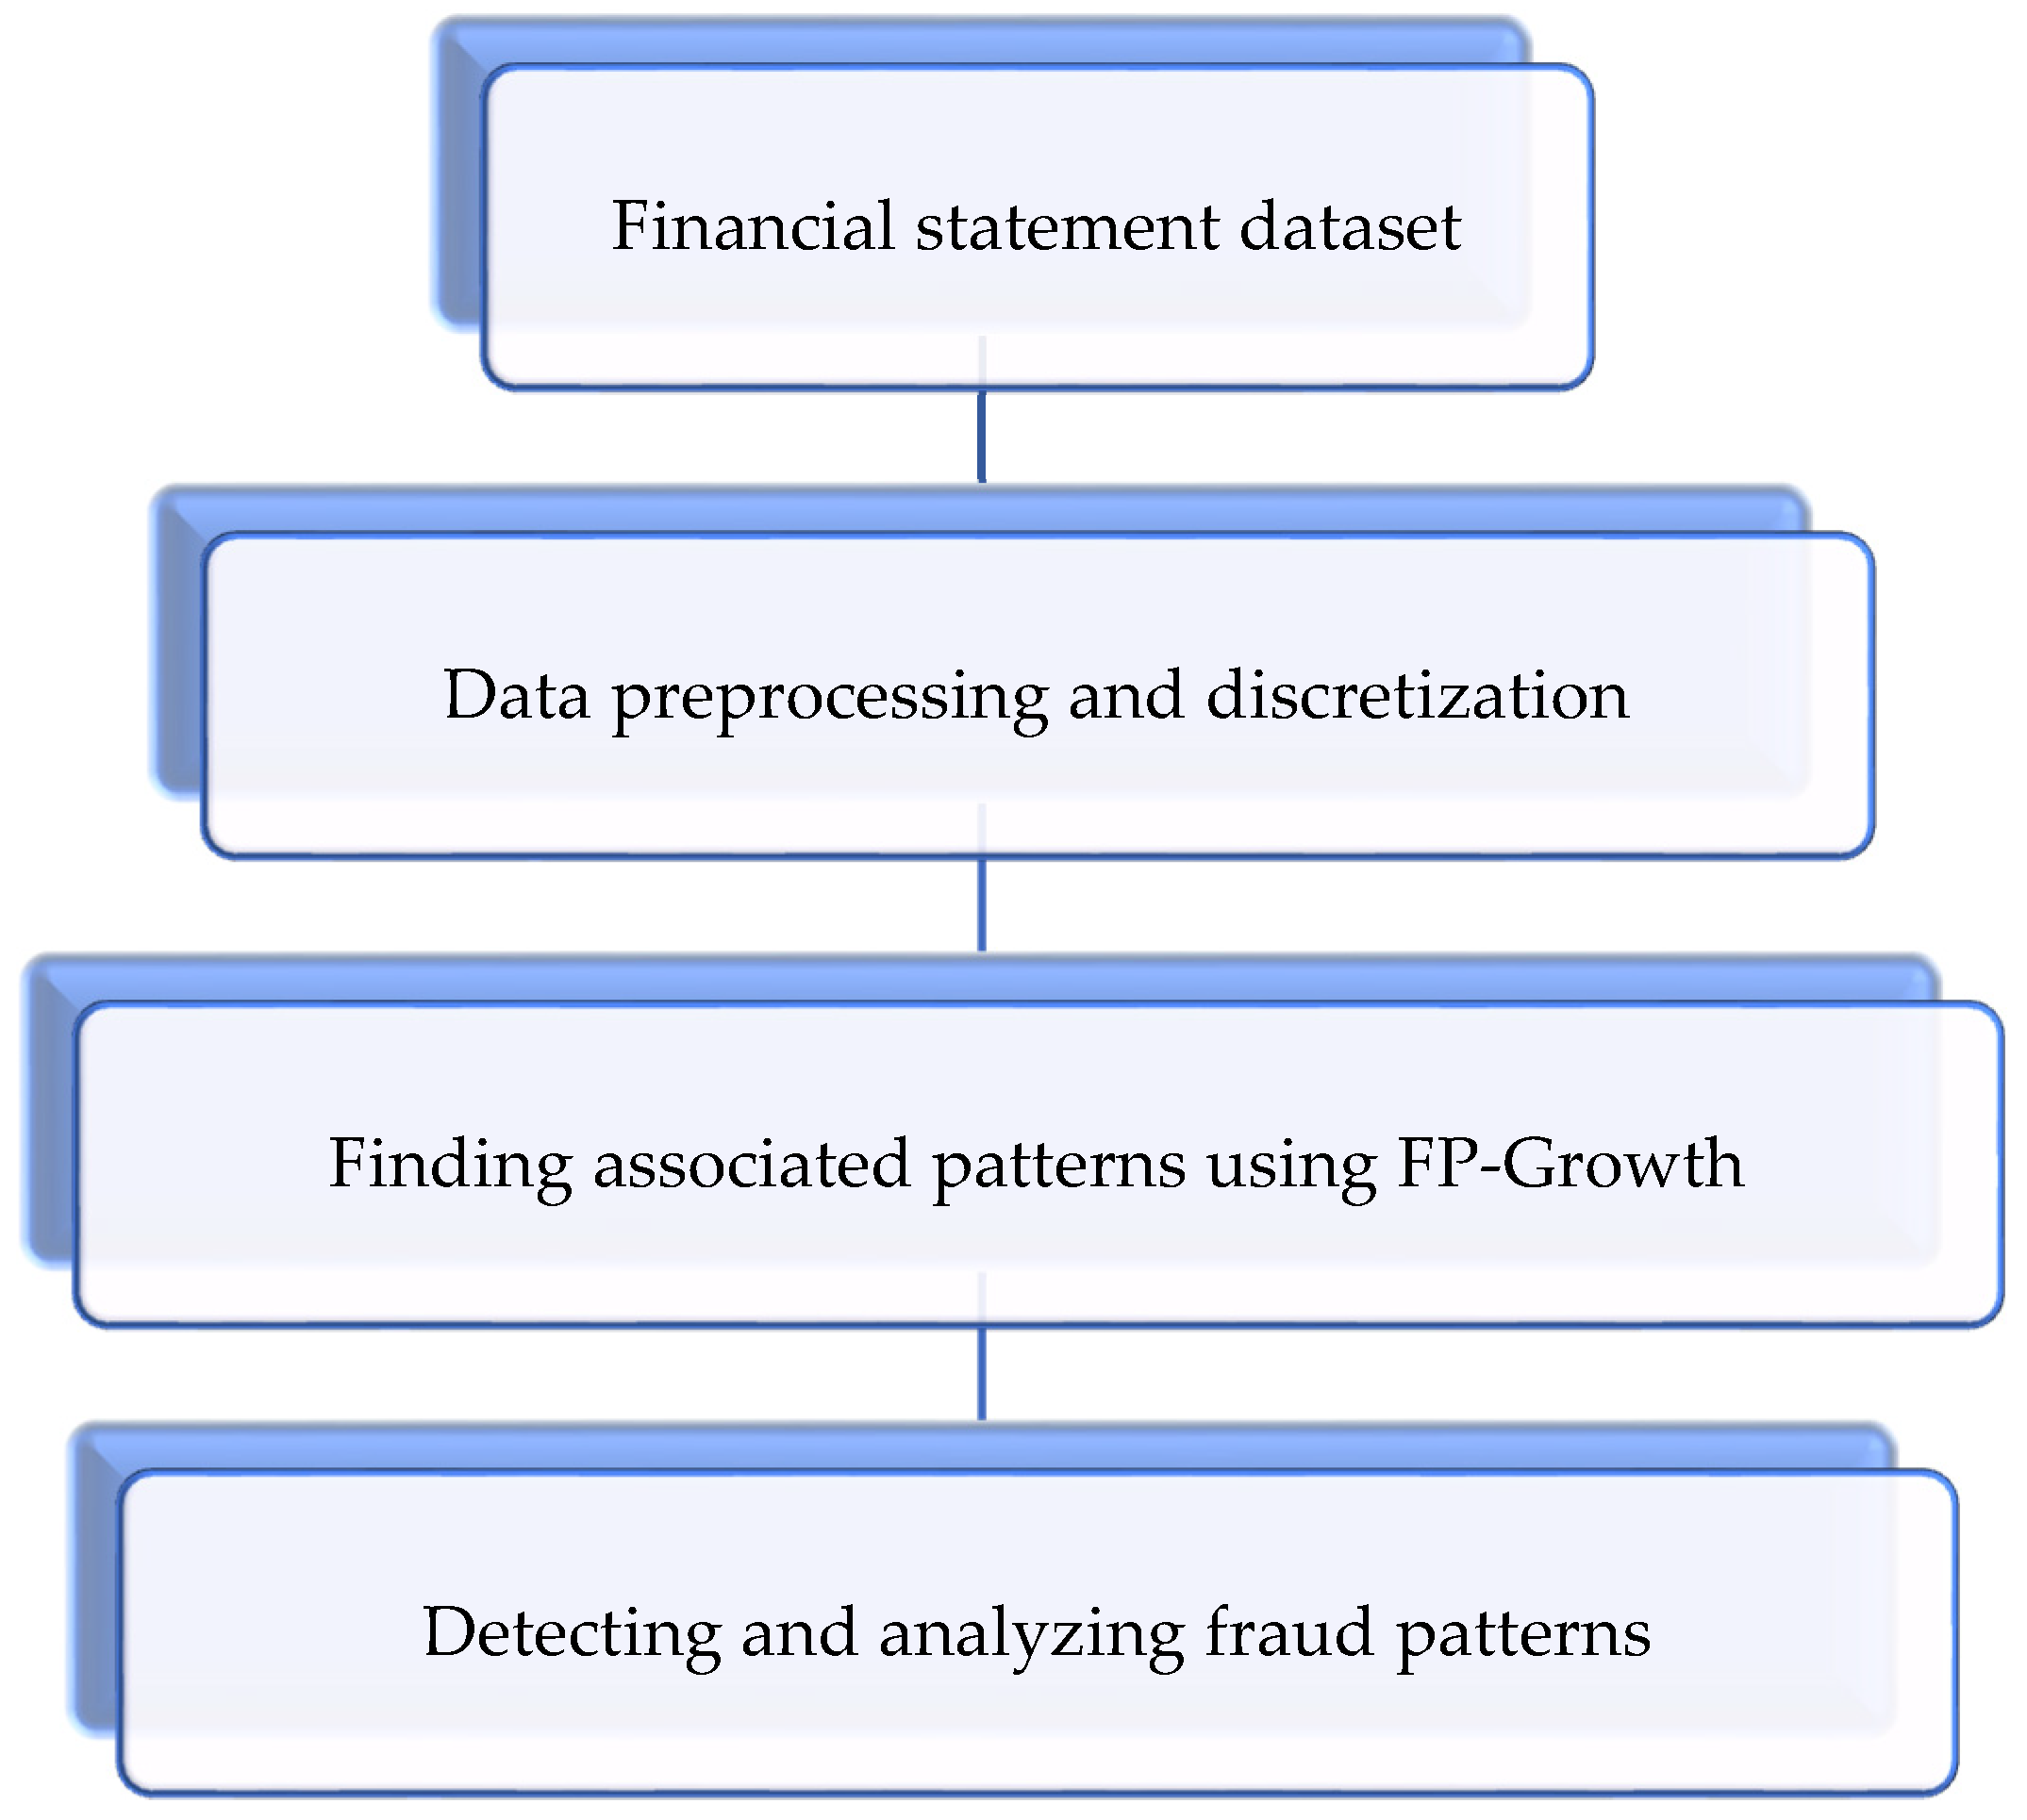
2.5. Proposed Method

This study involved an analysis to find patterns of fraud in financial statements on the Stock Exchange of Thailand using association rule mining. Our proposed method, shown in Figure 2, consists of three main steps: (1) performing data processing and discretization, (2) finding associated patterns using FP-Growth, and (3) detecting and analyzing fraud patterns.

2.5.1. Step 1: Data Preprocessing and Discretization

The 2710 financial statements of 542 companies listed on the Stock Exchange of Thailand from 2015 to 2019 were used for analysis. We calculated 35 financial items and discretized the data using intervals to find associated patterns with association rule mining.

2.5.2. Step 2: Finding Associated Patterns Using FP-Growth

FP-Growth was used to find the relationships between financial items, analyze the results of each financial item, and determine whether they were fraudulent.

2.5.3. Step 3: Detecting and Analyzing Fraud Patterns

The financial statements were revised in accordance with the generally accepted accounting principles from the SEC, Thailand [3]. We analyzed the occurrence of fraudulent patterns for 12 companies and identified the factors involved.

3. Experimental Setup and Results

3.1. Data Description

The 2710 financial statements were grouped into eight industrial groups: (1) agriculture and food, (2) technology, (3) resources, (4) financial business, (5) services, (6) industrial products, (7) consumer products, and (8) real estate and construction. These 5 years were selected because the Federation of Accounting Professions, Thailand (FAP, Thailand) established a revised financial reporting standard for listed companies, effective in 2015 [30]. Numerical data relevant to the item correlation model to be calculated using financial and accounting formulas were selected. Figures and ratios were obtained according to the 35 items studied by Ravisankar et al. [2]. Table 2 presents examples of financial items from three companies.

3.2. Ethical Consideration

Permission for the study was obtained from the ethics committee of Walailak University, Thailand (protocol no. WU-EC-MA-1-481-63).

3.3. Data Preprocessing and Discretization

The dataset was run in RapidMiner Studio version 9.8 (RapidMiner, Inc.: Boston, MA, USA) [31] to apply binning discretization in the classification range of the data, using binning with equal width where the number of bins was 3, 5, and 10 and binning with equal frequency where the number of bins was 3, 5, and 8. Table 3 and Table 4 show an example of dividing the debt attribute by the number of bins. The two methods were compared according to the number of bins, and the two discretization methods were compared to determine the one appropriate for finding associated patterns in the financial items.
Based on the discretization method criterion [32] shown in Table 3 and Table 4, the value range was too detailed when using binning with equal width with 3 bins but too coarse with 10 bins. For a range that covers values that can be used to find associated patterns, five bins should be used, as relevant forms of relationships that are likely to result in detecting fraudulent financial statements can be found.
However, using binning with equal frequency with 3, 5, or 8 bins resulted in value ranges that were too wide. Consequently, the numerical data in the financial statements taken as examples were not in a range of correlations that allowed for fraud detection, making it impossible to clearly specify a range for fraudulent or nonfraudulent values.
Therefore, binning with equal width with five bins was deemed suitable for this study. This method was used to identify relationships between financial items related to fraudulent or nonfraudulent financial statements.

3.4. Finding Associated Patterns Using FP-Growth and Analysis

From the 2710 financial statements, 35 items were considered using FP-Growth in RapidMiner Studio to analyze financial items that reflected fraud in financial statements in order to determine the best-associated pattern of financial ratios. The proposed method was applied several times to determine the best parameters for association rule mining, with minimum support of 25% and minimum confidence of 80%. We found 38 patterns with 100% confidence and a lift of >1 and discovered 36 one-to-one relationship patterns and 2 patterns with more than 2 relationships, as shown in Table 5.
Table 5 shows the associated patterns of financial statements on the Stock Exchange of Thailand from 2015–2019. All 38 patterns were grouped according to the financial ratios, taken from [2], and could be used to detect fraud in the following four groups:
(1) The liquidity ratio is used to assess the liquidity of an entity and the ability to pay short-term debt, including emergency cash needs. A high liquidity ratio means that the entity has enough cash, cash equivalents, or current assets to circulate and can pay debts such that the business does not face continuing problems in operations. However, a low liquidity ratio means that the entity has problems with short-term debt repayment such that management must provide cash or assets to settle the debt. This could be due to management fraud in the event of misappropriation of cash or assets. We found the following pattern:
Pattern 1: Cash and deposits were in the range of 7,075,491.695 to 8,719,642.390, and there was a debt item within the range of −∞ to 0 in which cash and deposits came from the business operation, the owner’s additional investment, or outside borrowing. Consequently, the business had no remaining debt and enough cash remaining for operations. The entity had no risk of operating liquidity. However, excessive cash balance may be a critical sign of a fraudulent or nonfraudulent financial statement [21].
(2) The efficiency ratio is used to analyze the asset management ability. Whether the assets of an entity are managed properly is determined by comparing each asset with current or total assets. A high efficiency ratio signifies the management quality of the organization. There may be fraud in business management based on the modified assets. If the efficiency ratio is low, the assets contained in the financial statements have a reasonable proportion based on the type of entity. The associated pattern was as follows:
Pattern 2: The ratio of cash and deposits to current assets in the range of 0.317 to 0.357 had a relationship with debt in the range of −∞ to 0. The current assets percentage of 31.7% to 35.7% was related to no debt. This shows that a business has cash and deposits that can be used to sufficiently circulate expenditures or debt payments and still have current assets that can be used for other benefits. However, an entity that has no debt must consider how to acquire financing from sources other than creditors. No debt may be due to an inability to incur other debt because there is no credit or it may be because the entity has no credibility in the organization or management, which can lead to internal fraud [21].
(3) The profitability ratio determines the profitability of an entity, i.e., the net profit compared to the gross profit, which reflects the performance of the entity and of management in past accounting periods. A high profitability ratio means that the entity has efficient operating results and makes a profit. However, this high ratio may be due to fraud because there is an incentive for management to self-assess its performance [14]. If the profitability ratio is low, the profitability of the performance is still low. Thus, considering the nature of an entity’s operation, each type of business has a different profit margin ratio. The associated patterns were as follows:
Pattern 3: The ratio of net profit to gross profit was in the range of 0.766 to 0.849, related to debt in the range of −∞ to 0. This ratio indicated that the management of the executives in operations contributed to the net profit. If the ratio is high, the entity has a high percentage of profit from other operations. If the ratio is low, with no debt (in the range of −∞ to 0), the entity is making a profit from its core operations. Most net profit comes from gross profit, and the entity can use profits that arise in debt settlement, resulting in the entity having no remaining debt. In this case, users of the financial information must focus on the recognition of revenue and expenses within the accounting period because management may want to show an entity’s performance through key performance indicators (KPIs) [21].
Pattern 11: A primary business income of ≥150,193,704 occurred when the ratio of the primary business income to total assets was ≥2.450, meaning that the business had fewer total assets but a high primary business income. This occurs when an operating entity does not require high-value assets. However, fraudulent signals will result in improper asset management, leading to a high return on assets. Management is effective [14], which is related to [20,33], in that a fraudulent ratio of primary business income to total assets can predict fraudulent financial statements.
Pattern 37: A ratio of accounts receivable to primary business income of ≥0.791 was correlated with a ratio of capitals and reserves to total debt of ≥19.932 and a ratio of gross profit to primary business profit of ≥0.777, indicating that the business had not yet received payment of the primary business income. This may affect the entity’s liquidity [21] and the use of the owner’s capital rather than that from creditors. Expanding the business to generate higher profits correlates with gross profit from the primary business profit.
Pattern 38: A ratio of capital and reserves to total debt of ≥19.932 was correlated with a ratio of accounts receivable to primary business income of ≥0.791 and a ratio of gross profit to primary business profit of ≥0.777. This indicated that the gross profit from the primary business profit of an entity and the primary business income, most of which had not been paid, were related to the owner’s capital structure rather than the creditors’ because most of the revenue had not been settled, leading to a situation in which no capital circulated in the business. Therefore, the business must raise money from other sources [21].
Patterns 37 and 38 must be considered because there may be misappropriation or fraud in debt settlements that are not recorded [21] and managers may have an incentive [14] to present the use of funds from owners rather than creditors. This leads to low levels of risk and interesting ventures in investments, lending, etc.
(4) The debt management ratio indicates the debt repayment ability of an entity or the proceeds that can be used to pay debt in the future. If this ratio is high, the entity’s debt is higher than the owner’s equity, indicating that the entity has a risk regarding debt repayment on both loans and interest payable. A high ratio can also affect bankruptcy concerns. However, if this ratio is low, the entity has less debt than equity and still makes a profit from operating. This ratio also indicates whether an asset can generate revenue. The income reflects the performance of the entity and management. If this ratio is high and the entity is operating more efficiently, the reason may be fraudulent financial statements. If this ratio is low, the profitability of that asset is still low. The associated patterns were as follows:
Pattern 7: A ratio of capital and reserves to total debt of 1.873 to 2.314 was correlated with a gross profit of 56,867.525 to 107,366.280. There was more capital from the owner than from other external sources. It is important to consider that the use of the owner’s funds has a lower cost than the use of creditors’ funds. Managers may have an incentive [14] to present information that an entity has low risk in terms of the reliability of financial statements and investments from investors.
Pattern 10: A ratio of long-term debt to total assets of 0.002 to 0.008 was correlated with a ratio of long-term debt to total capital and reserves of 0.001 to 0.016. The former ratio shows whether the company can pay off long-term debt with all its assets. However, such a company needs to consider its short-term debt, together with long-term debt, and whether the total assets are sufficient to pay its total liabilities. Moreover, when considering the latter ratio, the entities had a low proportion of long-term debt compared to total capital and reserves, indicating that the businesses had good repayment ability. However, there may be some fraud, because managers may have an incentive [14] to recognize transactions or presentations of financial statements inappropriately in order to show their financial status and ability to pay debt and incur other debts in the future [21].
Patterns 12 and 36: The ratio of total debt to total assets was correlated with the ratio of total debt to total equity, as shown in Table 5. The former ratio is a debt ratio used to measure the repayment ability of a business. If an entity has less total debt than total assets, it has enough total assets to pay the total debt, resulting in good repayment ability. If funds come from debt, the capital used in the business will have higher financing costs than equity capital. Consequently, the entity must be careful and consider its ability to pay debt. An initial ratio of total debt to total assets of 0.013 indicated that the entity could pay its debt. This correlates with a capital structure that is more cost effective than debtor funding. However, as the ratio of total debt to total assets increases, the debt payment capability of the enterprise decreases because there are fewer assets than liabilities, which is related to a capital structure that uses funds from the debtor rather than the owner. There may be a risk with respect to the ability to repay debt and to the continuation of the entity’s operations [20,21].
Other patterns not related to financial ratios but that could be fraudulent were as follows:
Pattern 4: Total assets of 70,621,902.480 to 97,901,347.495 that occurred with a debt of −∞ to 0 was correlated with a debt of 0. This meant the company could pay all its debt.
Pattern 5: A ratio of accounts receivable to primary business income of ≥0.791 was correlated with a ratio of capital and reserves to total debt of ≥19.932.
Primary operations costing more than 50% of the primary business income will not be paid. Moreover, the business capital from the owner has a lower financial cost than the debt. This case is important because the primary income is not yet received [20,21] and may be misappropriated or unrecorded. Most of the capital is obtained from the owner. This may give management an incentive [14] to show that the entity has a relatively low capital exposure to its operations, causing investors to become interested in investing in the business.
Pattern 6: A ratio of accounts receivable to primary business income of ≥0.791 was related to a ratio of gross profit to primary business profit of ≥0.777. The latter ratio indicated that the gross profit contributed to 77.7% of the core operating profit, which is high and means that the entity’s performance was largely driven by its core operations. This is related to the income of most of the businesses that have not yet received payment [20,21]. People are aware of cash that will be used in operations, which may affect the entity’s liquidity. In such a case, there is misappropriation or fraud in accepting debt repayment from the debtor, but the account is not recorded.
Pattern 8: A ratio of capital and reserves to total debt of ≥19.932 was related to a ratio of gross profit to primary business profit of ≥0.777 and indicated that the used capital was mostly from owners and that the lower financial costs entailed were associated with the debt. When considering the latter ratio, the gross profit generated a high rate of profit from core operations due to the use of the owner’s funds to drive and expand the business and generate higher profits. This may be because of the incentives [14] that entice management to incorrectly display or categorize accounting transactions in order to make the entity’s performance attractive to investors.
Pattern 9: A gross profit of ≥16,622,993 occurred with a total asset value of ≥217,583,855, indicating that the entity’s gross profit was correlated with the entity’s asset value. In this case, management may be motivated to recognize, misrepresent, or categorize accounting transactions to demonstrate the most profitable asset management potential [14].

4. Discussion for Open Innovation

The Proposed Solutions from the Research Questions and Detecting Fraud Patterns

RQ1: When applying data analytics, what methods can identify fraudulent patterns in financial statements?
This study used discretization to divide the range of data. Binning with equal width with five bins was most suitable for discretizing. These ranges were applied with association rules using FP-Growth to find associated patterns. We found associated patterns that indicated signs of fraudulent financial items on which financial statement users need to focus. This study discovered 38 associated patterns, as shown in Table 5. This is a new way of considering fraudulent financial statements, in contrast to research that considers individual factors. Moreover, the associated patterns were grouped according to financial items [2], which were used to detect fraud in four groups: (1) liquidity ratios, (2) efficiency ratios, (3) profitability ratios, and (4) debt management ratios. Most of the associated patterns were profitability ratio patterns, which indicate the profitability of an entity, reflecting the entity’s management performance when they may have certain theoretical incentives or pressures related to the fraud triangle that make fraud more likely [14]. The other five associated patterns, unrelated to the financial ratio patterns, were mostly related to the managerial ability of the entity, such as when revenue has not been paid. This may be due to the pressures [14] of management with a need to spend money, leading to fraudulent misappropriation of money for personal use.
RQ2: When using association rule mining to find fraudulent patterns and items of financial statements, how do we know that the associated patterns are fraudulent?
In this study, items in financial statements were revised to be in accordance with the generally accepted accounting principles specified by the Securities and Exchange Commission, Thailand [3]. A total of 12 companies were accused of wrongdoing when creating financial statements from 2015 to 2019. The associated patterns were analyzed, and nine patterns provided signs of fraudulent financial statements, as shown in Table 6.
The associated fraud patterns of the items shown in Table 6 are as follows:
Patterns 5 and 6: A ratio of accounts receivable to primary business income of ≥0.791 was correlated with a ratio of capital and reserves to total debt of ≥19.932 or was related to a ratio of gross profit to primary business profit of ≥0.777. Here, most of the income (79.1%) had not been received in the accounting period. A higher ratio may affect debt repayment. If the debtor defaults on a debt, the liquidity of the business might be affected. The ratio of accounts receivable to primary business income is identified as the ratio associated with fraudulent financial statements [20,21]. The fraud may be by the employee involved in creating financial statements, such as receipts of repayment, in accordance with the accounting period, made (lapping) by accepting debt repayments that were not recognized in the financial statements. The income recognition at the end of the financial period may be inflated in order to display financial statements in accordance with the needs of management. These frauds are based on the theoretical incentives/pressures related to the fraud triangle [14]. Most of the capital is from the owner, which includes funds with lower financial costs than funds from creditors. However, high equity levels in the capitalization ratio generally indicate a lower risk for investors interested in investing in the business [34].
Moreover, the ratio of gross profit to primary business profit was 77.7% of the gross profit. Financial statement users must focus on profit presentations that mislead users about the actual profit from the entity’s core operations. This is an incentive for investors to understand that the entity displays good performance and has good returns for them.
Pattern 7: A ratio of capital and reserves to total debt of 1.873 to 2.314 was correlated with a gross profit of 56,867.525 to 107,366.280. Gross profit was related to the use of working capital from the owner rather than from creditors. This is a priority item since it reflects the performance of management regarding the use of the owner’s capital, entailing lower financial costs than with creditor funding [34]. There may be an incentive [14] to show a low risk in financial statements and attract investment in the business.
Pattern 8: A ratio of capital and reserves to total debt of ≥19.932 was correlated with a ratio of gross profit to primary business profit of ≥0.777. Here, businesses had a high percentage of gross profit compared to the primary business profit, which was 77.7% of the gross profit. This is associated with using the owner’s working capital, entailing lower financial costs than with creditor funding [34]. There may be an incentive [14] to show good performance and profitability to investors interested in the business.
Pattern 9: A gross profit of ≥16,622,993 was correlated with a total asset value of ≥217,583,855. Management managed the total assets to generate a gross profit. The associated pattern indicates an ROA. From an organizational management perspective, there will be a need for profit due to an incentive/pressure [14] among executives who want to present profits in their financial statements, as desired. This may result in creative accounting, such as inflated income or underestimated expenses, making the profit in the financial statements look better. This is a sign of a fraudulent financial statement.
Pattern 10: A ratio of long-term debt to total assets of 0.002 to 0.008 was associated with a ratio of long-term debt to total capital and reserves of 0.001 to 0.016. Long-term debt can be paid off with sufficient total assets or total capital and reserves. This motivates management [14] to present or classify items in financial statements that do not meet the standards in order to show that an enterprise has a debt repayment ability and also the ability to incur additional liabilities [21].
Pattern 11: A primary business income of ≥150,193,704 was correlated with a ratio of primary business income to total assets of ≥2.450. Executives manage total assets to generate a primary business income according to the above value. This implies the use of assets to create the enterprise’s primary business income, where management wants to appear efficient. Thus, there are incentives/pressures [14] to show higher-than-actual profits. This could manifest as a fraudulent financial statement that shows, e.g., inflated income or reduced expenses, which make the statement look better.
Pattern 37: A ratio of accounts receivable to primary business income of ≥0.791 was correlated with a ratio of capital and reserves to total debt of ≥19.932 and a ratio of gross profit to primary business profit of ≥0.777. Here, the primary income incurred was not paid, which may affect the liquidity of the cash used for the business. This is related to the use of the owner’s working capital, entailing a lower capital cost than with creditor funding [34], and the gross profit is high compared to the primary business profit, which was 77.7% of the gross profit. This associated pattern can be explained as being due to the incentives/pressures [14] of people within the organization, e.g., employee corruption. In such a case, management shows that the entity uses the owner’s funds more than the funds from creditors because they want to show that the entity has a low working capital risk. This leads to incorrect data in financial statements. Consequently, financial statement users use these data to make wrong decisions.
Pattern 38: A ratio of capital and reserves to total debt of ≥19.932 was correlated with a ratio of accounts receivable to primary business income of ≥0.791 and a ratio of gross profit to primary business profit of ≥0.777. Most of the working capital structure came from the owner, entailing lower financial costs than if the funds were obtained from creditors [34] and that income has not been paid. If the entity continues to have this ratio, the liquidity of using cash to spend on the business may be affected. In addition, the gross profit was high compared with the primary business profit, which was 77.7% of the gross profit. This fraudulent behavior may be due to pressures or motivations of executives who want to benefit themselves. Consequently, the transactions presented in financial statements will be incorrect. Financial statement users must focus on whether the profit presentation complies with financial reporting standards [21], as they may be mistaken in terms of the actual profit. Consequently, they may use these data to make wrong decisions.
RQ3: Can the resulting fraudulent patterns be applied to detect fraud in other businesses?
These associated patterns can be applied to find fraud in other businesses because companies listed on the Stock Exchange of Thailand are publicly accountable entities (PAEs) and use the same set of accounting standards. However, if a company is not listed on the Stock Exchange of Thailand, the fraudulent patterns found in this study cannot be applied to fraud detection because of the different accounting standards, i.e., the company is a non-publicly accountable entity (NPAE). Each set of accounting standards has different requirements for the recognition and measurement of accounting transactions, resulting in different financial ratios.

5. Conclusions

This study analyzed the financial statements of companies listed on the Stock Exchange of Thailand. Financial items and identifying factors that affect the occurrence of fraudulent financial statements were investigated. Financial items (financial ratios reflecting liquidity and the levels of security, profitability, and efficiency of companies) were determined using discretization to find associated patterns by association rule mining in order to detect and analyze signals of fraudulent financial statements. There were six financial items reflecting fraudulent financial statements, consistent with other research: (1) gross profit, (2) primary business income, (3) ratio of primary business income to total assets, (4) ratio of capital and reserves to total debt, (5) ratio of long-term debt to total capital and reserves, and (6) ratio of accounts receivable to primary business income. Three financial items were discovered that differed from other research: (1) ratio of gross profit to primary business profit, (2) ratio of long-term debt to total assets, and (3) total assets. All nine financial items were used to identify nine associated patterns related to fraud, which is novel because they can identify fraudulent relationships between financial items. This can benefit financial statement users, who can use this information to analyze the financial statements of businesses and make investment decisions.
This study made the following contributions:
(1) Academic research implications: This study proposed a new model to detect accounting fraud by using companies’ financial data that differed from previous studies in the literature.
(2) Practical implications for auditors: This new model can help internal and external auditors save audit time and help investors and users identify fraudulent relationships between financial items for decision making.
(3) Practical implications for regulators: Policies could be applied for government regulatory agencies to be aware of the occurrence of fraud in financial statements.
This study had the following limitations: (1) We used companies listed on the Stock Exchange of Thailand without considering their business type. The relationships found were the overall associated patterns of companies listed on the Stock Exchange of Thailand. Different types of businesses have different operating structures, financial statement data, and capital and asset management structures. (2) We found nine financial items related to fraud: (1) gross profit, (2) primary business income, (3) ratio of primary business income to total assets, (4) ratio of capitals and reserves to total debt, (5) ratio of long-term debt to total capital and reserves, (6) ratio of accounts receivable to primary business income, (7) ratio of gross profit to primary business profit, (8) ratio of long-term debt to total assets, and (9) total assets. In general, these items help users be aware of the occurrence of fraud in financial statements. In general, other entities can follow our research framework. However, the results will depend on the business type and the operating income of each country.
Future studies will be able to use a separate dataset of the business types of companies listed on the Stock Exchange of Thailand such that associated fraud patterns can be appropriately and clearly identified for each business type. Moreover, other datasets of companies not listed on the Stock Exchange of Thailand should be used to find other associated fraud patterns. In addition, other data analytics methods, such as clustering, should be used to group data before associated patterns are found.

Author Contributions

Conceptualization, S.S. and P.T.; Methodology, S.S. and P.T.; Software, P.T.; Validation, S.S. and P.T.; Formal Analysis, S.S. and P.T.; Investigation, S.S. and P.T.; Resources, S.S.; Data Curation, S.S. and P.T.; Writing Original Draft Preparation, S.S. and P.T.; Writing Review and Editing, S.S. and P.T.; Visualization, S.S.; Supervision, P.T.; Project Administration, S.S. Both authors have read and agreed to the published version of the manuscript.

Funding

This research was funded by Individual Research Grants of Institute of Research and Innovation, Walailak University, Thailand. (No. WU62248).

Institutional Review Board Statement

Not applicable.

Informed Consent Statement

Not applicable.

Data Availability Statement

Data sharing not applicable.

Conflicts of Interest

The authors declare no conflict of interest.

References

  1. Yao, J.; Pan, Y.; Yang, S.; Chen, Y.; Li, Y. Detecting Fraudulent Financial Statements for the Sustainable Development of the Socio-Economy in China: A Multi-Analytic Approach. Sustainability 2019, 11, 1579. [Google Scholar] [CrossRef] [Green Version]
  2. Ravisankar, P.; Ravi, V.; Rao, G.R.; Bose, I. Detection of financial statement fraud and feature selection using data mining techniques. Decis. Support Syst. 2011, 50, 491–500. [Google Scholar] [CrossRef]
  3. The Securities and Exchange Commission, Thailand. Available online: https://www.sec.or.th/EN/Pages/Home.aspx (accessed on 14 July 2020).
  4. Lin, C.C.; Chiu, A.A.; Huang, S.Y.; Yen, D.C. Detecting the financial statement fraud: The analysis of the differences between data mining techniques and experts’ judgments. Knowl. Based Syst. 2015, 89, 459–470. [Google Scholar] [CrossRef]
  5. Fanning, K.; Coggor, K.O.; Srivastana, R. Detection of management fraud: A neural network approach. In Proceedings of the IEEE Conference on Artificial Intelligence for Applications, Los Angeles, CA, USA, 20–23 February 1995; pp. 220–223. [Google Scholar]
  6. Beasley, M.S. An Empirical Analysis of the Relation between the Board of Director Composition and Financial Statement Fraud. Account. Rev. 1996, 71, 443–465. [Google Scholar]
  7. Bell, T.; Carcello, J. A Decision Aid for Assessing the Likelihood of Fraudulent Financial Reporting. Audit. J. Pract. Theor. 2000, 19, 169–184. [Google Scholar] [CrossRef]
  8. Spathis, C.; Doumpos, M.; Zopounidis, C. Detecting falsified financial statements: A comparative study using multicriteria analysis and multivariate statistical techniques. Eur. Account. Rev. 2002, 11, 509–535. [Google Scholar] [CrossRef] [Green Version]
  9. Uzun, H.; Szewczyk, S.; Varma, R. Board Composition and Corporate Fraud. Financ. Anal. J. 2004, 60, 33–43. [Google Scholar] [CrossRef]
  10. Chen, C.H. Application of grey forecast theory and logit equation in financial crisis warning model from the pre-event control viewpoint. Commer. Manag. Q. 2005, 6, 655–676. [Google Scholar]
  11. Chen, S. Detection of fraudulent financial statements using the hybrid data mining approach. SpringPlus 2016, 5, 89. [Google Scholar] [CrossRef] [PubMed] [Green Version]
  12. Song, R.; Huang, L.; Cui, W.; Óskarsdóttir, M.; Vanthienen, J. Fraud Detection of Bulk Cargo Theft in Port Using Bayesian Network Models. Appl. Sci. 2020, 10, 1056. [Google Scholar] [CrossRef] [Green Version]
  13. Jan, C.-L. An Effective Financial Statements Fraud Detection Model for the Sustainable Development of Financial Markets: Evidence from Taiwan. Sustainability 2018, 10, 513. [Google Scholar] [CrossRef] [Green Version]
  14. Cressy, D.R. Other People’s Money: A Study in the Social Psychology of Embezzlement; Wadsworth Pub. Co.: Belmont, CA, USA, 1971. [Google Scholar]
  15. Ramos Montesdeoca, M.; Sánchez Medina, A.J.; Blázquez Santana, F. Research Topics in Accounting Fraud in the 21st Century: A State of the Art. Sustainability 2019, 11, 1570. [Google Scholar] [CrossRef] [Green Version]
  16. Gozman, D.; Currie, W. The role of Investment Management Systems in regulatory compliance: A Post-Financial Crisis study of displacement mechanisms. J. Inf. Technol. 2014, 29, 44–58. [Google Scholar] [CrossRef]
  17. Morales, J.; Gendron, Y.; Guénin-Paracini, H. The construction of the risky individual and vigilant organization: A genealogy of the fraud triangle. Account. Organ. Soc. 2014, 39, 170–194. [Google Scholar] [CrossRef]
  18. Machado, M.R.R.; Gartner, I.R. The Cressey hypothesis (1953) and an investigation into the occurrence of corporate fraud: An empirical analysis conducted in Brazilian banking institutions. Rev. Contab. Financ. 2017, 29, 60–81. [Google Scholar] [CrossRef] [Green Version]
  19. Lokanan, M.E. Challenges to the fraud triangle: Questions on its usefulness. Account. Forum 2015, 39, 201–224. [Google Scholar] [CrossRef] [Green Version]
  20. Zainudin, E.F.; Hashim, H.A. Detecting fraudulent financial reporting using financial ratio. J. Financ. Report. Account. 2016, 14, 266–278. [Google Scholar] [CrossRef]
  21. Kanapickienė, R.; Grundienė, Z. The Model of Fraud Detection in Financial Statements by Means of Financial Ratios. Procedia Soc. Behav. Sci. 2015, 213, 321–327. [Google Scholar] [CrossRef] [Green Version]
  22. Kourtis, E.; Kourtis, G.; Curtis, P. An Integrated Financial Ratio Analysis as a Navigation Compass through the Fraudulent Reporting Conundrum: A Case Study. Int. J. Financ. Insur. Risk Manag. 2019, 9, 3–20. [Google Scholar]
  23. Climent, F.; Momparler, A.; Carmona, P. Anticipating bank distress in the Eurozone: An Extreme Gradient Boosting approach. J. Bus. Res. 2019, 101, 885–896. [Google Scholar] [CrossRef]
  24. De Luca, F.; Meschieri, E. Financial Distress Pre-Warning Indicators: A Case Study on Italian Listed Companies. J. Credit Risk 2017, 13, 73–94. [Google Scholar] [CrossRef]
  25. Jiang, Y.; Jones, S. Corporate distress prediction in China: A machine learning approach. Account. Financ. 2018, 58, 1063–1109. [Google Scholar] [CrossRef] [Green Version]
  26. Zhao, L.; Hao, F.; Xu, T.; Dong, X. Positive and Negative Association Rules Mining for Mental Health Analysis of College Students. EURASIA J. Math. Sci. Technol. Educ. 2017, 13, 5577–5587. [Google Scholar] [CrossRef]
  27. Park, J.; Cha, Y.; Jassmi, H.A.; Han, S.; Hyun, C. Identification of Defect Generation Rules among Defects in Construction Projects Using Association Rule Mining. Sustainability 2020, 12, 3875. [Google Scholar] [CrossRef]
  28. Han, J.; Pei, J.; Yin, Y.; Mao, R. Mining Frequent Patterns without Candidate Generation: A Frequent-Pattern Tree Approach. Data Min. Knowl. Discov. 2004, 8, 53–87. [Google Scholar] [CrossRef]
  29. Wong, A.K.C.; Chiu, D.K.Y. Synthesizing Statistical Knowledge from Incomplete Mixed-Mode Data. IEEE Trans. Pattern Anal. Mach. Intell. 1987, 6, 796–805. [Google Scholar] [CrossRef] [PubMed]
  30. Federation of Accounting Professions, Thailand. Available online: https://www.tfac.or.th/Article/Detail/102613 (accessed on 14 July 2020).
  31. Rapidminer. Available online: https://rapidminer.com/ (accessed on 5 December 2020).
  32. Garcia, S.; Luengo, J.; Saez, A.; Lopez, V.; Herrera, F. A Survey of Discretization Techniques: Taxonomy and Empirical Analysis in Supervised Learning. IEEE Trans. Knowl. Data Eng. 2011, 25, 734–750. [Google Scholar] [CrossRef]
  33. Dalnial, H.; Kamaluddin, A.; Sanusi, Z.M.; Khairuddin, K. Detecting Fraudulent Financial Reporting through Financial Statement Analysis. J. Adv. Manag. Sci. 2014, 2, 17–22. [Google Scholar] [CrossRef] [Green Version]
  34. Rist, M.; Pizzica, A.J.; LLC, P. Financial Ratios for Executives: How to Assess Company Strength, Fix Problems, and Make Better Decisions, 1st ed.; Apress: New York, NY, USA, 2014; pp. 7–21. [Google Scholar]
Figure 1. The fraud triangle.
Joitmc 07 00128 g001
Figure 2. The proposed method for analyzing and detecting fraud patterns.
Joitmc 07 00128 g002
Table 1. Items of financial statements.
No.Financial Items
1Debt
2Total assets
3Gross profit
4Net profit
5Primary business income
6Cash and deposits
7Accounts receivable
8Inventory/Primary business income
9Inventory/Total assets
10Gross profit/Total assets
11Net profit/Total assets
12Current assets/Total assets
13Net profit/Primary business income
14Accounts receivable/Primary business income
15Primary business income/Total assets
16Current assets/Current liabilities
17Primary business income/Fixed assets
18Cash/Total assets
19Inventory/Current liabilities
20Total debt/Total equity
21Long-term debt/Total assets
22Net profit/Gross profit
23Total debt/Total assets
24Total assets/Capital and reserves
25Long-term debt/Total capital and reserves
26Fixed assets/Total assets
27Deposits and cash/Current assets
28Capital and reserves/Total debt
29Accounts receivable/Total assets
30Gross profit/Primary business profit
31Undistributed profit/Net profit
32Primary business profit/Last year’s primary business profit
33Primary business income/Last year’s primary business income
34Accounts receivable/Last year’s accounts receivable
35Total assets/Last year’s total assets
Table 2. Examples of financial items from three companies.
Financial ItemsCompany 1Company 2Company 3
1. Debt (Baht)1,690,430.58716,485.5311,568,073.34
2. Total assets (Baht)33,057,234.1519,326,761.0129,429,665.83
3. Gross profit (Baht)1,124,880.67701,426.802,008,596.55
4. Net profit (Baht)2,687,916.341,609,474.031,026,928.34
5. Primary business income (Baht)6,586,040.086,047,604.9216,846,748.28
6. Cash and deposits (Baht)2,912,253.041,267,881.861,879,587.46
7. Accounts receivable (Baht)1,051,601.39690,322.795,515,889.69
8. Inventory/Primary business income0.030.020.08
9. Inventory/Total assets0.000.010.05
10. Gross profit/Total assets0.030.040.07
11. Net profit/Total assets0.080.080.03
12. Current assets/Total assets0.140.120.48
13. Net profit/Primary business income0.410.270.06
14. Accounts receivable/Primary business income0.160.110.33
15. Primary business income/Total assets0.200.310.57
16. Current assets/Current liabilities4.843.161.14
17. Primary business income/Fixed assets0.240.3711.87
18. Cash/Total assets0.090.070.06
19. Inventory/Current liabilities0.170.200.11
20. Total debt/Total equity2.882.281.75
21. Long-term debt/Total assets0.590.560.21
22. Net profit/Gross profit2.392.290.51
23. Total debt/Total assets0.740.690.64
24. Total assets/Capital and reserves8.084.724.88
25. Long-term debt/Total capital and reserves4.792.641.05
26. Fixed assets/Total assets0.830.840.05
27. Deposits and cash/Current assets0.640.560.13
28. Capital and reserves/Total debt0.170.300.32
29. Accounts receivable/Total assets0.030.040.19
30. Gross profit/Primary business profit0.170.120.12
31. Undistributed profit/Net profit1.001.001.00
32. Primary business profit/Last year’s primary business profit1.601.460.90
33. Primary business income/Last year’s primary business income1.675.990.99
34. Accounts receivable/Last year’s accounts receivable1.521.311.27
35. Total assets/Last year’s total assets1.711.691.64
Table 3. Example debt ranges using binning with equal width (number of bins = 3, 5, and 10).
Bins = 3Bins = 5Bins = 10
No.Debt Range No.Debt Range No.Debt Range
1range1 [−∞, 0]1range1 [−∞, 0]1range1 [−∞, 0]
2range11 [0, 5775.475]2range7 [0, 5775.475]2range4 [0, 18,276]
3range12 [5775.475, 16,125.735]3range8 [5775.475, 18,276]3range5 [18,276, 108,441.965]
4range13 [16,125.735, 18,874.330]4range9 [18,276, 48,767.140]4range6 [108,441.965, 218,665.525]
5range14 [18,874.330, 35,008.140]5range10 [48,767.140, 108,441.965]5range7 [218,665.525, 358,176.500]
6range15 [35,008.140, 69,789.795]6range11 [108,441.965, 170,233.180]6range8 [358,176.500, 564,336.500]
7range16 [69,789.795, 108,441.965]7range12 [170,233.180, 218,665.525]7range9 [564,336.500, 1,383,460.165]
8range17 [108,441.965, 143,453.215]8range13 [218,665.525, 278,100]8range10 [1,383,460.165, 1,791,158.825]
9range18 [143,453.215, 187,749.960]9range14 [278,100, 358,176.500]9range11 [1,791,158.825, 3,316,991.900]
10range19 [187,749.960, 214,246.395]10range15 [358,176.500, 397,512.500]10range12 [3,316,991.900, 5,881,181]
11range20 [214,246.395, 240,716]11range16 [397,512.500, 564,336.500]11range13 [5,881,181, 11,589,184.040]
12range21 [240,716, 278,100]12range17 [564,336.500, 896,004.940]12range14 [11,589,184.040, ∞]
13range22 [278,100, 345,000]13range18 [896,004.940, 1,383,460.165]
14range23 [345,000, 366,635.690]14range19 [1,383,460.165, 1,591,559.500]
15range24 [366,635.690, 397,512.500]15range20 [1,591,559.500, 1,791,158.825]
16range25 [397,512.500, 432,611.240]16range21 [1,791,158.825, 2,098,418.640]
17range26 [432,611.240, 564,336.500]17range22 [2,098,418.640, 3,316,991.900]
18range27 [564,336.500, 787,242.765]18range23 [3,316,991.900, 4,013,489.555]
19range28 [787,242.765, 928,245.435]19range24 [4,013,489.555, 5,881,181]
20range29 [928,245.435, 1,245,381.955]20range25 [5,881,181, 8,862,674.645]
21range30 [1,245,381.955, 1,538,010.670]21range26 [8,862,674.645, 11,589,184.040]
22range31 [1,538,010.670, 1,591,559.500]22range27 [11,589,184.040, 13,703,104.500]
23range32 [1,591,559.500, 1,670,215.290]23range28 [13,703,104.500, ∞]
24range33 [1,670,215.290, 1,839,577.725]
25range34 [1,839,577.725, 2,030,884]
26range35 [2,030,884, 2,277,762.730]
27range36 [2,277,762.730, 3,316,991.900]
28range37 [3,316,991.900, 3,923,544.565]
29range38 [3,923,544.565, 4,129,893.265]
30range39 [4,129,893.265, 5,548,494]
31range40 [5,548,494, 6,719,824]
32range41 [6,719,824, 8,862,674.645]
33range42 [8,862,674.645, 10,418,841.195]
34range43 [10,418,841.195, 12,068,668.200]
35range44 [12,068,668.200, 13,571,391.735]
36range45 [13,571,391.735, 17,755,478.080]
37range46 [17,755,478.080, ∞]
Table 4. Example debt ranges using binning with equal frequency (number of bins = 3, 5, and 8).
Bins = 3Bins = 5Bins = 8
No.Debt Range No.Debt Range No.Debt Range
1range1 [−∞–77,166.845]1range1 [−∞–241.710]1range1 [−∞–241.710]
2range2 [77,166.845–1,591,559.500]2range2 [241.710–195,492]2range2 [241.710–11,398.880]
3range3 [1,591,559.500–∞]3range3 [195,492–870,004.940]3range3 [11,398.880–143,453.215]
4range4 [870,004.940–3,662,379.995]4range4 [143,453.215–366,635.690]
5range5 [3,662,379.995–∞]5range5 [366,635.690–1,163,525.125]
6range6 [1,163,525.125–2,098,418.640]
7range7 [2,098,418.640–6,719,824]
8range8 [6,719,824–∞]
Table 5. Association rules from financial statement data.
No.AntecedentConsequent
1Cash and deposits = range25 [7,075,491.695, 8,719,642.390]Debt = range1 [−∞, 0]
2Deposits and cash/Current assets = range19 [0.317, 0.357]Debt = range1 [−∞, 0]
3Net profit/Gross profit = range23 [0.766, 0.849]Debt = range1 [−∞, 0]
4Total assets = range24 [70,621,902.480, 97,901,347.495]Capital and reserves/Total debt = range28 [19.932, ∞]
5Accounts receivable/Primary business income = range28 [0.791, ∞]Capital and reserves/Total debt = range28 [19.932, ∞]
6Accounts receivable/Primary business income = range28 [0.791, ∞]Gross profit/Primary business profit = range28 [0.777, ∞]
7Capital and reserves/Total debt = range24 [1.873, 2.314]Gross profit = range4 [56,867.525, 107,366.280]
8Capital and reserves/Total debt = range28 [19.932, ∞]Gross profit/Primary business profit = range28 [0.777, ∞]
9Gross profit = range28 [16,622,993, ∞]Total assets = range28 [217,583,855, ∞]
10Long-term debt/Total assets = range2 [0.002, 0.008]Long-term debt/Total capital and reserves = range2 [0.001, 0.016]
11Primary business income = range28 [150,193,704, ∞]Primary business income/Total assets = range28 [2.450, ∞]
12Total debt/Total assets = range10 [0.334, 0.367]Total debt/Total equity = range10 [0.502, 0.579]
13Total debt/Total assets = range11 [0.367, 0.398]Total debt/Total equity = range11 [0.579, 0.662]
14Total debt/Total assets = range12 [0.398, 0.417]Total debt/Total equity = range12 [0.662, 0.717]
15Total debt/Total assets = range13 [0.417, 0.454]Total debt/Total equity = range13 [0.717, 0.832]
16Total debt/Total assets = range14 [0.454, 0.472]Total debt/Total equity = range14 [0.832, 0.895]
17Total debt/Total assets = range15 [0.472, 0.492]Total debt/Total equity = range15 [0.895, 0.967]
18Total debt/Total assets = range16 [0.492, 0.515]Total debt/Total equity = range16 [0.967, 1.061]
19Total debt/Total assets = range17 [0.515, 0.530]Total debt/Total equity = range17 [1.061, 1.129]
20Total debt/Total assets = range18 [0.530, 0.545]Total debt/Total equity = range18 [1.129, 1.196]
21Total debt/Total assets = range19 [0.545, 0.557]Total debt/Total equity = range19 [1.196, 1.258]
22Total debt/Total assets = range2 [0.013, 0.097]Total debt/Total equity = range2 [0.013, 0.108]
23Total debt/Total assets = range20 [0.557, 0.568]Total debt/Total equity = range20 [1.258, 1.315]
24Total debt/Total assets = range23 [0.624, 0.648]Total debt/Total equity = range23 [1.657, 1.840]
25Total debt/Total assets = range24 [0.648, 0.673]Total debt/Total equity = range24 [1.840, 2.061]
26Total debt/Total assets = range25 [0.673, 0.700]Total debt/Total equity = range25 [2.061, 2.335]
27Total debt/Total assets = range26 [0.700, 0.711]Total debt/Total equity = range26 [2.335, 2.460]
28Total debt/Total assets = range27 [0.711, 0.738]Total debt/Total equity = range27 [2.460, 2.813]
29Total debt/Total assets = range28 [0.738, ∞]Total debt/Total equity = range28 [2.813, ∞]
30Total debt/Total assets = range3 [0.097, 0.118]Total debt/Total equity = range3 [0.108, 0.133]
31Total debt/Total assets = range4 [0.118, 0.141]Total debt/Total equity = range4 [0.133, 0.165]
32Total debt/Total assets = range5 [0.141, 0.168]Total debt/Total equity = range5 [0.165, 0.202]
33Total debt/Total assets = range6 [0.168, 0.238]Total debt/Total equity = range6 [0.202, 0.312]
34Total debt/Total assets = range7 [0.238, 0.272]Total debt/Total equity = range7 [0.312, 0.375]
35Total debt/Total assets = range8 [0.272, 0.306]Total debt/Total equity = range8 [0.375, 0.440]
36Total debt/Total assets = range9 [0.306, 0.334]Total debt/Total equity = range9 [0.440, 0.502]
37Accounts receivable/Primary business income = range28 [0.791, ∞]Capital and reserves/Total debt = range28 [19.932, ∞],
Gross profit/Primary business profit = range28 [0.777, ∞]
38Capital and reserves/Total debt = range28 [19.932, ∞]Accounts receivable/Primary business income = range28 [0.791, ∞],
Gross profit/Primary business profit = range28 [0.777, ∞]
Table 6. Fraud patterns from financial statement data.
No.AntecedentConsequent
5Accounts receivable/Primary business income = range28 [0.791, ∞]Capital and reserves/Total debt = range28 [19.932, ∞]
6Accounts receivable/Primary business income = range28 [0.791, ∞]Gross profit/Primary business profit = range28 [0.777, ∞]
7Capital and reserves/Total debt = range24 [1.873, 2.314]Gross profit = range4 [56,867.525, 107,366.280]
8Capital and reserves/Total debt = range28 [19.932, ∞]Gross profit/Primary business profit = range28 [0.777, ∞]
9Gross profit = range28 [16,622,993, ∞]Total assets = range28 [217,583,855, ∞]
10Long-term debt/Total assets = range2 [0.002, 0.008]Long-term debt/Total capital and reserves = range2 [0.001, 0.016]
11Primary business income = range28 [150,193,704, ∞]Primary business income/Total assets = range28 [2.450, ∞]
37Accounts receivable/Primary business income = range28 [0.791, ∞]Capital and reserves/Total debt = range28 [19.932, ∞],
Gross profit/Primary business profit = range28 [0.777, ∞]
38Capital and reserves/Total debt = range28 [19.932, ∞]Accounts receivable/Primary business income = range28 [0.791, ∞],
Gross profit/Primary business profit = range28 [0.777, ∞]
Publisher’s Note: MDPI stays neutral with regard to jurisdictional claims in published maps and institutional affiliations.

