Article

Collaboration between Government and Research Community to Respond to COVID-19: Israel’s Case

1
Data Science Research Center, The University of Haifa, Haifa 3498838, Israel
2
Faculty of Law and The Center for Cyber Law & Policy, The University of Haifa, Haifa 3498838, Israel
3
Timna-Big Data Platform Unit, Ministry of Health, Jerusalem 9446724, Israel
4
The Center for the 4th Industrial Revolution, Israel Innovation Authority, Jerusalem 9695102, Israel
5
Master in Design Department, Shenkar College of Engineering and Design, Ramat Gan 5252626, Israel
6
Microsoft Research, Herzeliya 4672415, Israel
*
Author to whom correspondence should be addressed.
J. Open Innov. Technol. Mark. Complex. 2021, 7(4), 208; https://0-doi-org.brum.beds.ac.uk/10.3390/joitmc7040208
Submission received: 30 August 2021 / Revised: 20 September 2021 / Accepted: 21 September 2021 / Published: 1 October 2021

Abstract

:
Triggered by the COVID-19 crisis, Israel’s Ministry of Health (MoH) held a virtual datathon based on deidentified governmental data. Organized by a multidisciplinary committee, Israel’s research community was invited to offer insights to help solve COVID-19 policy challenges. The Datathon was designed to develop operationalizable data-driven models to address COVID-19 health policy challenges. Specific relevant challenges were defined and diverse, reliable, up-to-date, deidentified governmental datasets were extracted and tested. Secure remote-access research environments were established. Registration was open to all citizens. Around a third of the applicants were accepted, and they were teamed to balance areas of expertise and represent all sectors of the community. Anonymous surveys for participants and mentors were distributed to assess usefulness and points for improvement and retention for future datathons. The Datathon included 18 multidisciplinary teams, mentored by 20 data scientists, 6 epidemiologists, 5 presentation mentors, and 12 judges. The insights developed by the three winning teams are currently considered by the MoH as potential data science methods relevant for national policies. Based on participants’ feedback, the process for future data-driven regulatory responses for health crises was improved. Participants expressed increased trust in the MoH and readiness to work with the government on these or future projects.

1. Introduction

The COVID-19 pandemic has shaken the daily lives of many. Societies around the globe have been facing unprecedented challenges to which governments have responded with myriad national and local healthcare policies and regulations that ultimately rest on citizens’ compliance. Since such policies entail significant infringements on basic liberties, the requirement to base the regulatory schemes on sound evidence is not only legally required but also a prerequisite for public confidence and trust, and ultimately for social resilience. The push towards evidence-based regulation, in the face of uncertainty, pressed state agencies to collect massive amounts of data, intensifying concerns related to privacy, dignity, and equity. Transparency and accountability, ever more important, had to be balanced against the commitment to protect private information. Against this complex backdrop, COVID-19 data policies play a central role.
The Ministry of Health of Israel (MoH) has been providing up-to-date national data on the COVID-19 pandemic via DataGov (the Israeli government dataset archive) [1] and Corona Dashboard [2], allowing the research community in the healthcare sector, academia, and Israeli industry to conduct research in the field of health. Due to the structure of Israel’s healthcare system, the government has a significant amount of relevant data at its disposal.
In early March 2021, a year after COVID-19 regulations came into force, Israel has been fighting its third wave of outbreaks by operating its large-scale immunization plan, limiting congregations and gatherings, and restricting in-person elementary school attendance to times and locales of low COVID-19 incidence, while grades 7–10 remained studying from home via Zoom (Table 1).
Motivated by the danger of the rapidly moving COVID-19 pandemic, TIMNA, the big data platform unit at the MoH, decided to harness the research community of Israel to develop data-based insights that could assist the government in devising policies for fighting the pandemic, while seeking to limit the collateral infringement of privacy and other basic liberties. Hence, TIMNA initiated a COVID-19 “datathon” [3,4]—a hackathon that revolves around data and utilizes data science methods. The Datathon’s goal was to provide prototype models (“insights”) for designing COVID-19-related policy challenges by engaging the research community from all sectors: high-tech industry, healthcare, academia, and the public sector. To do so, the MoH partnered with the Innovation Authority (InnovA), research centers at the University of Haifa, and industry (primarily Microsoft), thereby forming a diverse organizing team. The organizing team, who are the coauthors of this paper, helped the MoH identify specific contemporary challenges which could be solved using data, and assisted in operationalizing the Datathon (See Section 2.4). These challenges related to immunization and testing strategies as well as to the opening of schools.
The Datathon had two main objectives:
  • To assist the government in shaping effective instruments and policies for addressing COVID-19 challenges by developing timely, relevant, and implementable data-driven insights by engaging a trust-based, collaborative community of expert researchers from multidisciplinary sectors, who could form teams in an accountable and transparent process to brainstorm and rapidly develop data-driven insights to address national and international health care challenges.
  • To develop a process for future similar events, based on deidentified governmental data, that are feasible, useful, and compatible with rule-of-law and civil rights guarantees.
A datathon format was ultimately chosen to achieve these objectives because it offered several advantages. Significantly, it is premised on sharing live data in a controlled, secured environment, which balances open innovation with compliance with data-security protocols and privacy regulations. Moreover, it provides teams with peer review from mentors, evaluation from judges, and the opportunity for exposure to decision-makers. This could result in subsequent opportunities to work together with the MoH by applying the suggested insights in practice. While many other COVID-19-related hackathons had already taken place [4,5,6,7,8,9,10,11,12], this datathon is the first that was initiated by the government, engaged all sectors of society, and allowed the selected teams, in a controlled environment, to use up-to-date governmental data.
The importance of this paper is two-fold. First, it aims to share the methods that we designed for organizing a virtual datathon. We hope that other governments and agencies will find these methods useful, and that they can learn from our experience and engage the participation of multiple stakeholders, and thereby benefit from a diversity of approaches to challenges based on wide-ranging, reliable, and deidentified governmental databases. Second, in subsequent feedback polls we found that such an approach holds the potential to increase the participants’ trust in the government and its regulatory policies. This output is important, especially in managing crises and emergencies.

2. Materials and Methods

To meet the objectives, an accountable and transparent process was used to plan and carry out the Datathon (Table 2 and Figure 1). Validation of the steps taken was completed via an anonymous questionnaire distributed to participants and mentors one week following the event.

2.1. Initiating the Idea and Early Steps

TIMNA, a representative from Microsoft, and a design scholar from Shenkar College conducted extensive consultations with relevant healthcare-field stakeholders. Pursuant to those discussions, the MoH conceived of the idea to conduct a Datathon six months prior to the event. A team of six professionals was established, and they conducted 11 interviews with national and international data consumers, providers, and users during August to September 2020. Among the interviewees were health organizations, hospitals, the nursing division at MoH, municipalities, and welfare services. The interviews focused on three main themes: (1) privacy hurdles; (2) the lack of trust between other agencies and industry; and (3) poor communication and the inability to easily access the data.
Two months prior to the event, a diverse organizing committee was formed from the MoH, academia (University of Haifa (UoH): Center for Cyber Law & Policy (CCLP) and Data Science Research Center (DSRC)), the high-tech industry (Microsoft), and the National Innovation Authority (InnovA). The event itself took place virtually, during 9–11 March 2021. Registration was open to the Israeli public and was free of charge.

2.2. The Regulatory Framework

Attention was paid to the regulatory framework relevant to the Datathon. Data protection (and related privacy concerns) were addressed in the design of the environment and through the bylaws governing the activity, which were integrated into the registration process so that each participant had to undertake a legally binding commitment not to engage in reidentification or otherwise breach data and privacy laws.
The Datathon offered the MoH an opportunity to engage with data science talent to develop better policies for handling the COVID-19 pandemic. The judges’ panel included four members of the operative team tasked with managing the pandemic (“The Corona Cabinet”).
Since the Datathon focused on generating data-driven policy tools for governmental decision-makers, and since such tools were oriented to be considered as possible components of regulatory regimes, legal approval of ethical boards according to the Helsinki protocols was not formally required. Special attention was paid to the matter of intellectual property (IP), and the terms of participation in the Datathon provided that the MoH (and the Israeli government more generally) would not be required to pay for the use of any outcome of the Datathon, but IP rights remain with the participants for commercialization in markets outside Israel, and vis-à-vis health organizations other than the Israeli government.

2.3. The Challenges

To identify challenges that would be relevant at the timing of the event (two months later), The MoH team set up interviews with multiple stakeholders, including senior employees within the MoH, researchers from policy-oriented centers, and leaders from industry with an emphasis on companies specializing in data. The MoH team presented the suggested challenges and asked the interviewee to rank them on a scale of 1–5 across three dimensions: (1) the degree of interest; (2) the availability of data to support analyses related to the challenge; and (3) the potential for deidentifying the data while balancing the risks and retaining meaningful features.
The three highest ranked challenges that were relevant at the time (4 January 2021) were (1) the vaccines’ effectiveness, (2) the impact of school-reopening policies on the morbidity burden, and (3) identifying populations that are underrepresented in coronavirus tests. The definition of the challenges was refined, as “Increasing the effectiveness of immunization strategies”; “Management of challenges at the young population”; and “Improving receptiveness to undergo COVID-19 tests”.

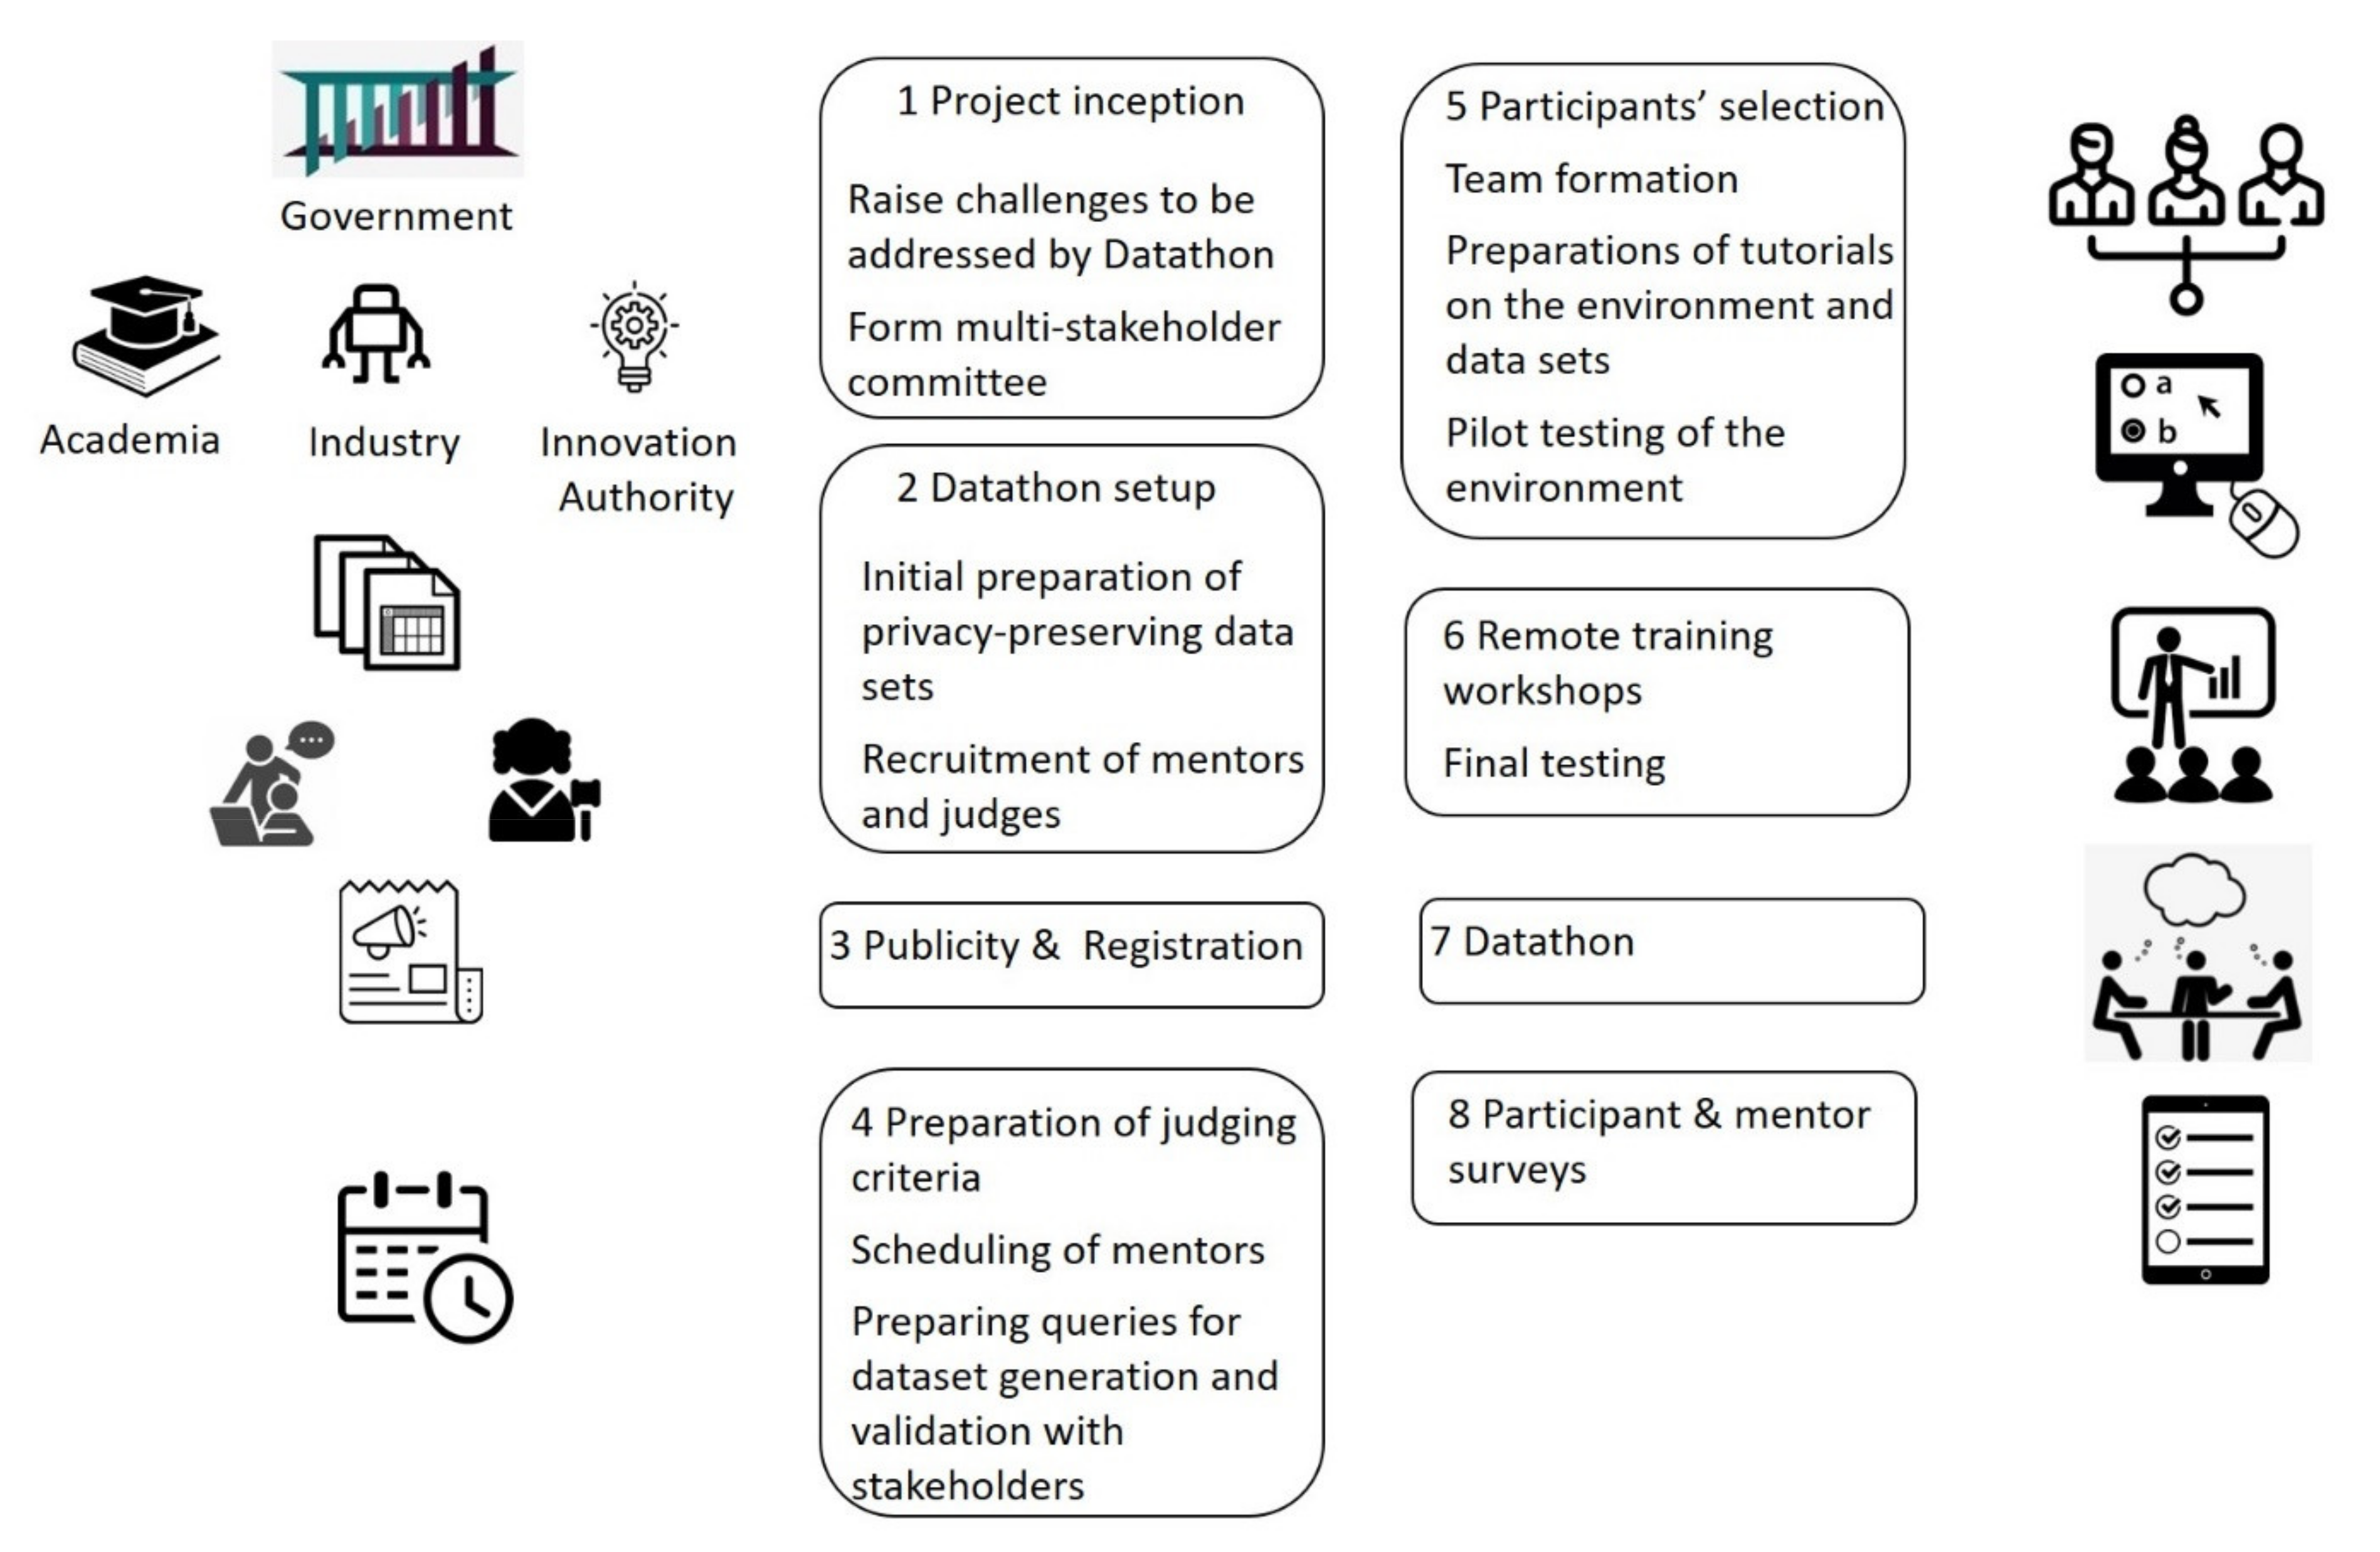
2.4. Preparation: Management Team and Process

The organizing committee had twice-weekly and additional meetings using Microsoft Teams. Trello was used for task planning and follow-up. WhatsApp groups were formed and used for communication. The steps for organizing the Datathon are summarized in Table 2 and Figure 1.

2.5. Data Preparation and Secure Rooms Setup

The MoH routinely shares data with the public in a manner compatible with contextual privacy principles. These methods include (a) tables with few fields to prevent cross-referencing the data with other data sources in order to reidentify individuals, (b) values that are grouped into ranges (e.g., age groups rather than date of birth), and (c) not presenting data relating to groups of items belonging to less than 15 individuals, in accordance with the policies of the Israeli Bureau of Statistics. These modes of abstractions or dilution still provide important information, but limit privacy-related risks.
For the Datathon, data were selected based on the challenges posed (Appendix A). The set of variables selected for each challenge was chosen by an epidemiologist who was familiar with the clinical needs and available data. A deidentification and anonymization protocol was then implemented for each dataset to ensure minimal potential for identifying individuals. The potential tables were then presented to different researchers, and changes were applied based on their comments.
The data included details that had not been shared with the public before (Appendix A): detailed data on an individual level, with more granular age groups, data about the sector (i.e., whether it was Jewish, Arab, ultra-Orthodox, etc.), statistical area (zip), and socioeconomic level, along with data on the size of each locality and statistical area. These characteristics may reflect social norms relevant to the challenges, or may otherwise impact potential reactions to policies that may be generated by the Datathon. At the same time, these characteristics are sensitive, even at the aggregate level, and hence they had not been previously released to the general public.
The data that were shared were current, reflecting the situation 96 h prior to the beginning of the event. Each group had access to the relevant table (in CSV format), with no access to the tables of the other challenges. In addition, the shared virtual environment provided access to more publicly available datasets, such as updated tables from the Israeli government dataset archive [1], publicly available tables from the Israeli Bureau of Statistics that could enrich the main datasets by linking to the geographic statistical areas, and other publicly available tables from different governmental offices.
The research environment was virtual, and participants worked from home and groups worked together via virtual discussion channels. We used a secure virtual machine research environment provided by Amazon Web Services (AWS). Penetration tests were conducted to ensure no data breach could be made into the environment, and to minimize any risk of data extraction from the environment. The virtual environment applied a simple user-friendly connection using multifactor authentication via the Duo Mobile application. The software available in the research environment included: R, RStudio, Python, Anaconda, and Jupyter notebook; Power BI; and MS Office tools.

2.6. Participants, Mentors, and Judges Recruitment and Team Building

Google Forms for the registration of participants and mentors were prepared. The fields included in the participant and mentor registration forms are specified in Table 2 (row 2).
The website created for the event included a link to the participant registration forms [13]. The event was advertised on social media (LinkedIn, Facebook, Twitter), on the MoH website, and on professional email lists, including lists of nonprofit organizations focusing on advancing women and minorities in high-tech and data science, utilizing InnovA’s channels of communication. An announcement was also sent to representatives of all academic data science research centers, who were asked to forward the announcement to relevant researchers. Registration was open to all Israeli citizens, free of charge. The response was greater than anticipated, such that less than 28% of the applicants could participate.
The data from the registration forms included demographic, sector, and experience information of each participant, and were automatically fed into a spreadsheet. This facilitated the screening of participants by the MoH and professional auditors from InnovA. Subsequently, the candidates with the best expertise in data science, epidemiology, and regulation and policy were selected. The number of candidates selected was planned for five to six groups per challenge with around four to five participants per group, yielding around 80 participants (78). Participants who registered as a team remained as such and were also assigned to the challenge that they had indicated as preferred. The teams who self-organized were from high-tech companies, government, public organizations, or academia. When groups were small (two to three participants), individual registrants were added to complement the team’s expertise. Based on the information provided in the spreadsheet, care was taken to include representation from all religious and ethnic sectors, males and females, young and older participants, experienced and more junior participants (e.g., students), different occupation sectors, including academia, industry, health care, and law/policy/governance, and different disciplines (e.g., data science, law and governance, epidemiology, etc.).
After the schedule for the Datathon was created (Table 3) and the number of sessions with mentors (4) and participants (~80) became clear, the number of mentors (36) for the event was determined such that each mentor would be available in at least one session and that all sessions would be covered. This resulted in 20 data science mentors, 6 epidemiology mentors, 5 presentation mentors, and 5 policy/regulation mentors.
The mentors were expected to (a) help teams with issues that arose during their research, (b) provide the teams with a broader view and help them brainstorm and think creatively, and (c) help teams maximize value from the data available to them during the 48 h allocated.

2.7. Project Evaluation by Judges

The project evaluation criteria were proposed by the UoH and were discussed and refined with the team of judges. The criteria related to the project’s importance and potential impact (15%), methodology (25%), innovation (20%), ease of implementation and compliance with regulatory regimes (15%), potential for pursuing further R&D with the team (5%), clarity of the presentation (5%), and overall impression (15%). Upon receiving comments from the judges, these criteria were broken down into more concrete questions (Appendix B), in order to ensure common language between judges.
Participants were asked to create presentations using MS Office tools available in the virtual environment and place them into a dedicated folder in that environment. Retrieval of the presentations was performed 30 min before judging.
The evaluation was carried out in two steps (semi-finals and finals). During the semi-finals, which took 2 h and were held on the last day, 48 h after the start of the event, three Zoom rooms were available, one per challenge. Only the groups belonging to each challenge, three judges, a moderator (per challenge), and members of the organizing committee attended the semi-finals. Each team (six teams were planned per challenge) presented for 7.5 min and answered the judges’ questions for another 7.5 min. Each judge was given access to a secure and private Google Sheet, prepared according to the evaluation criteria. The judges were asked to rate the projects according to each criterion on a Likert scale of 1 to 5 and also include a verbal assessment. The assessments of each judge were automatically imported into a Google Sheet that was shared with the judges by a moderator from UoH, who projected the Google Sheet to all judges. The judges then selected two finalists, and the moderator passed the project names to the moderator of the finals. The judges had 45 min to arrive at their decision. The closing ceremony started 15 min before the judges completed their decision.
Six judges were scheduled to evaluate the six finalists. This time, all participants and invited audience members assembled into a single Zoom room. A procedure similar to that of the semi-finals was used for evaluation by the judges. The closing event continued during the 30 min of judging until the three winners were announced.

2.8. Tools for Virtual Communication

The Datathon was run at a time when public gatherings were restricted. It was therefore entirely virtual. To allow video conferencing, Zoom rooms were provided. A general room and three additional rooms, one per challenge, were created for the introductions to the datasets and for the semi-finals. The general room was split into multiple rooms, one per mentor, during mentoring sessions. Mentors entered the rooms and the participants scheduled meetings with them either during those time slots or outside the dedicated time slots.
Slack was used to broadcast and to privately send messages and share information during the challenge. It was chosen because the platform allows knowledge and information management, and enables members of the group to join conversations and access previous exchanges. Different channels were available: common to all participants and mentors was a general channel for communicating organizational information, a help desk channel for technical questions, and a channel for sharing questions regarding privacy issues. Private communication channels were opened for each team and were also used to communicate directly with mentors. A general public channel for communication with mentors was available. A private channel was created for mentors so that they could conduct internal conversations, and a private channel was created for the organizing committee. The teams also used their own forms of communication (mostly Zoom, WhatsApp, and email) in addition to Slack.

2.9. Participant and Mentor Surveys

The validation of the methods was completed via an anonymous questionnaire distributed to all participants and mentors one week after the event in an email sent to participants, and to mentors with a link to Google Forms. The ethics committee of the University of Haifa approved the study. The participant and mentor surveys were extensions of surveys used in Braune et al. [5] (Appendix C and Appendix D). The extended questionnaires gather the participants’ and mentors’ experience and perceived value. The extended participant survey included 37 questions.
The mentors’ feedback in Braune et al.’s questionnaire focused on the difference in their experience as mentors in the virtual event vs. face-to-face mentoring. Questions were added to gather the mentors’ feedback on things that worked well and things that should be improved. The additional questions regarded the organization of the Datathon and the specific aims of the Datathon, including community building and the mentor’s interests in working with the teams further. The extended mentor questionnaire includes 13 questions.

3. Results

The results of the questionnaires and the analysis of the recorded presentations and Slack channel usage are presented in four sections. Section 3.1 provides descriptive data relating to the participants’ background and Section 3.2 describes the Datathon experience as it was perceived by the participants and mentors. Two other sections regard the Datathon’s objectives: the production of useful data science projects (Section 3.3), and the formulation of a process for future data-based collaboration between the government and researchers from all sectors of society (Section 4.3.3). The latter is based on our analysis of points of strength and concern that are reviewed in the Discussion section.

3.1. Participants’ Background

Of 280 people registered for the Datathon, 78 participants passed the selection process and participated throughout the entire event. The participants were organized into 18 teams (six per challenge). Participants were from different sectors: industry, mostly high-tech (40); academia (22); public sector (10); and health care (6). About 75% of the participants registered as part of a team. Of the 18 teams that started the Datathon, seven teams were original teams, and the rest of the teams were assembled by the MoH based on individual registrations or registrations of very small teams. One team dropped out during the first day of the challenge and one team decided to split into two. Thus, there were six teams in the first challenge, five in the second challenge and seven in the third challenge. Of the 280 registrants, 79 were female (28%). Of the 78 participants, 25 were female (32%).
Online surveys were completed by 18 of the 78 participants (23%) and 12 of the 36 mentors (33.3%). The participants who answered the survey are representative of the body of participants in terms of the sectors to which they belong and in terms of having registered as teams vs. individuals. Most of them had heard about the event via their social networks. Around 60% of the participants had attended hackathons in the past, and 30% of them had attended online hackathons before. Close to half (47%) of the respondents indicated that they have previously worked with the publicly available COVID-19 data (a subset of the full datasets provided during the Datathon).

3.2. The Datathon Experience

3.2.1. Online Experience

Most of the participants were satisfied or highly satisfied with the online Datathon experience, including the participant selection process, the team formation process, the support provided by the organizing team and by the mentors, the adequacy of judging, and the data science and presentation tools supplied (Table 4). More participants expressed satisfaction with the data supplied than dissatisfaction. Half of the participants expressed concerns regarding the adequacy of the virtual environment (see specific points of concern and opportunities for improvement regarding the datasets and the virtual environment in Section 4.2.3 and Section 4.3.3).
Participants missed the physical presence of their team members and mentors (and found that the status meetings that opened and closed each day were unable to replicate the physical experience). Mentors noted that while the online format offers greater availability, the physical environment, as one mentor noted, allows for “getting a glimpse of more projects”. Four of 11 mentors reported that this difference negatively impacted the quality of the mentoring that they were able to provide because of the limited opportunity to be proactive.
Having said that, half of the mentors who answered the survey expressed a high (four) or very high (two) rating of their mentoring experience. The majority of the mentors (six) reported that new insights were gathered. Two mentors reported learning novel facts about the COVID-19 data itself; one mentor highlighted the importance of integrating ethical considerations into the pre-event workshop (see Table 2).

3.2.2. Collaboration during the Datathon

Most of the participants expressed high or very high satisfaction from the interaction with the mentors and from the judging (see Table 4). Most mentors (10 of 12) reported that it was easy to schedule meetings with the teams and that the teams’ responses to their suggestions were satisfactory (five) or highly satisfactory (one).

3.2.3. Use of Slack for collaboration

According to the survey results, most of the participants were satisfied or highly satisfied with the use of Slack for communication among team members and with the mentors and organizers (Table 4). Appendix E presents data on the usage of the Slack channels. Overall, Slack was routinely used by all participants, the mentors, and the organizers, but its main use was for announcements on the general Datathon channel (249 messages) and on the help desk channel (333 messages).
Most of the mentors used the Slack channels to communicate on the general Datathon channel and to communicate with the organizers. Instead of using the help desk channel, mentors relied on direct communication with the organizers. Most mentors did not document their advice on Slack; hence, mentors that advised the teams could learn about the advice given by other mentors only through comments made by the teams themselves.

3.2.4. Collaboration after the Datathon

More than half of the participants who answered the questionnaires expressed interest in pursuing their project further. The teams who won the first and second place were further engaged with the government on improving COVID-19 policies (see Section 4.3).

3.3. Projects-Helping Solve the Challenges

Appendix F presents information regarding the six finalists: the teams and their projects, including team composition; their prior experience with COVID-19 data; the number of mentors sought by the team; their project title; the data science methods and tools used (and the judges’ ratings for this aspect); the main insights; and the judges’ ratings of the potential impact of the project, the degree of innovation, the ease of implementation considering regulatory aspects, and the ease of working further with the team itself. Table 5 provides more details on the top three projects, the first two of which concerned the young population challenge and the third which concerned compliance to COVID-19 tests.

4. Discussion: Strength, Concerns, and Open Innovation

4.1. Points of Strength

4.1.1. Diversity of Participants

The open call and the selection process, which was sensitive to diversity, resulted in engaging participants from a broad range of disciplines, drawing them from academia, industry, and the public sector, and from different religious backgrounds. About a third (32%) of participants were women (28% of registrants were women).

4.1.2. Organization and Personnel

The MoH’s process of assembling mixed teams, with team members possessing complementary expertise, was successful. Half of the finalist teams, including the winning team, were mixed.
The vast majority of the respondents indicated that their needs and questions were met by the organizing team.

4.1.3. Data Science Tools Provided

Most of the participants were satisfied or highly satisfied with the tools provided. Participants suggested adding some specific R and Python packages and other tools that they use at work, including Amazon and Azure tools, Matlab, and SAS.

4.2. Points of Concern

Future organizing teams will have to consider their preferred optimization when facing the following points of concern.

4.2.1. The Participant Selection Process

As the transparency regarding the selection process increases, accountability and potential for trust increase. However, embracing transparency to the point of providing explicit ratings for each of the applicants on each of the criteria listed risks dissuading those who received lower ratings from further engagement and raises the specter of an adversarial process of contestation. The organizing team opted for “soft” grades at three levels: accepted, waitlisted, or rejection.

4.2.2. The Selection of Challenges

By focusing on three specific challenges established in a process involving multiple stakeholders, other problems were not available for research, and some participants have suggested that a longer list of more concrete problems would have been better. An interesting idea mentioned in the surveys is to consider a “wild card” challenge where teams come up with their own challenge and try to solve it. For such a challenge, an all-inclusive dataset could be constructed.

4.2.3. Data and Models Standardization and Sharing

A point of strength of the government-shared dataset was that it was standardized based on the Israeli Bureau of Statistics codes, which could make it joinable with other tables. However, due to privacy concerns, steps have been taken to prevent such joins, honoring privacy while sacrificing some of the data’s potential. Data belonging to medical groups are richer than the government’s data. For example, it includes patient diagnoses, which can allow an analysis of risk factors. However, such data have not been shared with the public.
To create an integrated database, standard definitions should be provided for concepts such as seriously ill patients, for policies of lockdown and school opening, etc. This is not easy to do even within a single country, because these definitions have changed over time. In our particular Datathon, such temporal definitions were mediated by supplying the worst state of a hospitalized patient over the entire duration of a hospital stay. Patient data standards that define semantics, such as SNOMED-CT codes, Observational Medical Outcomes Partnership (OMOP) common data model, and communication protocols (e.g., Health Level Seven’s Fast Healthcare Interoperability Resources (FHIR)) could help in solving technical challenges. However, the government-to-government process of data integration and sharing entails political and regulatory challenges as well, and so this is a topic for future research.
Some participants have expressed a desire to continue to work on the data and further advance their proposed insights. However, to reduce the chance of a privacy breach, all work was conducted on the MoH’s virtual rooms. Participants were not able to download the data, code, or models to their computers without a review by the organizing team. Given the ability of a complex deep learning module (DNN or CNN) to encode private information, we limited their export even for teams who created them, which made the use of these modules even less favorable. This raises the issue of finding ways to continuously share the data.

4.2.4. The Timeframe and the Infrastructure

This Datathon lasted for 48 h, which was enough time for teams to present a basic concept and test it on the available data, but not much more than that. Related in part to this is the research environment. While conventional hackathons are premised on having access to any and all tools and available data, this Datathon was held in a controlled environment, striking a balance between usefulness on the one hand and data security and privacy on the other. This balance resulted in slower response times and the unavailability of some tools. Consequently, some participants wished for more time. It seems that an additional 12 h would have been beneficial for many.

4.2.5. Prizes and Recognition

The incentives to participate in a datathon are multiple. Some look for important puzzles to solve, especially if the data are unavailable elsewhere. Others seek networking opportunities. Others, however, seek to develop prototype solutions that could be turned into products and sold. Given the very tight budget that this Datathon operated under, the organizing team decided that no monetary prizes would be awarded. However, there is a selection bias because people who sought monetary prizes likely did not join the Datathon to begin with.

4.3. Open Innovation between Government and the Research Community

4.3.1. Related Work

Existing literature addresses open innovation and collaboration between government and the research community.
i.
Open innovation-related work
As noted by Patrucco et al. [14], it is interesting to consider the government’s policies for fighting the COVID-19 pandemic by considering open innovation theories. Yun et al. explain how open innovation engineering can be used to promote open innovation via knowledge sharing [15]. One way is, figuratively, to make holes in the knowledge funnel to allow the penetration of inbound and outbound open innovation. The second way to engineer innovation is to expand the knowledge funnel to other markets. By inviting the research community from all sectors in Israel to solve inventive problems via big data and artificial intelligence models, the MoH found a way to allow ideas and algorithms that were usually employed for markets other than health, such as tourism, navigation, and the aerospace industry, to penetrate into government policies. These ideas suggested constructive and novel ways for predicting the dispersion of the pandemic and to improve citizen adherence to COVID-19 related policies.
We observe that governments learn from other governments’ experience in addressing the spread of COVID-19. Thus, some policies (e.g., those related to social distancing, masks, testing, and vaccination) that prove to be successful in one jurisdiction become dominant, or de facto standards, in other jurisdictions. Yun et al. [16] proposed two interlinked hypotheses when researching dominant design in global markets. The first hypothesis states that the maturing of the industry affects the appearance of the dominant design. The analogy to the COVID-19 pandemic is that as data-based prediction algorithms mature, dominant policies used by governments emerge. Furthermore, the second hypothesis by Yun et al. states that the consumer requirements affect the emergence of the dominant design. The analogy here is that the public’s behavior affects the adherence and uptake of different policies for fighting COVID-19, and affects the policies that become dominant. A tool that can help track different governmental policies and study their dynamics is the Oxford COVID-19 government response tracker (OxCGRT) [17]. This tool aims to track and compare policy responses around the world, rigorously and consistently. It covers more than 180 countries, policies coded into 23 indicators, such as school closures, travel restrictions, and vaccination policies. These policies are recorded on a scale to reflect the extent of government action, and scores are aggregated into a suite of policy indices. The data can help decision makers and citizens understand governmental responses in a consistent way. This information analysis-and-sharing tool, and similar data hubs [18], bring eGovernment [19,20] to the transnational level, thereby providing much-needed assistance with which to manage the crisis, given the relatively high degree of uncertainly embedded in emergencies [21]. Moreover, while eGovernment has used information and communication technology to provide services to citizens for over a decade, sharing data with the research community, with a specific emphasis on the transnational dimension, opens a new platform for cross-pollination and rigorous comparative analysis that is expected to become more common in the near future.
ii.
Collective intelligence-related work
Innovation may be increased via collective intelligence. The multidisciplinary teams that participated in the Datathon, and the multidisciplinary inputs offered by mentors with immunology, data-science, regulation, and innovation backgrounds, generated a form of collective intelligence, in which team members shared views, ideas, and criticism, and arrived at a consensus regarding the innovative data science method that they proposed to address the COVID-19 challenges. This is in line with theory of Yun et al. [22], who suggest that collective intelligence or crowd innovation opens new combinations similar to the creativity of open innovation [22]. In particular, Yun et al. have shown that collective intelligence may increase the performance of a firm; in our case, the collective intelligence increased the performance of the team and also of the government, when the winning teams’ insights were further examined and adopted by the MoH.
Budge et al. [23] explain that collective intelligence increases the capacity for knowledge, and crowdsourcing broadens the diversity of input and offers exposure to a variety of specialist skills. These processes increase insight and creativity brought to a developing team. In our Datathon, collective intelligence and crowdsourcing were applied toward health care innovation via solutions to empirical challenges related to governmental policies for fighting the COVID-19 pandemic.
We note that over half of the Datathon’s participants (40 of 78) were from industry, 28% were from academia, ~13% were from the public sector/government, and ~8% were from the healthcare sector. This demonstrates the high level of motivation within the research community from all sectors, including industry, to participate in knowledge discovery and sharing related to crucial issues, such as the COVID-19 pandemic. As noted by Khan and Park [24], strong research relationships between government, universities and industry are crucial for any knowledge-based innovation system, and an increased role and level of interest from firms would have positive effects through technological improvements and innovations. We add to this the observation that such research relationships and innovation systems are of particular importance during emergencies, given the need to develop relevant, reliable, and applicable knowledge in a relatively short time.
Hardy and Williams [25] would have defined the collaboration formed within the Datathon’s teams as “transdisciplinary”. Transdisciplinarity involves the production of knowledge in “the context of application”, with different stakeholder groups consisting of researchers from different disciplines as well as practitioners, and considerations of how collaboration is managed. Hardy and Williams emphasize that methodological rigor involves relevance, credibility, authenticity, and usability, including establishing the theoretical plausibility of the methods, and, in our case, the insights formed by the participating teams. Indeed, the first- and second-prize teams based their methods on literature reviews and theories. This resulted in the coproduction of knowledge at different levels (e.g., theoretical and practical), involving different interests (e.g., economic, social, and technical), stakeholders, and disciplinary fields. Finally, the evaluation of the insights and models produced by the teams by the panel of judges is in agreement with Hardy and Williams’ recommendation that to inform policy, research findings also need to be understandable, usable, accessible, and timely. Moreover, we note that transdisciplinarity is sensitive to regulatory concerns as well, as these affect not just usability, but also compliance with fundamental rights.
More specifically, open innovation must also abide by the governing privacy regulations, data protection, and ethical principles. These are important in particular for research that is based on governmental big data and especially during emergencies [26]. When research teams include diverse organization types, the knowledge related to ethics varies among partners. As discussed by Nho, [27] a “change in the way of thinking” about ethics is needed, which cannot always be accomplished simply by passive knowledge delivery. Working in partnership via multidisciplinary teams from different sectors aids in such behavioral change. At the same time, working together with the government informs both the agency and the industry of various dimensions of the governing regulations as it requires their application and interpretation in the design and implementation stages. As this Datathon reveals, this is relevant with respect to the boundaries generated by fundamental rights, as well as structures relating to intellectual property (where open innovation is not easy to implement as noted by Bican et al. [28]). Such open innovation allows for regulatory innovation as well (since it is developed both at the design stage of the Datathon and then implemented and further honed during its use [29]). In fact, the involvement of the attorney general’s office in this datathon was understood by their representatives as precisely that, as expressed in their comments. However, we should note that because of the limitations of the controlled environment and the selection process, designed in order to comply with the governing regulatory structures, the Datathon was not a fully open innovation setting, nor was it presented as such. In this respect, this paper reports on a hybrid design, or a semi-open structure (compare: Temiz & Broo, [30]).
Successful open-innovation collaboration in which a company engaged with the academic research community in six different simultaneous projects spanning different services are presented by Campana et al. [31]. These collaborations were long-term, spanning two years. The key to the success of these collaborations relied on promoting common projects whose results can be used on several fronts and finding the right balance between assuring a competitive advantage for the company, while allowing research institutions the possibility to advance their scientific programs and publish their results.
Sustaining the community that has formed during a 48-h Datathon is not an easy task and requires effort and planning. A useful strategy can be learned from Dawes et al. [32], who found that sustainable, international eGovernment research collaborations could be formed by providing legitimacy and modest funding within a minimal set of structural and management requirements. Multidisciplinary working groups were formed with the concrete goal of creating shared artifacts, such as publications, software (e.g., machine learning models in our case), or conferences (or datathons). These played a role in the process of creating, sharing, and sustaining knowledge and in facilitating participation. Dawes et al. introduce the modest budgets to allow face-to-face meetings which have been repeatedly shown as important to building and sustaining personal relationships between the members. According to these researchers, the working group activities should take a reasonable length of time. Their findings suggest that this low-cost package of design elements creates an environment for encouraging collaboration, discovery, and innovation, even across national boundaries, regardless of topic.
Another factor that is key in establishing sustainable collaboration is trust. Sayogo et al. [33] studied cross-boundary digital government research collaboration. They found that researchers need to establish credible trust relationships to improve the chances of successful collaboration. Interestingly, we found that the Datathon itself, including the exposure, in a controlled environment, of real and meaningful data to the participants, increased trust.
Schindler et al. [34] argue that validation is crucial for taking innovative, co-created strategies and insights and making them impactful and scalable. In the domain of child–parent relationship-nurturing, they have established a research and evaluation hub that facilitates rapid cycle learning and continuous feedback, facilitating solution-scaling.
Yun et al. [35] suggest that another way to make open innovations sustainable is to formulate business models. They observe four ways in which the dynamics of open innovation can form business models. These are driven by the needs of engineers, users, customers, and society. In our study, the unmet societal needs and governance needs were answered by the researchers coming with engineering, healthcare, and government (customer) expertise.
The description above has situated our work in relation to state-of-the-art open innovation and collaborative intelligence. An important contribution of our work in this regard is that it has demonstrated that a process of collaborative intelligence and crowd sourcing that leads to actionable, innovating data-based public health insights can be formulated in relatively short time, with the majority of the insights being generated in 48 h.
In the rest of this section, we provide details on the impact of the insights from the winning teams on governmental COVID-19 policy and on lessons learned to improve future hackathons that could provide the government with data-based insights from the research community.

4.3.2. Exploration of Insights of the Winning Teams by the MoH and Further Developments

Among the winning teams, the team that won first place asked to continue working on their project to improve their model and generate deeper insights for potential publication. Their employer allocated 20% of their time to continue working on the project. Subsequently, the team wrote a paper about their project together with a researcher from the MoH [36]. The Datathon’s second place team, together with leaders from the MoH and from leading epidemiology scholars, are still engaged in dialogue with both the MoH and the Ministry of Education regarding how to use their insights to improve future policies. If they succeed, this would be a unique first collaboration between the two ministries and researchers from industry and academia. The team who won third place did not have time to engage with the project further.
Based on our experience from the Datathon, and on feedback from participants, the MoH and the organizing team of the Datathon, we decided to expand the efforts toward seeking long-term sharing of governmental health data with the research community, rather than sharing data for a limited amount of time. The main challenge to such sharing is privacy. Hence, current efforts include a qualitative study with stakeholders from health organization, industry, and academia to understand generic data needs and deidentification challenges from the researchers or data science model developers in industry and to seek algorithmic and technological solutions for these challenges, which would make sustainable data sharing possible. This would allow the research community from all sectors to develop novel solutions for different health challenges.

4.3.3. Lessons Learned from the Hackathon: Improvement of the Hackathon Process

i.
IT and Tools
Future datathons should consider including a slot every 24 h where the environment can be updated with software requested by the participants and approved by the organizers’ IT team. Needless to say, 24/7 IT support is required throughout the event itself.
ii.
Data
Based on our experience, we recommend adding a pilot study serving as a quality assurance step two weeks prior to the event (Table 2). In this pilot, a team which would not compete in the Datathon would test the research environment and the datasets before the actual participants would be invited to test the data. Such strategies are important in order to avoid the participants’ impression that some challenges could not be solved in a meaningful way with the data provided, or that the government was simply trying to show how difficult the policy challenges are, without providing all the data that it actually has, arguing that such sharing would compromise citizens’ privacy.
iii.
Improving transparency
We suggest that the announcement of the Datathon should disclose the limitations on the number of participants, and the lack of budget for prizes and food. This could have lowered some resentment both of registrants who were not selected to participate and of participants.
iv.
Media attention and publicity
Given the importance and novelty of the event (perhaps the first government-led datathon related to COVID-19 data), it is important to generate a clear plan for engaging the media—traditional and social—before, during and after the event. Ideas include interviews with participants, mentors, judges, and the organizing teams, follow-ups after some time, and reports by the winning teams on the actual implementation of their insights.
v.
Participant communication process and interaction with the mentors and organizers
Mentors reported difficulty in setting up mentoring sessions via Zoom or Slack, difficulty in realizing which participants belonged to which team, lack of documentation of the advice given during mentoring sessions, and being idle. Most of these concerns could potentially be at least partially met by using the Mentornity platform [37], which was suggested by the organizers of another COVID-19 hackathon [5]. This tool shows mentors’ profiles, which can be searched by areas of expertise, and facilitates video call sessions for each team. Braune el al. [5] required each team to book, via Mentornity, at least one mentoring session. The number of mentoring sessions held by every mentor and team can be easily tracked by this platform, which also provides feedback forms to summarize the mentoring sessions. This may allow mentors to learn from one another and may allow the judges to reflect on the suggestions provided by mentors.
The daily status updates were important for ensuring the flow of the event and for communicating announcements and updates to all of the teams. Furthermore, they provided an opportunity for the teams to present themselves. In the future, such status updates could also include some suggestions from mentors that may be helpful for a given challenge (or for all challenges).
vi.
Judging—real-time and ex post communication
Participants of the semi-finals could have received greater input from judges about the strength and weaknesses of their solutions (beyond learning whether they passed to the next stage or not). Some have expressed concerns that the judges overemphasized the “commerciality” or “time-to-market” aspects of their solutions, but given the lack of ex post debriefing with judges or pointers for further ways to pursue their ideas, participants were left unsure.
vii.
Improve community building
Participants noted that a dedicated social group for the event could be formed, which may then carry forward to future events. Mentors observed the importance of informing the audience of future planned events and steps, subsequent to the Datathon.

5. Conclusions

5.1. Main Findings

In this study, we have shown, for the first time, that for an important cause it is possible to successfully engage a diverse community in a datathon that transparently shares up-to-date government data. Consequently, government policies were influenced by insights developed by the first-place team [38]. Additionally, a process for future research collaborations was established, spanning all sectors: national and local governance, academia, the high-tech industry, and healthcare organizations.
A highly significant finding is that 12 of 16 participants who responded to the survey indicated that the event had highly increased their trust in the government. This matter is of considerable significance for two interrelated reasons: public confidence is an essential element for maintaining resilience in the face of an emergency [39,40,41], and public confidence in many jurisdictions (including Israel) has suffered for various reasons (the examination of which requires a different study) [42,43]. The matter of access to novel data was also reflected by several of the participants’ comments as one of the key features that made the Datathon worth their while.
Analysis of the Datathon’s results and the surveys revealed points of strength as well as limitations and allowed us to learn from this experience and create a blueprint for future datathons.

5.2. Implications

The Datathon, which solicited participation from a rich body of researchers from relevant sectors, proved to be a promising start. Specific, evidence-based solutions were offered to relatively concrete challenges as formulated by the government, relying on rather robust sets of government data. The MoH is currently exploring ways to utilize these solutions. Moreover, and at least equally importantly, the participants appreciated the access provided by the government to a relatively large dataset, which an expression of the implementation of the government’s commitment to balanced transparency, which is itself a key component of sound policy. Engaging the research community in such a manner provided the opportunity to take part in a mission of national importance, which in itself could be understood as a component of solidarity. These elements of transparency and the spirit of a joint venture were reflected in an increase in public confidence as a result of the Datathon, as reported by the participants.
The process analyzed in this paper is replicable by other governments, and in contexts other than the COVID-19 challenge. In those contexts, thoughts should also be given to government-to-government (G2G) platforms, since expanding datasets may enrich the usefulness of the tool (and also generate more general social goods related to G2G cooperation). This paper is therefore an invitation to replicate and refine the process discussed here and further experiment in constructive tools for a productive data-sharing policy.

5.3. Limitations and Future Research Topics

We recommend that future public–private datathons follow the process detailed in Table 2 that builds upon the original process undertaken in this project, modified by lessons learned. Attention should be paid to expanding the datasets released for analysis, conditional upon the deployment of a deidentification processes in a controlled environment. Investing in the technical infrastructure (in terms of bandwidth and processing power) and providing access to a wide range of data science tools are also important factors for successful future collaboration.
The number of participants who answered our surveys one week following the Datathon was not very large. Integrating the assessment survey into the closing event is preferred because participants are waiting to learn who won the competition and thus are still behind a veil of ignorance of sorts, while still fully engaged.
Finally, carefully designed project-management processes, premised on constructive communication between the various circles of stakeholders and in keeping with the regulatory and ethical environment, are key.

Author Contributions

Conceptualization, M.P., A.R., S.S., M.A.T., M.A., O.D., S.H., D.P., M.S., E.Y.-T. and R.C.; methodology, M.P., A.R., S.S., M.A.T., M.A., O.D., S.H., D.P., M.S., E.Y.-T. and R.C.; software, T.G., O.D. and S.H.; validation, M.A.T., T.G., O.D. and S.H.; formal analysis: M.P. and A.R.; investigation: M.A.T., M.P. and A.R.; resources: M.P., A.R., E.Y.-T. and R.C.; data curation: M.A.T. and S.H.; writing—original draft preparation, M.P. and A.R.; writing—review and editing, M.P., A.R., S.S., T.G., M.A.T., M.A., O.D., S.H., D.P., M.S., E.Y.-T. and R.C.; visualization, M.P.; supervision, M.P. and A.R.; project administration, S.S.; funding acquisition, M.P., A.R. and E.Y.-T. All authors have read and agreed to the published version of the manuscript.

Funding

Part of this work was made possible by resources made available by the Data Science Research Center at the University of Haifa (from the Council for Higher Education) and by the Center for Cyber, Law, and Policy at the University of Haifa in conjunction with the Israel National Cyber Directorate in the Prime Minister’s Office.

Institutional Review Board Statement

The study was conducted according to the guidelines of the Declaration of Helsinki, and approved by the Institutional Review Board of the University of Haifa (protocol code 206/21).

Informed Consent Statement

Informed consent was obtained from all subjects involved in the study.

Data Availability Statement

The datasets are described in Appendix A. Many of the tables are shared in reference [1] below. As described in Section 2.5, detailed data are on an individual level, with more granular age groups, data about the sector (Jewish, Arab, ultra-Orthodox), statistical area (zip), and socioeconomic level, along with data on the size of each locality and statistical area. These characteristics may reflect social norms relevant to the challenges, or may otherwise impact potential reactions to policies that may be generated by the Datathon, but at the same time, these characteristics are sensitive, even at the aggregate level, and hence they are not available outside the secure research environment.

Conflicts of Interest

The authors declare no conflict of interest.

Appendix A

Table A1. Datasets for the Three Challenges.
Challenge 1Challenge 2Challenge 3
Challenge nameIncreasing the effectiveness of immunization strategiesManagement of challenges of the young populationImproving receptiveness to undergo COVID-19 tests
Rows representImmunized individual 1Screening test result 3Individual who was tested
Size of the datasets (rows)4.9 M12 M4.9 M
Data fieldsage grouptest weekDate of first test
gendercorona resultResult of first test
city name 2age category (0–2, 3–5, 6–10,11–12,13–15,16–18,19–24, 25–29, 30–34, 35–39, 40–44, 45–49, 50–54, 55–59, 60–64, 65–69, 70–74, 75–79, 80+, null)Date of first positive test
city code 2education entity (toddler, preschool student, school student, staff)Number of corona tests done
zip code (=statistical area)is yeshiva student 4Date of last test
sector (general, Jewish ultra- Orthodox, or Arab, representing the majority of the population in the locality)sectorage group (0–4, 5–9, 10–14, 15–19, 20–24, 25–29, 30–34, 35–39, 40–44, 45–49, 50–54, 55–59, 60–64, 65–69, 70–74, 75–79, 80+, null)
health region (six regions)zip-10-levels 5gender (M, F, unknown)
date of first dosecity name 2sector
date of second dosecity code 2health region
date of first positive testzipzip-10-levels 5
date hospitalized due to COVID-19 prior to receiving the vaccinecity populationcity name 2
date hospitalized due to COVID-19 after receiving the vaccinezip populationcity code 2
worst situation at hospital following the vaccine (mild, moderate, serious, critical, deceased) zip
date of first ventilation aid after vaccine
city population
death weekzip population
number of contacts with positive persons reported on epidemiological interrogation
number of close contacts with positive persons
Additional tables from https://www.cbs.gov.il/EN/Pages/default.aspx (accessed on 24 September 2021) and https://data.gov.il/dataset/covid-19
(accessed on 24 September 2021)
(1)
Israeli Bureau of Statistics tables:
Streets and neighborhoods in zip code; names of localities (cities);
Population in localities by population group (Arab or Jewish + Other);
Population by population group, religion, gender, and age;
Population by population group, religion, gender, and age group;
Population in localities by municipal status (municipality, local council, regional council) and population group;
Population in mixed localities, by statistical area, population group and age;
Population by type of locality, locality, statistical area, gender, and age;
Population in localities and statistical areas, and religion;
Growth components in localities (via natural growth and immigration);
List of localities and statistical areas in which an ultra-Orthodox population lives according to the level of ultra-Orthodox homogeneity;
Population characteristics according to grouped levels of ultra-Orthodox homogeneity;
Periphery index: index value, ranking and cluster, value and ranking according to each of the components of the index;
Localities within regional councils and the periphery index;
Value of the compactness index, ranking and cluster, and the variables used to calculate the index;
Compactness index 2018: index value, ranking and cluster, and cluster change compared to 2006;
Population in localities and regional councils;
Local authorities.
(2)
Tables of government offices:
Employment service information at the locality and regional council level;
Administration of population and immigration residents in Israel by locations and age groups;
Ministry of Health: cumulative number of tests, number of patients hospitalized, number of respiratory patients, cumulative number of patients, number of severe patients, cumulative number of deaths.
(3)
Tables from https://data.gov.il/dataset/covid-19 (accessed on 24 September 2021).
Isolation data;
Laboratory tests;
Properties tested;
Recovering;
Statistical areas (zip);
Hospitalized;
Age and sex group;
Illness among medical staff;
Deceased;
The young population;
Table of localities;
Ages of vaccination;
Vaccinated according to locality.
(4)
Important dates for the education system:
Dates of returning to school;
Dates of school system closure;
Relevant events (date of first positive person in the country);
Date of extremely hot days on which citizens did not have to wear masks;
Date of remote learning being encouraged;
End of year for middle and high schools;
End of year for preschools and elementary schools;
End of year for subsidized preschool and K-4 grades;
Start of third lockdown without closure of schools.
1 Note that the population in Israel is 9.3 million, of which 30% are children under 16 years of age, who are not eligible to become immunized. 2 For localities with under 2000 people, names and codes are not provided, but only the value “under 2000”. 3 A person may appear in two different rows if they have been screened twice when exposed to different individuals at different times. 4 Yeshiva students belong to the ultra-Orthodox population. These are male students who attend boarding schools. 5 Socioeconomic level of the zip code area (10 levels).

Appendix B

Table A2. Judging Criteria.
CriterionRange (1–5 Score for Each Question, 1 Is the Lowest Score, 5 Is the Highest Score)
Significance of Project
Is the problem important? Does it address a serious concern (in terms of number of affected people, the magnitude of the matter for each affected person, or the resources it may save for the government)?(1–5: Minor/small/medium/high/extremely high)
Does the proposed solution address a significant enough portion of the problem?(1–5: Only a minimal portion/a small segment/moderate/a significant chunk/nearly the entire problem)
Methodology and Approach
Overall, does the proposed solution appear to be solid/rigorous enough to address the problem?(1–5: Shaky/OK/solid/impressive/really impressive)
Is the methodology chosen best suited?(1–5: No/reasonable/pretty good/good/very good)
Is the methodology coherent/logical/“clean”?(1–5: No/reasonable/pretty good/good/very good)
Are there better alternatives?(1–5)
Were alternatives considered, and the appropriate process of elimination engaged?(1–5)
Innovation
How innovative is the solution or the approach?(1–5)
Is innovation, in your view, a factor here, or is a more conservative/tested and true approach better for the particular problem, given the risks and potential gains?(1–5)
Maturity and Implementability
Is the solution offered ready for further development?(1–5: Barely/it would require a significant amount of work in terms of time and human capital/it would require a reasonable investment/it requires relatively little investment/it is, for this early stage, considered mature)
How easily is it expected to fit/be integrated with the current ecosystem?(1–5: not easy/reasonable/pretty easy/easy/very easy)
Does it raise significant regulatory concerns (privacy, explainability, ability to supervise/contest (human in the loop), issues of legal authority/competence)(1–5)
Expected integration/ease of use/length of training time(1–5)
Team (not sure this is necessarily relevant)
Are the members of the team qualified to address the problem, on all its angles?(1–5: no/not the best/OK/really good/nearly perfect)
Is this a good team to continue to work with going forward?(1–5: no/not really/reasonable/a relatively good team/A well-diversified in terms of expertise and has experience working with the government)
Presentation
Clarity of presentation(1–5: No/reasonable/pretty good/good/very good)
Comprehensive: addresses all the important points(1–5: No/reasonable/pretty good/good/very good)
Responsiveness to questions(1–5: No/reasonable/pretty good/good/very good)
Overall Assessment(1–5: Minor/small/medium/high/extremely high)
Overall Assessment: (1–5)(1–5: Only a minimal portion/a small segment/moderate/a significant chunk/nearly the entire problem)

Appendix C. The Participants Post-Datathon Survey

Questions 2, 3, 10, 11, 20, 21, 25–28, and 32–36 were taken from Braune (2021).
The participant survey extends that questionnaire and includes 37 questions that gather feedback regarding: their background (three questions); the registration and selection process (four); the Datathon organization (five); the quality of the virtual machine environment, data, and tools (seven); mentoring (three); judging (two); interest in pursuing the project further (five): trust (tw): and general questions (six).
Background data
1.
Which sector do you belong to? Please check all that apply (high-tech industry, healthcare industry, academia–data science, academia–healthcare, public sector, local government, other–specify)—check all that apply
2.
Was this the first hackathon you have ever attended? (yes/no)
3.
Have you ever participated in an online/remote hackathon? (yes/no)
The Hackathon experience
a.
Registrations and selection process
4.
Did you register as a group or as an individual? (group/individual)
5.
How satisfied were you with the selection process? (Likert scale from 1 to 5, with 1 being the lowest score)
6.
How did you hear about the Hackathon? (Social networks, Media, Friends, Colleagues, Ministry of health publication, other–specify).
7.
Anything else you’d like to add about the registration and selection process? Comments (box for free text)
b.
Organization
8.
How satisfied were you with the process of team formation? (Likert scale from 1 to 5, with 1 being the lowest score)
9.
How did you like the setup and structure of the hackathon? (Likert scale from 1 to 5, with 1 being the lowest score)
10.
Were the two daily Status Updates a useful substitute for in-person meetings? (Likert scale from 1 to 5, with 1 being the lowest score)
11.
Did you feel like your needs and questions were met by the organizing team? (Likert scale from 1 to 5, with 1 being the lowest score)
12.
Anything else you’d like to add about the organization of the hackathon? (free-text answer)
c.
Quality of environment, data, and tools
13.
Have you worked with the publicly-shared government covid data before? yes/no
14.
The Hackathon relied on a virtual machine environment, for security and privacy reasons. How adequate was the environment? Likert scale from 1 to 5, with 1 being the lowest score).
14b. Regarding the previous question, what changes would you make, if any? (open text).
  • How satisfied were you from the data supplied? (Likert scale from 1 to 5, with 1 being the lowest score)
15b. What data was missing? (free-text answer)
16.
How satisfied were you from the data science tools supplied? (Likert scale from 1 to 5, with 1 being the lowest score)
16b. What data science tools were missing? (free-text answer)
17.
How satisfied were you from the presentation tools supplied? (Likert scale from 1 to 5, with 1 being the lowest score)
18.
Did you use the Slack? yes/no.
18b. If so, how satisfied were you from Slack and its usage? (Likert scale from 1 to 5, with 1 being the lowest score)
19.
Anything else you’d like to add about the quality of virtual machine environment, data and tools ?
d.
Mentoring
20.
How helpful were the sessions with the mentors? (Likert scale from 1 to 5, with 1 being the lowest score)
21.
In what areas did you gain new insights during the mentor and coaching sessions? (free text)
22.
Anything else you’d like to add about mentoring? (free text)
e.
Judging
23.
Did you feel that the judging was adequate? (Likert scale from 1 to 5, with 1 being the lowest score)
24.
Anything else you’d like to add regarding judging? (free text)
f.
Interest in pursuing the project further
25.
How would you rate your confidence to start your own venture in healthcare, or digital health research project before the hackathon? (Likert scale from 1 to 5, with 1 being the lowest score)
26.
How would you rate your confidence to start your own venture in healthcare, or digital health research project after the hackathon? (Likert scale from 1 to 5, with 1 being the lowest score)
27.
How likely is it that you will keep working on the idea you have developed during the Hackathon? (Likert scale from 1 to 5, with 1 being the lowest score)
28.
Would you have started working on your project without this hackathon? (yes/no)
If yes: Has the hackathon enabled you to progress faster? And how? (free-text answer)
If no: Why not? (free-text answer)
29.
Anything else you’d like to add about your interest in pursuing the project further? (free-text answer)
g.
Trust
30.
To what extent did the Hackathon increase your trust in the willingness of the government to share data and collaborate with other sectors? (Likert scale from 1 to 5, with 1 being the lowest score)
31.
Anything else you’d like to add regarding community, Participation and Trust?
h.
general
32.
What did you like about this hackathon (that is, which features do you think should be kept for future Hackathons)? (free-text answer)
33.
What did you not like about this hackathon (that is, what do you think should be changed in future Hackathons)? (free-text answer)
34.
Do you think a longer hackathon would be an advantage? (Likert scale from 1 to 5, with 1 being the lowest score)
35.
What aspects of an in-person hackathon did you most miss in an online/remote hackathon? (Likert scale from 1 to 5, with 1 being the lowest score)
Physical presence of organizers
Physical presence of the team
Physical presence of mentors
Keynotes and panel events
Food
36.
How important do you think that the following aspects are important to creating a fun atmosphere? (Likert scale from 1 to 5, with 1 being the lowest score)
T-shirts
Nia physical exercise/mindfulness workout
37.
Anything else you’d like to add? (free-text answer)

Appendix D. The Mentors Post-Datathon Survey

Questions 1, 1b, 3, 4, 4b, 5, and 5b were taken from Braune (2021).
Questions were added to address the mentors’ opinion regarding their interaction with the organizers, and the communication tools provided. Additional questions concerned the specific aims of the Datathon, including community building, and the mentor’s interests in working with the teams further.
1.
Overall, how would you rate your mentoring session? Do you feel that this mentoring session has increased the quality, feasibility, and impact of the projects that you had advised? (Likert scale from 1 to 5, with 1 being the lowest score)
1b. Comments regarding the mentoring session (free-text answer)
2.
How satisfied are you with the team’s response to your suggestions? (Likert scale from 1 to 5, with 1 being the lowest score)
2b. Please elaborate (free-text answer)
3.
Was it easy to communicate about scheduling the session with the team? (yes/no)
4.
Did you gather new insights during the session? (Likert scale from 1 to 5, with 1 being the lowest score)
4b. Please elaborate (free-text answer)
5.
How would you evaluate your experience in an online-only hackathon vs. an in-person event? (Likert scale of 1 to 5, where 1 means Very different and 5 means Completely identical)
5b. Please share your insights regarding advantages and disadvantages of the on-line
experience (free-text answer)
6.
How many groups did you advise? (Number)
7.
To what degree were you satisfied with the pre-Hackathon meeting with the organizers? Were the challenges explained properly? Was your role clear? Did you feel your suggestions were taken into account? (Likert scale from 1 to 5, with 1 being the lowest score)
7b. Please elaborate (free-text answer)
8.
To what degree was Slack helpful? (Likert scale from 1 to 5, with 1 being the lowest score)
9.
What did you like about this hackathon (that is, which features do you think should be kept for future Hackathons)? (free-text answer)
10.
What did you not like about this hackathon (that is, what do you think should be changed in future Hackathons)? (free-text answer)
11.
In your opinion, what is the main contribution of mentoring to participating groups? (free-text answer)
12.
Mentoring remotely, via digital tools, is different than physical, face-to-face conversations. To what degree did this difference impact the quality of the mentoring you provided? (Likert scale from 1 to 5, with 1 being the lowest score)
13b. Regarding the previous question, please elaborate (free-text answer)
13.
Anything else you’d like to add? (free-text answer)

Appendix E

Table A3. Communication between Team Members, Mentors, and the Organizing Committee Via Slack.
Channel NameTotal No. Messages Posted on ChannelNo. of Questions/Posts by TeamsNo. of Teams Who Posted on ChannelNo. of Answers/Announcements by OrganizersNo. of Answers/Announcements by MentorsNo. of Mentors Who Used the Channel
General Datathon Channel24994131094610
Help desk33318818135100
Privacy511111
Challenge Vaccine27104 (of 6)1433
Challenge Young Population38134 (of 5)1962
Challenge Untested Population63297 (of 7)20142
Mentors public1334212246730
Mentors private51NANA203116
Organizers11NANA11NANA
Total of all channels9103775935317864
Cells in green denote high usage of Slack; yellow, moderate usage; red, low usage.

Appendix F. The Finalists: Teams and Their Projects

Appendix F.1. Challenge 1: Immunization Strategy

  • Team No.: 1.5
Composition: Team of four biostatistics graduate students from the School of Public Health at UoH
Prior experience with COVID-19 data: none
No. of Mentors sought: 3
Project title: Characterizing the populations that drop out after the first immunization
Data science methods and tools used: (score 2.6). Descriptive statistics
Main insights:
-
Analyze data from the past 50 days of 2.8M people who had their first immunization over 40 days before.
-
0.7% of the people who took the first dose of the vaccine were not vaccinated within 40 days. Given that they are to be immunized after 21 days, these are dropouts.
-
Certain sectors have a higher dropout rate: ages 20–29 (2.5%, with men dropping out more than women in all sectors)
-
The Arab and the secular population behave similarly, however dropout rates are higher in the Arab population
-
The ultra-Orthodox Jewish population behaves differently—the dropout rate increases at ages 40–60.
Potential impact score (out of 5): 3.3
Innovation score (out of 5): 2.3
Ease of implementation (regulatory aspects) score (out of 5): 3.9
Rank of the project by judges: 4–6
  • Team no.: 1.6
Composition: Mixed group: two from two small companies, one engineering student, one experienced person from a local municipality
Prior experience with COVID-19 data: none
No. of Mentors sought: 2
Project title: Vaccine protection using a leaky model
Data science methods and tools used: (score 3.7) Python (pandas library)
-
Visualization using a heat map matrix. Rows represent different age groups and columns are dates.
-
Value is the relative %positive cases out of vaccinated population in age group
Main insights: Vaccine’s protection depends on: (1) viral load = infection level in the community (time) x personal social distancing behavior (sector-dependent), and (2) your age (reflecting the functioning of your immune system. Based on the heat map, they developed a calculator that would allow individuals and decision makers to make decisions on behavior (meeting people vs. social distancing)
Potential impact score (out of 5): 3.2
Innovation score (out of 5): 3.4
Ease of implementation (regulatory aspects) score (out of 5): 2.9
Rank of the project by judges: 4–6

Appendix F.2. Challenge 2: Young Population

  • Team no.: 2.1
Composition: Six members of the aerospace industry
Prior experience with COVID-19 data: Created their model ahead of time based on another COVID-19 dataset
No. of Mentors sought: 2
Project title: How can the isolation period in the young population be shortened?
Data science methods and tools used: (score: 3.2)
-
Simple probabilistic model of accumulated infection probability given no. of days from infection and size of group.
-
Model not tested because data from MoH did not have information regarding children in same preschool.
-
This could be obtained by joining with Ministry of Education data
Main insights: Instead of testing whether an individual was infected, determine in a group if an infection is inert
Potential impact score (out of 5): 4.6
Innovation score (out of 5): 3.8
Ease of implementation (regulatory aspects) score (out of 5): 2.9
Rank of the project by judges: 2
  • Team no.: 2.3
Composition: Mixed group: two from a high-tech company, two from a center that creates online maps of Israel, one clinician from a hospital
Prior experience with COVID-19 data: Researched projects of winning teams at other hackathons, created models based on publicly available COVID-19 data
No. of Mentors sought: 4
Project title: Policies for children in a vaccinated reality
Data science methods and tools used: (score: 4.0)
-
AdaBoost. Training on data from Oxford dataset, Data.gov, and Owide dataset
Main insights:
-
%Children in the COVID-19-positive population is rising as the vaccine is working on vaccinated adults
-
Shutting down schools will not solve the morbidity but will just delay it
-
Adults around children must be vaccinated to protect themselves and children
-
Removing vaccinated adults from demographic data allows use of historical data for predictions
Potential impact score (out of 5): 4.1
Innovation score (out of 5): 3.7
Ease of implementation (regulatory aspects) score (out of 5): 3.3
Rank of the project by judges: 1

Appendix F.3. Challenge 3: COVID-19 Test Compliance

  • Team no.: 3.4
Composition: Team of seven; online booking company—data scientists, software developers, marketing experts
Prior experience with COVID-19 data: No experience with COVID-19 data but prior experience with booking incentives and uplifting
No. of Mentors sought: 5
Project title: Targeted testing and incentive allocation
Data science methods and tools used: (score: 3.8) Uplift modeling [11]
Main insights:
-
Incentivize relevant people to get tested
-
Collect data on incentives assignment and response
-
Build personalization model and target population groups
-
Generalize for other use cases (e.g., immunizations)
Potential impact score (out of 5): 3.9
Innovation score (out of 5): 3.8
Ease of implementation (regulatory aspects) score (out of 5): 3.0
Rank of the project by judges: 3
  • Team no.: 3.6
Composition: Mixed: Four members that all registered individually., three from health care, and one data scientist
Prior experience with COVID-19 data: No previous work with COVID-19 datasets
No. of Mentors sought: 2
Project title: Overcoming biased data availability in decision-making
Data science methods and tools used: (score: 3.2) AdaBoost, SHARP
Main insights:
-
With most of the population immunized, there is a new phase with a lack of data because infected immunized people are not tested because they are asymptomatic, and unvaccinated individuals refrain from getting tested due to fear of being blamed for infecting other people. In addition, new variants will emerge. To predict morbidity, hospitalizations, and positive cases based on data available now, and 3, 7, 14, 28 days ago, to prevent bias of weekends, a model was built to predict deaths, new hospitalizations, and new infections per agas (zip code) and locality. The model performed well.
-
The model could be improved by adding data that was not available in the Datathon: serology results, data of localities, and areas with fewer than 200 inhabitants
Potential impact score (out of 5): 3.1
Innovation score (out of 5): 2.4
Ease of implementation (regulatory aspects) score (out of 5): 3.2
Rank of the project by judges: 4–6

References

  1. Ministry of Health. DataGov Israeli Government Data Set Archive [Hebrew]. Available online: https://data.gov.il/dataset/?q=COVID (accessed on 30 August 2021).
  2. Ministry of Health. Israel COVID-19 Data Tracker. Available online: https://www.gov.il/en/departments/guides/information-corona (accessed on 9 May 2021).
  3. Aboab, J.; Celi, L.A.; Charlton, P.; Feng, M.; Ghassemi, M.; Marshall, D.C.; Mayaud, L.; Naumann, T.; McCague, N.; Paik, K.E.; et al. A “datathon” model to support cross-disciplinary collaboration. Sci. Transl. Med. 2016, 8, 333ps8. [Google Scholar] [CrossRef] [Green Version]
  4. Luo, E.M.; Newman, S.; Amat, M.; Charpignon, M.-L.; Duralde, E.R.; Jain, S.; Kaufman, A.R.; Korolev, I.; Lai, Y.; Lam, B.D.; et al. MIT COVID-19 Datathon: Data without boundaries. BMJ Innov. 2021, 7, 231–234. [Google Scholar] [CrossRef]
  5. Braune, K.; Rojas, P.-D.; Hofferbert, J.; Sosa, A.V.; Lebedev, A.; Balzer, F.; Thun, S.; Lieber, S.; Kirchberger, V.; Poncette, A.-S. Interdisciplinary Online Hackathons as an Approach to Combat the COVID-19 Pandemic: Case Study. J. Med. Internet Res. 2021, 23, e25283. [Google Scholar] [CrossRef]
  6. Bertello, A.; Bogers, M.L.; De Bernardi, P. Open innovation in the face of the COVID-19 grand challenge: Insights from the Pan-European hackathon ‘EUvsVirus’. R&D Manag. 2021. [Google Scholar] [CrossRef]
  7. Bolton, W.S.; Ng, S.; Lam, A.; Kinch, J.; Parchment, V.; Foster, W.P.; Zimmermann, M.R.; Teh, J.Q.; Simpson, A.; Sharma, K.; et al. Virtual hackathon to tackle COVID-19 unmet needs. BMJ Innov. 2021, 7, 284–287. [Google Scholar] [CrossRef]
  8. Brereton, B. EUvsVirus Hackathon project: A case study from a mentor’s perspective. All Irel. J. High. Educ. 2020, 12, 1–8. Available online: https://ojs.aishe.org/index.php/aishe-j/article/download/467/805 (accessed on 30 April 2021).
  9. Haesler, S.; Schmid, S.; Reuter, C. Crisis volunteering nerds: Three months after COVID-19 hackathon# WirVsVirus. In Proceedings of the 22nd International Conference on Human-Computer Interaction with Mobile Devices and Services, Oldenburg, Germany, 5–8 October 2020; pp. 1–5. [Google Scholar] [CrossRef]
  10. Kinder, F.; Harvey, A. Covid-19: The medical students responding to the pandemic. BMJ 2020, 369, m2160. [Google Scholar] [CrossRef] [PubMed]
  11. Teinemaa, I.; Albert, J.; Goldenberg, D. Uplift Modeling: From Causal Inference to Personalization. WebConf 2021. Available online: https://www.researchgate.net/profile/Dmitri-Goldenberg/publication/349762341_Uplift_Modeling_from_Causal_Inference_to_Personalization/links/60409ccca6fdcc9c780f8b37/Uplift-Modeling-from-Causal-Inference-to-Personalization.pdf (accessed on 30 April 2021).
  12. Temiz, S. Open Innovation via Crowdsourcing: A Digital Only Hackathon Case Study from Sweden. J. Open Innov. Technol. Mark. Complex. 2021, 7, 39. [Google Scholar] [CrossRef]
  13. Ministry of Health. Datathon landing page. Available online: https://govextra.gov.il/ministry-of-health/covid19-challenge/home (accessed on 9 May 2021).
  14. Patrucco, A.S.; Trabucchi, D.; Frattini, F.; Lynch, J. The impact of Covid-19 on innovation policies promoting Open Innovation. R&D Manag. 2021. [Google Scholar] [CrossRef]
  15. Yun, J.J.; Kim, D.; Yan, M.-R. Open Innovation Engineering—Preliminary Study on New Entrance of Technology to Market. Electronics 2020, 9, 791. [Google Scholar] [CrossRef]
  16. Yun, J.J.; Zhao, X.; Park, K.; Del Gaudio, G.; Sadoi, Y. New dominant design and knowledge management; a reversed U curve with long head and tail. Knowl. Manag. Res. Pract. 2021, 1–15. [Google Scholar] [CrossRef]
  17. Hale, T.; Webster, S.; Petherick, A.; Phillips, T.; Kira, B. Oxford COVID-19 government response tracker (OxCGRT). Available online: https://www.bsg.ox.ac.uk/research/research-projects/covid-19-government-response-tracker (accessed on 24 September 2021).
  18. Guidotti, E.; Ardia, D. COVID-19 Data Hub. J. Open Source Softw. 2020, 5, 2376. [Google Scholar] [CrossRef]
  19. Scholl, H.J. Profiling the EG Research Community and Its Core. In Proceedings of the Programming Languages and Systems; Springer Science and Business Media LLC: Berlin/Heidelberg, Germany, 2009; pp. 1–12. [Google Scholar]
  20. Dwivedi, Y. An analysis of e-Government research published inTransforming Government: People, Process and Policy(TGPPP). Transform. Gov. People, Process. Policy 2009, 3, 7–15. [Google Scholar] [CrossRef]
  21. Chesbrough, H. To recover faster from Covid-19, open up: Managerial implications from an open innovation perspective. Ind. Mark. Manag. 2020, 88, 410–413. [Google Scholar] [CrossRef]
  22. Yun, J.J.; Jeong, E.; Zhao, X.; Hahm, S.D.; Kim, K. Collective Intelligence: An Emerging World in Open Innovation. Sustainability 2019, 11, 4495. [Google Scholar] [CrossRef] [Green Version]
  23. Budge, E.J.; Tsoti, S.M.; Howgate, D.J.; Sivakumar, S.; Jalali, M. Collective intelligence for translational medicine: Crowdsourcing insights and innovation from an interdisciplinary biomedical research community. Ann. Med. 2015, 47, 570–575. [Google Scholar] [CrossRef] [Green Version]
  24. Khan, G.F.; Park, H.W. The e-government research domain: A triple helix network analysis of collaboration at the regional, country, and institutional levels. Gov. Inf. Q. 2013, 30, 182–193. [Google Scholar] [CrossRef]
  25. Hardy, C.A.; Williams, S.P. Assembling E-Government Research Designs: A Transdisciplinary View and Interactive Approach. Public Adm. Rev. 2011, 71, 405–413. [Google Scholar] [CrossRef]
  26. Belli, L.; Zingales, N. Data protection and social emergency in Latin America: COVID-19, a stress test for democracy, innovation, and regulation. Int. Data Priv. Law 2021, 11, 1–2. [Google Scholar] [CrossRef]
  27. Nho, H.-J. Research ethics education in Korea for overcoming culture and value system differences. J. Open Innov. Technol. Mark. Complex. 2016, 2, 4–11. [Google Scholar] [CrossRef] [Green Version]
  28. Bican, P.M.; Guderian, C.C.; Ringbeck, A. Managing knowledge in open innovation processes: An intellectual property perspective. J. Knowl. Manag. 2017, 21, 1384–1405. [Google Scholar] [CrossRef]
  29. Liegl, M.; Boden, A.; Büscher, M.; Oliphant, R.; Kerasidou, X. Designing for ethical innovation: A case study on ELSI co-design in emergency. Int. J. Human-Computer Stud. 2016, 95, 80–95. [Google Scholar] [CrossRef] [Green Version]
  30. Temiz, S.; Broo, D.G. Open Innovation Initiatives to Tackle COVID-19 Crises: Imposter Open Innovation and Openness in Data. IEEE Eng. Manag. Rev. 2020, 48, 46–54. [Google Scholar] [CrossRef]
  31. Campana, E.F.; Di Piazza, M.C.; Di Summa, M.; Ferro, E.; Massoli, P.; Sacco, M.; Soldovieri, F.; Vaglieco, B.M.; Bassan, N.; Castino, A.; et al. CNR–Fincantieri Joint Projects: A Successful Example of Collaboration between Research and Industry Based on the Open Innovation Approach. J. Open Innov. Technol. Mark. Complex. 2020, 6, 15. [Google Scholar] [CrossRef] [Green Version]
  32. Dawes, S.S.; Helbig, N.; Cook, M. Promoting international digital government research collaboration: An experiment in community building. In Proceedings of the 12th Annual International Digital Government Research Conference: Digital Government Innovation in Challenging Times, College Park, MD, USA, 12 June 2011; pp. 54–63. [Google Scholar]
  33. Sayogo, D.S.; Zhang, J.; Pardo, T.A. Evaluating the structure of cross-boundary digital government research collaboration: A social network approach. In Proceedings of the 12th annual international digital government research conference: Digital government innovation in challenging Times, College Park, MD, USA, 12 June 2011; pp. 64–73. [Google Scholar]
  34. Schindler, H.S.; Fisher, P.A.; Shonkoff, J.P. From Innovation to Impact at Scale: Lessons Learned From a Cluster of Research-Community Partnerships. Child. Dev. 2017, 88, 1435–1446. [Google Scholar] [CrossRef] [PubMed]
  35. Yun, J.J.; Yang, J.; Park, K. Open innovation to business model: New perspective to connect between technology and market. Sci. Technol. Soc. 2016, 21, 324–348. [Google Scholar] [CrossRef]
  36. Ross, C.; Spector, O.; Avgil-Tsadok, M.; Weiss, Y.; Barnea, R. BNT162b2 mRNA vaccinations in Israel: Understanding the impact and improving the vaccination policies by redefining the immunized population. Available online: https://www.medrxiv.org/content/10.1101/2021.06.08.21258471v1.full.pdf (accessed on 20 September 2021).
  37. Mentornity. Available online: http://www.mentornity.com/ (accessed on 21 April 2021).
  38. Cohen, O.; Goldberg, A.; Lahad, M.; Aharonson-Daniel, L. Building resilience: The relationship between information provided by municipal authorities during emergency situations and community resilience. Technol. Forecast. Soc. Chang. 2017, 121, 119–125. [Google Scholar] [CrossRef]
  39. Rivera, F.I.; Kapucu, N. Communicating Resilience. In Disaster Vulnerability, Hazards and Resilience; Springer Science and Business Media LLC: Cham, Switzerland, 2015; pp. 97–120. [Google Scholar]
  40. Longstaff, P.H.; Yang, S.-U. Communication Management and Trust: Their Role in Building Resilience to “Surprises” Such as Natural Disasters, Pandemic Flu, and Terrorism. Ecol. Soc. 2008, 13, 5751. [Google Scholar] [CrossRef]
  41. Castleden, M.; McKee, M.; Murray, V.; Leonardi, G. Resilience thinking in health protection. J. Public Health 2011, 33, 369–377. [Google Scholar] [CrossRef]
  42. Mizrahi, S.; Vigoda-Gadot, E.; Cohen, N. How Well Do They Manage a Crisis? The Government’s Effectiveness During the COVID-19 Pandemic. Public Adm. Rev. 2021. [Google Scholar] [CrossRef]
  43. Gozgor, G. Global Evidence on the Determinants of Public Trust in Governments during the COVID-19. Appl. Res. Qual. Life 2021, 1–20. [Google Scholar] [CrossRef]
Figure 1. Process of Datathon organization.
Joitmc 07 00208 g001
Table 1. Important regulatory events in handling COVID-19 pandemic in Israel close to the start of the Datathon.
Event
* Start of COVID-19 wave
* Immunization of citizens ≥60 years
* Third lockdown without closing schools
** Shifting the school system to remote education
* Immunization of citizens ≥25 years
* Third wave starts to diminish
*** Returning preschools and grades K-4 to operate in-person
*** Returning also grades 5–6 and 11–12 in “green” localities to operate in-person
* Religious holiday (gatherings restricted)
>90% of the older population immunized with 1 dose; 5000 new cases/day, 664 seriously ill, 1225 hospitalized. Size of population of Israel 9.053 million
Color codes: * Relevant event or regulation change; ** Shifting the school system to remote education; *** Returning the school system to operate in-person.
Table 2. Steps in the Datathon organization (and responsible partners). Recommended new steps and changes based on lessons learned are shown with ** in front of them.
TimeTask
(2–6 months) pre-eventProject inception by government (MoH) with multiple stakeholders.
Recruitment of organizing committee.
MoH team thought of six general topics; interviewed stakeholders from industry, academia, and government; and ranked topic importance considering (a) significance, (b) data availability, and (c) ability to deidentify data that would allow interesting analyses to be conducted.
(8–9 weeks) pre-eventPreparation of privacy-preserving standardized datasets (MoH with advice from UoH).
Preparation of Datathon website and publicity via MoH spokesperson, social media, and mailing lists related to AI in healthcare (MoH, InnovA).
Preparation of registration Google Forms for participants and mentors (UoH). Participant registration forms included name, email, cellular phone number, professional link (e.g., LinkedIn), company/institution, position/field of studies, professional expertise (health care practitioner, health manager, product developer, business entrepreneur, engineer, statistician, data scientist, law/policy professional, other + indication of the number of years of experience), whether the registrant is part of a team, which challenge the registrant is interested in, suggestions for data needed for the challenge, whether any organization has ever disqualified their access to any database or data, and, if so, under what circumstances, and commitment to continue into an acceleration process with the Datathon product/idea.
Mentor registration forms included name, email, cellular phone number, professional link (e.g., LinkedIn), company/institution, position/field of studies, head photo, mentoring expertise (all that apply from data science, clinical/epidemiology, law, and presentation), availability during the scheduled four mentoring sessions (check all that apply), and additional comments.
List of mentors and judges (data science, law, epidemiology, and presentation) led by UoH and approved by MoH.
Preparation of the terms and conditions for participation (UoH).
** (at least 6 weeks recommended)
(4–5 weeks) pre-event
** Publicizing the event and opening registration for at least 3 weeks recommended.
** New emphasis: disclose the limitations on the number of participants, and the lack of budget for prizes and food.
** (3–4 weeks) pre-event
(2–4 weeks) pre-event
(3–4 weeks) pre-event
(2–3 weeks) pre-event
Preparation of the judging criteria and tables for projects rating (UoH); the criteria related to the project’s importance and potential impact (15%), methodology (25%), innovation (20%), ease of implementation and compliance with regulatory regimes (15%), potential for pursuing further R&D with the team (5%), clarity of the presentation (5%), and overall impression (15%).
Preparation of the detailed event schedule (UoH).
Scheduling mentors for mentoring sessions and judges for the challenge judging and final judging sessions (UoH).
Design of the tables and their presentation to stakeholders to make sure that the data would be valuable for analysis (MoH).
Updates and first iterations of data queries; operationalization of first data deidentification scheme (MoH).
** (2–3 weeks) pre-event
2 weeks pre-event
Selection process (MoH).
** Matchmaking event for participants seeking teams (MoH).
Final formation of teams (MoH).
Creating of tutorials on the data and virtual machine environments (MoH).
Setup of communication routes: Slack channels and Zoom rooms (UoH).
** New step: Pilot testing with one group per challenge to ensure the quality of the dataset and the virtual research environments.
** Preparation of a plan for publicity over public media.
1 week pre-eventThree Zoom workshops with mentors, judges, and participants (i.e., everyone) to explain the challenges and datasets along with the data dictionary of each dataset, with variable names and explanations; Q&A,
** Address ethical considerations, and answer questions; host a workshop with mentors to cover realistic expectations.
** Testing the participants’ ability to join the data environments and communication in Slack (everyone).
** Q&A via Slack (MoH + UoH).
Additional iterations of data queries and operationalization of the complete deidentification scheme following data inspection (MoH).
Production of the final datasets using the formulated queries and the deidentification scheme and depositing them in the virtual research environment (MoH).
The Datathon itselfOpening and Closing events led by InnovA and MoH.
Technical support for virtual environments 24/7 (MoH, Amazon)
** Installation of requested software updates every 24 h.
Monitoring for privacy issues (MoH, UoH).
General technical support (UoH).
Communication via Slack and Zoom (led by UoH).
** Communication with mentors via Mentornity.
** Status updates should include some suggestions from mentors that may be helpful for a given challenge; teams should be made aware ahead of time that they would be requested to present themselves during the status update meetings to support community building.
Moderators for judging sessions (UoH).
** Communicating feedback from judges to the teams.
Sending T-shirts to participants (UoH).
1 week after the eventParticipants and mentors survey (led by UoH).
Table 3. Datathon schedule.
Day 1Day 2Day 3
13:00–14:00 Opening (Zoom)08:00–08:30 Nia workout (Zoom)
09:00–10:00 Status update (Zoom)
10:00–11:00 Presentation preparation workshop (Zoom)
08:00–08:30 Nia workout (Zoom)
09:00–09:30 Status update (Zoom)
14:00–15:30 Teams work without mentors11:00–13:00 Mentoring session (6 data science, 2 epidemiology, 1 law) Zoom09:30–13:00 Mentoring session (2 data science, 1 epidemiology, 1 law, 3 presentation) Zoom
Teams work and could consult with mentors
15:30–16:30 Introductions to the datasets and Q&A (20 min per challenge, Zoom)15:00–18:00 Mentoring session (6 data science, 2 epidemiology, 1 law, 2 presentation *) Zoom
* presentation mentors were available from 16:00–19:00
Teams work and could consult with mentors
13:00 Presentation submission
13:30–15:30 Semi-finals judging (1 room per challenge)
15:30–16:00 Judges select 2 finalists per challenge
16:30–19:00 Mentoring session (6 data science, 2 epidemiology, 1 law) Zoom
Teams work and could consult with mentors
16:00–18:30 Finals and closing event
19:30–20:30 Status update (Zoom)19:30–20:30 Status update (Zoom)
Table 4. Participants’ responses to survey questions regarding satisfaction of the Datathon. A bar chart on the right visualizes the responses.
Question:
How Satisfied Were You from the
1–Highly Unsatisfied2–Not Satisfied3–Neutral4–Satisfied5–Highly SatisfiedChart
1 2 3 4 5
Participant selection process01636 Joitmc 07 00208 i001
Team formation process01617 Joitmc 07 00208 i002
Needs addressed by the organizers12356 Joitmc 07 00208 i003
Mentoring sessions01195 Joitmc 07 00208 i004
Judging12256 Joitmc 07 00208 i005
Data science tools supplied13066 Joitmc 07 00208 i006
Presentation tools supplied22455 Joitmc 07 00208 i007
Slack00368 Joitmc 07 00208 i008
Data supplied24353 Joitmc 07 00208 i009
Adequacy of the virtual environment42515 Joitmc 07 00208 i010
Table 5. Details on the three top projects.
Project 2.3. Policies for Children in a Vaccinated Reality
The team envisioned a decision-making tool for individuals, school principals, and city mayors. If given information on the COVID-19-related morbidity (%positive, %deaths), the demographics (population density, median age, GDP, socioeconomic level, reproduction rate), the vaccination rate (the number vaccinated with a first dose and the number vaccinated with a second dose), and a selected policy, then the model would predict the projected morbidity. Thus, citizens living in a certain statistical region could test different behaviors (e.g., how many people they would like to meet) and view the implications, and decision-makers could obtain a recommendation on the best policy. The policies may be related to schools, labor, economic aid, hygiene, flights, and gatherings. The team developed the model using AdaBoost from the Oxford dataset of 250 countries and were able to make accurate predictions using the data.gov dataset for the first 20 days of the pandemic.
Project 2.1 How can the isolation period in the young population be shortened?
Some exposures to the virus do not result in active infections. If an infected individual exposed a group to an infection, then the probability that the infection is inert grows as the number of individuals in the group test negative. Given a level of false negative risk that we are willing to accept, we can easily calculate the size of the subgroup that needs to be tested and the day on which testing should be conducted following exposure. If the group goes to isolation and some members of the subgroup are tested n days after exposure and they are all negative, then the entire group can be released from isolation. Otherwise, they are retested n days later. The exposure announcement often arrives 3–4 days after infection, and by testing five children and getting results while the kids are still at daycare, they might already be isolation-free by the end of the day!
Project 3.4 Targeted testing and incentive allocation
The team had previously developed methods for uplift modeling [11]. Their project related to the use of incentives to increase the probability of an intended behavior, in this case, getting tested for COVID-19. The incentives target the persons that are most likely to generate value from the incentive, i.e., those who are (a) more likely to be positive when tested and (b) would not go to get tested without incentives but are likely to respond to personalized incentives. They therefore target persons who have been found to have had many connections in epidemiological investigations, which the team plans to extend to social centrality. This value is weighted with the probability of testing positive on the first test. Features that predict this include the timing since the beginning of the epidemic, the age of the person, and the locality. They propose to divide a target population into groups, test different incentives, collect data, and build and update a model.
Publisher’s Note: MDPI stays neutral with regard to jurisdictional claims in published maps and institutional affiliations.

