1. Introduction
The ways how organizations innovate experienced fundamental changes in the last two decades. Innovations are considered a cornerstone of achieving and maintaining competitive advantage [
1,
2]. Authors such as those of [
3] highlight that many organizations are compelled to shift their focus from exclusive internal research and development (R&D) to cooperation with external partners. This understanding is rooted in the open innovation paradigm coined by Chesbrough [
4]. The concept of open innovation assumes that knowledge is widely distributed, and organizations seeking external knowledge for their own innovation purposes engage in open innovation practices [
5,
6]. This new paradigm demands new ways of organizing internal processes and has led to the emergence of a more open and collaborative innovation mode in which collaboration between companies, individuals and public agencies is encouraged in the creation of new products and services. This concept has implicit changes in organizations, no longer considering innovation as an individual act but assuming that it depends on the exchange of knowledge flows between various external sources to enhance the value of innovation [
7]. From this perspective, it is a challenge for organizations to coordinate and integrate internal and external knowledge and skills [
8]. In this context and based on the difficulties in hiring people with disabilities, the open innovation process of the human resources departments of three multi-national companies, entities and academic institutions, which is the focus of this work, arises.
Employment is one of the aspects that most influences our lives. It can affect our relationships and even our health. It is one of the cornerstones of society and one of the main activities in industrialized societies [
9,
10]. Work contributes to economic growth and to the social welfare of the community and society, and it also organizes people’s lives; but furthermore, it is a factor of social justice and cohesion that provides for people’s participation, the distribution of wealth and the guarantee of rights. This reality materializes once a person starts working and takes part in all of a company’s occupational and social activities [
11].
However, one of the groups of people who find it the hardest to access a job is that of people with disabilities [
12]. In Spain, their labour participation rate in 2019 was 43.7 points lower than that of the non-disabled population, and the employment rate of people with disabilities was 25.9% compared to 66.9% for non-disabled people [
13]. It is important to highlight that these rates worsen during crisis periods [
14,
15], as demonstrated in previous eras and during the pandemic brought about by COVID-19. However, these rates improve when people with a disability reach higher education.
In Spain, as in other countries [
16,
17], the number of students with disabilities has increased in recent years, although this group of students continues to represent a relatively low percentage overall. Comparing enrolment data, the figure for this group in the 2005–2006 academic year was 7247 individuals [
18], rising to 22,818 by the 2019–2020 academic year [
19]. The data concerning the total number of people who access and complete university studies is around 19.9%; in contrast, only 7% of students with disabilities have a university degree. Thus, the representation of students with disabilities at university drops to 1.5% of all university students. However, data from Spain’s National Statistics Institute [
13] indicate that, although the labour participation rate is substantially higher among people without disabilities, this figure rises in both cases (people with and without disabilities) the higher the level of education. This demonstrates that university students with disabilities have a greater capacity to adapt to the labour market [
20], making university the most suitable environment for acquiring knowledge and training to attain the full integration of people with disabilities in society [
13,
21,
22].
However, although legislative developments have contributed to improving access to employment for people with disabilities, significant barriers still exist [
23], such as employers’ attitudes in hiring process of workers or internships [
24,
25]. One of the main proposals of this paper addresses this situation. We find ourselves in a situation where, on the one hand, participants’ experience is limited and, on the other, barriers can be erected in hiring processes by employers, who, unaware of the factors surrounding disability, may fail to consider the possibility of hiring a person with a disability if there are candidates who match the profile of the offered position or internship who have not disclosed any disability [
26].
This was the basis for coming up with the idea of establishing open innovation project for three companies that were willing to provide job opportunities in their business in the form of remunerated internships directed at university students with disabilities.
Studies such as [
27] show how, based on university programs that promote the development of vocational maturity, higher rates of employability are achieved, resulting in a greater probability of gaining access to a job or an internship in a company. Both the capacity to look for a job or an internship and the capacity to obtain them, are factors that can be measured as indicators of the relevant level of professional maturity for employment.
Vocational maturity is a concept that has been popularised by Super for several decades. He defines it as the readiness to cope with the vocational tasks one is confronted with or about to be confronted with, compared to others at the same time of life and facing the same developmental tasks [
28].
We can say that vocational maturity is the degree to which a person has acquired the knowledge and skills to make realistic and appropriate vocational decisions [
29]; it can also be defined as the ability to negotiate age-appropriate career development tasks. Thus, vocational maturity is acquired as a lifelong process. On the other hand, it is based on empirical evidence, so it is a descriptive term that can be measured and is predictive [
30]. We emphasise this aspect given that the degree of vocational maturity has been related to the work success achieved [
31]. Therefore, a person with high levels of vocational maturity may have more opportunities to obtain and maintain a job [
27].
There are different types of services that, in order to promote the inclusion of people with disabilities in the labour market, provide resources and support for access to and performance of the job. In the case of Spain, this system is called “Employment with support”. When we talk about employment supports for people with disabilities, the concept of typicality or similarity in employment appears, which is understood as the degree to which the characteristics of access to employment, of the job itself (tasks, benefits, etc.) and of the work environment (places, colleagues, etc.) are similar to those of non-disabled co-workers in the same company [
32,
33,
34,
35]. It is defined in terms of four component elements: job acquisition and recruitment, job characteristics, human resource management and social aspects.
In their research, authors of [
36] contribute the need to make processes as typical as possible for workers with disabilities, since the typicality of the processes, both separately and as a whole, appears to be related to higher levels of Quality of Life perceived by the workers in its different components and globally. Quality of life is a multi-dimensional concept, with a large subjective component, which is reflected in a general perception of well-being or satisfaction. One of the models currently most widely accepted by the scientific community is that proposed by Schalock (Schalock 1996; Schalock and Verdugo 2002) [
37,
38].
In its most current development, it includes 24 indicators referring to eight domains representing the core life dimensions of each one.
As with the quality-of-life concept, the quality of working life for people with intellectual disabilities comprises factors and indicators that are equally relevant for the general population [
38]. In terms of the components of the quality of working life of people with disabilities, the most analysed indicator has been job satisfaction.
The characteristics and conditions of a job will partly determine its consequences or effects on individuals and organizations. On this basis, we can say that, depending on the working conditions, the job will provide a greater or lesser degree of satisfaction, particularly regarding the job, per se, but it can also have repercussions on satisfaction with life in general [
39]. Quality of working life increases workers’ participation in solving problems and in work-related decision making [
40].
Based on the relationship established between these concepts, we consider it necessary to carry out an open innovation project in which vocational maturity, typicality in employment and quality of working life are addressed.
The aim is not only to advise during the hiring process but also to ensure that the typicalness of the labour activities carried out during the internships does not differ from that of other company employees, thereby confirming that one of the main barriers to access lies at the very foundation of the process, in other words, in selecting candidates. On a separate note, and estimating that participants will have a high level of vocational maturity and that the job typicalness of results and actions will be similar to that of other employees, we attempt to take it one step further by assessing the concept of quality of working life: an increasingly studied concept but one that has no explanatory models in the field of disability—with the ones that do exist being particularly focused on intellectual disability [
41,
42,
43,
44,
45,
46].
Thus, all these points justify the need for deeper research into quality of work life in the context of disability and, specifically, of university students with disabilities. As a result, in this quantitative study, we aim to: (1) Assess the professional maturity of participants as an indicator of employability. (2) Identify the similarities of the work placement activities of disabled versus non-disabled participants (job typicality) and their possible relationship with quality of work life. (3) Identify the key quality of work life indicators based on participants’ opinions (qualitative evaluation) and replies to the questionnaires (quantitative evaluation). To address these objectives, we use both quantitative and qualitative methods. We hope, moreover, that these studies serve to demonstrate that the perception of labour demands and available resources helps to predict the quality of life and job satisfaction of workers with disabilities. The proposed objectives are formulated according to the following hypotheses:
Hypothesis 1 (H1). Participants will display a high level of vocational maturity. (H1a) No differences will be found in vocational maturity based on gender or severity of the disability.
Hypothesis 2 (H2). Although workers with disabilities will have gained access to a job via non-typical strategies (non-typical recruitment and induction or orientation), they will obtain typical results (performance, social, job characteristics).
Hypothesis 3 (H3). Students will have a positive perception of their quality of work life. That is, there will be a low rating of stressors, role ambiguity, low perception of demands and high perception of resources. There will be no differences in participants’ quality of work life based on gender or severity of the disability. Participants will have a multi-dimensional mental model of quality of work life.
2. Materials and Methods
This section includes the procedure used to implement the open innovation programme, as well as the context in which it was developed. It also includes a detailed description of the participants in the programme, as well as the instruments or questionnaires used.
To obtain university participants with disabilities, we worked with three multi-national companies that include policies to promote the hiring of people with a disability, which, in total, offered 12 internship positions: 4 per company. These agreements are set out in the development of a program of grant-based internships for university students with disabilities integrated into the company’s recruitment system. Depending on the company, participants were accepted who, when gaining access to the program, had a university degree but were pursuing post-graduate studies—therefore, still considered university students—and individuals who had completed their university studies in the previous four years. To recruit participants, we were assisted by the support services of Spanish universities for people with disabilities, which disseminated the call for applicants.
The programs have a minimum duration of 6 months and a maximum of 12, and therefore the questionnaires were sent out one month before the different internships ended in each company. In one of the companies, all participants had to be students at the start of the program. Specifically, they had a university degree and were pursuing another degree or master’s degree. In the rest of the companies, participants could be students and/or graduates with disabilities who had completed their studies in the last four years. It should be noted that the geographic origin of participants extends to all of Spain and that, in the end, students from four different autonomous communities took part. During the internships, participants received monthly follow-up by the disability support service of the collaborating university, and each was assigned a company mentor to ensure the smooth running of the program.
For the participant selection process, depending on the positions offered, the collaborating organization was part of the selection team for each of the companies, guiding the process and acting as an intermediary in the elimination of hiring barriers, in other words, guiding the selection process to make it accessible both at the entry point and throughout. In addition, job descriptions were established for the different positions, and guidelines were provided to address the content of the questions in the candidate selection process so that it was carried out from a holistic perspective and focused on the skills of the interviewees and not their limitations. Lastly, the necessary disability-related advice was provided, both before the selection interview and afterwards. In this way, an accessible, equitable and equal-opportunity selection process was achieved, complemented by the necessary advice on disability matters. As part of the process, the employability maturity interview (EMI) questionnaire was used to confirm that the selected candidates had a high vocational maturity index, providing evidence of the close relationship between vocational maturity and higher level of employability.
As mentioned above, the remaining questionnaires were provided one month before the end of the various internships in the different companies. Regarding the informants on job typicalness, this role corresponded to the mentors assigned to each participant in the companies where they were carrying out their internships. As for the assessment of quality of life, the study required the collaboration of the interns, who received a questionnaire that includes a first section on socio–demographic information, a second on labour issues and a third consisting of two open questions: “What does quality of work life mean to you?” and “Do you have quality of work life? Why?” In this case, participation of those surveyed was also voluntary, and anonymity was guaranteed. The responses were coded by expert raters based on the schema of quality of work life elements included in the assessment questionnaire.
Participants were informed of the study and provided their informed consent.
This study includes the 12 participants selected to take part in the program.
The number of participants is limited by the number of internships participating companies assign to the collaborating organization, which is why the sample cannot be larger. The companies are multi-nationals with over 1000 employees.
The programs are framed within the companies’ social responsibility actions, specifically within the exceptionality measures for the 2% quota of jobs reserved for people with disabilities in companies with more than 50 employees (RD 364/2005, of 8 April, which regulates compliance with the exceptional nature of the reserve quota for workers with disabilities).
The socio–demographic profile of participants is characterized by presenting a disability of a visual type (41.7%), followed by a cognitive disorder due to epilepsy (25%) or agenesis of the upper limbs (16.7%), To a lesser extent, there were persons with neuromuscular limitations (Friedreich’s ataxia) or functional limitations of the lower limbs (8.3%, respectively). The percentage of disability ranged from 33% to 84%, with the average being 63.2% (DT = 18.3). All are aged between 22 and 30 and do not have family responsibilities; 11 are unmarried, and 1 is married or cohabiting with a partner. Ten of the participants live at home with their parents, and two live independently.
With respect to the employment profiles, participants carried out their internships in three different companies, with four participants in each one. As for the departments they worked in, each participant did so in a different one: management, communication, finance, training, hiring and recruitment, accounting, training in new technologies and sales. For three participants (25%), this is their first job; for five of them, their second (41.7%); for one, it is their third job (8.3%); and for three participants (25%), it is at least their fourth job. Eight participants (66.7%) worked half-time, and four (33.5%) worked full-time. More specifically, four of the participants worked 20 h a week, another four worked 25, and the remaining four worked 37 h a week (33.3%), respectively. In terms of the duration of the internships, for seven participants (58.3%), the duration was 6 months; for one (8.3%), 8 months; and for four participants (33.3%), 12 months. The remuneration associated with the internship ranged from EUR 400 for four participants to EUR 550 for another four and EUR 540 for the other four participants. This remuneration corresponds to the concept of paid internships.
The analysis of potential additional job-related benefits results in the following: eight participants (66.7%) had transportation assistance; one (8.3%) had subsidized training; eight (8.3%) had subsidized meals; and all of them had vacation time. With respect to adaptations in the workplace, these exist in three cases (25%). More specifically, they involve adaptations for communication (16.7%; n = 2), accessibility (8.3%; n = 1), adaptations of the work environment (8.3%; n = 1), adaptations of work tasks (8.3%; n = 1) and flexible working hours (8.3%; n = 1). Given the absence of workers with an intellectual disability, there is a lack of typical self-regulation tools, such as self-control instruments (to-do lists, etc.), additional verbal signals or reminders or reinforcement by the supervisor or co-workers.
As for the type of job, 75% of cases (n = 9) involved an existing position or components of a single position. In 8.3% of cases (n = 1), the job was based on tasks that corresponded to more than one position, and in 16.7% of cases (n = 2), it was a newly created position. One case involved a job rotation, although the majority worked in a stable position (n = 11). Shifts were mostly in the morning (66.7%, n = 8), although 33.3% (n = 4) worked a split shift.
In this study, we used several questionnaires: (a) Employment Maturity Interview, (b) Job Typicalness Questionnaire, (c) Quality of Work Life Questionnaire and (d) Quality of Work Life Assessment.
(a) Employment Maturity Interview (EMI): (Adapted from [
47] by [
48]; revised by [
29]). Is a 10-item structured interview composed of 10 open questions. Informs about three main factors associated with vocational maturity that deal with occupational choice: the search for information, the knowledge of professional requirements and professional identity. Factor 1 (F1), search for information—composed of items 1, 2, 4 and 9— measures activities and specific efforts to understand the world of work and occupational information of interest to the assessed students. This factor is in line with aspects of vocational maturity regarding specific efforts for the purpose of acquiring knowledge in the world of work and job seeking. It has a value of 2.12 and a total variance of 21.2%. Factor 2 (F2), the knowledge of professional requirements, is composed of items 5, 7 and 8; refers to the self-appraisal of abilities relevant to job performance, as well as the skills necessary to perform an occupation. It is not about actions taken, but rather beliefs, values and judgments in terms of the level of self-knowledge and occupational information. It has a value of 1.29 and a total variance of 12.9%. Finally, Factor 3 (F3)—composed of items 3, 6 and 10—refers to orientation to work, that is, clarity about the profession that the subjects of this research would like to carry out. It has a value of 1.08 and a total variance of 10.8%. It assigns a score from 0 to 2 that results in a total EMI score of 22 points. Validity and reliability studies of VMI have been carried out in the United States and Spain [
48,
49].
(b) Job Typicalness Questionnaire: To conduct this study, we used the Typicalness Questionnaire originally developed by [
32,
33]. This instrument was used successfully in other studies in our context [
50]. The instrument is designed to be completed by a person with detailed knowledge of the disabled worker, as well as of their employment situation and aspects related to same. The original instrument has 75 items divided into five sections: (I) confidential information, (II) general information, (III) disability-related information, (IV) job-related information and (V) information about the company’s workforce.
(c) Quality of Work Life Questionnaire: this includes two instruments: Job Content Questionnaire and Survey regarding quality of work life indicators.
Job Content Questionnaire: In the assessment of the work demands and resources, we used the Job Content Questionnaire (JCQ) [
51] in the version translated and adapted by [
44,
45,
52]. The instrument refers to the work demands and resources available to the workers, with the following items: Skill Utilization, Job Control, Psychological Demands or Work Overload, Physical Demands, Supervisor Social Support, Co-worker Social Support, Control Over Job Content and Social Support.
Survey on quality of work life indicators: An abbreviated version of the “Survey for CEE and ECA Workers” was used, which was designed and used previously in other studies of workers with intellectual disabilities by [
45]. This survey contains a series of questions related to the following quality of work life factors: Role Ambiguity and Work Stress (demands) Rating. After obtaining the responses to the two questions, the literal transcriptions were sent to five expert raters. The results demonstrated that, for the 76 comments provided, a mean percentage of agreement of 91.974% was obtained, with a range of agreement between 89.474% and 93.421%. The Fleiss’ Kappa statistic was 0.909. The Cohen’s Kappa statistic was 0.91 (range: 0.88–0.96). The Krippendorff’s Alpha statistic was 0.91. All the data attest to the high degree of reliability of the coding.
3. Results
3.1. Vocational Maturity
Table 1 shows the results regarding average scores on the items in the EMI questionnaire. It can be seen that, for most items, except for 10, the average scores were higher than 1.5, indicating a high level of maturity. The results for items 7 and 10 represent exceptions to these high scores.
Table 2 shows the average results obtained for the three factors of the instrument. We can see how the scores for the different factors progressively decrease and are higher in relation to search for information, lower for knowledge of professional requirements and lower still for the factor associated with orientation towards a job or professional identity. These three factors denote a progressively more complex vocational maturity, since the first factor is related to abilities for choosing a job, while the other two factors are related to abilities for obtaining a job.
Additional analyses demonstrated a lack of significant inter-group differences in the above-mentioned variables, based on the gender of the participants, in Search for Information (F = 0.646; p = 0.44), Knowledge of Requirements (F = 0.027; p = 0.873) and Orientation Towards a Job (F = 0.173; p = 0.686). Secondly, we analysed possible inter-group differences based on the disability, after first re-coding the participants into three groups (minor group: percentage of disability of 52 or less; intermediate group: percentage between 52 and 75; major group: percentage of 76 or more). The analyses revealed an absence of significant intergroup differences in Search for Information (F = 1.011; p = 0.402), Knowledge of Requirements (F = 0.257; p = 0.779) and Orientation Towards a Job (F = 1.357; p = 0.301).
3.2. Typicalness of the Work
With respect to the perception of support in the workplace,
Table 3 shows the data for the number of weekly hours that the mentor dedicates to providing direct support to the worker on the job. The most common situation was that this support was offered around 1–3 h per week. The number of weekly hours the mentor dedicated to providing support to co-workers, supervisors, support staff, managers, etc., on the other hand (
Table 4), are fewer, with a predominance of less than one hour of support being provided per week (41.7%). In addition, it was not common for a co-worker to supervise the work of the disabled participant (
Table 5).
In all cases, the size of the companies where participants were working was less than one thousand employees. Likewise, the number of employees with disabilities in the immediate working environment, including the person with a disability, was one, that is, the intern was the only person. In response to the question “Has the company employed workers/interns with disabilities before?” in four cases the answer was affirmative. In terms of the number of daily contacts with co-workers without disabilities, four workers (33.3%) indicated having contact with between 1 and 5 people, while eight workers (66.7%) indicated 6 to 15 people. In two cases, the worker had contact with the public as part of their job. Furthermore, the three companies involved indicated that they provide orientation and basic training for new workers.
The companies state that, in general, they offer training on diversity to all employees (
Table 6), with training on disability being less common (
Table 7). This may explain the apparent contradiction between the data provided by the informants, given that the workers were distributed in three companies.
Next, we present the results obtained for the different factors of the Typicalness Questionnaire. This section of the questionnaire asked respondents to indicate to what extent different aspects of the acquisition, professional development, etc. that the worker with disabilities experienced were similar (typical) to those existing for any other company worker in the same job. Each item was rated on a scale of 1 to 7 points, with 7 being the maximum score or degree of similarity.
Table 8 shows how, although the aspects related to human resource management (orientation or initial induction, supervision, performance evaluation, disciplinary procedures, etc.) are quite typical in all cases (i.e., higher average score, higher minimum score, less dispersion of scores), in the case of job acquisition and hiring (recruitment, job application procedures, job interview, etc.), these processes were less similar to those used for people without disabilities. It also shows how the social aspects (participation with co-workers in social activities outside work, etc.) are not as similar as one might expect.
The mean difference tests between groups (ANOVA) based on the degree of severity of the disability did not reveal significant differences between groups. Similarly, gender-based differences were not found either. However, the analysis of correlations between factors of the questionnaire revealed the existence of a significant, positive and high association between job characteristics and management of the job (rxy = 0.761; signif. with p = 0.001). Likewise, a significant, positive and high association was found between adjustment to the job and social factors (rxy = 0.750; signif. with p = 0.001). No significant associations were found between the Job Acquisition factor and other factors.
Table 9 specifies the frequency distribution for the different items on the questionnaire. It shows how the least typical or similar aspect was recruitment, followed by the job application form. Other less typical aspects related to job demands in terms of ratio and quality. There was, however, a class of non-negotiable variables, regardless of the type of worker in question, such as: hours, pay, meals, other benefits and dismissal. All these aspects were regulated in the workers’ rights in the different collective bargaining agreements, which may explain these results.
One of the aspects related to normalization concerned the way the worker reached the workplace. In this sense, 25% of workers drove to work in their own car (n = 3), 66.7% (n = 8) used public transportation and one person (8.3%) was taken by a family member.
Table 10 shows the analysis of integration in the workplace. This table shows how one of the workers basically only exchanged greetings; in three cases, interactions tended to be limited to work issues; and, lastly, for eight of the workers, interactions with co-workers were continuous.
In response to the question regarding whether the company provides training or support, in all cases, it is indicated that this was provided to the most immediate co-workers as well as to supervisors and managers. Furthermore, in two cases, it is also indicated that this training was provided to the human resources staff. This training was provided in all cases by the collaborating organization and is focused on providing general information on disability or on training regarding workers with disabilities and their support needs (100% of cases, respectively); moreover, in two cases more general training was provided on how to support workers with disabilities. Looking more deeply at the characteristics of this training or support, in 10 cases, it is indicated that this involved formal training through meetings with company staff; in two cases, it is indicated that it was informal, in other words, the training or support is provided on a casual basis. In one case, it is indicated that it involved formally structured practical work sessions for company staff, and, in another case, it is indicated that this question was not applicable (that is, support or training was not provided as such). The most common situation was that the training took place in a conference room or other office outside the immediate work area (n = 11; 91.7%), although in one case it is indicated that this training took place in the immediate work area (8.3%). In all cases, it is indicated that this training or support to company staff took place before the person with a disability started working, but, in addition, it is indicated that this extended to the start of work in 11 cases. Lastly, in one case, it is indicated that, additionally, this support was provided whenever the workers requested it. The training was provided by the collaborating organization, as well as by the most immediate co-workers and by supervisors or managers. In addition, in 11 cases, it is indicated that the supervisors provided the most support (91.7%), and in only one case is it indicated that the co-workers were the ones who provided the most support (8.3%). This support was provided weekly in 75% of cases (n = 9), and it was less probable for it to be provided infrequently (16.7%; n = 2) or daily (8.3%; n = 1). The support provided by company staff wass related to learning and comprehending tasks, socially acceptable behaviours, completing tasks, performing tasks on time, involving people with disabilities in social activities at work and outside of it, maintaining/improving the quantity and quality of work and meeting personal needs.
3.3. Quality of Work Life
Quantitative Assessment
Table 11 shows the results obtained in the Demands and Resources questionnaire. It shows how the highest scores correspond to resources such as social support from co-workers. However, there are also high scores for demands, such as those related to the psychological demands involved in performing the work. Analysing the second-order factors on the questionnaire, it is observed that, in this order, the highest scores correspond to social support, followed by perception of demands and, lastly, autonomy.
The analysis of possible gender-based differences between participants revealed an absence of differences in the variables analysed. On a separate note, the analysis of possible differences according to the severity of the disability revealed the presence of differences based on the severity of the disability. The intermediate group obtained significantly lower scores, as demonstrated by the post hoc analysis (Duncan and Scheffé) in the Skills Utilization variable and in the Autonomy factor (
Table 12).
With respect to the rating of possible stressors, corresponding to the Survey for CEE and ECA Workers, it can be observed how the average scores indicate a low intensity of the same (
Table 13). Nonetheless, factors such as the high number of tasks to be accomplished, not having information on work performance or excessive responsibility are examples of the items with the highest scores.
As previously mentioned, the rating of each participant’s open responses required subsequent coding, using the dimensions and indicators proposed by [
53]. Thus, as shown in
Figure 1, of the 76 text fragments that were coded, when the workers with disabilities were asked what quality of work life is, their answers related 34% of the time to organizational aspects, 29% to individual indicators, 21% to aspects concerning the work environment and 16% to elements of the socio–occupational environment.
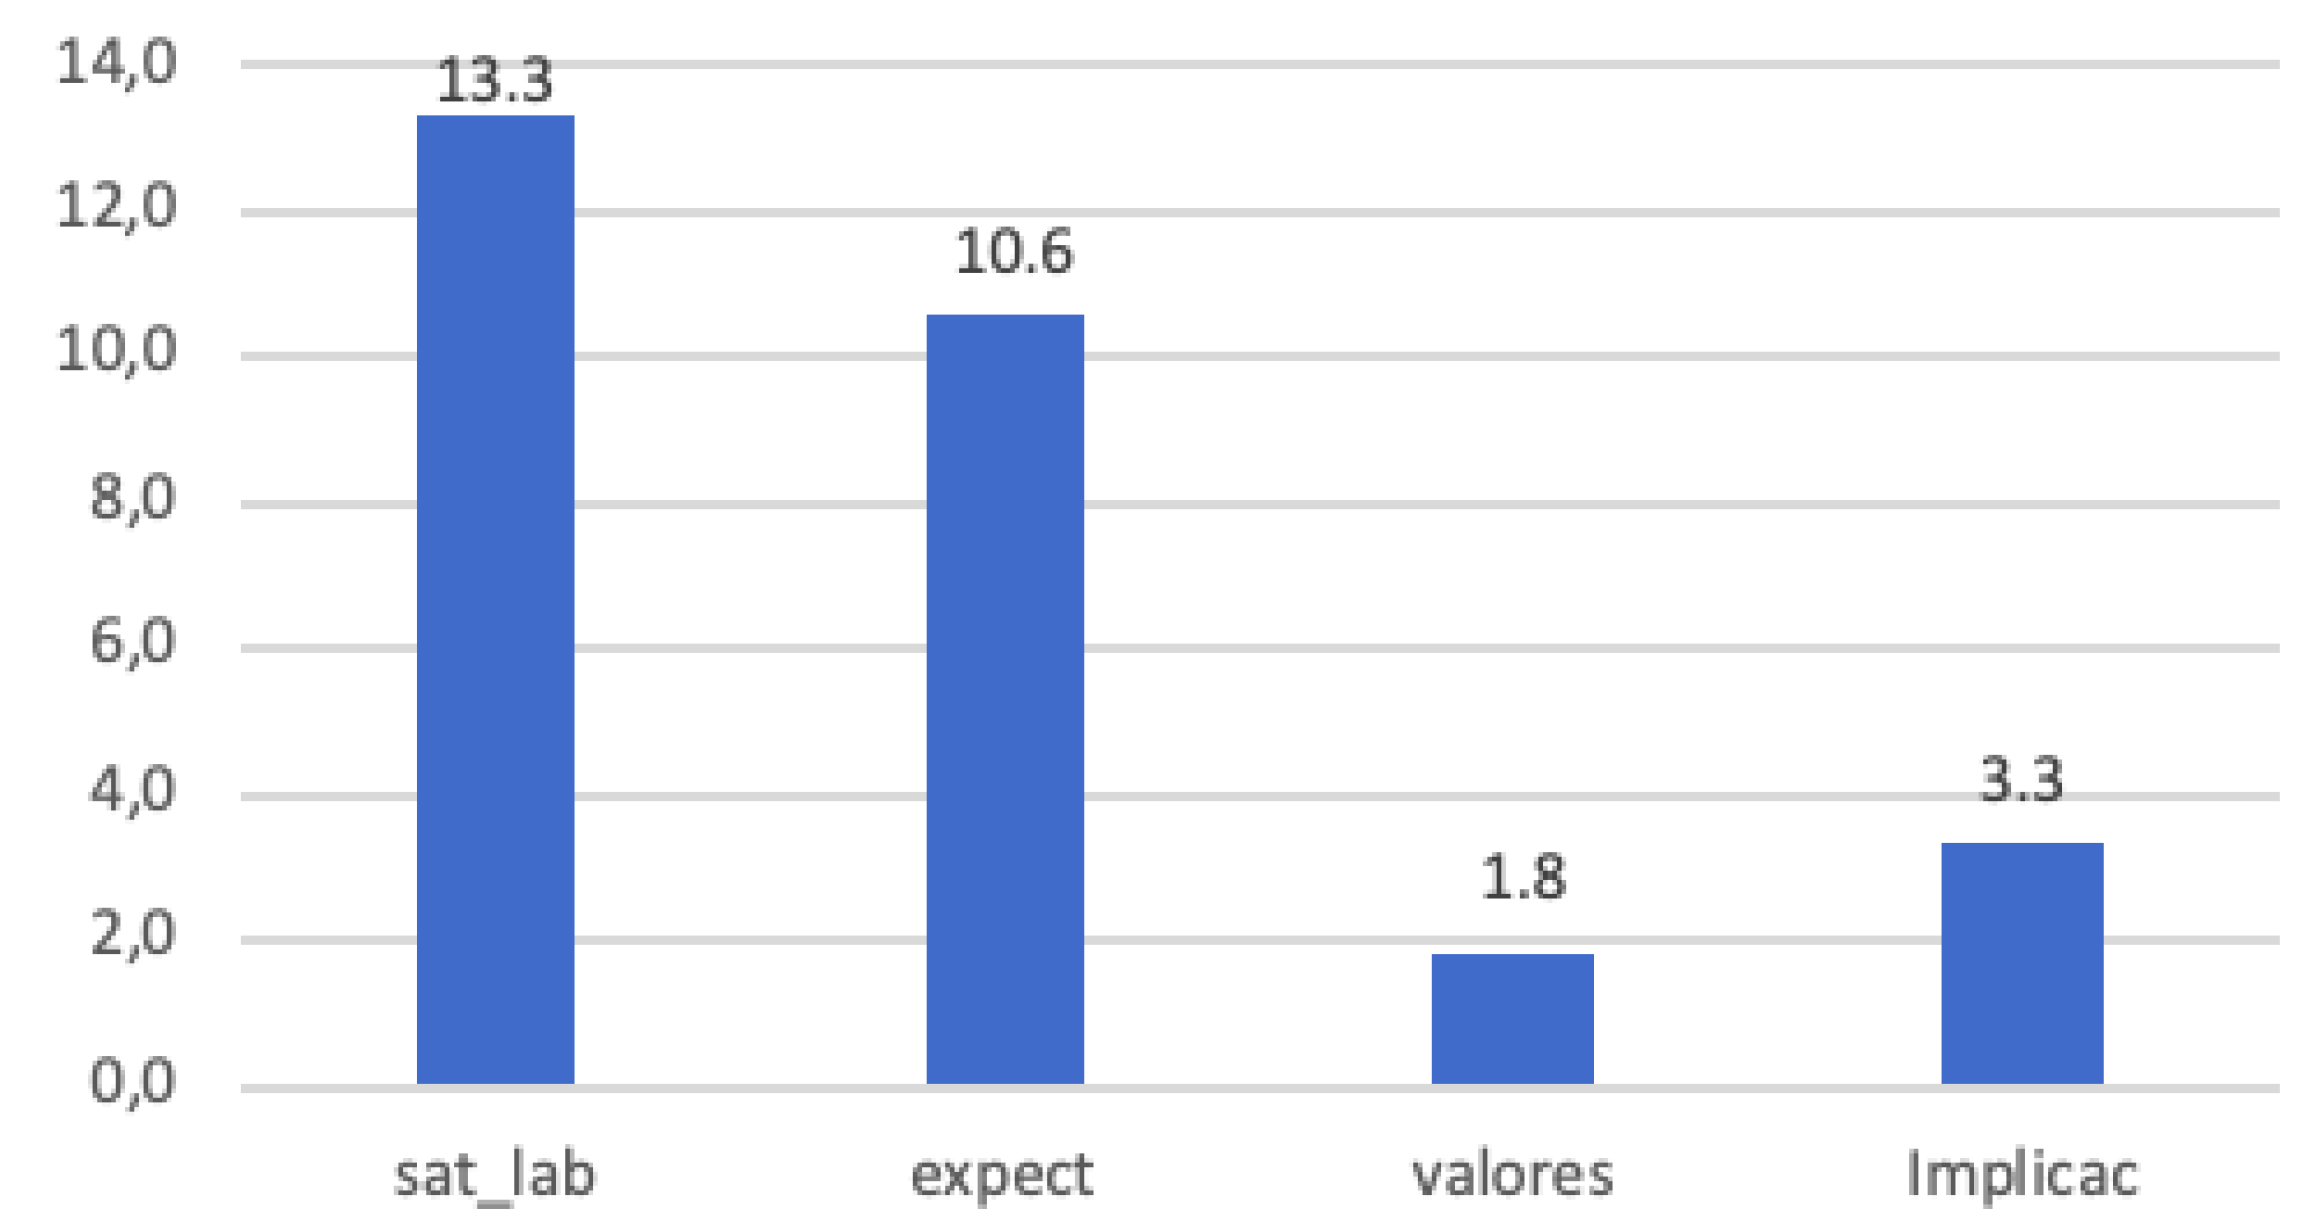
Looking more deeply at the responses provided by the participants and focusing on the individual indicators, it is possible to observe how 13.3% of the factors associated with quality of work life referred to having a job that satisfied them personally (“I enjoy the work”, “I am comfortable with my duties”, “I feel economically valued”), and 10.6% of the responses were related to performing a job according to personal expectations or personal values (“Development of skills”, “a job that helps you grow as a person”).
Table 14 shows the quality-of-life indicators and their absolute and relative frequency. In absolute terms, it can be observed how the most frequently mentioned aspects, or the ones the interviewees considered most defining of quality of work life (in terms of the frequency of mention), were social aspects, followed by a satisfying job and a job that met our expectations. In contrast, the least mentioned aspects and, therefore, the ones that could be understood as least defining quality of work life related to the content of the job, characteristics of the position and culture of the workplace.
4. Discussion
The results obtained in this study allow us to state that, in line with our predictions, participants displayed a high vocational maturity, demonstrated by the high scores obtained on the Employment Maturity Interview Questionnaire. No differences in scores were observed based on their gender or severity of their disability. We can then say that their training level or related life experiences may be factors that unify their vocational situation. We could assert, therefore, that higher education acts as a factor that favours employability, regardless of personal circumstances such as gender, severity of the disability or age. These results coincide with previous studies and attest to the importance of the training provided [
21,
29,
48,
54,
55,
56]. These results represent a step forward in the elimination of barriers in access to recruitment processes for people with disabilities and, specifically, for those who have completed university studies. This fact may encourage companies to take into account people with disabilities in all their recruitment processes. Moreover, discrimination based on the severity of the disability or gender would not be a barrier, as it is observed that the professional skills of these employees are as high as those expected of any other worker.
Our second hypothesis was that workers with disabilities would have gained access to a job through non-typical strategies (non-typical recruitment and induction or orientation) but would obtain typical results (performance, social, job characteristics). This was proven in light of the results indicating the existence of less high scores in relation to access to a job. This suggests that these workers needed support involving the adaptation of job interviews in order to obtain a job, for example. However, the results obtained in relation to job characteristics (hours, benefits, etc.) are similar to those obtained for co-workers without disabilities. On the other hand, the analysis of the association between factors of typicalness of a job demonstrate that a normalized job is associated with normalized management of the same, and that adequate adjustment to a job is also related to normalization in the social factors (interactions) of the same. These results coincide with previous studies addressing the importance of striking a balance between support and similarity of working conditions [
32,
33,
34]. However, we can say that, in this case, it is the company that has been supported to learn to value people’s abilities rather than the usual way of paying more attention to disability. This helps to eliminate stereotypes and prejudices and promote more inclusive recruitment processes.
Returning to the hypothesis, our third prediction (H3) was that students would have a positive perception of their quality of work life. Specifically, we predicted that there would be a low stress rating, role ambiguity, low perception of demands and a high perception of resources. On the other hand, we that there would be no differences in quality of work life between participants based on gender or severity of the disability. As for the results obtained, given the fact that none of the potential stressors received scores of more than 3 out of 10, the perception of low ambiguity and high social support resources are evidence that supports this hypothesis. This result suggests that the behaviours and attitudes of both non-disabled colleagues and company managers have been adequate, not provoking stressful or ambiguous situations. In contrast to other studies [Borja Short], the initial stress of the workers can decrease the quality of working life. Therefore, we can interpret that co-existence helps to normalise the presence of people with disabilities in the workplace. To this, we can add the absence, in general, of significant differences in perceptions based on gender or severity of the disability. Thus, and as proven in numerous studies, having a job with adequate support (as in the case of the participants in our study) guarantees a balance between demands and resources and, therefore, quality of work life [
9,
44,
52,
57].
Lastly, hypothesis predicted that students would have a multi-dimensional mental model of quality of work life. In this context, we can state that the 4 factors of the quality of work life model and 22 indicators of quality of work life were mentioned by the participants. Specifically, workers with disabilities fundamentally emphasize social aspects (interpersonal well-being) and adjustment to expectations (personal well-being) to rate their quality of work life. It is necessary to highlight this result, as it allows us to be aware of the need for social contact between all workers. This may allow us to implement other types of projects in companies that encourage relationships in moments of relaxation that allow for interaction and getting to know each other. As a result, and returning to [
53], the improvement of quality of work life requires alignment of the interests of the organization with the goals and expectations of its members, with attention to satisfying the needs and interests of its workers (for personal and professional development, satisfaction, etc.). These results were obtained in prior studies with other populations with different disability types [
9,
41,
42,
43,
44,
45,
46].
5. Conclusions
In view of the results and discussion above, we conclude with the importance of continuing to promote open innovation programs and collaboration between companies and entities and actions that increase the level of vocational maturity, as its development is an indicator of employability and, therefore, allows higher levels of success to be achieved when it comes to obtaining a job. On a separate note, we consider it necessary to establish relationships of co-operation between the business community, the university and third-sector organizations that can provide mutual learning and generate actions that will foster the labour inclusion of people with disabilities and, more specifically, university students with disabilities. The results point to the importance of promoting training on disability in work environments and, particularly, on the processes related to gaining access to jobs, as, otherwise, the widespread lack of knowledge regarding access to jobs or internships for people with disabilities will make it impossible to know the work potential of these workers who, under the circumstances and excluded from the outset, will not be able to demonstrate their professional abilities, skills and capacities. In this study, we have seen how the open innovation projects and establishment of synergies between different agents, such as companies and the university, makes it possible to orient hiring processes towards accessibility, fairness and equal opportunities. This fact, together with knowledge of disabilities and their implications in the workplace, will allow for a higher rate of labour inclusion of people with disabilities, observing that, once the barrier to access is overcome, the functions and typicalness of the job is similar to that of people without disabilities.
Therefore, labour inclusion fulfils a determining role in the framework of the job, as it is sustained by equality, the equalisation of opportunities and full social participation; in practice, it materializes once the person starts a job and participates in all the work and social activities of the company [
11]. This makes the work environment one of the factors that contributes to people’s satisfaction in life and, therefore, to people’s health and wellbeing, as it represents income for achieving an independent life, access to other resources [
12], as well as to personal development, and the establishment of interpersonal relationships and incorporation into social networks [
58]. Major prejudice and discrimination still exist in the workplace towards people with disabilities [
59], generating different types of barriers [
60] that significantly diminish their quality of life [
61]; therefore, continuing with open innovation programs and proposals similar to this study will contribute to knowledge and respect for diversity and, in consequence, to the labour and social inclusion of people with disabilities, as well as attracting talent on an equal opportunity basis.
This study has sought to illustrate the advantages of training and support for university students with disabilities in terms of vocational maturity, employability and quality of working life. It is, however, a preliminary study, and the size, origin and socio–demographic characteristics of the sample prevent the generalization of the data obtained beyond what is strictly related to these participants. On the other hand, the economic conditions for the development of internship programmes limit the size of the sample of participants, which is a challenge that needs to be addressed. In any case, it should be noted that, taking into account that the recruitment of people with disabilities is very low, the fact that twelve people are employed in different companies could be considered a high proportion.
Finally, the results obtained encourage us to continue with this type of programme and even include, as a future line of research, interviewing non-disabled workers to find out their previous perceptions or ideas about people with disabilities, as well as the degree of acceptance of people with disabilities in the workplace and in the social environment.


