Article

Framework for Measuring Process Innovation Performance at Indonesian State-Owned Companies

by
Patdono Suwignjo
1,*,
I Ketut Gunarta
1,
Naning Aranti Wessiani
1,
Andhika Eko Prasetyo
2 and
Lila Yuwana
3
1
Department of Industrial and System Engineering, Institut Teknologi Sepuluh Nopember, Surabaya 60111, Indonesia
2
Engineering Management Study Program, Universitas Internasional Semen Indonesia, Gresik 61122, Indonesia
3
Department of Physics, Institut Teknologi Sepuluh Nopember, Surabaya 60111, Indonesia
*
Author to whom correspondence should be addressed.
J. Open Innov. Technol. Mark. Complex. 2022, 8(2), 95; https://0-doi-org.brum.beds.ac.uk/10.3390/joitmc8020095
Submission received: 18 April 2022 / Revised: 12 May 2022 / Accepted: 15 May 2022 / Published: 20 May 2022

Abstract

:
Several state-owned companies (SOEs) have successfully implemented process innovation. This paper examines the success factors that influence the successful implementation of process innovation in Indonesian state-owned companies. The present study used the three stages of an online questionnaire in the Delphi method to obtain consensus from experts. The consensus was measured based on the mean and standard deviation of the assessment answers provided by our respondents. Based on the development of process innovation implementation frameworks shown in previous studies, we obtained 28 factors that influence the successful implementation of process innovation. Our panelists believed that human resources and organizational factors, such as leadership, problem understanding, strategy, and culture, affected the success of process innovation in SOEs, even more than the research and development budget, support, and commitment factor of a given company. Meanwhile, cost efficiency was the main factor driving a company’s motivation to implement process innovation. The success factors in implementing process innovation are an essential consideration for the management of other SOEs eager to improve their company’s innovation performance, especially process innovation. Success factors were carried out comprehensively for all implementation indicators of process innovation, including inputs, process (idea generation, idea selection, and idea implementation), outputs and outcomes, diffusion, culture, strategies, and push and pull factors.

1. Introduction

Innovation is a business activity carried out by a company in its development efforts by creating added value in its business processes [1]. A company has a differentiating competence to face global competition with other competitors with added value. Several studies have witnessed a positive correlation between innovation and increased company business performance [2,3,4]. The Ministry of State-Owned Enterprises (SOEs) of Indonesia encourages the growth of a culture of innovation in state-owned companies. This is an effort to increase the role of SOEs in the Indonesian economy, which is considered relatively low compared other countries. Pranoto [5] presented data that the contribution of Indonesian SOEs to Indonesia’s overall GDP was only 6%; compared to other developing countries in Latin America, Mexico, Brazil, Argentina for example have reached 8%, 15% for countries in Africa, and up to 50% contribution of SOEs for overall GDP in the Middle East region countries. Since 2013, the Ministry of SOEs has held an innovation competition among state-owned companies. While various kinds of innovation arose from the event, only a small number of SOEs participated. This shows that not all SOEs can foster a culture of innovation in their corporate environment. Innovation culture can grow positively when subjected to reliable innovation management. A good innovation management system is significant in influencing the number of innovations in a company, although it does not directly determine the success of innovation in that company.
Based on the open innovation concept, innovation management is one of the types of knowledge that can be copied or transferred from one company to another [6]. Some companies meet difficulties in their innovation; therefore, they have to adopt open innovation [7]. While process innovation tends to be tacit [8], its conditions differ in state-owned companies. SOEs are under the auspices of the same institution (Ministry of SOEs), and they are required to synergize with one another [9]. Thus, the process of transferring knowledge between SOEs is relatively frictionless. Mathrani and Edwards [10] stated that organization structure and management style have a significant role in knowledge transfer. With the same management characteristics evident among state-owned companies, the copying process will be easier, albeit with minor adjustments/modifications. Companies proven to be sustainable in successful innovation can be an example for other SOEs when it comes to managing their own innovations. Tajudeen et al. [11] also found positive correlation between external technology exploitation (ETE) and the effort of increasing a company’s innovation performance.
SOEs also continuously strive to improve their business performance. Even some SOEs are starting to expand abroad. In order to survive in global competition, SOEs must improve themselves in doing innovation. Postpaid electricity products by PT PLN (power production company), the production of liquid fertilizer by PT Pupuk Indonesia (Indonesian fertilizer holding company), the conversion of household fuel consumption from kerosene to LPG by PT Pertamina (oil and gas company)—even the promotion of electric induction cookers by PT PLN—are all examples of successes of product innovation by SOEs. Some additional examples of the success of process innovation include the development of automatic train stops (ATS) and e-ticketing by PT Kereta Api Indonesia 9train operator company), dust return technology by PT Semen Indonesia (Persero) Tbk. (portland cement holding company), the application of digital technology at several airports by PT Angkasa Pura (airport operating company), the emergence of several android-based customer service applications, such as m-banking, owned by state-owned banks, and PLN Mobile, developed by PT PLN. The best example of successful marketing innovation is King Market, created by PT Bulog (logistics company), which can utilize Bulog’s warehouses for online food distribution (Panganan.com). The Ministry of SOEs encourages several SOEs from the same industry cluster to form a holding company in organizational innovation. PT Semen Indonesia (Persero) Tbk. and PT Pupuk Indonesia are two real examples of successful organizational transformation. This description of success in innovating can be one of the knowledge transfer materials between SOE companies; therefore, other SOEs can do the same. This is an area of study in the research that we accomplished.
The present study focuses on examining process innovation, as it dramatically affects financial performance [12], although [13] suggests that investment in new technology (process innovation) in Southeast Asian countries, especially Indonesia, has a negative correlation to sales growth. More than half of state-owned companies spent budgets on operational costs. If all state-owned companies can innovate in this area, the resulting efficiency will be sufficient to increase their performance. While the measurement of innovation readiness level has not been applied to all SOEs, several lists showing SOEs participating in innovation competitions demonstrate that only leading SOEs can create innovation. Therefore, a study to describe the success of innovation—especially process innovation—is needed so that such innovation can become the primary orientation of other state-owned companies that are eager to improve their innovation performance. While this research aimed to examine the main factors that significantly influence the success of process innovation, a comprehensive study was carried out on the overall implementation of process innovation in each company. The development of the innovation performance measurement model framework proposed by Detecon Consulting was applied in the study [
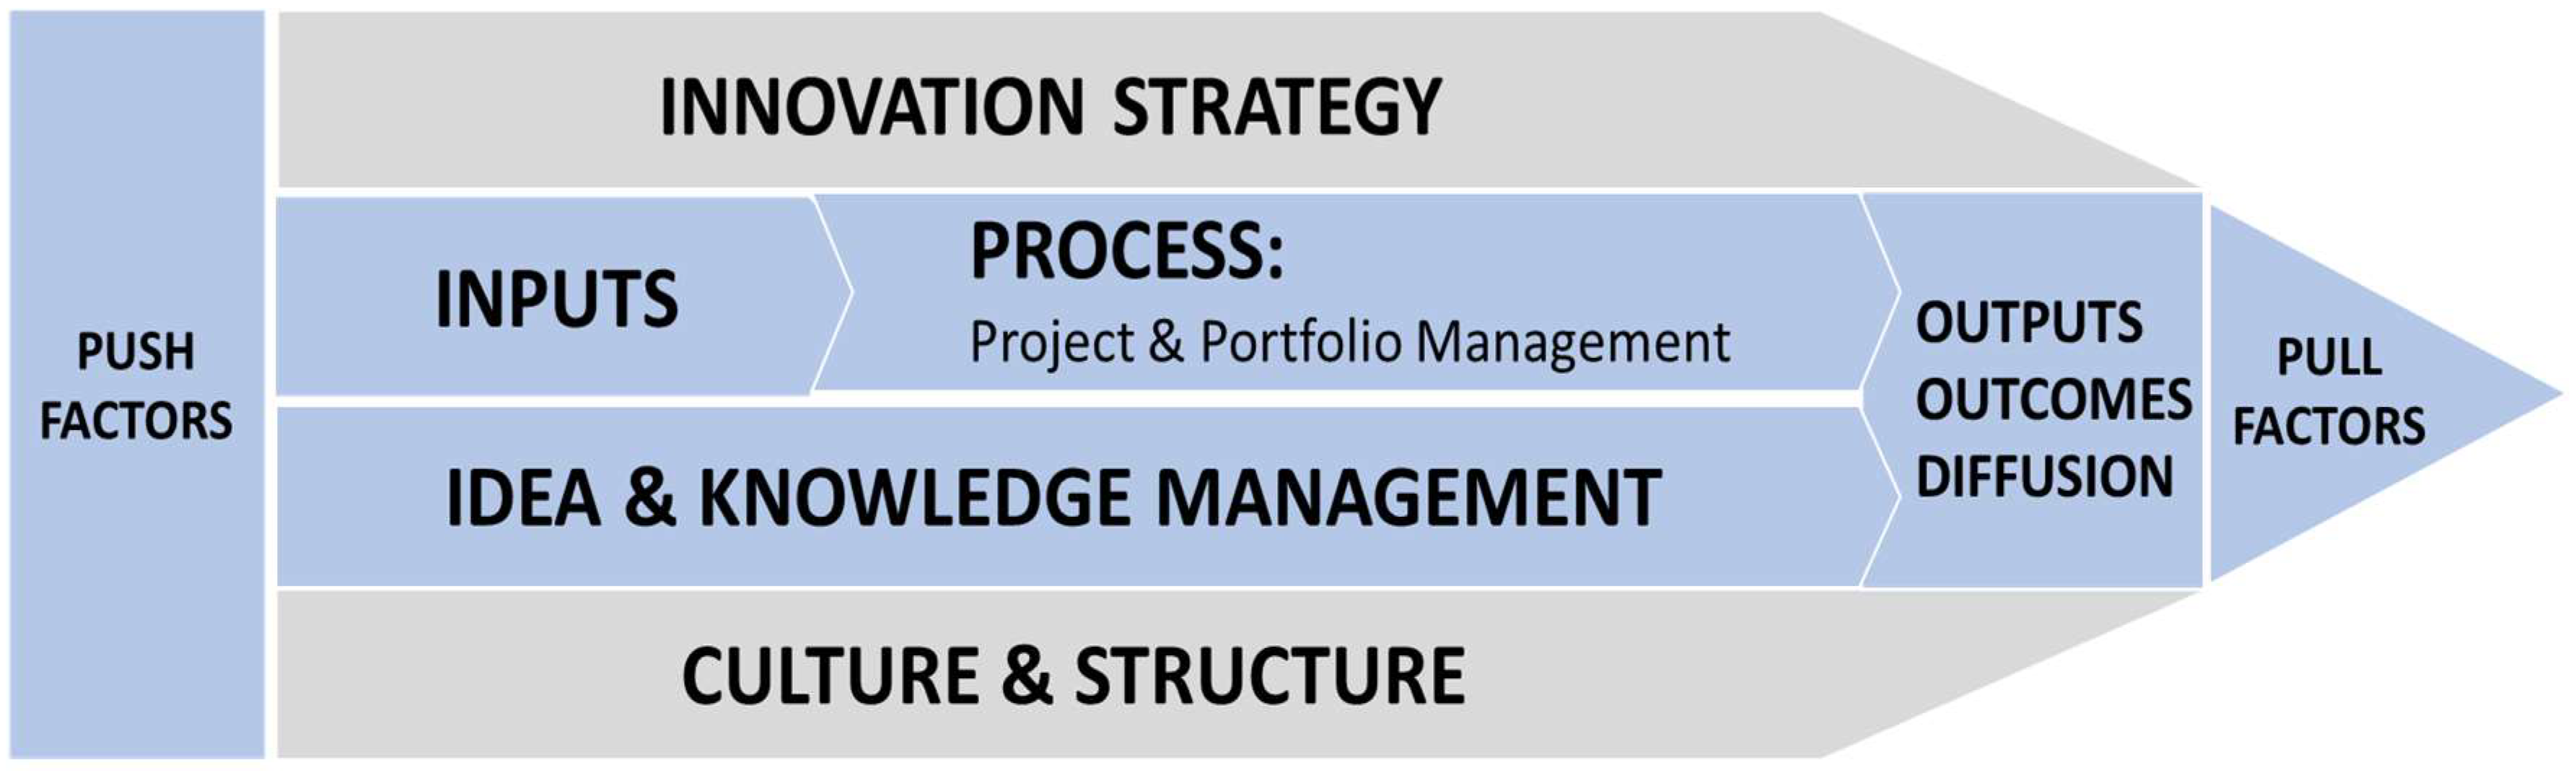
14]. Modifications were made by adding several indicators considered highly important in the implementation of innovation, i.e., diffusion of innovation and push-pull factors that influence motivational actors.
The Delphi method approach was used to obtain consensus from the sources. This approach usually involves a small number of people (between eight and fifteen panel members). Delphi methods that do not require large data are very suitable for the data collection process during the COVID pandemic. Generally, the pandemic period requires reducing interaction with others, especially in groups. With these difficulties, the data obtained will be very limited so that they cannot be analyzed with other statistical methods such as confirmatory factor analysis. The resources involved in this study consisted of experts from SOE industry practitioners, officials handling innovation issues at the Ministry of Research and Technology/BRIN, and academics in innovation. The panelists’ discussions and data collection were carried out online due to the current COVID-19 pandemic.

2. Literature Review

2.1. Innovation

Innovation is essential in almost all fields. Knight [15] defines innovation as adopting new changes to an organization and its relevant environment. Furthermore, the word adoption means that an organization has a new idea and then implements it. Similar definitions are noted in some of the literature (e.g., [16,17,18]). Academics have slightly different views of “new” in the definition of innovation. Academics argue that innovation is something new for organizations that have just adopted it, not something that previously has never existed [19,20,21,22,23].
Others argue that the word adoption signals something new in a company’s environment [23,24,25]. The Organization for Economic Cooperation and Development [26] divided the novelty of innovation into three levels: global, institutional, and intermediate. At a global level, innovation is the first change implemented. Institutional level innovation means that the innovation in question has just been implemented in an institution but has previously been implemented in other institutions. The OECD defines innovation in [27] as follows:
  • Chapter 146: Innovation is the implementation of (i) a new product (good or service); (ii) new processes; (iii) new marketing methods; (iv) new organizational methods; significant improvement in business practices, workplace organization, or external relations.
  • Chapter 150: A common feature of innovation is that it must be implemented; new or better products are implemented when introduced in the market; new processes, marketing methods, or organizational methods are applied when they are actually used in the company’s operations.
From the two points above, the definition of innovation is related to products and processes and two methods: marketing and organization. Product and process innovations must be new or significantly improved, while both methods (marketing and organization) must be novel. Apart from being new or significantly improved, a product must be introduced into the market. A new process or method must be used in the operation of a given company. Innovation takes place when both conditions are fulfilled.
Another definition describes innovation as a multi-stage process of an organization for turning ideas into new products or services and improving processes that can compete in the right market [28]. One of the more straightforward principles of innovation is explained as the successful exploitation of new ideas [29]. The UK government uses this brief description in the manufacturing sector to compete in a global market with challenges from developing countries, including China and India [30]. Merriam-Webster [31] defines innovation in a modern way as the following: a new idea, creative thinking, or new imagination in the form of a device or method. Innovation, in this case, is an application of a better solution to meet new requirements or market needs.

2.2. Innovation Classification

Several perspectives are used to distinguish between different kinds of innovation. Innovation is distinguished according to the field in which it is implemented, such as product innovation (goods/services), process innovation, marketing innovation, and organizational innovation [27].
  • Chapters 156–157: Product innovation is the introduction of new or significantly improved goods or services concerning their characteristics or uses. This includes significant improvements in technical specifications, components, and materials, built-in software, user-friendliness, or other functional characteristics.
  • Chapter 169–170: Process innovation is the adoption of new or improved production or delivery methods. This includes significant changes in techniques, equipment and/or software. Process innovation is usually carried out with the aim of reducing unit costs of production or delivery, to improve quality, or to produce or deliver a product.
  • Chapter 169–171: Marketing innovation is the application of new marketing methods that involve significant changes in product design or packaging, product placement, promotion, or pricing of products. Marketing innovation is aimed at better meeting customer needs, opening new markets, or positioning the company’s products in the market, with the aim of increasing sales.
  • Chapter 177–178: Organizational innovation is the application of new organizational methods in the company’s business practices, workplace organizations, or external relations. Organizational innovation can be intended to improve firm performance by reducing administrative or transaction costs, increasing workplace satisfaction (and thus labor productivity), gaining access to non-tradable assets (such as uncodified external knowledge), or reducing supply costs.
Types of innovation are distinguished according to the development of their sustainable purposes. These include traditional (economic), social, environmental (green), and sustainable innovation. Silvestre and Ţîrcă [32] created a matrix of the four differences based on two main dimensions of concern—social and environmental. Traditional innovation is carried out according to the traditional goal (paradigm) of establishing a company for maximizing profits and is more oriented toward financial output [33,34]. Dawson and Daniel [35,36] proposed social innovation as an innovation that is carried out to contribute to community welfare and increase social capital. Environmental innovation [37,38], better known as green innovation [39], or specifically as low-carbon innovation [40], is innovation carried out on products or processes (methods) to reduce harmful impacts on the environment. Sustainable innovation, which is balanced between the three pillars of sustainability (economic, social, and environmental), is an innovation that focuses on environmentally friendly technology by considering the socio-economic aspects of a company. Various terms have been widely used to provide a clear description of this type of innovation, including sustainability-oriented innovation [41,42], socio-ecological innovation [43], sustainability-related innovation [44], sustainable innovations or sustainability innovations [45], sustainable development innovation [46], and innovations toward sustainability [47].
An innovation’s type is distinguished based on its emergence alongside the strategic development of its business model towards changes in the market and the technology used [48,49]. Kulakauskaite [50] provided a simple definition of the four types of innovation: incremental innovation means product development, disruptive innovation is the introduction of new products, architectural innovation means entering new markets, and radical innovation is the creation of new markets. It consists of incremental/routine, architectural, disruptive, and radical innovations. Incremental/routine innovation is the most common type of innovation companies carry out by utilizing existing technology to provide added value to a product (goods or service) for the current market/customer. Architectural innovation is carried out by applying technology in a current business model to new markets/customers. Disruptive innovation is innovation achieved with new technology introduced to the current market/customer, often requiring updates to a company’s business model strategy. Radical innovation is an innovation carried out by a company with updates to the technology to create or increase markets/customers without making strategic changes to its business model.
Chesbrough [51] introduced different innovation models based on the use of innovation resources: close innovation uses internal resources, whereas open innovation involves a company’s external resources. The use of a close innovation strategy provides benefits to an organization by increasing the ability of the primary movers, human capital that positively influences the implementation of innovation [52] and protects company assets, especially knowledge and/or intellectual property (IP) [53]. An open innovation strategy provides wider access to external innovation assets [51,54,55,56] while also minimizing the risk of innovation failure borne by the company [57,58].

2.3. Process Innovation

Edquist [59] proposed the implementation of organizational and technological aspects in process innovation. While the OECD has defined process innovation through [27], it later updated it with the term technological process innovation (TPI) [26] to show a more precise distinction from organizational process innovation [58,60,61,62,63]. TPI is adopting new or significantly improved technological production methods, including product delivery methods. These methods may involve changes in equipment or production organization or a combination of these changes and may be derived from new knowledge. The methods may be intended to produce or deliver a new or technologically improved product, which cannot be produced or delivered using conventional production methods, or primarily to increase production efficiency or delivery of an existing product. This information relates to organizational and operating methods, quality control, and other manufacturing procedures. Teece [64] divided the technology category in this innovation process into two types: hardware such as tools, equipment, and blueprints, and information used to run hardware more effectively.
Milewski et al. [65] provided a functional design for the process innovation life cycle that includes: (1) ideas—the initial stages of the emergence of innovation object process candidates triggered by performance gaps related to the process; (2) adoption—activities to facilitate innovation by determining investment decisions; (3) preparation—technology development and organizational change planning; and (4) installation—the implementation of the process including the setting of technology and the introduction of organizational change. Success in each stage of the innovation process is highly dependent on the suitability of technology, knowledge assets, and human capital capabilities [66]. In addition, other factors can also have an impact on the implementation of process innovation, such as time availability [67], the accuracy of a company’s strategy [68], and an organization’s willingness to make changes [69,70].
Process innovation is a source of competitive advantage for companies. With a competitive advantage, organizational performance increases [71]. It is an essential element for the long-term survival of a company by preparing it to change its business environment permanently [65]. Research conducted by [17] showed a positive linear relationship between innovation and performance. In addition, process innovation created cost efficiency [70] due to a reduction in the company’s operational costs [72]. Another consequence of process innovation is the emergence of new knowledge [73] and the possibility of companies registering process innovations to obtain patents (IP) so that they have an advantage over competitors [74]. However, on the other hand, process innovation has several dangerous consequences, including high monetary costs caused by the purchase of equipment, salaries, and training to use process innovation tools efficiently and effectively, including investment in knowledge management systems.

2.4. Process Innovation in SOEs

SOEs (BUMN in Indonesian) are business entities under the Indonesia Ministry of SOEs established by the state, and they are required by law to tackle the following objectives: contribute to national economic growth, the pursuit of profit, public services, business pioneers, assisting a low economic group of entrepreneurs, cooperatives, and the community (Law No. 19 of 2003). The Ministry of SOEs has held an innovation competition between SOEs since 2013 with the title BUMN Innovation Award. The event is held to encourage state-owned companies to continue innovating and improving their corporate values. This event has created many process innovations, including the following:
  • Development of a signal violation prevention system, or ATS, by PT Kereta Api Indonesia. ATS is a type of safety equipment that can regulate the movement of trains automatically by stopping the speed of a train according to the condition of the railroad if the driver violates a signal. In addition, PT Kereta Api Indonesia also innovates by implementing e-ticketing to reduce passenger queues at stations.
  • PT Semen Indonesia (Persero) Tbk. introduced a dust return system to improve its dual function PPC cement products with by-pass process technology. Dust return is a fine waste material that results from grinding in the raw mill process and from circulating feed in the SP calciner. With an acceptable size of about 10 microns, dust return can be added directly into PPC cement without going through the final grinding process. This is achieved by following the turbulence process of the separator fan. The use of dust return can increase cement production by up to 8% without increasing the workload of the cement mill machine.
  • Since 2018, PT Petrokimia Gresik has implemented process innovations on a bulk product unloading system at its internal port. Process innovation is carried out by replacing, modifying, and adding several supporting structures to the loading and unloading process. The new system can increase equipment availability from 80.6% to 96%. In addition, the breakdown time was recorded as being seven times shorter (from 231.25 to 30.75 h), and the thickness of the waste product decreased from 3 to 0.4 cm.

3. Materials and Method

3.1. Framework of Process Innovation

To establish the extent to which the implementation of process innovation is successful, we created several model frameworks for measuring innovation performance (see Table 1).
The present study tried to modify the model proposed by Detecon Consulting by adding several diffusion indicators/criteria and pull and push factors (Figure 1). The elaboration of innovation indicators used an IPO model system approach (input–process–output). Several previous researchers stated that the input for innovation success (product innovation and process innovation) was the budget issued by a company for research and development (R&D) programs [79,80,81,82,83,84,85,86,87], including the budget for ICT investment [73,86,88]. Jin and Lee [89] explained that R&D budget assistance from the government can improve management performance to generate innovation. This study summarized the innovation process into three stages: generation, selection, and implementation of ideas. This is slightly different from the approach presented by [65,90]. The researchers assumed that the preparation and installation stage [65] is a comprehensive effort to implement innovative ideas. Idea selection is important because not all ideas have to be implemented as innovation decisions, in contrast to the method proposed by [90]. Output indicators and process innovation results generally include cost reduction [8,57,85,91,92,93]. Chiesa et al. [94] suggest that process innovation is also intended to reduce operational time and reduce costs. Kirner et al. [95] indicated that increased productivity and quality were also the outcomes of process innovation. Möldner et al. [85] agreed with this suggestion, arguing that increasing a company’s competence relative to competitors is also an output of process innovation.
Diffusion is a process by which innovation is communicated within a system. Diffusion is an important activity that considers how process innovation results in systemic change (affecting other entities). The process innovation results need to be known by all elements in a system. Therefore, diffusion can be included in the chain of implementing process innovation. This study also includes the criteria of push and pull factors, which themselves affect the motivation of human resources in taking action [96], especially in the scope of implementing process innovation. Human resources are considered important as the main drivers of implementing process innovation.

3.2. Methodology

According to a panel of experts who acted as respondents to the Delphi questionnaire, the Delphi method was used to identify the factors that determined the success of process innovation. Researchers previously used the Delphi method to obtain consensus from panelists or experts in their fields, such as construction management research [97], field practice education [98], integrated medicine [99], student recruitment assessments by HR professionals, and how these recruiters nurture the Gen Z/millennial generation [100]. In obtaining answers to the questions given to the panelists, the Delphi method uses repeated iterations. An iteration stops when the panelists reach a consensus, usually lasting up to three iterations [101,102]. Tersine and Riggs [103] devised several stages in the application of the Delphi method: (1) the delivery of the first questionnaire; (2) the provision of additional questionnaires; and (3) the improvement process by considering the weighting factors of the individual panelists. Hsu and Sandford [104] described the process of running the Delphi method in four rounds: (1) the panelists receive open-ended questions and the answers are summarized by the researcher; (2) panelists are asked to review the summary of answers from the first round and then rank the answers according to the individual priorities of the panelists, while the researcher identifies agreements and disagreements among the panelists; (3) panelists are given the results of identification from the previous round and then asked to revise the assessment or determine reasons outside the consensus if there is a discrepancy in opinion with the summary results of the previous round; (4) panelists are given the results of the consensus and are shown the minority opinion. The opportunity to make a final change in judgment may also be given in this round.

3.2.1. Panel Selection

Determining panelists is the most crucial stage in determining the success of the Delphi method [104]. The recommended number of panelists is eight or more [105,106,107]. An expert is someone who is trained [104] has significant experience [108], appropriate knowledge [109], and authority in their field [110]. Furthermore, panelists are required to have the time and willingness to participate until the end of the Delphi round [111]. This study involved 15 panel members consisting of 12 experts who were directors and senior managers of SOEs; one expert was the Director-General of Innovation from the Ministry of Research/BRIN; one was the former Chairman of BPPT (Head of the Agency for the Assessment and Application of Technology) from 2014 to 2019; another was a professor from a university. The 12 panelists (75%) were practitioners who have been actively involved in process innovation activities in SOEs and were expected to provide practical experience. Three other panelists (from ministries and academics) were assigned as keynote speakers who validated panelists’ experiences with the latest literature and regulations. The complete profiles of the panelists are presented in Table 2.

3.2.2. Implementation of the Delphi Method

Researchers invited the panelists to a focus group discussion (FGD) before questionnaire delivery. In the FGD, the researchers conveyed the research objectives and explained the Delphi method procedures. In addition, the researchers also asked the panel members to convey their experiences and knowledge related to process innovations that had been carried out in their respective companies. This was to understand the process innovation problem, i.e., the object of our research. After the FGD was completed, we continued with the first stage of the Delphi method, namely distributing the first questionnaire to the respondents. The first questionnaire was an open question regarding process innovation based on the framework created by [14]. The results of the first stage of the Delphi method were published in a research report by [112].
In Cycles II and III, respondents were asked to choose an answer using a Likert scale of 1 to 5. Consensus analysis and confusion analysis [113] were used to examine respondents’ consensus about the factors that determine the success of an innovation process. In principle, consensus analysis and confusion analysis are performed by calculating respondent answers’ mean and standard deviation. Three cycles of the questionnaire were expected to be sufficient to gain consensus among the respondents regarding the factors influencing the success of process innovation. The heterogeneity of respondents gives rise to advantages and disadvantages. An advantage is that because respondents have different backgrounds, they have different challenges and experiences, so the answers to the questions are also different. Respondents with a cement industry background have different challenges and experiences from respondents with a railway industry background and those with a service industry background. With this, the authors could obtain various information about the factors that influence the success of innovation processes in different industries. On the other hand, the heterogeneity of respondents also creates a weakness, namely that the research cannot produce conclusions for SOEs in specific industries. Therefore, care must be exercised in designing the questionnaire, conducting the analysis, and drawing the study’s conclusions.

4. Results

Consensus in selecting factors that influence the success of process innovation is obtained by looking at the mean and standard deviation of the assessments given by the respondents. The respondents’ assessments of the factors that influence the success of process innovation were in the range of values from 3.83 to 4.92, with an average of 4.46 (full scale—5). These results indicated that all the factors proposed by the respondents in the first stage of the Delphi method were considered quite important to very important. The standard deviation of the respondents’ assessments were in the range of 0.28 to 1.11, with an average of 0.55. This value is relatively small and indicates that the level of agreement among the respondents was sizeable. An analytical model was used to achieve consensus, and a rate of 70% (Cronbach’s Alpha = 0.70) was adopted as a minimum consensus level [114,115] and Quartile value as in the research conducted by [113]. Cronbach’s Alpha values for all indicators exceeded the established standard of 70%, and the value interval is between 71.9–86.8%, indicating the consensus of the panelists for all indicators. Factors that had a mean value above the upper limit of quartile 3 (Q3) with a standard deviation value below the lower limit of quartile 1 (Q1) were considered the result of consensus of success factors among the panelists. The calculation results for achieving consensus can be seen in Table 3, Table 4, Table 5, Table 6, Table 7, Table 8, Table 9, Table 10, Table 11 and Table 12.

5. Discussion

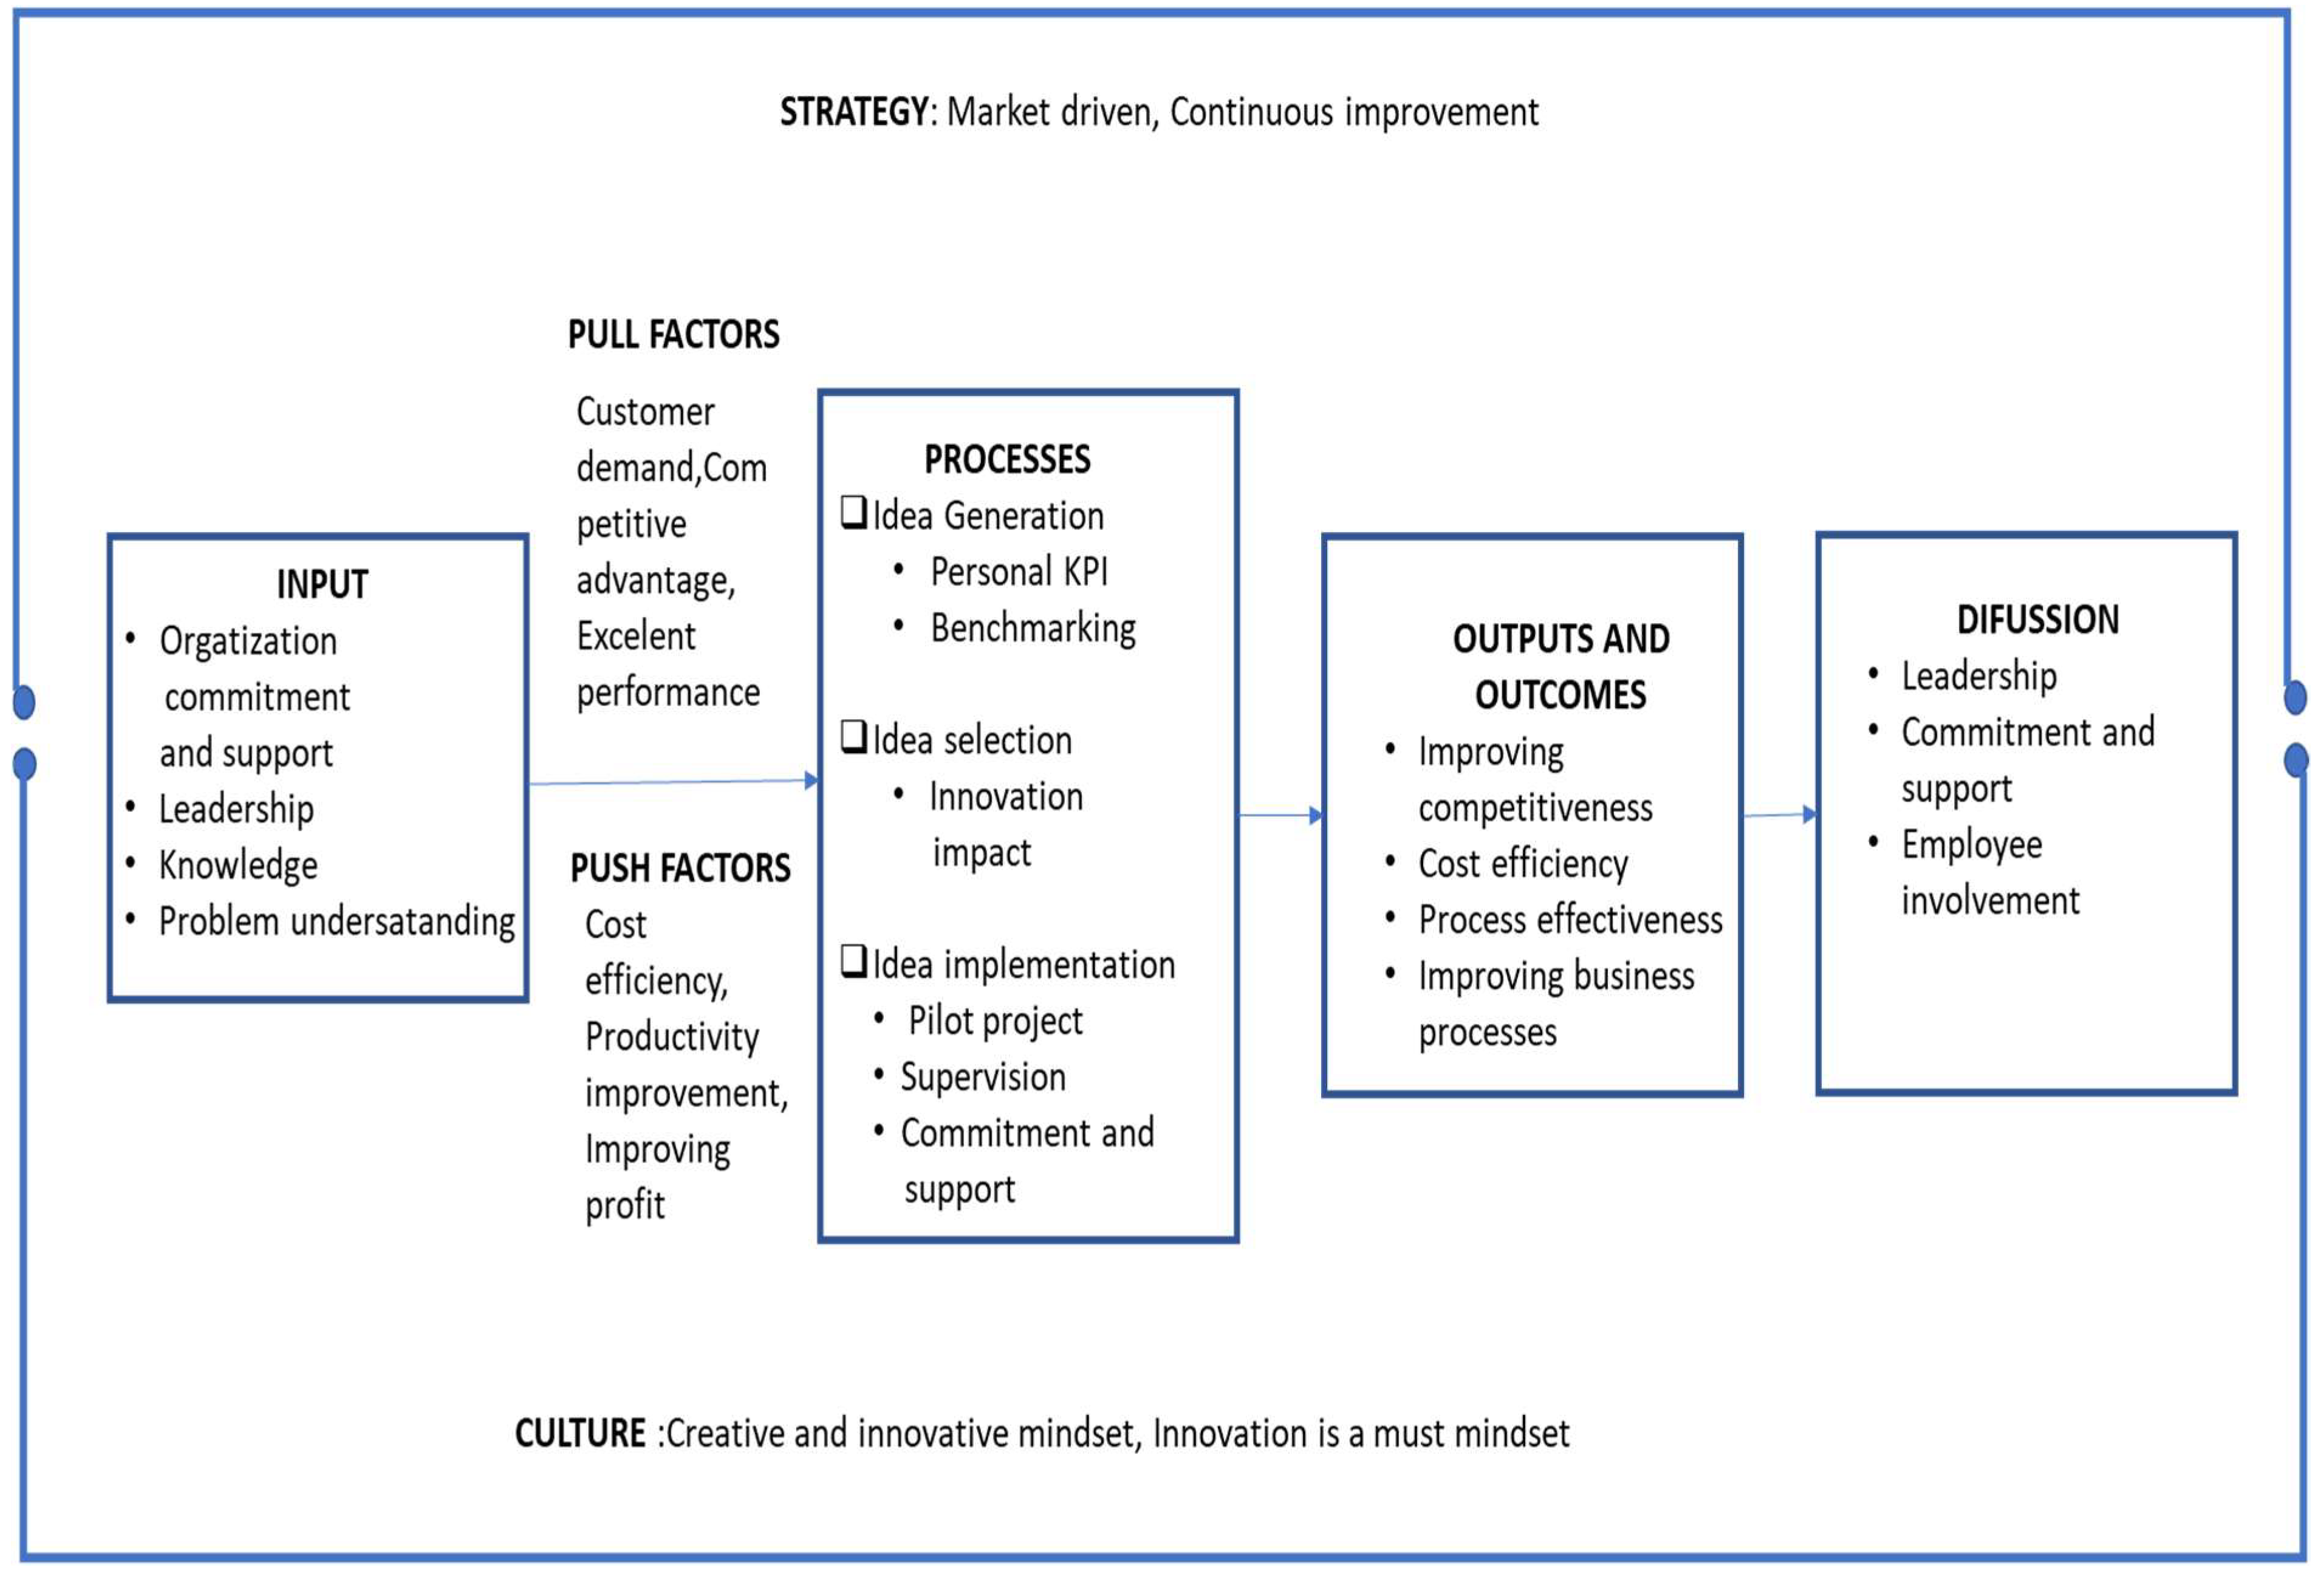
In summary, the conclusions regarding the speakers’ overview related to the success factors in the implementation of process innovation are shown in Figure 2 below. There were 28 success factors collected from the ten indicators used by the researchers. The researchers restructured the conclusions after conducting another discussion with the speakers related to the analysis results in Table 3, Table 4, Table 5, Table 6, Table 7, Table 8, Table 9, Table 10, Table 11 and Table 12. From the discussion, we agreed that there were four leading indicators in the success of process innovation in SOEs: indicators of input, process, outputs and outcomes, and diffusion indicators. Other critical supporting indicators at a more strategic level included strategy, culture, and push and pull factors. The idea and knowledge management indicator eventually became one of the success factors in the input indicator. We agreed that the existence of a knowledge management system was considered an obligation. In other words, companies that are successful in innovation must invest in creating a knowledge management system. Several researchers in the literature we obtained stated that an ICT budget is one of the most critical innovation inputs [73,86,88].
The success of process innovation in SOE input indicators—according to the results of the analysis in Table 3—include organizational culture, organizational support and commitment, and employee understanding of company problems. This is different from the findings gathered by previous researchers, who stated that the R&D budget was the most critical factor. Our experts also compared the operational unit with the higher innovation culture, such as more innovation proposals than other units. The ratio is approximately two to six each year.
This statement shows that organizational culture contributes significantly to a climate of innovation. This is indicated by the higher level of employee involvement in innovation activities in companies with a good innovation culture than in those with a poor innovation culture. This is in line with a statement by [116], which argues that innovation culture can increase innovation capability. Menzel et al. [117] also stated that an excellent organizational culture could encourage increased employee innovation in implementing new ideas. Specifically in the manufacturing industry, Ali et al. [118] stated that companies with good organizational culture must also implement Total Quality Management (TQM) and Supply Chain Management (SCM) to obtain process innovation. TQM is used to build and maintain commitment from leaders and employees to realize innovation [119].
At the beginning of employee recruitment, HR introduces a culture of innovation and innovation achievements created by the company and provides information on how innovation dramatically affects employees’ career development. Na [120] suggests that the early recruitment period is the most appropriate time to instill an innovation mindset. This is performed to maintain and improve a company’s innovation culture and instill an innovation mindset in employees. In line with this, Table 9 lists additional success factors: creative and innovative mindset on cultural indicators. A creative and innovative mindset should also be encouraged at an early stage. When employees are introduced and adapt to standard operating procedures (SOPs), a company can give advice/suggestions to its employees to make operational improvements. Ultimately, the improvements made will make it easier for employees to complete the work themselves.
In selecting the innovation strategy, the experts obtained consensus on two strategies: market-driven and continuous improvement. A comprehensive understanding of market needs is the primary source of inspiration for innovation. Gonzhales-Sanches et al. [121] stated that the market is the primary source of external knowledge in obtaining an innovation. Medne and Lapina [122] found that companies that develop with a focus on sustainability and continuous improvement can create a good innovation environment. Employees will be familiar with the continuous improvement process, so they will be more confident in producing innovation.
The support and commitment of a company’s management are the main factors that mobilize employees in innovation activities, and they create a suitable climate for culturing innovation. Zaman et al. [123] found that transformational leadership determines the success of innovation. Support and commitment are not always in the form of providing an R&D budget but can also be characterized by, for example, company leaders’ willingness to seek innovation implementations [124]. Support for developing specific skills of subordinates also results in innovative behavior [125]. Management at all levels can involve actively in the innovation management structure. The leader in the work unit with the highest number of employees could become the driver of innovation. This leader could encourage all employees to innovate actively so that innovation output will be high. Usually, the company’s most prominent expenditure also comes from these work units; if they could innovate and achieve better cost efficiency, then it will have a significant impact on the company’s expenditure.
Management support and commitment also apply to other indicators, such as during the innovation implementation process and the diffusion stage of the resulting innovations (Table 6 and Table 8). In the opinion of the experts, each level of management has a responsibility and is actively involved in the entire innovation process. All levels of management form a coordination chain in innovation management to ensure the implementation of innovative programs in their respective work units. As leaders, managers must explore solutions and ideas from subordinates to then realize how these ideas produce innovations. As stated by [126], innovation is the result of successful leadership. In a horizontal coordination chain, leaders can often diffuse innovation results through other leaders. This is achieved through the functional synchronization of work to facilitate the process of changes in operating activities. Companies can create an integrated innovation management system from the early stage to the diffusion stage of innovation management as a form of commitment to innovation. All employees can contribute their innovation ideas by registering them through the system in the initial stage. The idea can be verified by the leader in each work unit and then realized with a pilot project. Through this innovation management system, work unit leaders can also directly evaluate the innovation performance of subordinates. In doing so, the leadership also actively participates in maintaining the company’s innovation culture.
Employees’ understanding of company problems is one of the most influential factors in the innovation process. Ettlie and Reza [127] stated that process innovation requires more company-specific knowledge, which is the primary source of knowledge for employees. This is then compared with the implementation of product innovation; Guo et al. [128] found that higher and more thorough knowledge is needed for process innovation than for product innovation.
In the idea generation stage, three main factors influence innovation success: strategy, employee personal KPIs (Key Performance Indicators), and benchmarking. An innovation strategy must be clearly stated so that all employees are aware of their company’s development and improvement needs. Skordoulis et al. [129] confirmed the importance of an integrated innovation strategy with contemporary corporate strategies. In addition, mentoring and coaching programs have a high average expert rating but slightly below the standard deviation. This finding supports the statement of Rosa and Lace [130] that coaching supports the creation of an innovative environment in a company.
With the imposition of innovation KPIs on employees (transparent measurement) comes an awareness of the need for new ideas in company efficiency and new product development [131]. Personal or individual KPIs are part of annual employee appraisals. Companies usually use these indicators to determine the acceleration of promotions, salary increases, benefits, and other incentive bonuses. Several companies use the notion of an innovation KPI as a condition for promotion and an increase in the annual benefits and bonuses that employees receive.
Benchmarking is one of seven strategies for generating ideas in innovation [132]. A company conducts benchmarking to compare how work practices in innovation management might be compared to examples of innovation implementation in other companies. Several informants provided information that their company is often the benchmark destination for other SOEs.
Dziallas and Blind [133] stated that an innovative idea needs to be evaluated to observe its potential for future success. In the idea selection stage, the success factors for process innovation and an assessment of the impact of the process innovation to be carried out are obtained. While Arpaci [90] suggests that all good ideas must be realized, a limited budget and resources may force a company to determine which ideas are more feasible to implement. In addition, companies must also prepare for changes in management because of systematic innovation.
At the stage of implementing ideas to produce innovations, success factors include the need for pilot projects, good supervision from facilitators (managers) and previous innovation implementers, and commitment and support from company management. Before companies spend large amounts of money implementing innovations, a pilot project should be tested. A pilot would also require a smaller budget [134]. Companies should also receive sufficient time to anticipate potential resistance and prepare for systemic changes in management.
Many studies have shown that innovation winners can positively impact the sustainability of project innovation [135,136,137,138,139]. The implementation of this mentoring program is a form of support and commitment from management to create sustainable innovation. As stated by our resource expert, the presence of innovation facilitators can provide inspiration and guidance to other employees in carrying out innovation projects. Therefore, several innovation projects can run in parallel and may even synergize. In addition, investment in a computerized innovation management system can make it easier for innovators to develop their concepts.
Our findings regarding the outputs and outcomes indicators are generally similar to previous studies [8,91,92,93,95,140], showing that the primary goal of process innovation is to achieve lower costs and process effectiveness while increasing productivity. Furthermore, our informants made a similar conclusion about the innovation results, namely that they can develop a company’s business processes and increase its competitiveness. This is the main push and pulls factor for implementing process innovation in each company.
This study has some critical theoretical implications related to the factors that determine the successful implementation of process innovation. First, the primary inputs of process innovation in SOEs are human resource and organizational factors such as leadership, strategy, and culture. These findings are different from the previous research that stated the R&D budget as the main input in the innovation process, although Oudgou [87] stated that every company must pay attention to investment in R&D to produce product innovation or process innovation. Second, another essential factor in the innovation process of SOEs is the computerization of the innovation management system. This finding supports the new research of ICT’s role in innovation. This study contributes to the practical implementation of the innovation process in SOEs, especially in managing the innovation. This study shows that the most essential factor in all stages of innovation management is the support and commitment from the company leader. A company should regularly measure the output of innovation and communicate it to all employees. The leader can implement innovations as a key performance indicator of individuals to trigger their innovation mindset. The commitment of leaders to evaluate and give feedback regularly on the implementation of innovation can increase the output of innovation. Employee annual rewards and promotions could be based on the achievement of key performance indicators related to the implementation of innovation. They could show the leader’s support to employees that have good performance on innovation.

6. Conclusions

The Delphi method used in this study made it possible for experts who were often involved in implementing process innovations in state-owned companies to reach joint conclusions. Some research findings align with the literature reviewed, while some are different. An R&D budget, which is often used as an input factor in innovation by some researchers, was not an essential factor in the success of process innovation in our research results. While it appeared in the process indicators, it did not represent the most crucial factor for innovation in the minds of the experts consulted in this study. Our panelists believed that human resources and organizational factors, such as leadership, problem understanding, strategy, and culture, influenced success in process innovation more than R&D budget factors. The organizational culture that must be instilled in all employees is innovative thinking, in which all employees are encouraged to find a new way that is more effective and efficient in overcoming problems. Regularly evaluating the previous implementation of innovation programs will strengthen the innovation culture. It is also necessary for the company to notice market trends and use them to develop the business plan. However, support and commitment from a given company was the most common factor that emerged from the overall indicators related to successful process innovations. This is an important finding for the management of SOEs eager to improve company innovation performance, especially in process innovation. Cost efficiency was the main factor driving companies’ motivation to implement process innovation. Cost efficiency was still the main factor in the output of process innovation. Interestingly, an ICT-based management system for facilitating innovation processes was not selected as an essential factor at the beginning of the analysis. However, this factor is essential based on the panelists’ final discussion and feedback sessions, in which they agreed that companies need an ICT-based management system to facilitate innovation processes. Such a system should include knowledge management and innovative idea collection systems. The change in conclusions indicates that the Delphi method is more flexible when it comes to obtaining a unity of opinion, despite its appearing less consistent than more conventional approaches.

7. Limitations and Further Research

While the results of our study are exciting and highly useful for stakeholders in SOEs, there were some limitations. First, not all SOE sectors were involved as panelists in this study. Most of the panelists came from companies based in the manufacturing and technology business sectors; thus, they had more experience in implementing technological than organizational process innovation. Furthermore, the present research only involved panelists from leading SOEs; thus, other SOEs may have experience related to process innovation that has not yet been published. The researchers realize that this research is an initial exploration of process innovation at the organizational (strategic) level. It is necessary to conduct a more detailed review at each implementation stage in a process innovation project. In future research, we plan to use indicators of the success of process innovation to assess the performance of process innovation in several state-owned companies. In conclusion, SOEs can evaluate the implementation of innovation to ensure its sustainability.

Author Contributions

Conceptualization, methodology, P.S.; software, I.K.G. and A.E.P.; validation, P.S.; writing—original draft preparation, A.E.P. and N.A.W.; review and editing, P.S. and N.A.W.; supervision, P.S.; project administration, N.A.W. and L.Y. All authors have read and agreed to the published version of the manuscript.

Funding

This research was funded by the Ministry of Research and Technology/National Research and Innovation Agency Republic of Indonesia, grant number 8/E1/KPT/2021.

Institutional Review Board Statement

The study was conducted in accordance with the Declaration of Helsinki, and approved by the Ethics Committee of KEP Institut Teknologi Sepuluh Nopember (protocol code 2747/IT2.IV.1/B/TU.00.09/2022.

Informed Consent Statement

Informed consent was obtained from all subjects involved in the study.

Data Availability Statement

Not applicable.

Acknowledgments

We would like to thank the anonymous reviewers, for their valuable and helpful comments. Finally, we acknowledge support from the Department of Industrial and Systems Engineering, Institut Teknologi Sepuluh Nopember.

Conflicts of Interest

Declare conflicts of interest or state, The authors declare no conflict of interest.

References

  1. Im, B.; Lee, K. From Catching Up to Convergence of the Latecomer Firms: Comparing Behavior and Innovation Systems of Firms in Korea and the US. J. Open Innov. Technol. Mark. Complex. 2021, 7, 191. [Google Scholar] [CrossRef]
  2. Atalay, M.; Anafarta, N.; Sarvan, F. The Relationship between Innovation and Firm Performance: An Empirical Evidence from Turkish Automotive Supplier Industry. Procedia-Soc. Behav. Sci. 2013, 75, 226–235. [Google Scholar] [CrossRef] [Green Version]
  3. Prajogo, D. The Relationship between Innovation and Business Performance—A Comparative Study between Manufacturing and Service Firms. Knowl. Process Manag. 2006, 13, 218–225. [Google Scholar] [CrossRef]
  4. Subramanian, A.; Nilakanta, S. Organizational Innovativeness: Exploring the Relationship between Organizational Determinants of Innovation, Types of Innovations, and Measures of Organizational Performance. Omega 1996, 24, 631–647. [Google Scholar] [CrossRef]
  5. Pranoto, T. Holding Company BUMN: Konsep, Implementasi, Dan Benchmarking; Lembaga Management, Fakultas Ekonomi dan Bisnis, Universitas Indonesia: Jakarta, Indonesia, 2017. [Google Scholar]
  6. Alexander, A.T.; Childe, S.J. Innovation: A Knowledge Transfer Perspective. Prod. Plan. Control 2013, 24, 208–225. [Google Scholar] [CrossRef]
  7. van de Vrande, V.; de Jong, J.P.J.; Vanhaverbeke, W.; de Rochemont, M. Open Innovation in SMEs: Trends, Motives and Management Challenges. Technovation 2009, 29, 423–437. [Google Scholar] [CrossRef] [Green Version]
  8. Un, C.A.; Asakawa, K. Types of R&D Collaborations and Process Innovation: The Benefit of Collaborating Upstream in the Knowledge Chain. J. Prod. Innov. Manag. 2015, 32, 138–153. [Google Scholar] [CrossRef]
  9. Prakoso, J.P. Pemerintah Dorong Sinergi BUMN Menggunakan Muatan Lokal Dalam Industri Kereta Api. 2018. Available online: https://ekonomi.bisnis.com/read/20180119/98/728295/pemerintah-dorong-sinergi-bumn-menggunakan-muatan-lokal-dalam-industri-kereta-api (accessed on 17 April 2022).
  10. Mathrani, S.; Edwards, B. Knowledge-Sharing Strategies in Distributed Collaborative Product Development. J. Open Innov. Technol. Mark. Complex. 2020, 6, 194. [Google Scholar] [CrossRef]
  11. Tajudeen, F.P.; Jaafar, N.I.; Sulaiman, A. External Technology Acquisition and External Technology Exploitation: The Difference of Open Innovation Effects. J. Open Innov. Technol. Mark. Complex. 2019, 5, 97. [Google Scholar] [CrossRef] [Green Version]
  12. Nyamoita, A.O. The Effect of Process Innovation on Financial Performance in Utility Companies in Kenya. Master’s Thesis, University of Nairobi, Nairobi, Kenya, 2015. [Google Scholar]
  13. Na, K.; Kang, Y.-H. Relations between Innovation and Firm Performance of Manufacturing Firms in Southeast Asian Emerging Markets: Empirical Evidence from Indonesia, Malaysia, and Vietnam. J. Open Innov. Technol. Mark. Complex. 2019, 5, 98. [Google Scholar] [CrossRef] [Green Version]
  14. Dulkeith, E.; Schepurek, S. Innovation Performance Measurement: Assessing and Driving the Innovation Performance of Companies. 2013. Available online: https://www.academia.edu/28081552/We_make_ICT_strategies_work?auto=download (accessed on 17 April 2022).
  15. Knight, K.E. A Descriptive Model of the Intra-Firm Innovation Process. J. Bus. 1967, 40, 478. [Google Scholar] [CrossRef]
  16. Daft, R.L. Bureaucratic versus Nonbureaucratic Structure and the Process of Innovation and Change. Res. Sociol. Organ. 1982, 1, 129–166. [Google Scholar]
  17. Damanpour, F.; Evan, W.M. Organizational Innovation and Performance: The Problem of “Organizational Lag”. Adm. Sci. Q. 1984, 29, 392. [Google Scholar] [CrossRef]
  18. Damanpour, F. Organizational Size and Innovation. Organ. Stud. 1992, 13, 375–402. [Google Scholar] [CrossRef]
  19. Aiken, M.; Hage, J. The Organic Organization and Innovation. Sociology 1971, 5, 63–82. [Google Scholar] [CrossRef]
  20. Zaltman, G.; Holbek, J.; Duncan, R. Innovations and Organizations; John Wiley & Sons: New York, NY, USA, 1973. [Google Scholar]
  21. Walker, R.M. An Empirical Evaluation of Innovation Types and Organizational and Environmental Characteristics: Towards a Configuration Framework. J. Public Adm. Res. Theory 2007, 18, 591–615. [Google Scholar] [CrossRef]
  22. Damanpour, F.; Walker, R.M.; Avellaneda, C.N. Combinative Effects of Innovation Types and Organizational Performance: A Longitudinal Study of Service Organizations. J. Manag. Stud. 2009, 46, 650–675. [Google Scholar] [CrossRef]
  23. Rogers, E.M. Diffusion of Innovation, 4th ed.; Free Press: London, UK, 2010. [Google Scholar]
  24. Becker, S.W.; Whisler, T.L. The Innovative Organization: A Selective View of Current Theory and Research. J. Bus. 1967, 40, 462. [Google Scholar] [CrossRef]
  25. Bingham, R.D.; McNaught, T.P. The Adoption of Innovation by Local Government; Lexington Books: Lanham, MD, USA, 1976. [Google Scholar]
  26. OECD/Eurostat. Oslo Manual 2018: Guidelines for Collecting, Reporting and Using Data on Innovation, 4th ed.; The Measurement of Scientific, Technological and Innovation Activities; OECD Publishing: Paris, France; Eurostat: Luxembourg, 2018. [Google Scholar]
  27. OECD/Eurostat. Oslo Manual: Guidelines for Collecting and Interpreting Innovation Data, 3rd ed.; The Measurement of Scientific and Technological Activities; OECD Publishing: Paris, France, 2005. [Google Scholar]
  28. Baregheh, A.; Rowley, J.; Sambrook, S. Towards a Multidisciplinary Definition of Innovation. Manag. Decis. 2009, 47, 1323–1339. [Google Scholar] [CrossRef]
  29. Robinson, J. Squaring the Circle? Some Thoughts on the Idea of Sustainable Development. Ecol. Econ. 2004, 48, 369–384. [Google Scholar] [CrossRef]
  30. Department for Business, I. & S. Innovation and Research Strategy for Growth; The Stationery Office: London, UK, 2011; Volume 8239. [Google Scholar]
  31. Dictionary, Merriam-Webster. Available online: www.merriam-webster.com/dictionary/apology (accessed on 30 July 2021).
  32. Silvestre, B.S.; Ţîrcă, D.M. Innovations for Sustainable Development: Moving toward a Sustainable Future. J. Clean. Prod. 2019, 208, 325–332. [Google Scholar] [CrossRef]
  33. Hewings, G.J.D.; Sonis, M.; Jensen, R.C. Technical Innovation and Input-Output Analysis. In Information Technology: Social and Spatial Perspectives; Springer: Berlin, Germany; Heidelberg, Germany, 1988; pp. 163–194. [Google Scholar]
  34. McWilliams, A.; Siegel, D. Corporate Social Responsibility: A Theory of the Firm Perspective. Acad. Manag. Rev. 2001, 26, 117–127. [Google Scholar] [CrossRef]
  35. Dawson, P.; Daniel, L. Understanding Social Innovation: A Provisional Framework. Int. J. Technol. Manag. 2010, 51, 9. [Google Scholar] [CrossRef]
  36. Morais, D.O.C.; Silvestre, B.S. Advancing Social Sustainability in Supply Chain Management: Lessons from Multiple Case Studies in an Emerging Economy. J. Clean. Prod. 2018, 199, 222–235. [Google Scholar] [CrossRef]
  37. Beise, M.; Rennings, K. Lead Markets and Regulation: A Framework for Analyzing the International Diffusion of Environmental Innovations. Ecol. Econ. 2005, 52, 5–17. [Google Scholar] [CrossRef]
  38. Yenipazarli, A. To Collaborate or Not to Collaborate: Prompting Upstream Eco-Efficient Innovation in a Supply Chain. Eur. J. Oper. Res. 2017, 260, 571–587. [Google Scholar] [CrossRef]
  39. Chen, Y.-S.; Lai, S.-B.; Wen, C.-T. The Influence of Green Innovation Performance on Corporate Advantage in Taiwan. J. Bus. Ethics 2006, 67, 331–339. [Google Scholar] [CrossRef]
  40. Uyarra, E.; Shapira, P.; Harding, A. Low Carbon Innovation and Enterprise Growth in the UK: Challenges of a Place-Blind Policy Mix. Technol. Forecast. Soc. Chang. 2016, 103, 264–272. [Google Scholar] [CrossRef]
  41. Klewitz, J.; Hansen, E.G. Sustainability-Oriented Innovation of SMEs: A Systematic Review. J. Clean. Prod. 2014, 65, 57–75. [Google Scholar] [CrossRef]
  42. Adams, R.; Jeanrenaud, S.; Bessant, J.; Denyer, D.; Overy, P. Sustainability-Oriented Innovation: A Systematic Review. Int. J. Manag. Rev. 2016, 18, 180–205. [Google Scholar] [CrossRef]
  43. Edgeman, R.; Eskildsen, J. Social-Ecological Innovation. In Encyclopedia of Business Analytics and Optimization; IGI Global: Hershey, PA, USA, 2014; pp. 2231–2241. [Google Scholar]
  44. Wagner, M. Links Between Sustainability-Related Innovation and Sustainability Management; Humboldt-Universität zu Berlin: Berlin, Germany, 2008. [Google Scholar]
  45. Wüstenhagen, R. Sustainable Innovation and Entrepreneurship; Edward Elgar Publishing: Cheltenham, UK, 2008. [Google Scholar]
  46. Hall, J. Sustainable Development Innovation; a Research Agenda for the next 10 Years Editorial for the 10th Anniversary of the Journal of Cleaner Production. J. Clean. Prod. 2002, 10, 195–196. [Google Scholar] [CrossRef]
  47. Rennings, K. Towards a Theory and Policy of Eco-Innovation-Neoclassical and (Co-)Evolutionary Perspectives; ZEW Discussion Pappers No. 98-24; Zentrum für Europäische Wirtschaftsforschung (ZEW): Mannheim, Germany, 1998. [Google Scholar]
  48. Lopez, J. Types of Innovation. Available online: https://techblog.constantcontact.com/software-development/types-of-innovation/ (accessed on 30 July 2021).
  49. Pisano, G.P. You Need an Innovation Strategy. Harv. Bus. Rev. 2015, 93, 44–54. [Google Scholar]
  50. Kulakauskaite, I. Goals: How to Define and Reach Your Innovation Goals. Available online: https://ideadrop.co/innovation-strategy/how-to-reach-innovation-goals/ (accessed on 30 July 2021).
  51. Chesbrough, H. Open Innovation: The New Imperative for Creating and Profiting from Technology; Harvard Business Press: Boston, MA, USA, 2003. [Google Scholar]
  52. Ali, M.A.; Hussin, N.; Haddad, H.; Al-Araj, R.; Abed, I.A. A Multidimensional View of Intellectual Capital: The Impact on Innovation Performance. J. Open Innov. Technol. Mark. Complex. 2021, 7, 216. [Google Scholar] [CrossRef]
  53. Pretorius, J.; Magee, C. Observations on Collaborative Practices and Relative Success of Small Technology-Innovating Firms Supported by the US SBIR Initiative. Int. J. Entrep. Innov. Manag. 2005, 5, 4–19. [Google Scholar] [CrossRef]
  54. Christensen, J.F.; Olesen, M.H.; Kjær, J.S. The Industrial Dynamics of Open Innovation—Evidence from the Transformation of Consumer Electronics. Res. Policy 2005, 34, 1533–1549. [Google Scholar] [CrossRef]
  55. Enkel, E.; Gassmann, O.; Chesbrough, H. Open R&D and Open Innovation: Exploring the Phenomenon. RD Manag. 2009, 39, 311–316. [Google Scholar] [CrossRef]
  56. Gassmann, O.; Enkel, E.; Chesbrough, H. The Future of Open Innovation. RD Manag. 2010, 40, 213–221. [Google Scholar] [CrossRef]
  57. Das, T.K.; Kumar, R. Regulatory Focus and Opportunism in the Alliance Development Process. J. Manag. 2011, 37, 682–708. [Google Scholar] [CrossRef]
  58. Martínez-Noya, A.; García-Canal, E. The Framing of Knowledge Transfers to Shared R&D Suppliers and Its Impact on Innovation Performance: A Regulatory Focus Perspective. RD Manag. 2016, 46, 354–368. [Google Scholar] [CrossRef]
  59. Edquist, C. The Systems of Innovation Approach and Innovation Policy: An Account of the State of the Art. In Proceedings of the DRUID Conference, Aalborg, Denmark, 12–15 June 2001. [Google Scholar]
  60. Damanpour, F. The Adoption of Technological, Administrative, and Ancillary Innovations: Impact of Organizational Factors. J. Manag. 1987, 13, 675–688. [Google Scholar] [CrossRef]
  61. Light, P.C. Sustaining Innovation: Creating Nonprofit and Government Organizations That Innovate Naturally; Jossey-Bass: Hoboken, NJ, USA, 1998. [Google Scholar]
  62. Borins, S. Innovating with Integrity: How Local Heroes Are Transforming American Government; Georgetown University Press: Washington, DC, USA, 1998. [Google Scholar]
  63. Armbruster, H.; Bikfalvi, A.; Kinkel, S.; Lay, G. Organizational Innovation: The Challenge of Measuring Non-Technical Innovation in Large-Scale Surveys. Technovation 2008, 28, 644–657. [Google Scholar] [CrossRef]
  64. Teece, D.J. Technology Transfer by Multinational Firms: The Resource Cost of Transferring Technological Know-How. In Essays in Technology Management and Policy; World Scientific: Singapore, 2003; pp. 262–288. [Google Scholar]
  65. Milewski, S.K.; Fernandes, K.J.; Mount, M.P. Exploring Technological Process Innovation from a Lifecycle Perspective. Int. J. Oper. Prod. Manag. 2015, 35, 1312–1331. [Google Scholar] [CrossRef] [Green Version]
  66. Köhne, H.-L.; Sawyer, A. Process Innovation: Requirements and Opportunities. Eur. J. Manag. Issues 2018, 26, 22–28. [Google Scholar] [CrossRef] [Green Version]
  67. Walker, R.M. Internal and External Antecedents of Process Innovation: A Review and Extension. Public Manag. Rev. 2014, 16, 21–44. [Google Scholar] [CrossRef]
  68. Linton, J.D.; Walsh, S.T. A Theory of Innovation for Process-Based Innovations Such as Nanotechnology. Technol. Forecast. Soc. Chang. 2008, 75, 583–594. [Google Scholar] [CrossRef]
  69. Altinkemer, K.; Ozcelik, Y.; Ozdemir, Z.D. Productivity and Performance Effects of Business Process Reengineering: A Firm-Level Analysis. J. Manag. Inf. Syst. 2011, 27, 129–162. [Google Scholar] [CrossRef] [Green Version]
  70. Lampe, H.W. Municipalities’ Willingness to Adopt Process Innovations: Evidence for Higher Cost-Efficiency. Local Gov. Stud. 2017, 43, 707–730. [Google Scholar] [CrossRef]
  71. Tarafdar, M.; Gordon, S.R. Understanding the Influence of Information Systems Competencies on Process Innovation: A Resource-Based View. J. Strateg. Inf. Syst. 2007, 16, 353–392. [Google Scholar] [CrossRef]
  72. Trantopoulos, K.; von Krogh, G.; Wallin, M.W.; Woerter, M. External Knowledge and Information Technology: Implications for Process Innovation Performance. MIS Q. 2017, 41, 287–300. [Google Scholar] [CrossRef] [Green Version]
  73. Ashok, M.; Narula, R.; Martinez-Noya, A. How Do Collaboration and Investments in Knowledge Management Affect Process Innovation in Services? J. Knowl. Manag. 2016, 20, 1004–1024. [Google Scholar] [CrossRef]
  74. Hall, B.; Helmers, C.; Rogers, M.; Sena, V. The Choice between Formal and Informal Intellectual Property: A Literature Review. J. Econ. Lit. 2014, 52, 375–423. [Google Scholar] [CrossRef] [Green Version]
  75. Kuczmarski, T.D. Measuring Your Return on Innovation. Mark. Manag. Chic. 2020, 9, 24–32. [Google Scholar]
  76. Tin, K.L. Measuring Innovation Performance; Information Services Division, National Library Board: Singapore, 2005. [Google Scholar]
  77. Birchall, D.; Chanaron, J.J.; Tovstiga, G.; Hillenbrand, C. Innovation Performance Measurement: Current Practices, Issues and Management Challenges. Int. J. Technol. Manag. 2011, 56, 1–20. [Google Scholar] [CrossRef]
  78. Ivanov, C.-I.; Avasilcăi, S. Performance Measurement Models: An Analysis for Measuring Innovation Processes Performance. Procedia-Soc. Behav. Sci. 2014, 124, 397–404. [Google Scholar] [CrossRef] [Green Version]
  79. Sterlacchini, A. Inputs And Outputs of Innovative Activities In Italian Manufacturing. Econ. Innov. N. Technol. 1998, 7, 323–344. [Google Scholar] [CrossRef]
  80. Almeida, R.; Fernandes, A.M. Openness and Technological Innovations in Developing Countries: Evidence from Firm-Level Surveys. J. Dev. Stud. 2008, 44, 701–727. [Google Scholar] [CrossRef]
  81. Watanabe, C. Managing Innovation in Japan; Springer: Berlin, Germany; Heidelberg, Germany, 2009; ISBN 978-3-540-89271-7. [Google Scholar]
  82. Malecki, E.J. The Geography of Innovation. In Handbook of Regional Science; Springer: Berlin, Germany; Heidelberg, Germany, 2014; pp. 375–389. [Google Scholar]
  83. Song, C.; Oh, W. Determinants of Innovation in Energy Intensive Industry and Implications for Energy Policy. Energy Policy 2015, 81, 122–130. [Google Scholar] [CrossRef]
  84. Guarascio, D.; Tamagni, F. Persistence of Innovation and Patterns of Firm Growth. Res. Policy 2019, 48, 1493–1512. [Google Scholar] [CrossRef] [Green Version]
  85. Möldner, A.K.; Garza-Reyes, J.A.; Kumar, V. Exploring Lean Manufacturing Practices’ Influence on Process Innovation Performance. J. Bus. Res. 2020, 106, 233–249. [Google Scholar] [CrossRef]
  86. Zhu, F.; Li, Q.; Yang, S.; Balezentis, T. How ICT and R & D Affect Productivity? Firm Level Evidence for China. Econ. Res.-Ekon. Istraž. 2021, 34, 3468–3486. [Google Scholar] [CrossRef]
  87. Oudgou, M. Financial and Non-Financial Obstacles to Innovation: Empirical Evidence at the Firm Level in the MENA Region. J. Open Innov. Technol. Mark. Complex. 2021, 7, 28. [Google Scholar] [CrossRef]
  88. Arvanitis, S.; Loukis, E. Reduction of ICT Investment Due to the 2008 Economic Crisis and ICT-Enabled Innovation Performance of Firms. J. Knowl. Econ. 2020, 11, 1–27. [Google Scholar] [CrossRef]
  89. Jin, S.; Lee, K. The Government R & D Funding and Management Performance: The Mediating Effect of Technology Innovation. J. Open Innov. Technol. Mark. Complex. 2020, 6, 94. [Google Scholar]
  90. Arpaci, İ. E-government and Technological Innovation in Turkey. Transform. Gov. People Process Policy 2010, 4, 37–53. [Google Scholar] [CrossRef]
  91. Boer, H.; During, W.E. Innovation, What Innovation? A Comparison between Product, Process and Organisational Innovation. Int. J. Technol. Manag. 2001, 22, 83. [Google Scholar] [CrossRef]
  92. Nieto, M.J.; Santamaría, L. Technological Collaboration: Bridging the Innovation Gap between Small and Large Firms. J. Small Bus. Manag. 2010, 48, 44–69. [Google Scholar] [CrossRef] [Green Version]
  93. Classen, N.; Carree, M.; van Gils, A.; Peters, B. Innovation in Family and Non-Family SMEs: An Exploratory Analysis. Small Bus. Econ. 2014, 42, 595–609. [Google Scholar] [CrossRef]
  94. Chiesa, V.; Frattini, F.; Lazzarotti, V.; Manzini, R. Performance Measurement in R&D: Exploring the Interplay between Measurement Objectives, Dimensions of Performance and Contextual Factors. RD Manag. 2009, 39, 487–519. [Google Scholar] [CrossRef]
  95. Kirner, E.; Som, O.; Jäger, A. Innovation Strategies and Patterns of Non-R&D-Performing and Non-R&D-Intensive Firms. In Low-tech Innovation; Springer International Publishing: Cham, Switzerland, 2015; pp. 91–111. [Google Scholar]
  96. Harms, R.; Luck, F.; Kraus, S.; Walsh, S. On the Motivational Drivers of Gray Entrepreneurship: An Exploratory Study. Technol. Forecast. Soc. Chang. 2014, 89, 358–365. [Google Scholar] [CrossRef]
  97. Sourani, A.; Sohail, M. The Delphi Method: Review and Use in Construction Management Research. Int. J. Constr. Educ. Res. 2015, 11, 54–76. [Google Scholar] [CrossRef]
  98. Raskin, M.S. The Delphi Study in Field Instruction Revisited: Expert Consensus on Issues and Research Priorities. J. Soc. Work Educ. 1994, 30, 75–89. [Google Scholar] [CrossRef]
  99. Trevelyan, E.G.; Robinson, P.N. Delphi Methodology in Health Research: How to Do It? Eur. J. Integr. Med. 2015, 7, 423–428. [Google Scholar] [CrossRef]
  100. Self, T.T.; Gordon, S.; Jolly, P.M. Talent Management: A Delphi Study of Assessing and Developing GenZ Hospitality Leaders. Int. J. Contemp. Hosp. Manag. 2019, 31, 4126–4149. [Google Scholar] [CrossRef]
  101. Ludwig, B.G. Internationalizing Extension: An Exploration of the Characteristics Evident in a State University Extension System That Achieves Internationalization. Ph.D. Thesis, The Ohio State University, Columbus, OH, USA, 1994. [Google Scholar]
  102. Custer, R.L.; Scarcella, J.A.; Stewart, B.R. The Modified Delphi Technique—A Rotational Modification. J. Career Tech. Educ. 1999, 15, 50–58. [Google Scholar] [CrossRef]
  103. Tersine, R.J.; Riggs, W.E. The Delphi Technique: A Long-Range Planning Tool. Bus. Horiz. 1976, 19, 51–56. [Google Scholar] [CrossRef]
  104. Hsu, C.; Sandford, B. The Delphi Technique: Making Sense of Consensus. Pract. Assess. Res. Eval. 2007, 12, 10. [Google Scholar]
  105. Mitchell, V.-W.; McGoldrick, P.J. The Role of Geodemographics in Segmenting and Targeting Consumer Markets. Eur. J. Mark. 1994, 28, 54–72. [Google Scholar] [CrossRef]
  106. Hallowell, M.R.; Gambatese, J.A. Qualitative Research: Application of the Delphi Method to CEM Research. J. Constr. Eng. Manag. 2010, 136, 99–107. [Google Scholar] [CrossRef]
  107. Weidman, J.E.; Miller, K.R.; Christofferson, J.P.; Newitt, J.S. Best Practices for Dealing with Price Volatility in Commercial Construction. Int. J. Constr. Educ. Res. 2011, 7, 276–293. [Google Scholar] [CrossRef]
  108. Elnasr, E.; Sobaih, A.; Ritchie, C.; Jones, E. Consulting the Oracle? Int. J. Contemp. Hosp. Manag. 2012, 24, 886–906. [Google Scholar] [CrossRef]
  109. Clayton, M.J. Delphi: A Technique to Harness Expert Opinion for Critical Decision-making Tasks in Education. Educ. Psychol. 1997, 17, 373–386. [Google Scholar] [CrossRef]
  110. Simon, H.A. The Shape of Automation for Men and Management; Harper & Row: New York, NY, USA, 1965; Volume 13. [Google Scholar]
  111. Adler, M.; Ziglio, E. Gazing into the Oracle: The Delphi Method and Its Application to Social Policy and Public Health; Jessica Kingsley Publishers: London, UK, 1996. [Google Scholar]
  112. Suwignjo, P.; Gunarta, I.K.; Wessiani, N.A.; Sukoco, B.M.; Prasetyo, A.E.; Yuwana, L. Study on Process Innovation at Indonesia State-Owned Enterprises. In Proceedings of the International Conference on Industrial Engineering and Operations Management, Sao Paulo, Brazil, 5–8 April 2021. [Google Scholar]
  113. Dixon, J.R.; Nanni, A.J.; Vollmann, T.E. New Performance Challenge: Measuring Operations for World-Class Competition; (Irwin/Apics Series in Production Management); McGraw-Hill Professional Publishing: Homewood, CA, USA, 1990. [Google Scholar]
  114. Grant, J.S.; Kinney, M.R. Using the Delphi Technique to Examine the Content Validity of Nursing Diagnoses. Int. J. Nurs. Terminol. Classif. 1992, 3, 12–22. [Google Scholar] [CrossRef] [PubMed]
  115. Vieira, M.A.; da Silver Ohara, C.V.; de Domenico, E.B.L. The Construction and Validation of an Instrument for the Assessment of Graduates of Undergraduate Nursing Courses. Rev. Lat.-Am. Enferm. 2016, 24, e2710. [Google Scholar] [CrossRef] [PubMed] [Green Version]
  116. Bullinger, H.J.; Bannert, M.; Brunswicker, S. Managing Innovation Capability in SMEs. The Fraunhofer Three-Stage Approach; Tech Monitor: London, UK, 2007. [Google Scholar]
  117. Menzel, H.C.; Aaltio, I.; Ulijn, J.M. On the Way to Creativity: Engineers as Intrapreneurs in Organizations. Technovation 2007, 27, 732–743. [Google Scholar] [CrossRef]
  118. Arshad Ali, A.; Mahmood, A.; Ikram, A.; Ahmad, A.; Medne, A.; Lapina, I.; Na, K.; Kang, Y.-H.; Krajcsák, Z.; Tajudeen, F.P.; et al. Configuring the Drivers and Carriers of Process Innovation in Manufacturing Organizations. J. Open Innov. Technol. Mark. Complex. 2019, 6, 154. [Google Scholar] [CrossRef]
  119. Krajcsák, Z. Implementing Open Innovation Using Quality Management Systems: The Role of Organizational Commitment and Customer Loyalty. J. Open Innov. Technol. Mark. Complex. 2019, 5, 90. [Google Scholar] [CrossRef] [Green Version]
  120. Na, K. The Effect of On-the-Job Training and Education Level of Employees on Innovation in Emerging Markets. J. Open Innov. Technol. Mark. Complex. 2021, 7, 47. [Google Scholar] [CrossRef]
  121. González-Sánchez, R.; Pelechano-Barahona, E.; Alonso-Muñoz, S.; García-Muiña, F.E. Absorptive Routines and the Economic Impact of Incremental Innovations: Developing Continuous Improvement Strategies. J. Open Innov. Technol. Mark. Complex. 2020, 6, 167. [Google Scholar] [CrossRef]
  122. Medne, A.; Lapina, I. Sustainability and Continuous Improvement of Organization: Review of Process-Oriented Performance Indicators. J. Open Innov. Technol. Mark. Complex. 2019, 5, 49. [Google Scholar] [CrossRef] [Green Version]
  123. Zaman, U.; Nawaz, S.; Nadeem, R.D. Navigating Innovation Success through Projects. Role of CEO Transformational Leadership, Project Management Best Practices, and Project Management Technology Quotient. J. Open Innov. Technol. Mark. Complex. 2020, 6, 168. [Google Scholar] [CrossRef]
  124. Hittmar, S.; Varmus, M.; Lendel, V. Proposal of Evaluation System for Successful Application of Innovation Strategy through a Set of Indicators. Procedia Econ. Financ. 2015, 26, 17–22. [Google Scholar] [CrossRef] [Green Version]
  125. Turner, K.L.; Monti, A.; Annosi, M.C. Disentangling the Effects of Organizational Controls on Innovation. Eur. Manag. J. 2021, 39, 57–69. [Google Scholar] [CrossRef]
  126. Slimane, M. Relationship between Innovation and Leadership. Procedia-Soc. Behav. Sci. 2015, 181, 218–227. [Google Scholar] [CrossRef] [Green Version]
  127. Ettlie, J.E.; Reza, E.M. Organizational Integration and Process Innovation. Acad. Manag. J. 1992, 35, 795–827. [Google Scholar] [CrossRef]
  128. Guo, B.; Paraskevopoulou, E.; Santamaría Sánchez, L. Disentangling the Role of Management Control Systems for Product and Process Innovation in Different Contexts. Eur. Account. Rev. 2019, 28, 681–712. [Google Scholar] [CrossRef]
  129. Skordoulis, M.; Ntanos, S.; Kyriakopoulos, G.L.; Arabatzis, G.; Galatsidas, S.; Chalikias, M. Environmental Innovation, Open Innovation Dynamics and Competitive Advantage of Medium and Large-Sized Firms. J. Open Innov. Technol. Mark. Complex. 2020, 6, 195. [Google Scholar] [CrossRef]
  130. Roša (Rosha), A.; Lace, N. Assessment of the Impact of Coaching on a Company’s Performance: A Review of Methods. J. Open Innov. Technol. Mark. Complex. 2021, 7, 233. [Google Scholar] [CrossRef]
  131. Braineet. Innovation Metrics & KPIs: Measuring Innovation to Create Growth. Available online: https://www.braineet.com/blog/innovation-metrics-kpis (accessed on 17 April 2022).
  132. Tucker, R.B. 7 Strategies for Generating Ideas. Futurist 2003, 37, 20. [Google Scholar]
  133. Dziallas, M.; Blind, K. Innovation Indicators throughout the Innovation Process: An Extensive Literature Analysis. Technovation 2019, 80–81, 3–29. [Google Scholar] [CrossRef]
  134. Boscherini, L.; Chiaroni, D.; Chiesa, V.; Frattini, F. How to Use Pilot Projects to Implement Open Innovation. Int. J. Innov. Manag. 2010, 14, 1065–1097. [Google Scholar] [CrossRef]
  135. Rost, K.; Hölzle, K.; Gemünden, H.-G. Promotors or Champions? Pros and Cons of Role Specialisation for Economic Process. Schmalenbach Bus. Rev. 2007, 59, 340–363. [Google Scholar] [CrossRef]
  136. Gemünden, H.G.; Salomo, S.; Hölzle, K. Role Models for Radical Innovations in Times of Open Innovation. Creat. Innov. Manag. 2007, 16, 408–421. [Google Scholar] [CrossRef]
  137. Fichter, K. Innovation Communities: The Role of Networks of Promotors in Open Innovation. RD Manag. 2009, 39, 357–371. [Google Scholar] [CrossRef]
  138. Rese, A.; Gemünden, H.-G.; Baier, D. ‘Too Many Cooks Spoil The Broth’: Key Persons and Their Roles in Inter-Organizational Innovations. Creat. Innov. Manag. 2013, 22, 390–407. [Google Scholar] [CrossRef]
  139. Hamadi, T.; Leker, J.; Meerholz, K. Emergence of Innovation Champions: Differeces in the R&D Collaboration Process between Science and Industry. Int. J. Innov. Manag. 2018, 22, 1840008. [Google Scholar] [CrossRef]
  140. Das, S.R.; Joshi, M.P. Process Innovativeness and Firm Performance in Technology Service Firms: The Effect of External and Internal Contingencies. IEEE Trans. Eng. Manag. 2012, 59, 401–414. [Google Scholar] [CrossRef]
Figure 1. The framework of process innovation implementation. (Source: Authors’ elaboration).
Joitmc 08 00095 g001
Figure 2. Success factors of process innovation in Indonesian SOEs. (Source: Authors’ elaboration).
Joitmc 08 00095 g002
Table 1. Indicators/criteria for innovation performance.
Authors.Indicators/Criteria
Kuczmarski [75]Speed-to-market, R&D innovation emphasis, new product portfolio mix, process pipeline flow, innovation revenues/employee
Tin [76]Return on innovation investment, cumulative profits, cumulative revenues, growth impact, success rate, new product survival rate
Birchall et al. [77]Futures focus, market impact, capabilities and image, process, and sustainability and overall effectiveness
Dulkeith and Schepurek [14]Inputs, innovation process, output and outcomes, knowledge, innovation strategy, culture
Ivanov and Avasilcăi [78]The criteria used by the balanced scorecard Malcolm Baldrige, Performance Prism, and European Foundation for Quality Management (EFQM).
Table 2. Profile of panelists.
Job TitleIndustry Segment
or Institutions
Hospitality Experience
Director-General of InnovationMinistry of Research/BRIN23 years
(former) Chairman of BPPT Ministry of Research/BRIN23 years
ProfessorUniversity30 years
Director of Infrastructure Project Chemical industry29 years
Vice President of Engineering ServicesOil and gas industry27 years
Director of Business Strategy and Dev.Chemical industry29 years
Senior Manager of Innovation and System Dev.Chemical industry23 years
Director of ProductionChemical industry29 years
Director of Engineering and Dev.Chemical industry29 years
Head of Training DivisionChemical industry10 years
Director of OperationsManufacturing industry29 years
Director of Business TransformationMining industry29 years
Head of Research, Innovation, and KMEnergy industry23 years
Senior Manager of R&DChemical industry23 years
Corporate SecretaryLogistics23 years
Table 3. Calculation of Q3 mean and Q1 standard deviation of input indicator factors.
Factors in InputMeanStandard DeviationCronbach’s Alpha If Item deleted
-Organization culture4.830.370.72
-Organization support and commitment4.670.470.74
-Problem understanding4.670.470.75
-Leadership4.580.640.76
-Human resources4.500.500.74
-Knowledge4.500.500.71
-Reward system4.170.550.71
-Availability of technology4.000.580.83
Q3 Mean4.67Cronbach’s Alpha (N = 8 items) 0.78
Q1 Standard deviation0.47
Note: The success factors in input indicator of process innovation had a mean Q3 value of 4.67 and a Q1 standard deviation value of 0.47. Consensus factors, i.e., those with a mean value above 4.67 and a standard deviation below 0.47, included organization culture, organization support, commitment, and problem understanding.
Table 4. Calculation of Q3 mean and Q1 standard deviation of idea generation process indicator factors.
Factors in Process
(Idea Generation)
MeanStandard
Deviation
Cronbach’s Alpha If Item Deleted
-Innovation strategy4.580.490.85
-Personal KPI4.420.490.85
-Benchmarking4.420.490.84
-Mentoring and coaching program4.420.640.84
-Innovation competition program4.330.620.85
-Reward system4.250.600.85
-Idea management systems4.250.600.86
-Innovation forums4.250.720.86
-Innovation day program4.170.690.88
-Team formation4.000.410.86
Q3 Mean4.42Cronbach’s Alpha (N = 10 items) 0.87
Q1 Standard deviation0.49
Note: The success factors in process (idea generation) indicator of process innovation had a Q3 mean value of 4.42 and a Q1 standard deviation of 0.49. Consensus factors had a mean value above 4.42 with a standard deviation below 0.49, including innovation strategy, personal KPI (Key Performance Indicator), and benchmarking.
Table 5. Calculation of Q3 mean and Q1 standard deviation of idea selection process indicator factors.
Factors in Process
(Idea Selection)
MeanStandard DeviationCronbach’s Alpha If Item Deleted
-Innovation impact assessment4.580.490.71
-Internal assessment evaluation4.500.650.73
-Best practice program4.080.640.72
-Benchmarking4.000.410.75
-External assessment evaluation4.000.910.77
Q3 Mean4.50Cronbach’s Alpha (N = 5 items) 0.76
Q1 Standard deviation0.49
Note: The success factors in process (idea selection) indicator of process innovation had a Q3 mean value of 4.50 and a Q1 standard deviation of 0.49. Consensus factors had a mean value above 4.50 with a standard deviation below 0.49, and the innovation impact assessment factor was the only factor in which consensus was reached.
Table 6. Calculation of Q3 mean and Q1 standard deviation of the idea implementation process indicator factors.
Factors in Process
(Idea Implementation)
MeanStandard DeviationCronbach’s Alpha If Item Deleted
-Pilot project4.750.430.76
-Supervision4.670.470.77
-Organization support and commitment4.670.470.74
-Personal KPI4.580.490.80
-Monitoring and evaluation process4.500.500.78
-Innovation budget planning4.500.500.77
-Team building4.420.640.76
-Innovation documentation program4.250.600.77
-Reward system4.170.550.76
-Employee autonomy4.080.760.75
Q3 Mean4.60Cronbach’s Alpha (N = 10 items) 0.79
Q1 Standard Deviation0.49
Note: The success factors in process indicator (idea implementation) of process innovation had a Q3 mean value of 4.60 and a Q1 standard deviation value of 0.49. Consensus factors had a mean value above 4.60 with a standard deviation below 0.49. The pilot project, supervision, and organization support and commitment meet the consensus.
Table 7. Calculation of Q3 mean and Q1 standard deviation of outputs and outcomes indicator factors.
Factors in Outputs and OutcomesMeanStandard DeviationCronbach’s Alpha If Item Deleted
-Cost efficiency4.790.370.81
-Improving business process4.750.430.80
-Improving competitiveness4.750.430.78
-Process effectiveness4.750.430.80
-Increasing product quality4.670.470.81
-Standard repair4.580.490.81
-Improving innovation culture4.580.490.81
-System repair4.580.640.82
-Improving HR competency4.580.640.81
-Increasing revenue4.500.500.81
-Improving work safety4.420.760.82
-New technologies4.080.640.82
-Positive impact on society4.000.580.81
-Boosting employee morale3.920.760.82
-Innovation project documentation3.830.800.84
Q3 Mean4.60Cronbach’s Alpha (N = 15 items) 0.83
Q1 Standard deviation0.44
Note: The success factors in process innovation’s outputs and outcomes indicator had a Q3 mean value of 4.60 and a Q1 standard deviation of 0.44. Consensus factors had a mean value above 4.60 with a standard deviation below 0.44, including cost efficiency, improving business process, improving competitiveness, and process effectiveness.
Table 8. Calculation of Q3 mean and Q1 standard deviation of diffusion indicator factors.
Factors in DiffusionMeanStandard DeviationCronbach’s Alpha If Item Deleted
-Leadership4.830.370.77
-Management commitment4.830.370.71
-Employee involvement4.670.470.70
-Personal KPI4.500.490.80
-Innovation replication program4.420.490.78
-Monitoring and evaluation program4.420.490.76
-System and technology support4.420.500.75
-Innovation training program4.420.620.73
-Innovation sharing program4.330.640.74
-Innovation implementation guidelines4.250.720.76
Q3 Mean4.67Cronbach’s Alpha (N = 10 items) 0.79
Q1 Standard deviation0.47
Note: The success factors in diffusion indicator of process innovation had a Q3 mean value of 4.67 and a Q1 standard deviation of 0.47. The consensus factors had a mean value above 4.67 with a standard deviation below 0.47, including leadership, management commitment, and employee involvement.
Table 9. Calculation of Q3 mean and Q1 standard deviation of cultural indicator factors.
Factors in CultureMeanStandard DeviationCronbach’s Alpha If Item Deleted
-Creative and innovative mindset4.670.470.75
-Innovation mindset4.580.490.73
-Be the best4.500.490.72
-Problem-solving skill4.500.500.77
-Sharing knowledge4.420.500.71
-Employee autonomy4.420.760.71
-Simple but smart mindset4.420.760.72
-Capability to seize opportunities4.331.110.75
Q3 Mean4.52Cronbach’s Alpha (N = 8 items) 0.75
Q1 Standard Deviation0.49
Note: The success factors in culture indicator of process innovation had a mean Q3 value of 4.52 and a Q1 standard deviation value of 0.49. The consensus factors had a mean value above 4.52 with a standard deviation below 0.49, including creative and innovative mindset and innovation mindset.
Table 10. Calculation of Q3 mean and Q1 standard deviation of strategy indicator factors.
Factors in StrategyMeanStandard DeviationCronbach’s Alpha If Item Deleted
-Continuous improvement4.750.430.73
-Market-driven4.670.470.70
-Business innovation facilitator4.500.490.72
-Personal KPI4.420.600.74
-Value creation4.420.620.71
-Innovation agents program4.330.640.71
-Technology absorption4.250.650.72
Q3 Mean4.58Cronbach’s Alpha (N = 7 items) 0.74
Q1 Standard deviation0.48
Note: The success factors in strategy indicator of process innovation had a mean Q3 value of 4.58 and a Q1 standard deviation value of 0.48. Consensus factors had a mean value above 4.58 with a standard deviation below 0.48, including continuous improvement and market-driven.
Table 11. Calculation of Q3 mean and Q1 standard deviation of the pull factors.
Pull FactorsMeanStandard DeviationCronbach’s Alpha If Item Deleted
-Customer demands4.920.280.75
-Competitive advantage4.830.370.74
-Excellent performance4.750.430.76
-Sustainability in competition4.750.430.74
-Business climate change4.670.470.71
-Stakeholders demands4.580.490.73
-Creation of a competitive work culture4.580.490.73
-Technological development4.580.640.74
-Support from the Minister of SOEs4.500.760.72
-KPI target achievement4.420.490.80
-SOEs legal and regulatory support4.330.620.71
-Internal environment of an organization4.250.600.73
-Availability of resources4.171.070.72
Q3 Mean4.73Cronbach’s Alpha (N = 13 items) 0.75
Q1 Standard deviation0.44
Note: The pull factors indicator of process innovation had a mean Q3 value of 4.73 and a Q1 standard deviation value of 0.44. The consensus factors had a mean value above 4.73 with a standard deviation below 0.44, including customer demands, competitive advantage, excellent performance, and sustainability in competition.
Table 12. Calculation of Q3 mean and Q1 standard deviation of push factors.
Push FactorsMeanStandard DeviationCronbach’s Alpha If Item Deleted
-Cost efficiency4.750.430.73
-Productivity improvement4.670.470.74
-Increasing profit4.580.490.72
-KPI target achievement4.500.500.78
-Process effectiveness4.500.500.70
-Creating a competitive work culture4.500.500.76
-Technology renewal4.420.760.74
-Innovation competition program4.330.620.71
-Employee recognition award4.330.750.75
Q3 Mean4.58Cronbach’s Alpha (N = 9 items) 0.72
Q1 Standard deviation0.49
Note: The push factors indicator of process innovation had a mean Q3 value of 4.58 and a Q1 standard deviation value of 0.49. Factors that created consensus had a mean value above 4.58 with a standard deviation below 0.49, including cost efficiency, productivity improvement, and increasing profit.
Publisher’s Note: MDPI stays neutral with regard to jurisdictional claims in published maps and institutional affiliations.

