Application of FTIR Spectroscopy and HPLC Combined with Multivariate Calibration for Analysis of Xanthones in Mangosteen Extracts


 ,
,  , ,
, , 
Abstract
:1. Introduction
2. Materials and Methods
2.1. Sample Preparation
2.2. HPLC Analysis of Xanthones
2.3. Analysis of Extracts Using FTIR Spectrophotometer
2.4. Data Analysis
3. Results
4. Conclusions
Author Contributions
Funding
Acknowledgments
Conflicts of Interest
References
- Cheok, C.Y.; Mohd Adzahan, N.; Abdul Rahman, R.; Zainal Abedin, N.H.; Hussain, N.; Sulaiman, R.; Chong, G.H. Current trends of tropical fruit waste utilization. Crit. Rev. Food Sci. Nutr. 2018, 58, 335–361. [Google Scholar] [CrossRef] [PubMed]
- El-kenawy, A.E.; Hassan, S.M.A.; Osman, H.H. Mangosteen (Garcinia mangostana L.), Nonvitamin and Nonmineral Nutritional Supplements; Elsevier Inc.: Amsterdam, The Netherlands, 2019. [Google Scholar] [CrossRef]
- Wang, S.; Li, Q.; Jing, M.; Han, Y.; Pi, R.; Yang, X.; Sabate, R.; Lan, W.; Chen, X.Y.J. Natural xanthones from Garcinia mangostana with multifunctional activities for the therapy of alzheimer’s disease. Nerochem. Res. 2016, 41, 1806–1817. [Google Scholar] [CrossRef] [PubMed]
- Rivero, B.; Garibay, I. Development and Validation of a Stability- Indicating HPLC Method for the Quantification of α-Mangostin in Dietary Supplements. Nat. Prof. Comm. 2019, 14, 1–5. [Google Scholar] [CrossRef] [Green Version]
- Kusmayadi, A.; Adriani, L.; Abun, A.; Muchtaridi, M.; Tanuwiria, U.H. The effect of solvents and extraction time on total xanthone and antioxidant yields of mangosteen peel (Garcinia mangostana L.) extract. Drug Invent. Today 2018, 10, 2572–2576. [Google Scholar]
- Gondokesumo, M.E.; Pardjianto, B.; Sumitro, S.B.; Widowati, W.; Pardji, B.; Bambang, S.; Widowa, W. Xanthones Analysis and Antioxidant Activity Analysis (Applying ESR ) of six different maturity levels of mangosteen rind extract (Garcinia mangostana Linn.). Pharmacogn. J. 2019, 11, 369–373. [Google Scholar] [CrossRef] [Green Version]
- Aisha, A.; Abu-salah, K.M.; Abdullah, K.; Medical, I.; Siddiqui, M.J. Quantification of α-, β-, and γ-mangostin in Garcinia mangostana fruit rind extracts by a reverse phase high performance liquid chromatography. J. Med. Plant. Res. 2012, 6, 4526–4534. [Google Scholar]
- Mayefis, D.; Anugerah, Y.; Rasyid, R. Determination of total xanthone content in the preparation of mangosteen pericarp capsules (Garcinia mangostana L.) available on the market using uv-visible spectrophotometry. Maj. Obat Trad. 2019, 24, 98–103. [Google Scholar] [CrossRef] [Green Version]
- Tulukcu, E.; Cebi, N.; Sagdic, O. Chemical Fingerprinting of seeds of some salvia. Foods 2019, 4, 1–12. [Google Scholar]
- Wittenauer, J.; Falk, S.; Schweiggert-weisz, U.; Carle, R. Characterisation and quantification of xanthones from the aril and pericarp of mangosteens (Garcinia mangostana L.) and a mangosteen containing functional beverage by HPLC–DAD–MS. Food Chem. 2012, 134, 445–452. [Google Scholar] [CrossRef]
- Rohman, A.; Sudjadi, D.; Ramadhani, D.; Nugroho, A. Analysis of curcumin in curcuma longa and Curcuma xanthorriza using FTIR spectroscopy and chemometrics. Res. J. Med. Plant 2015, 9, 179–186. [Google Scholar] [CrossRef] [Green Version]
- Brighenti, V.; Groothuis, S.F.; Prencipe, F.P.; Amir, R.; Benvenuti, S.; Pellati, F. Metabolite fingerprinting of Punica granatum L. (pomegranate) polyphenols by means of high-performance liquid chromatography with diode array and electrospray ionization-mass spectrometry detection. J. Chromatogr. A 2017, 1480, 20–31. [Google Scholar] [CrossRef] [PubMed]
- Irnawati, I.; Riyanto, S.; Martono, S.; Rohman, A. Determination of sesame oil, rice bran oil and pumpkin seed oil in ternary mixtures using FTIR spectroscopy and multivariate calibrations. Food Res. 2020, 4, 135–142. [Google Scholar] [CrossRef]
- Miller, J.C.; Miller, J.N. Statistic and Chemometrics for Analytical Chemistry, 5th ed.; Pearson Education Limited: Harlow, UK, 2005. [Google Scholar]


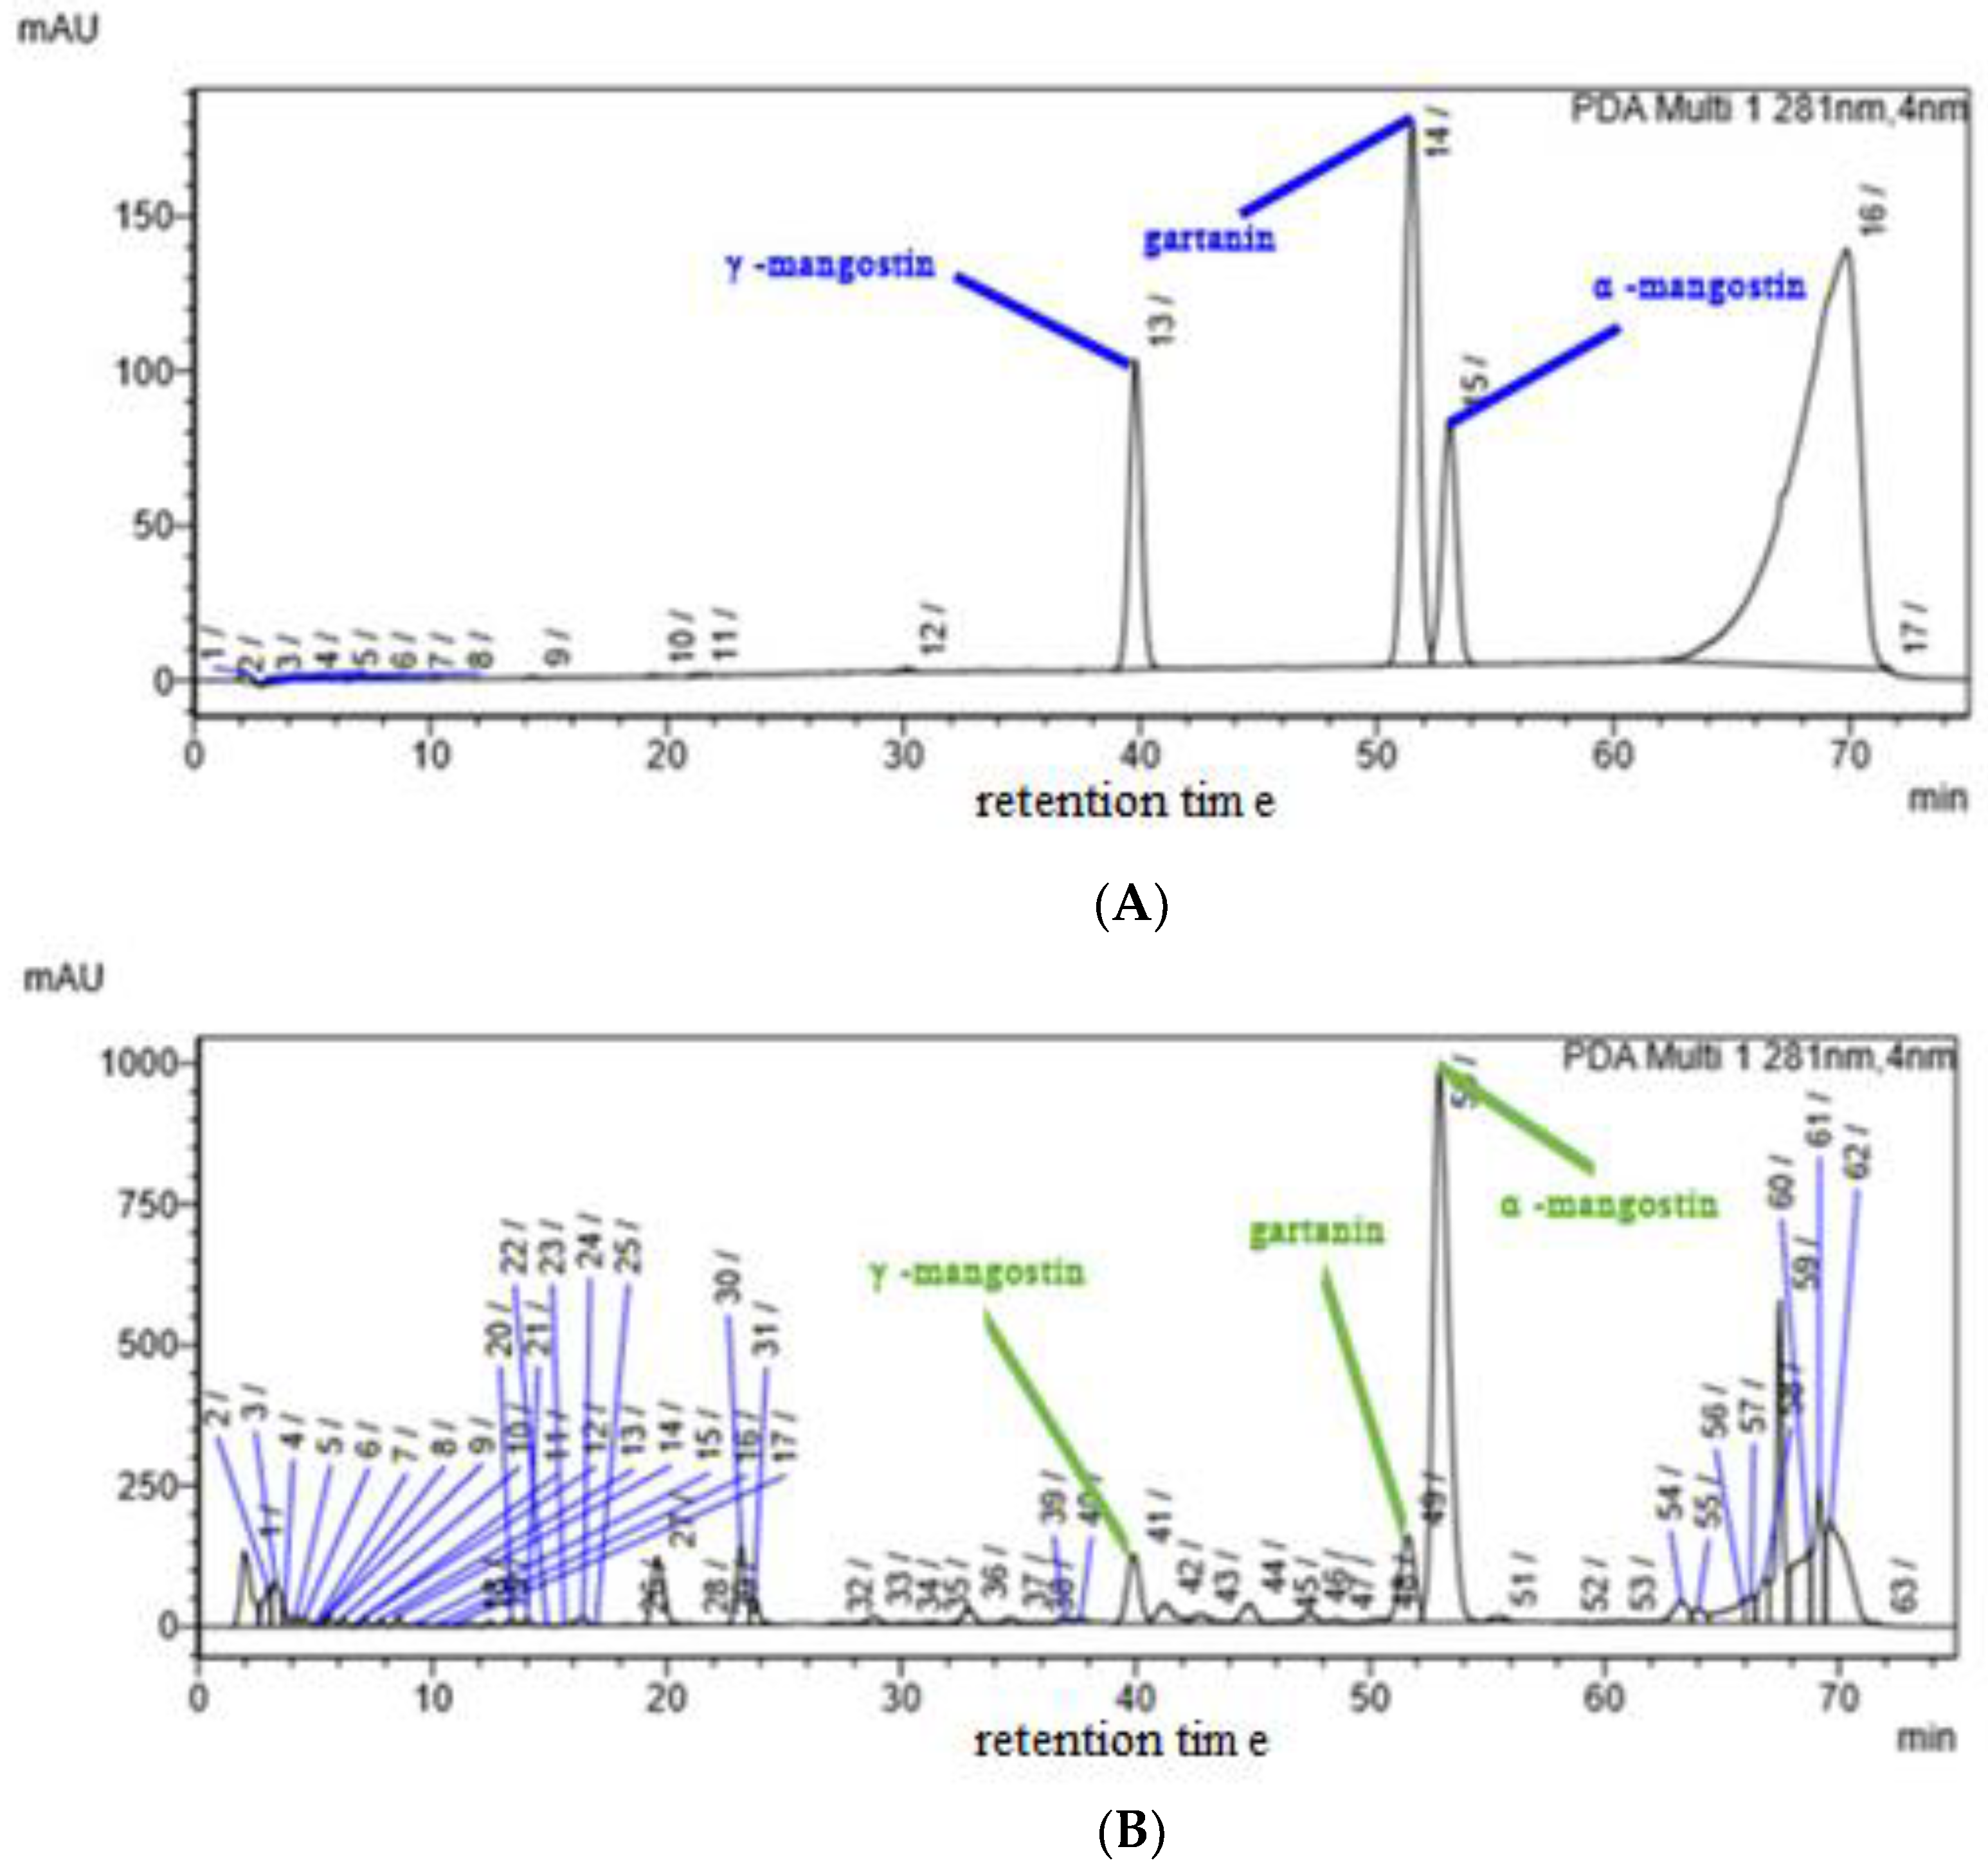
| Xanthone Compound | Calibration Curve | R2 |
|---|---|---|
| γ-mangostin | Y = 17469x − 594487 | 0.9868 |
| Gartanin | Y = 52802x − 2135535 | 0.9918 |
| α-mangostin | Y = 1752x − 439405 | 0.9939 |
| Sample | Concentrations (%wt/wt) | ||
|---|---|---|---|
| GM | GT | AM | |
| Sample 1a | 0.5437 | 0.3265 | 2.9907 |
| Sample 1b | 0.5142 | 0.3079 | 2.8324 |
| Sample 2a | 0.5277 | 0.2410 | 3.7292 |
| Sample 2b | 0.2741 | 0.1698 | 1.5461 |
| Sample 3a | 0.4771 | 0.5540 | 10.7100 |
| Sample 3b | 0.7831 | 0.4484 | 6.9412 |
| Sample 4a | 0.7713 | 0.2561 | 3.0776 |
| Sample 4b | 0.7020 | 0.2383 | 2.7924 |
| Sample 5a | 0.4978 | 0.2841 | 3.8587 |
| Sample 5b | 0.3324 | 0.2103 | 2.1826 |
| Sample 6a | 0.4280 | 0.1595 | 1.0838 |
| Sample 6b | 0.3728 | 0.1475 | 0.8915 |
| Sample 7a | 0.9623 | 0.4715 | 5.1033 |
| Sample 7b | 0.8598 | 0.3911 | 4.1493 |
| Sample 8a | 0.1330 | 0.1212 | 0.2946 |
| Sample 8b | 0.1281 | 0.1197 | 0.2656 |
| Sample 9a | 0.3306 | 0.1898 | 1.2509 |
| Sample 9b | 0.3226 | 0.1910 | 1.2316 |
| Sample 10a | 0.1859 | 0.1230 | 0.3255 |
| Sample 10b | 0.5296 | 0.1280 | 1.1244 |
| Sample 11a | 0.7273 | 0.2210 | 2.0292 |
| Sample 11b | 0.7368 | 0.2189 | 1.9711 |
| Sample 12a | 0.1865 | 0.1516 | 0.6420 |
| Sample 12b | 0.2425 | 0.1922 | 1.0789 |
| Sample 13a | 0.8292 | 0.2978 | 5.4887 |
| Sample 13b | 0.7295 | 0.2760 | 4.8279 |
| Sample 14a | 0.6495 | 0.2137 | 2.6943 |
| Sample 14b | 0.7006 | 0.2223 | 2.9453 |
| Multivariate Calibrations | Wavenumber (cm−1) | Spectra | Calibration | Validation | ||
|---|---|---|---|---|---|---|
| R2 | RMSEC | R2 | RMSEP | |||
| PLS | 3700–663 | normal | 0.1084 | 0.223 | 0.3688 | 0.210 |
| 1st der | 0.9835 | 0.0303 | 0.3304 | 0.256 | ||
| 2nd der | 0.9206 | 0.0664 | 0.5820 | 0.164 | ||
| 3700–2700 and 1800–663 | normal | 0.1093 | 0.222 | 0.3699 | 0.210 | |
| 1st der | 0.1144 | 0.222 | 0.4280 | 0.199 | ||
| 2nd der | 0.8976 | 0.0755 | 0.5672 | 0.170 | ||
| 3700–2700 | normal | 0.1011 | 0.223 | 0.3499 | 0.223 | |
| 1st der | 0.9930 | 0.0197 | 0.7839 | 0.155 | ||
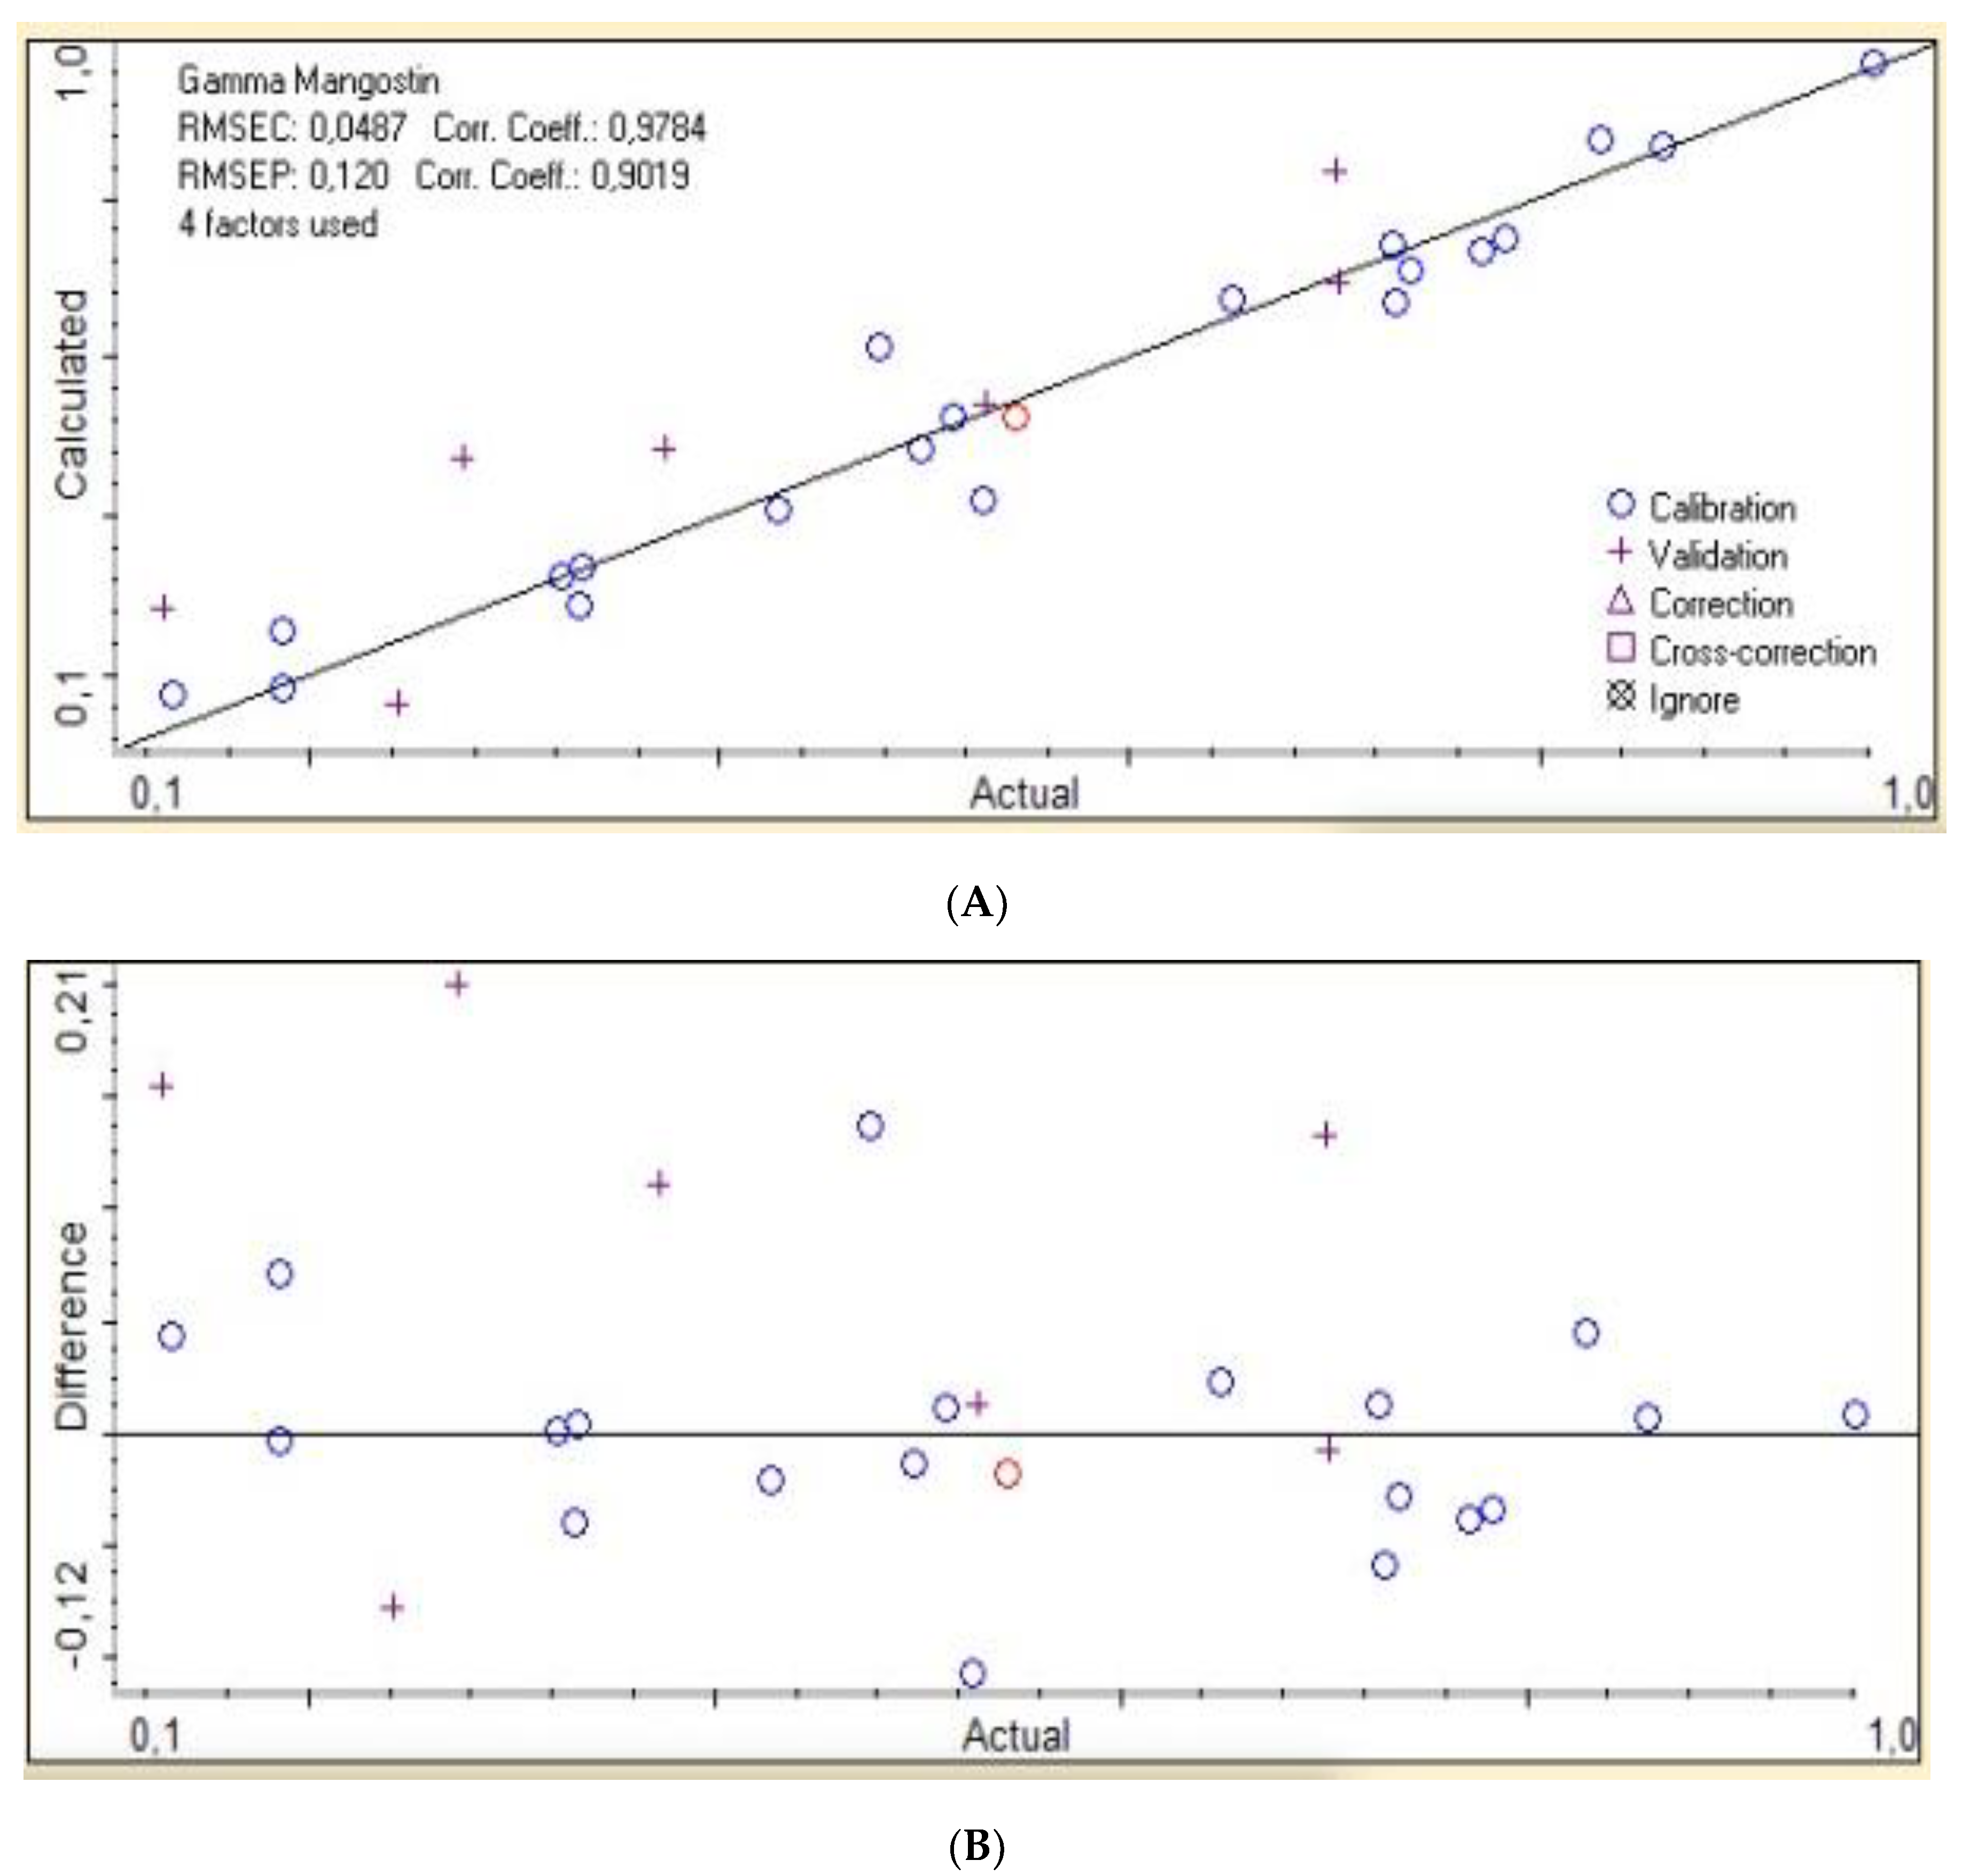
| 2nd der | 0.9573 | 0.0487 | 0.8134 | 0.120 | ||
| 1800–663 | normal | 0.1065 | 0.223 | 0.3730 | 0.203 | |
| 1st der | 0.9592 | 0.0476 | 0.2870 | 0.295 | ||
| 2nd der | 0.8623 | 0.0875 | 0.5057 | 0.188 | ||
| PCR | 3700–663 | normal | 0.6002 | 0.149 | 0.3611 | 0.284 |
| 1st der | 0.6214 | 0.145 | 0.5938 | 0.154 | ||
| 2nd der | 0.6678 | 0.0652 | 0.0922 | 0.0554 | ||
| 3700–2700 and 1800–663 | normal | 0.6402 | 0.141 | 0.4034 | 0.251 | |
| 1st der | 0.6211 | 0.145 | 0.5886 | 0.155 | ||
| 2nd der | 0.6777 | 0.134 | 0.7846 | 0.109 | ||
| 3700–2700 | normal | 0.4039 | 0.182 | 0.4959 | 0.216 | |
| 1st der | 0.2280 | 0.207 | 0.7164 | 0.160 | ||
| 2nd der | 0.5582 | 0.157 | 0.6064 | 0.157 | ||
| 1800–663 | normal | 0.1956 | 0.211 | 0.4294 | 0.239 | |
| 1st der | 0.3376 | 0.192 | 0.2713 | 0.199 | ||
| 2nd der | 0.1903 | 0.212 | 0.6904 | 0.177 | ||
| Multivariate Calibrations | Wavenumber (cm−1) | Spectra | Calibration | Validation | ||
|---|---|---|---|---|---|---|
| R2 | RMSEC | R2 | RMSEP | |||
| PLS | 3700–663 | normal | 0.0782 | 0.109 | 0.0117 | 0.0972 |
| 1st der | 0.0881 | 0.108 | 0.0188 | 0.0969 | ||
| 2nd der | 0.9952 | 0.00789 | 0.3094 | 0.0519 | ||
| 3700–2700 and 1800–663 | normal | 0.0779 | 0.109 | 0.0116 | 0.0974 | |
| 1st der | 0.0880 | 0.108 | 0.0188 | 0.0969 | ||
| 2nd der | 0.9928 | 0.00961 | 0.3145 | 0.0548 | ||
| 3700–2700 | normal | 0.0429 | 0.111 | 0.0046 | 0.102 | |
| 1st der | 0.9884 | 0.0121 | 0.3669 | 0.0559 | ||
| 2nd der | 0.9040 | 0.0351 | 0.0957 | 0.0745 | ||
| 1800–663 | normal | 0.0890 | 0.108 | 0.0140 | 0.0957 | |
| 1st der | 0.0880 | 0.108 | 0.0190 | 0.0969 | ||
| 2nd der | 0.9914 | 0.0105 | 0.2154 | 0.0645 | ||
| PCR | 3700–663 | normal | 0.6366 | 0.0682 | 0.0390 | 0.107 |
| 1st der | 0.5724 | 0.0740 | 0.0094 | 0.0804 | ||
| 2nd der | 0.6678 | 0.0652 | 0.0922 | 0.0554 | ||
| 3700–2700 and 1800–663 | normal | 0.6848 | 0.0635 | 0.0253 | 0.1020 | |
| 1st der | 0.5690 | 0.0743 | 0.0075 | 0.0807 | ||
| 2nd der | 0.6619 | 0.0658 | 0.0974 | 0.0566 | ||
| 3700–2700 | normal | 0.1326 | 0.105 | 0.0018 | 0.0938 | |
| 1st der | 0.2500 | 0.098 | 0.1919 | 0.1010 | ||
| 2nd der | 0.5347 | 0.0772 | 0.0122 | 0.0799 | ||
| 1800–663 | normal | 0.2016 | 0.101 | 0.0864 | 0.0716 | |
| 1st der | 0.2867 | 0.0956 | 0.1127 | 0.0829 | ||
| 2nd der | 0.2117 | 0.100 | 0.1260 | 0.082 | ||
| Multivariate Calibrations | Wavenumber (cm−1) | Spectra | Calibration | Validation | ||
|---|---|---|---|---|---|---|
| R2 | RMSEC | R2 | RMSEP | |||
| PLS | 3700–663 | normal | 0.7739 | 1.150 | 0.0535 | 1.850 |
| 1st der | 0.9409 | 0.589 | 0.4839 | 0.964 | ||
| 2nd der | 0.9934 | 0.197 | 0.6358 | 0.990 | ||
| 3700–2700 and 1800–663 | normal | 0.7707 | 1.160 | 0.0585 | 1.670 | |
| 1st der | 0.9347 | 0.619 | 0.4764 | 0.966 | ||
| 2nd der | 0.9880 | 0.265 | 0.6222 | 1.050 | ||
| 3700–2700 | normal | 0.1865 | 2.190 | 0.0465 | 1.420 | |
| 1st der | 0.9884 | 0.261 | 0.7916 | 0.805 | ||
| 2nd der | 0.9249 | 0.664 | 0.6762 | 1.210 | ||
| 1800–663 | normal | 0.0729 | 2.330 | 0.0178 | 1.700 | |
| 1st der | 0.9569 | 0.504 | 0.3211 | 1.240 | ||
| 2nd der | 0.9746 | 0.386 | 0.4958 | 1.280 | ||
| PCR | 3700–663 | normal | 0.7346 | 1.250 | 0.0010 | 1.860 |
| 1st der | 0.6593 | 1.410 | 0.0438 | 1.140 | ||
| 2nd der | 0.6750 | 1.380 | 0.4827 | 0.705 | ||
| 3700–2700 and 1800–663 | normal | 0.7769 | 1.140 | 0.0009 | 1.670 | |
| 1st der | 0.6559 | 1.420 | 0.0406 | 1.150 | ||
| 2nd der | 0.6706 | 1.390 | 0.4673 | 0.727 | ||
| 3700–2700 | normal | 0.3229 | 1.990 | 0.1245 | 1.570 | |
| 1st der | 0.4050 | 1.870 | 0.0505 | 1.680 | ||
| 2nd der | 0.5079 | 1.700 | 0.0221 | 1.560 | ||
| 1800–663 | normal | 0.3653 | 1.930 | 0.0666 | 1.320 | |
| 1st der | 0.4167 | 1.850 | 0.0563 | 1.240 | ||
| 2nd der | 0.3790 | 1.910 | 0.0001 | 1.190 | ||
© 2020 by the authors. Licensee MDPI, Basel, Switzerland. This article is an open access article distributed under the terms and conditions of the Creative Commons Attribution (CC BY) license (http://creativecommons.org/licenses/by/4.0/).
Share and Cite
Tejamukti, E.P.; Setyaningsih, W.; Irnawati; Yasir, B.; Alam, G.; Rohman, A. Application of FTIR Spectroscopy and HPLC Combined with Multivariate Calibration for Analysis of Xanthones in Mangosteen Extracts. Sci. Pharm. 2020, 88, 35. https://0-doi-org.brum.beds.ac.uk/10.3390/scipharm88030035
Tejamukti EP, Setyaningsih W, Irnawati, Yasir B, Alam G, Rohman A. Application of FTIR Spectroscopy and HPLC Combined with Multivariate Calibration for Analysis of Xanthones in Mangosteen Extracts. Scientia Pharmaceutica. 2020; 88(3):35. https://0-doi-org.brum.beds.ac.uk/10.3390/scipharm88030035
Chicago/Turabian StyleTejamukti, Endjang Prebawa, Widiastuti Setyaningsih, Irnawati, Budiman Yasir, Gemini Alam, and Abdul Rohman. 2020. "Application of FTIR Spectroscopy and HPLC Combined with Multivariate Calibration for Analysis of Xanthones in Mangosteen Extracts" Scientia Pharmaceutica 88, no. 3: 35. https://0-doi-org.brum.beds.ac.uk/10.3390/scipharm88030035