Effect on Body Weight and Adipose Tissue by Cariprazine: A Head-to-Head Comparison Study to Olanzapine and Aripiprazole in Rats

 , , , , ,
Abstract
:1. Introduction
2. Materials and Methods
2.1. Drugs
2.2. Materials for Immunohistochemistry
2.3. Animals and Study Design
2.4. Ethic Statement
2.5. Immunohistochemistry
2.6. Statistical Analysis
3. Results
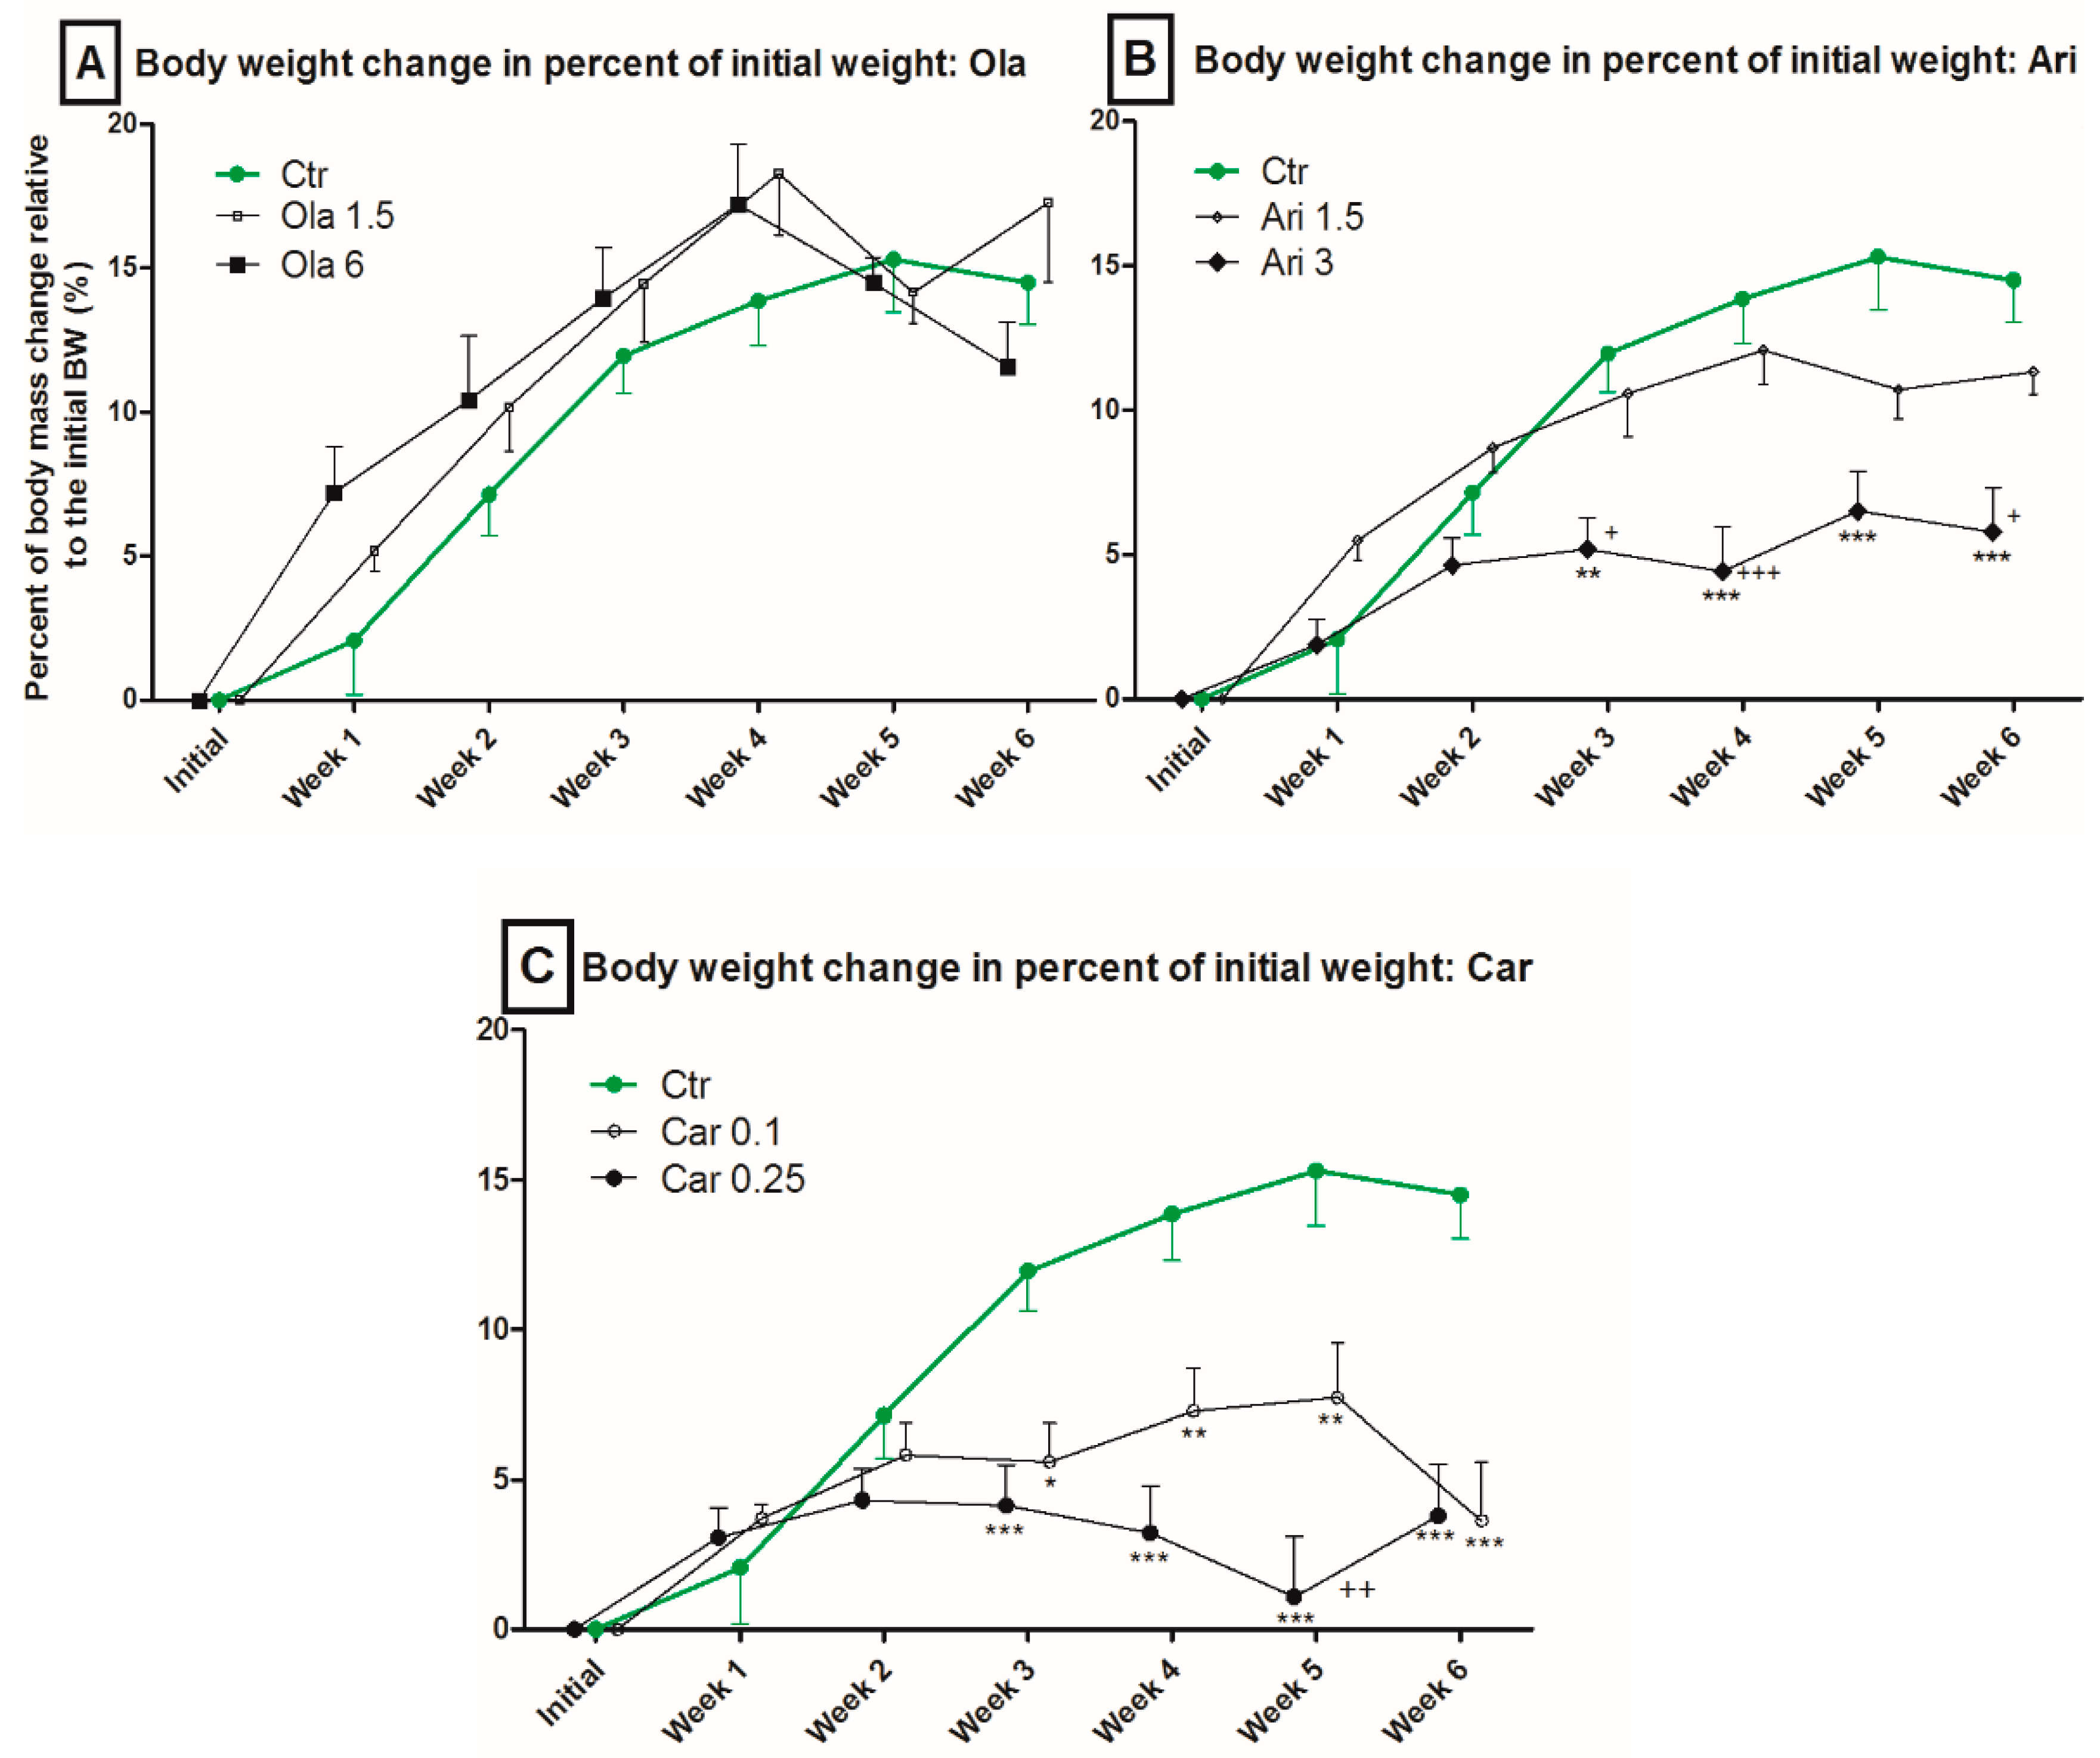
3.1. Body Weight
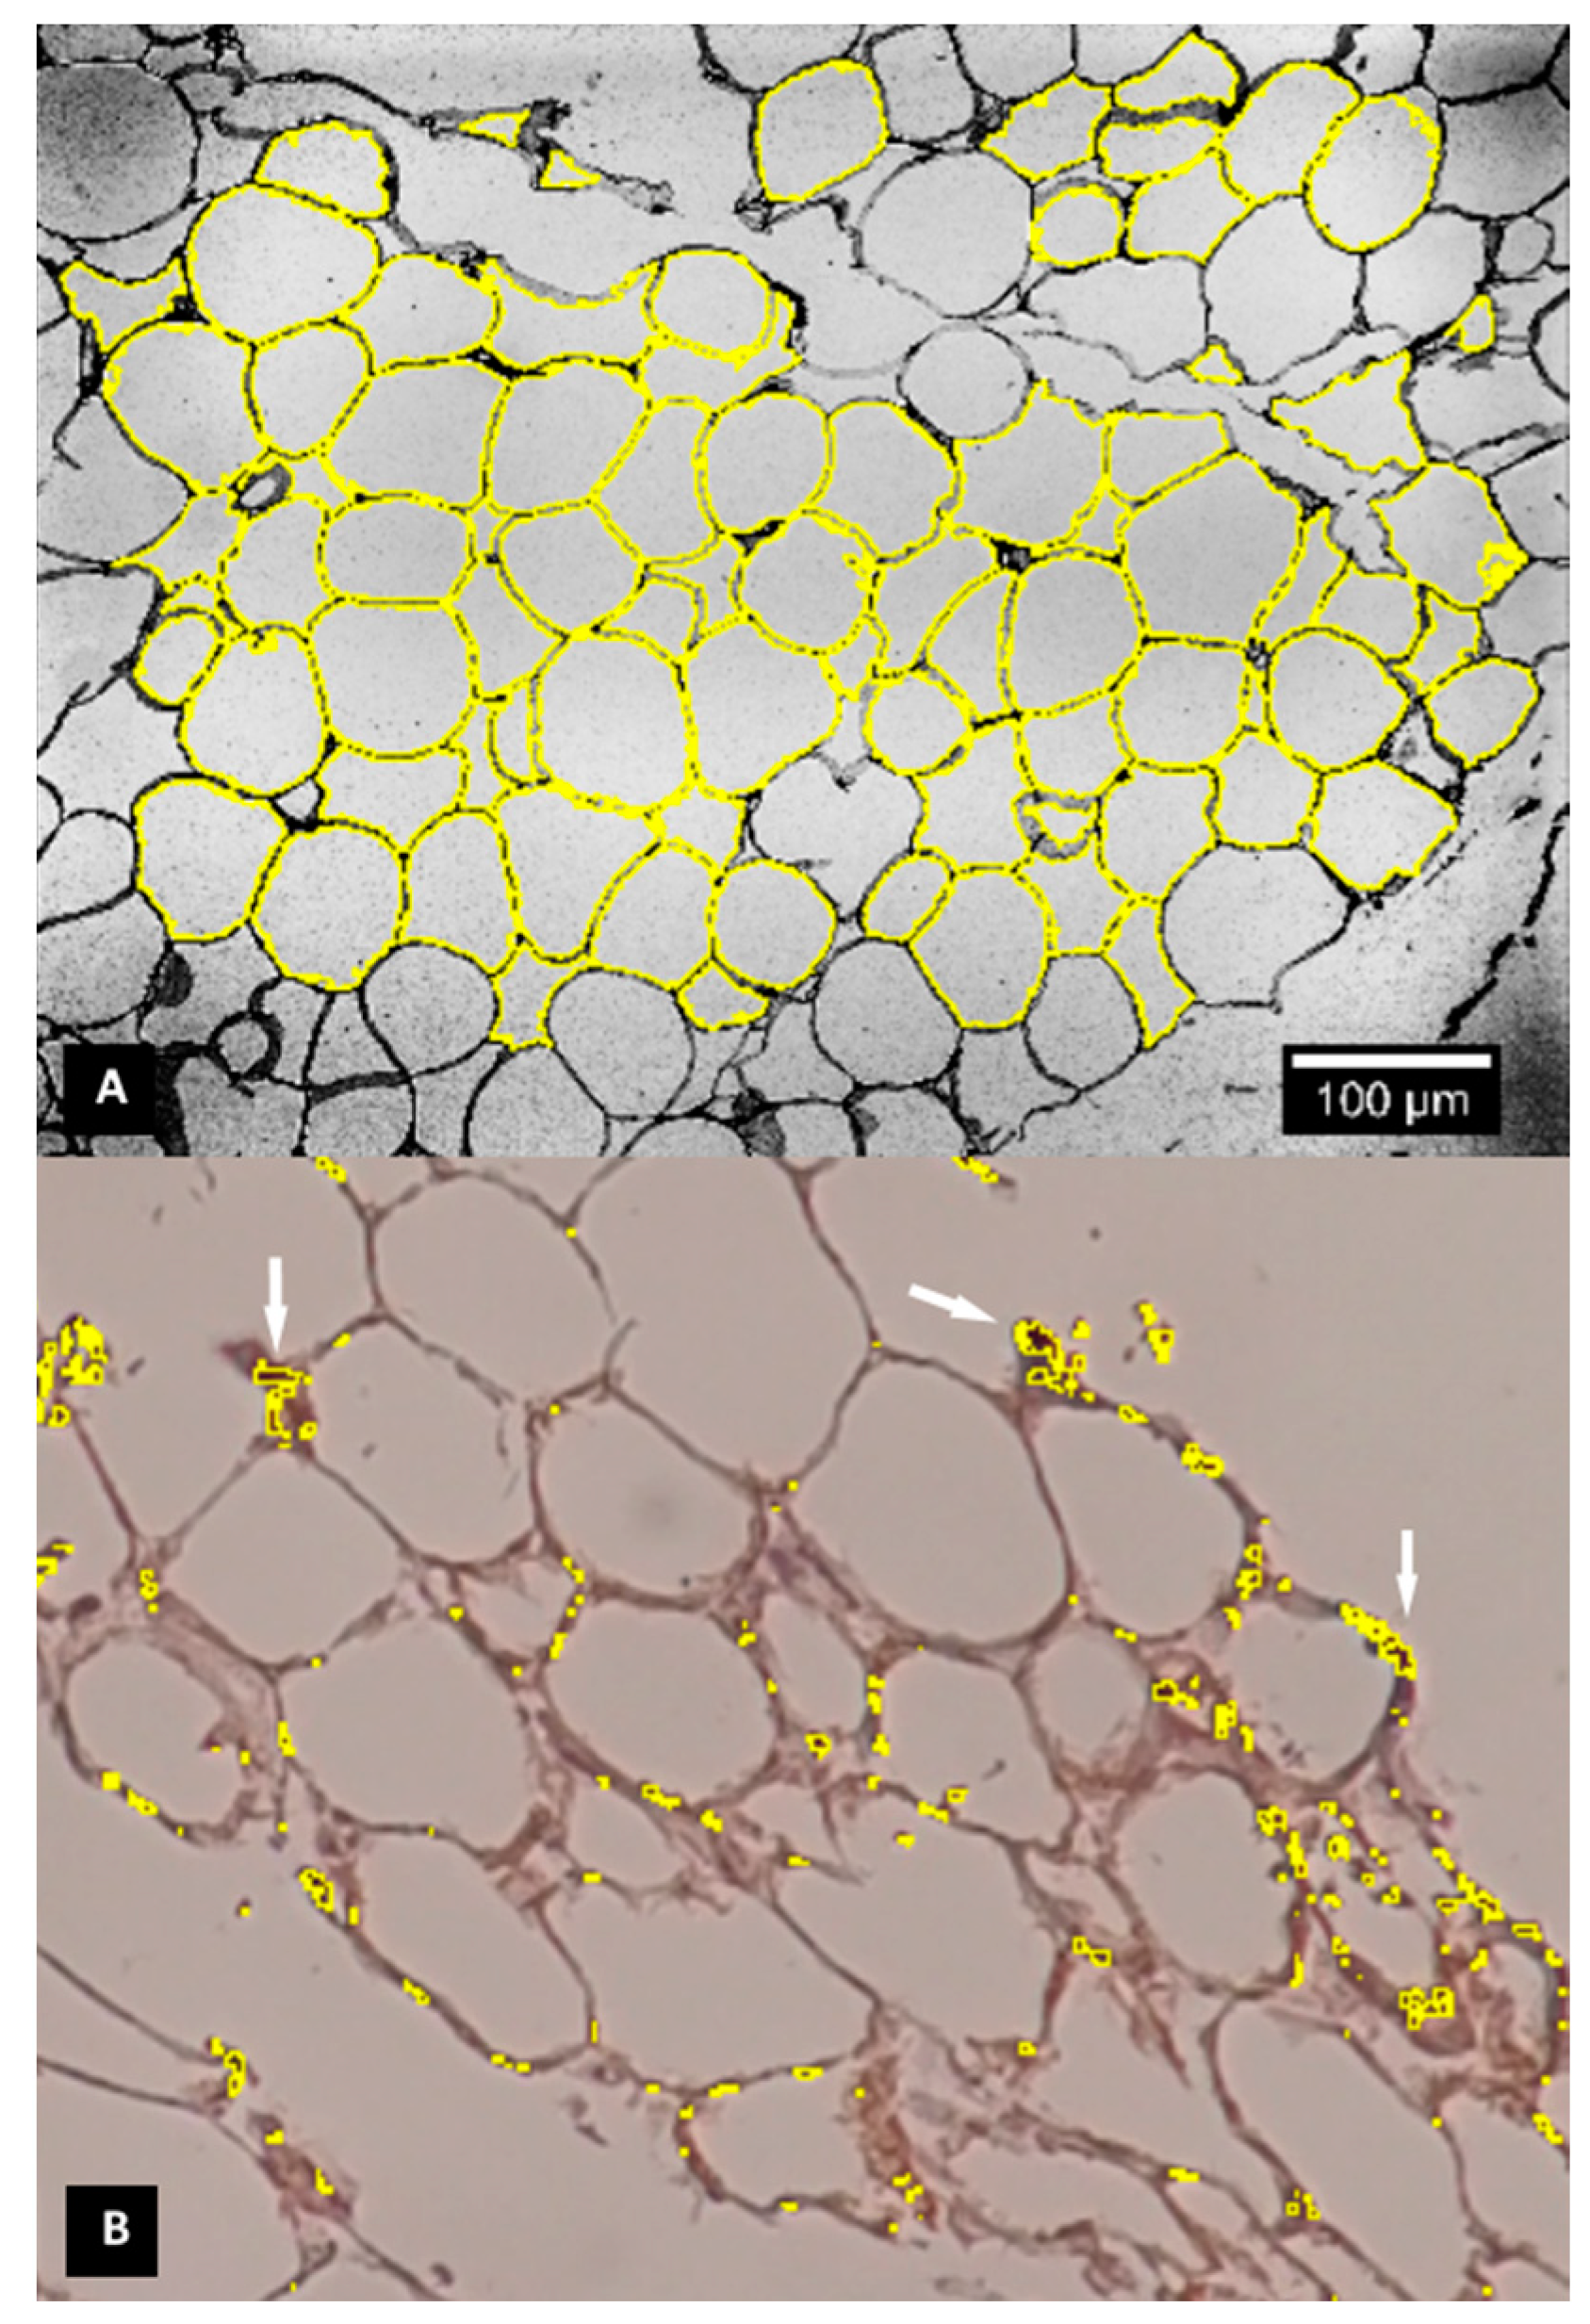
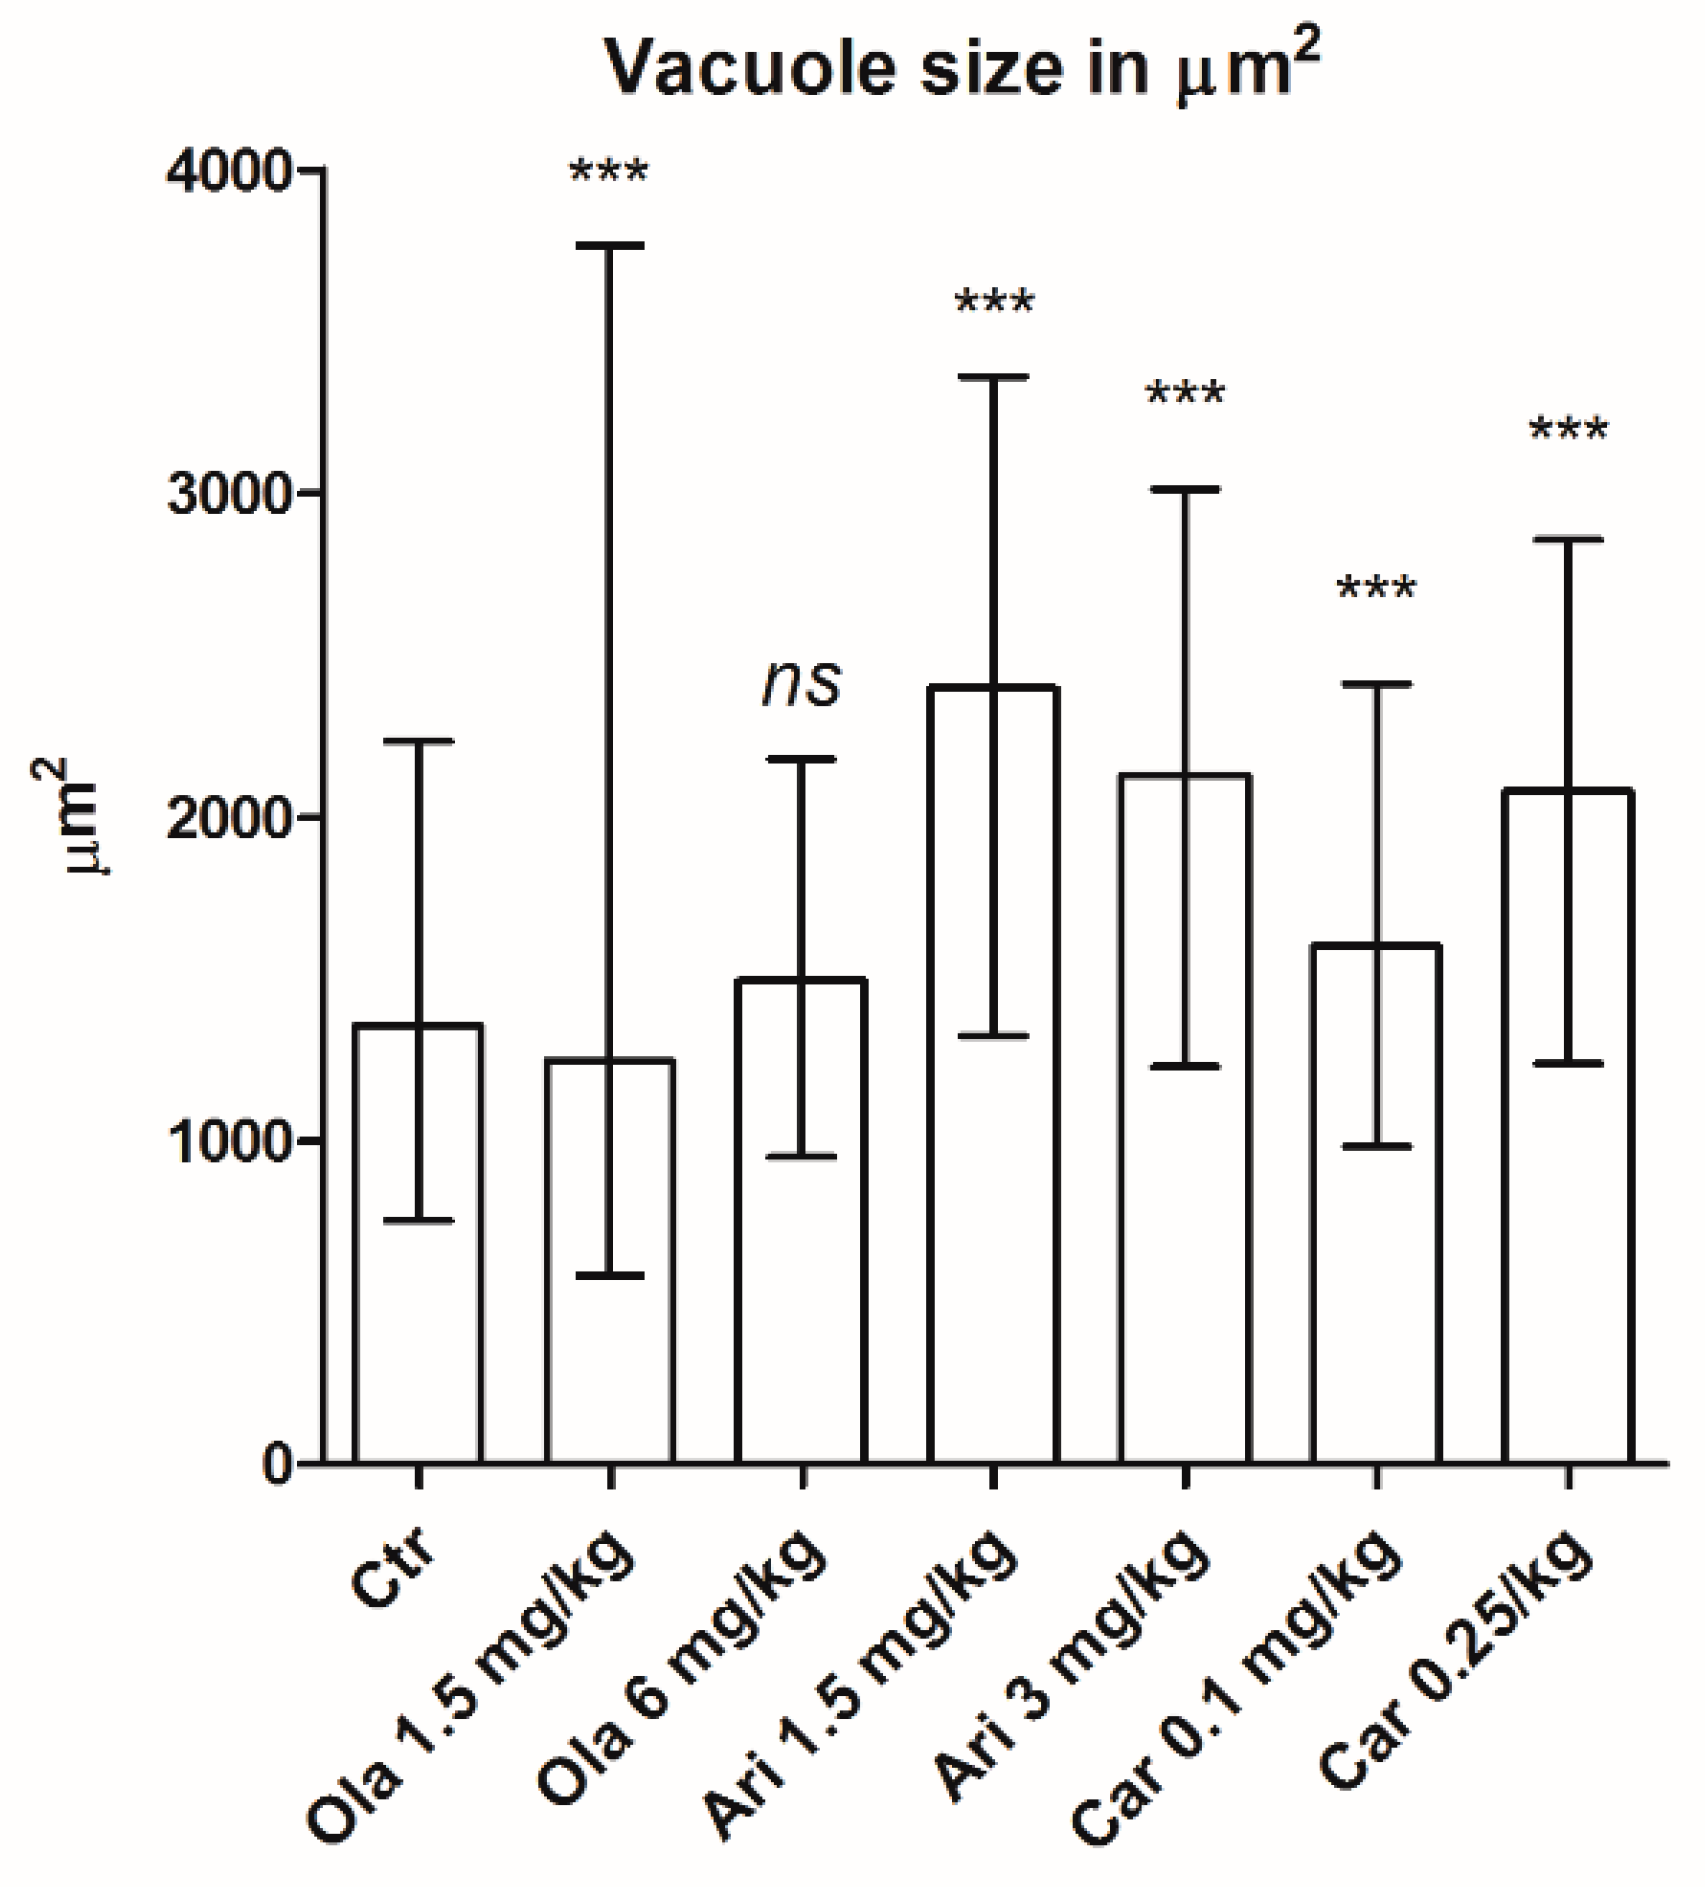
3.2. Vacuole Size
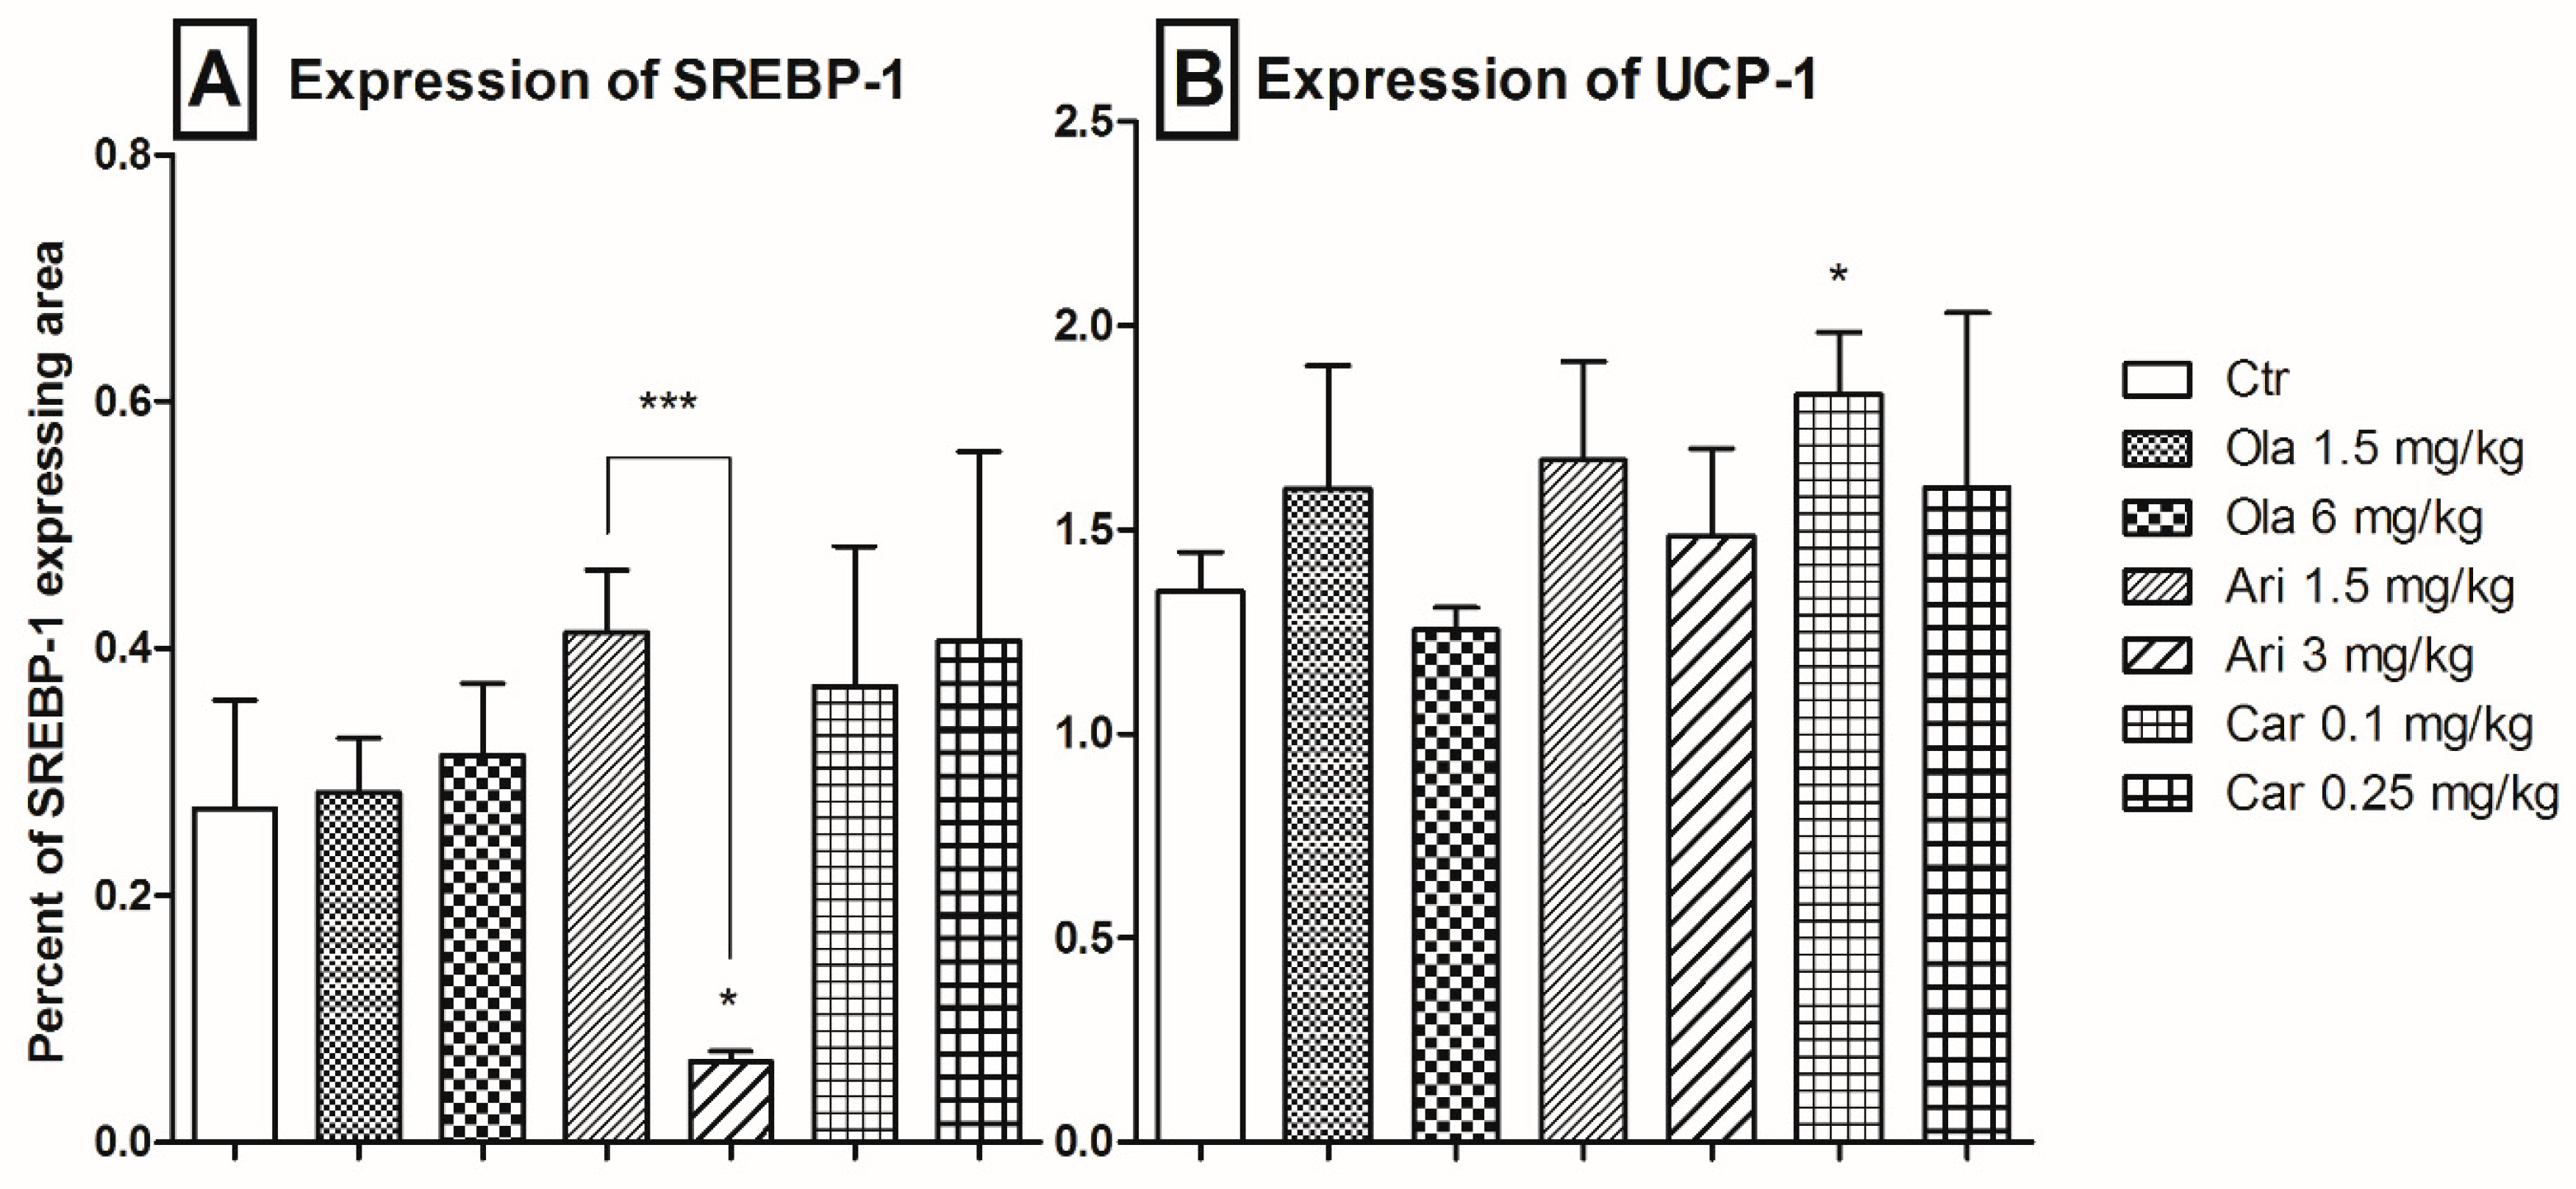
3.3. Adipose Tissue SREBP-1 and UCP-1 Expression
4. Discussion
4.1. Effect on Body Weight
4.2. Adipose Tissue-Specific Effects
4.3. Limitations
5. Conclusions
Author Contributions
Funding
Acknowledgments
Conflicts of Interest
References
- Taylor, D.M.; McAskill, R. Atypical antipsychotics and weightgain—A systematic review. Acta Psychiatr. Scand. 2000, 101, 416–432. [Google Scholar] [CrossRef]
- Orsolini, L.; Tomasetti, C.; Valchera, A.; Vecchiotti, R.; Matarazzo, I.; Vellante, F.; Iasevoli, F.; Buonaguro, E.F.; Fornaro, M.; Fiengo, A.L.C.; et al. An update of safety of clinically used atypical antipsychotics. Expert Opin. Drug Saf. 2016, 15, 1329–1347. [Google Scholar] [CrossRef]
- Nihalani, N.; Schwartz, T.L.; Siddiqui, U.A.; Megna, J.L. Weight gain, obesity, and psychotropic prescribing. J. Obes. 2011, 2011. [Google Scholar] [CrossRef] [Green Version]
- Citrome, L. The ABC’s of dopamine receptor partial agonists—Aripiprazole, brexpiprazole and cariprazine: The 15-min challenge to sort these agents out. Int. J. Clin. Pract. 2015, 69, 1211–1220. [Google Scholar] [CrossRef] [PubMed]
- Solmi, M.; Murru, A.; Pacchiarotti, I.; Undurraga, J.; Veronese, N.; Fornaro, M.; Stubbs, B.; Monaco, F.; Vieta, E.; Seeman, M.; et al. Safety, tolerability, and risks associated with first- and second-generation antipsychotics: A state-of-the-art clinical review. Ther. Clin. Risk Manag. 2017, 13, 757–777. [Google Scholar] [CrossRef] [PubMed] [Green Version]
- Mauri, M.C.; Paletta, S.; Maffini, M.; Colasanti, A.; Dragogna, F.; Di Pace, C.; Altamura, A.C. Clinical pharmacology of atypical antipsychotics: An update. EXCLI J. 2014, 13, 1163–1191. [Google Scholar] [PubMed]
- Nasrallah, H.A. Atypical antipsychotic-induced metabolic side effects: Insights from receptor-binding profiles. Mol. Psychiatry 2008, 13, 27–35. [Google Scholar] [CrossRef] [PubMed]
- Coccurello, R.; Moles, A. Potential mechanisms of atypical antipsychotic-induced metabolic derangement: Clues for understanding obesity and novel drug design. Pharmacol. Ther. 2010, 127, 210–251. [Google Scholar] [CrossRef] [PubMed]
- Bays, H.E.; Toth, P.P.; Kris-Etherton, P.M.; Abate, N.; Aronne, L.J.; Brown, W.V.; Gonzalez-Campoy, J.M.; Jones, S.R.; Kumar, R.; La Forge, R.; et al. Obesity, adiposity, and dyslipidemia: A consensus statement from the National Lipid Association. J. Clin. Lipidol. 2013, 7, 304–383. [Google Scholar] [CrossRef] [PubMed] [Green Version]
- Stefanidis, A.; Verty, A.N.A.; Allen, A.M.; Owens, N.C.; Cowley, M.A.; Oldfield, B.J. The role of thermogenesis in antipsychotic drug-induced weight gain. Obesity 2009, 17, 16–24. [Google Scholar] [CrossRef]
- Moseti, D.; Regassa, A.; Kim, W.K. Molecular regulation of adipogenesis and potential anti-adipogenic bioactive molecules. Int. J. Mol. Sci. 2016, 17, 124. [Google Scholar] [CrossRef] [Green Version]
- Ferré, P.; Foufelle, F. SREBP-1c transcription factor and lipid homeostasis: Clinical perspective. Horm. Res. 2007, 68, 72–82. [Google Scholar] [CrossRef] [PubMed]
- De Sá, P.M.; Richard, A.J.; Hang, H.; Stephens, J.M. Transcriptional regulation of adipogenesis. Compr. Physiol. 2017. [Google Scholar] [CrossRef]
- Kim, J.B.; Spiegelman, B.M. ADD1/SREBP1 promotes adipocyte differentiation and gene expression linked to fatty acid metabolism. Genes Dev. 1996, 10, 1096–1107. [Google Scholar] [CrossRef] [PubMed] [Green Version]
- Fajas, L.; Schoonjans, K.; Gelman, L.; Kim, J.B.; Najib, J.; Martin, G.; Fruchart, J.-C.; Briggs, M.; Spiegelman, B.M.; Auwerx, J. Regulation of Peroxisome Proliferator-Activated Receptor γ Expression by Adipocyte Differentiation and Determination Factor 1/Sterol Regulatory Element Binding Protein 1: Implications for Adipocyte Differentiation and Metabolism. Mol. Cell. Biol. 1999, 19, 5495–5503. [Google Scholar] [CrossRef] [Green Version]
- Kim, J.B.; Wright, H.M.; Wright, M.; Spiegelman, B.M. ADD1/SREBP1 activates PPARγ through the production of endogenous ligand. Proc. Natl. Acad. Sci. USA 1998, 95, 4333–4337. [Google Scholar] [CrossRef] [Green Version]
- Yang, L.H.; Chen, T.M.; Yu, S.T.; Chen, Y.H. Olanzapine induces SREBP-1-related adipogenesis in 3T3-L1 cells. Pharmacol. Res. 2007, 56, 202–208. [Google Scholar] [CrossRef]
- Skrede, S.; Fernø, J.; Vázquez, M.J.; Fjær, S.; Pavlin, T.; Lunder, N.; Vidal-Puig, A.; Diéguez, C.; Berge, R.K.; López, M.; et al. Olanzapine, but not aripiprazole, weight-independently elevates serum triglycerides and activates lipogenic gene expression in female rats. Int. J. Neuropsychopharmacol. 2012, 15, 163–179. [Google Scholar] [CrossRef] [Green Version]
- Hu, Y.; Kutscher, E.; Davies, G.E. Berberine inhibits SREBP-1-related clozapine and risperidone induced adipogenesis in 3T3-L1 cells. Phyther. Res. 2010, 24, 1831–1838. [Google Scholar] [CrossRef]
- Sokolov, S.S.; Balakireva, A.V.; Markova, O.V.; Severin, F.F. Negative feedback of glycolysis and oxidative phosphorylation: Mechanisms of and reasons for it. Biochemistry 2015, 80, 559–564. [Google Scholar] [CrossRef]
- Cypess, A.M.; Lehman, S.; Williams, G.; Tal, I.; Rodman, D.; Goldfine, A.B.; Kuo, F.C.; Palmer, E.L.; Tseng, Y.H.; Doria, A.; et al. Identification and importance of brown adipose tissue in adult humans. N. Engl. J. Med. 2009, 360, 1509–1517. [Google Scholar] [CrossRef] [Green Version]
- Panariello, F.; De Luca, V.; de Bartolomeis, A. Weight Gain, Schizophrenia and Antipsychotics: New Findings from Animal Model and Pharmacogenomic Studies. Schizophr. Res. Treat. 2011, 2011, 1–16. [Google Scholar] [CrossRef]
- Kristóf, E.; Doan-Xuan, Q.M.; Sárvári, A.K.; Klusóczki, Á; Fischer-Posovszky, P.; Wabitsch, M.; Bacso, Z.; Bai, P.; Balajthy, Z.; Fésüs, L. Clozapine modifies the differentiation program of human adipocytes inducing browning. Transl. Psychiatry 2016, 6. [Google Scholar] [CrossRef]
- Weston-Green, K.; Huang, X.F.; Deng, C. Olanzapine treatment and metabolic dysfunction: A dose response study in female Sprague Dawley rats. Behav. Brain Res. 2011, 217, 337–346. [Google Scholar] [CrossRef] [PubMed]
- De Santis, M.; Pan, B.; Lian, J.; Huang, X.F.; Deng, C. Different effects of Bifeprunox, Aripiprazole, and Haloperidol on body weight gain, food and water intake, and locomotor activity in rats. Pharmacol. Biochem. Behav. 2014, 124, 167–173. [Google Scholar] [CrossRef] [Green Version]
- Watson, D.J.G.; King, M.V.; Gyertyán, I.; Kiss, B.; Adham, N.; Fone, K.C.F. The dopamine D3-preferring D2/D3 dopamine receptor partial agonist, cariprazine, reverses behavioural changes in a rat neurodevelopmental model for schizophrenia. Eur. Neuropsychopharmacol. 2016, 26, 208–224. [Google Scholar] [CrossRef]
- Li, H.; Peng, S.; Li, S.; Liu, S.; Lv, Y.; Yang, N.; Yu, L.; Deng, Y.H.; Zhang, Z.; Fang, M.; et al. Chronic olanzapine administration causes metabolic syndrome through inflammatory cytokines in rodent models of insulin resistance. Sci. Rep. 2019, 9, 1–12. [Google Scholar] [CrossRef] [PubMed]
- Echim, G.; Pisoschi, C.G.; Vari, C.E.; Kolcsàr, M.; Ősz, B.E.; Gáll, Z.; Chibelean, C.; Berbecaru-Iovan, A.; Dogaru, M.T. Long term effects of olanzapine cumulative doses on fat tissue. An experimental model in rats. Farmacia 2016, 64, 358–366. [Google Scholar]
- Leary, S.; Pharmaceuticals, F.; Ridge, H.; Underwood, W.; Anthony, R.; Cartner, S.; Grandin, T.; Collins, F.; Greenacre, C.; Gwaltney-brant, S.; et al. AVMA Guidelines for the Euthanasia of Animals, 2020th ed.; American Veterinary Medical Association: Schaumburg, NY, USA, 2020; ISBN 9781882691098. [Google Scholar]
- Hewitt, S.M.; Baskin, D.G.; Frevert, C.W.; Stahl, W.L.; Rosa-Molinar, E. Controls for Immunohistochemistry: The Histochemical Society’s Standards of Practice for Validation of Immunohistochemical Assays. J. Histochem. Cytochem. 2014, 62, 693–697. [Google Scholar] [CrossRef]
- Verma, S.K.; Nagashima, K.; Yaligar, J.; Michael, N.; Lee, S.S.; Xianfeng, T.; Gopalan, V.; Sadananthan, S.A.; Anantharaj, R.; Velan, S.S. Differentiating brown and white adipose tissues by high-resolution diffusion NMR spectroscopy. J. Lipid Res. 2017, 58, 289–298. [Google Scholar] [CrossRef] [Green Version]
- Kroeze, W.K.; Hufeisen, S.J.; Popadak, B.A.; Renock, S.M.; Steinberg, S.; Ernsberger, P.; Jayathilake, K.; Meltzer, H.Y.; Roth, B.L. H1-Histamine receptor affinity predicts short-term weight gain for typical and atypical antipsychotic drugs. Neuropsychopharmacology 2003, 28, 519–526. [Google Scholar] [CrossRef] [PubMed]
- Kun, I.Z.; Szántó, Z.; Kun, I.; Kolcsár, M. Konvencionális és atípusos antipszichotikumok okozta metabolikus szindróma. Orv. Értesítő 2017, 90, 7–18. [Google Scholar]
- Stahl, S.M. Atypical antipsychotics. In Stahl′s Essential Psychopharmacology: Neuroscientific Basis and Practical Applications; Cambridge University Press: Cambridge, UK, 2013; pp. 141–169. ISBN 978-1-107-02598-1. [Google Scholar]
- Fukagawa, K.; Sakata, T.; Shiraishi, T.; Yoshimatsu, H.; Fujimoto, K.; Ookuma, K.; Wada, H. Neuronal histamine modulates feeding behavior through H1-receptor in rat hypothalamus. Am. J. Physiol. Regul. Integr. Comp. Physiol. 1989, 256, 605–611. [Google Scholar] [CrossRef] [PubMed]
- Kim, S.F.; Huang, A.S.; Snowman, A.M.; Teuscher, C.; Snyder, S.H. Antipsychotic drug-induced weight gain mediated by histamine H1 receptor-linked activation of hypothalamic AMP-kinase. Proc. Natl. Acad. Sci. USA 2007, 104, 3456–3459. [Google Scholar] [CrossRef] [Green Version]
- Bába, L.I.; Kolcsár, M.; Kun, I.Z.; Ulakcsai, Z.; Bagaméry, F.; Szökő, É.; Tábi, T.; Gáll, Z. Effects of cariprazine, aripiprazole, and olanzapine on mouse fibroblast culture: Changes in adiponectin contents in supernatants, triglyceride accumulation, and peroxisome proliferator-activated receptor-γ expression. Medicina 2019, 55, 160. [Google Scholar] [CrossRef] [Green Version]
- Arulmozhi, D.K.; Dwyer, D.S.; Bodhankar, S.L. Antipsychotic induced metabolic abnormalities: An interaction study with various PPAR modulators in mice. Life Sci. 2006, 79, 1865–1872. [Google Scholar] [CrossRef]
- Boyda, H.N.; Procyshyn, R.M.; Tse, L.; Hawkes, E.; Jin, C.H.; Pang, C.C.Y.; Honer, W.G.; Barr, A.M. Differential effects of 3 classes of antidiabetic drugs on olanzapine-induced glucose dysregulation and insulin resistance in female rats. J. Psychiatry Neurosci. 2012, 37, 407–415. [Google Scholar] [CrossRef] [Green Version]
- Boyda, H.N.; Procyshyn, R.M.; Asiri, Y.; Wu, C.; Wang, C.K.; Lo, R.; Pang, C.C.Y.; Honer, W.G.; Barr, A.M. Antidiabetic-drug combination treatment for glucose intolerance in adult female rats treated acutely with olanzapine. Prog. Neuro Psychopharmacol. Biol. Psychiatry 2014, 48, 170–176. [Google Scholar] [CrossRef]
- Liu, X.; Lian, J.; Hu, C.H.; Deng, C. Betahistine co-treatment ameliorates dyslipidemia induced by chronic olanzapine treatment in rats through modulation of hepatic AMPKα-SREBP-1 and PPARα-dependent pathways. Pharmacol. Res. 2015, 100, 36–46. [Google Scholar] [CrossRef] [Green Version]
- Ren, L.; Sun, D.; Zhou, X.; Yang, Y.; Huang, X.; Li, Y.; Wang, C.; Li, Y. Chronic treatment with the modified Longdan Xiegan Tang attenuates olanzapine-induced fatty liver in rats by regulating hepatic de novo lipogenesis and fatty acid beta-oxidation-associated gene expression mediated by SREBP-1c, PPAR-alpha and AMPK-alpha. J. Ethnopharmacol. 2019, 232, 176–187. [Google Scholar] [CrossRef]
- Li, Y.; Zhao, X.; Feng, X.; Liu, X.; Deng, C.; Hu, C.H. Berberine alleviates olanzapine-induced adipogenesis via the AMPKα-SREBP pathway in 3T3-L1 cells. Int. J. Mol. Sci. 2016, 17, 1865. [Google Scholar] [CrossRef] [PubMed] [Green Version]
- Citrome, L. Activating and sedating adverse effects of second-generation antipsychotics in the treatment of schizophrenia and major depressive disorder: Absolute risk increase and number needed to harm. J. Clin. Psychopharmacol. 2017, 37, 138–147. [Google Scholar] [CrossRef] [PubMed]
- Lao, K.S.J.; He, Y.; Wong, I.C.K.; Besag, F.M.C.; Chan, E.W. Tolerability and Safety Profile of Cariprazine in Treating Psychotic Disorders, Bipolar Disorder and Major Depressive Disorder: A Systematic Review with Meta-Analysis of Randomized Controlled Trials. CNS Drugs 2016, 30, 1043–1054. [Google Scholar] [CrossRef] [Green Version]
- Nasrallah, H.A.; Earley, W.; Cutler, A.J.; Wang, Y.; Lu, K.; Laszlovszky, I.; Németh, G.; Durgam, S. The safety and tolerability of cariprazine in long-term treatment of schizophrenia: A post hoc pooled analysis. BMC Psychiatry 2017, 17, 1–13. [Google Scholar] [CrossRef] [PubMed] [Green Version]
- Cai, H.L.; Tan, Q.Y.; Jiang, P.; Dang, R.L.; Xue, Y.; Tang, M.M.; Xu, P.; Deng, Y.; Li, H.D.; Yao, J.K. A potential mechanism underlying atypical antipsychotics-induced lipid disturbances. Transl. Psychiatry 2015, 5, e661. [Google Scholar] [CrossRef] [PubMed]
- Lian, J.; Huang, X.F.; Pai, N.; Deng, C. Preventing olanzapine-induced weight gain using betahistine: A study in a rat model with chronic olanzapine treatment. PLoS ONE 2014, 9, e104160. [Google Scholar] [CrossRef]
- Aggarwal, A.; Jethani, S.L.; Rohatgi, R.K.; Kalra, J. Selective serotonin re-uptake inhibitors (SSRIs) induced weight changes: A dose and duration dependent study on albino rats. J. Clin. Diagn. Res. 2016, 10, AF01–AF03. [Google Scholar] [CrossRef]
- Bába, L.I.; Gáll, Z.; Bíró, I.L.; Mezei, T.; Kun, I.Z.; Kolcsár, M. Chronic fluoxetine treatment induces lipid accumulation but does not alter the expression of Pref-1 in rat adipose tissue. Acta Pharm. 2018, 68, 109–115. [Google Scholar] [CrossRef] [Green Version]
- Skrede, S.; Martins, L.; Berge, R.K.; Steen, V.M.; López, M.; Ferno, J. Olanzapine depot formulation in rat: A step forward in modelling antipsychotic-induced metabolic adverse effects. Int. J. Neuropsychopharmacol. 2014, 17, 91–104. [Google Scholar] [CrossRef] [Green Version]
- Tews, D.; Pula, T.; Funcke, J.B.; Jastroch, M.; Keuper, M.; Debatin, K.M.; Wabitsch, M.; Fischer-Posovszky, P. Elevated UCP1 levels are sufficient to improve glucose uptake in human white adipocytes. Redox Biol. 2019, 26, 101286. [Google Scholar] [CrossRef]
- Kooijman, S.; Wang, Y.; Parlevliet, E.T.; Boon, M.R.; Edelschaap, D.; Snaterse, G.; Pijl, H.; Romijn, J.A.; Rensen, P.C.N. Central GLP-1 receptor signalling accelerates plasma clearance of triacylglycerol and glucose by activating brown adipose tissue in mice. Diabetologia 2015, 58, 2637–2646. [Google Scholar] [CrossRef] [Green Version]
- Bartelt, A.; Bruns, O.T.; Reimer, R.; Hohenberg, H.; Ittrich, H.; Peldschus, K.; Kaul, M.G.; Tromsdorf, U.I.; Weller, H.; Waurisch, C.; et al. Brown adipose tissue activity controls triglyceride clearance. Nat. Med. 2011, 17, 200–206. [Google Scholar] [CrossRef] [PubMed]
- Emanuelli, B.; Vienberg, S.G.; Smyth, G.; Cheng, C.; Stanford, K.I.; Arumugam, M.; Michael, M.D.; Adams, A.C.; Kharitonenkov, A.; Kahn, C.R. Interplay between FGF21 and insulin action in the liver regulates metabolism. J. Clin. Investig. 2014, 124, 515–527. [Google Scholar] [CrossRef] [PubMed] [Green Version]
- Berbeé, J.F.P.; Boon, M.R.; Khedoe, P.P.S.J.; Bartelt, A.; Schlein, C.; Worthmann, A.; Kooijman, S.; Hoeke, G.; Mol, I.M.; John, C.; et al. Brown fat activation reduces hypercholesterolaemia and protects from atherosclerosis development. Nat. Commun. 2015, 6. [Google Scholar] [CrossRef] [PubMed] [Green Version]
- Gordon, C.J. The mouse thermoregulatory system: Its impact on translating biomedical data to humans. Physiol. Behav. 2017, 179, 55–66. [Google Scholar] [CrossRef]
- Liu, X.; Cervantes, C.; Liu, F. Common and distinct regulation of human and mouse brown and beige adipose tissues: A promising therapeutic target for obesity. Protein Cell 2017, 8, 446–454. [Google Scholar] [CrossRef] [Green Version]
- Lazzari, P.; Serra, V.; Marcello, S.; Pira, M.; Mastinu, A. Metabolic side effects induced by olanzapine treatment are neutralized by CB1 receptor antagonist compounds co-administration in female rats. Eur. Neuropsychopharmacol. 2016. [Google Scholar] [CrossRef]


| Group | Dosage a |
|---|---|
| Ctr | Vehicle |
| Ola 1.5 mg/kg | 3 × 0.5 |
| Ola 6 mg/kg | 3 × 2 |
| Ari 1.5 mg/kg | 3 × 0.5 |
| Ari 3 g/kg | 3 × 1 |
| Car 0.1 mg/kg | 1 × 0.1 |
| Car 0.25 mg/kg | 1 × 0.25 |
| Drug | Statistical Analysis | Source of Variation | ||
|---|---|---|---|---|
| Treatment | Time | Interaction | ||
| Ola | FDf, Residual = F | F2,84 = 0.96 | F6,84 = 71.84 | F12,84 = 1.85 |
| p value summary | ns. (p = 0.403) | *** (p < 0.0001) | ns. (p = 0.053) | |
| Ari | FDf, Residual = F | F2,90 = 8.84 | F6,90 = 75.13 | F12,90 = 7.24 |
| p value summary | ** (p = 0.0029) | *** (p < 0.0001) | *** (p < 0.0001) | |
| Car | FDf, Residual = F | F2,90 = 10.88 | F6,90 = 25.43 | F12,90 = 9.31 |
| p value summary | ** (p = 0.0012) | *** (p < 0.0001) | *** (p < 0.0001) | |
Publisher’s Note: MDPI stays neutral with regard to jurisdictional claims in published maps and institutional affiliations. |
© 2020 by the authors. Licensee MDPI, Basel, Switzerland. This article is an open access article distributed under the terms and conditions of the Creative Commons Attribution (CC BY) license (http://creativecommons.org/licenses/by/4.0/).
Share and Cite
Bába, L.-I.; Gáll, Z.; Kolcsár, M.; Pap, Z.; Varga, Z.V.; Kovács, B.; Hack, B.; Kun, I.-Z. Effect on Body Weight and Adipose Tissue by Cariprazine: A Head-to-Head Comparison Study to Olanzapine and Aripiprazole in Rats. Sci. Pharm. 2020, 88, 50. https://0-doi-org.brum.beds.ac.uk/10.3390/scipharm88040050
Bába L-I, Gáll Z, Kolcsár M, Pap Z, Varga ZV, Kovács B, Hack B, Kun I-Z. Effect on Body Weight and Adipose Tissue by Cariprazine: A Head-to-Head Comparison Study to Olanzapine and Aripiprazole in Rats. Scientia Pharmaceutica. 2020; 88(4):50. https://0-doi-org.brum.beds.ac.uk/10.3390/scipharm88040050
Chicago/Turabian StyleBába, László-István, Zsolt Gáll, Melinda Kolcsár, Zsuzsánna Pap, Zoltán V. Varga, Béla Kovács, Beatrix Hack, and Imre-Zoltán Kun. 2020. "Effect on Body Weight and Adipose Tissue by Cariprazine: A Head-to-Head Comparison Study to Olanzapine and Aripiprazole in Rats" Scientia Pharmaceutica 88, no. 4: 50. https://0-doi-org.brum.beds.ac.uk/10.3390/scipharm88040050