Article

Development of Microemulsions Containing Glochidion wallichianum Leaf Extract and Potential for Transdermal and Topical Skin Delivery of Gallic Acid

by
Attawadee Sae Yoon
1,2 and
Pajaree Sakdiset
1,2,*
1
Drug and Cosmetics Excellence Center, Walailak University, 222 Thaiburi, Thasala 80161, Nakhon Si Thammarat, Thailand
2
School of Pharmacy, Walailak University, 222 Thaiburi, Thasala 80161, Nakhon Si Thammarat, Thailand
*
Author to whom correspondence should be addressed.
Submission received: 8 August 2020 / Revised: 24 September 2020 / Accepted: 28 October 2020 / Published: 4 November 2020

Abstract

:
Glochidion wallichianum (GW) is a good source of antioxidants, including gallic acid, promoting its development as a microemulsion. We constructed five pseudo-ternary phase diagrams comprising isopropyl myristate (IPM), water, and surfactant mixture (Smix)—i.e., Labrasol®:HCO-40® (1:1) with Transcutol® (1:1, 2:1, 3:1), and Tween80:Span80 (3:2) with Transcutol® or propylene glycol:ethanol (1:1). Additionally, blank and GW extract-loaded microemulsions were prepared at an IPM:Water:Smix ratio of 10:30:60 (high water content) and 30:10:60 (high oil content) from each Smix. The physical characteristics, skin permeation, and disposition were evaluated. The formulations with high water content and conductivities provided higher gallic acid permeation and disposition than those with high oil content. The Smix of Labrasol®:HCO-40® (1:1) and Transcutol® (1:1) promoted the highest gallic acid permeation (enhancement ratio 1.78 ± 0.12) and was suitable for transdermal delivery. However, the 1% hydroxypropyl methylcellulose control gel, the microemulsion with Smix of Labrasol®:HCO-40® (1:1) with Transcutol® (2:1), and Smix of Tween80:Span80 (3:2) with propylene glycol:ethanol (1:1) could provide higher skin accumulation of gallic acid than that with other formulations. The microstructures, ratio of surfactant:cosurfactant, and compositions of microemulsions were found to affect the skin permeation and disposition of gallic acid and require optimization to act as transdermal or topical delivery carriers.

1. Introduction

Glochidion wallichianum Mull. Arg. (GW), or synonym Glochidion perakense (Euphorbiaceae), or Mun Pu (Thai name), is an edible plant found throughout Southern Thailand. Generally, its young leaves are freshly consumed with the main food, similar to other indigenous vegetables in Southern Thailand, to improve health benefits. These edible indigenous vegetables are good sources of antioxidant compounds that help to prevent various chronic diseases, such as cancer, and neurodegenerative and cardiovascular diseases [1].
The antioxidant activity of GW leaf extract has been reported by Alzoreky and Nahakara [2]. The 80% methanolic extract provided high antioxidant activity, as determined by the ferrylmyoglobin/2,2′-azino-bis-3-ethylbenzthiazoline-6-sulphonic acid (ABTS) radical scavenging assay and high content of phenolic compounds. Panpipat et al. [3] also found that 50% acetone and 80% methanolic extracts of GW showed high phenolic content, which could promote 1,1-diphenyl-2-picrylhydrazyl (DPPH) and ABTS radical scavenging activity, and ferric reducing antioxidant power (FRAP). Moreover, Tangkanakul et al. [4] reported high DPPH radical scavenging activity and high phenolic content from the 95% ethanolic extract, compared to that from the aqueous extract. The active antioxidant constituents of GW were beta-carotene, lutein, total polyphenol, vitamin C, and vitamin E [1].
Among the antioxidant compounds in GW extract, total polyphenol, especially gallic acid (the phenolic acid), was the highest, which is related to its potent antioxidant activity [1]. These phenolic compounds possess photoprotective properties against UV radiation, anti-aging, anti-inflammatory, and antimicrobial activities, which encourage their use in skin cosmeceuticals and pharmaceutical products [5]. Moreover, some of their activities—e.g., anti-cancer, anti-inflammatory, and antidepressant activities—which aim for the systemic effect, along with the limitation of oral absorption, recommend the delivery of these compounds through the skin [6,7]. Nevertheless, a barrier function of the skin, a relatively low lipophilicity (log P 0.7), and an ionizable property (pKa = 4.4) of gallic acid limit its skin penetration [8]. Therefore, a microemulsion was introduced to overcome this limitation of skin permeability of phenolic compounds. A microemulsion is a single optically isotropic system comprising water, oil, surfactant, and cosurfactant. Microemulsion offers various advantages for skin formulations—e.g., its transparency, low viscosity, ease of preparation, and thermodynamic stability [9]. In addition, microemulsions have been reported to enhance skin permeation and disposition of both hydrophilic and lipophilic drugs, which could be controlled by varying the composition ratio and microemulsion type [10].
This study aimed to examine the antioxidant activity and gallic acid content of the GW leaf extract. A pseudo-ternary phase diagram was constructed using different amounts of isopropyl myristate (IPM), deionized water, and different types and ratios of surfactant mixture (Smix)—i.e., Labrasol®:HCO-40® (1:1) with Transcutol® (1:1, 2:1, 3:1), and Tween80:Span80 (3:2) with Transcutol®, or propylene glycol:ethanol (1:1). The microemulsion formulations containing the 1% GW extract were then prepared from IPM:Water:Smix ratio of 10:30:60 (high water content) and 30:10:60 (high oil content) from each Smix. The effects of formulation factors—e.g., contents of water and IPM, and types and ratios of surfactants:cosurfactants—on the physical characteristics, skin permeation, and disposition of the microemulsions were examined. Thus, suitable formulations that could deliver the markers of antioxidant compounds, such as gallic acid, transdermally or within the skin, could be obtained.

2. Materials and Methods

2.1. Materials

GW leaves were obtained from the Thasala district, Nakhon Si Thammarat province, Thailand. IPM, Polyethylene glycol40 hydrogenated castor oil (HCO-40®), Tween 80, and Span 80 were purchased from P.C. Drug Center Co., Ltd. (Bangkok, Thailand). PEG-8 caprylic/capric glycerides (Labrasol®) were obtained from Gattefosse SAS (Saint-Priest, France). Di(ethylene glycol) ethyl ether (Transcutol®), ascorbic acid, the reference standard of gallic acid, and 2,2-diphenyl-1-picrylhydrazyl free radicals (DPPH) were purchased from Sigma-Aldrich (St. Louis, MO, USA). PG, ethanol, sodium chloride, hydroxypropyl methylcellulose (HPMC), and activated charcoal were obtained from S. Tong Chemicals Co., Ltd. (Bangkok, Thailand). Sodium dihydrogen phosphate and disodium hydrogen phosphate anhydrous were obtained from Rankem (New Delhi, India). Methanol, acetonitrile, 85% ortho-phosphoric acid, and absolute ethanol were purchased from RCI Labscan Limited (Bangkok, Thailand). All solvents were of analytical grade and were used without further purification.

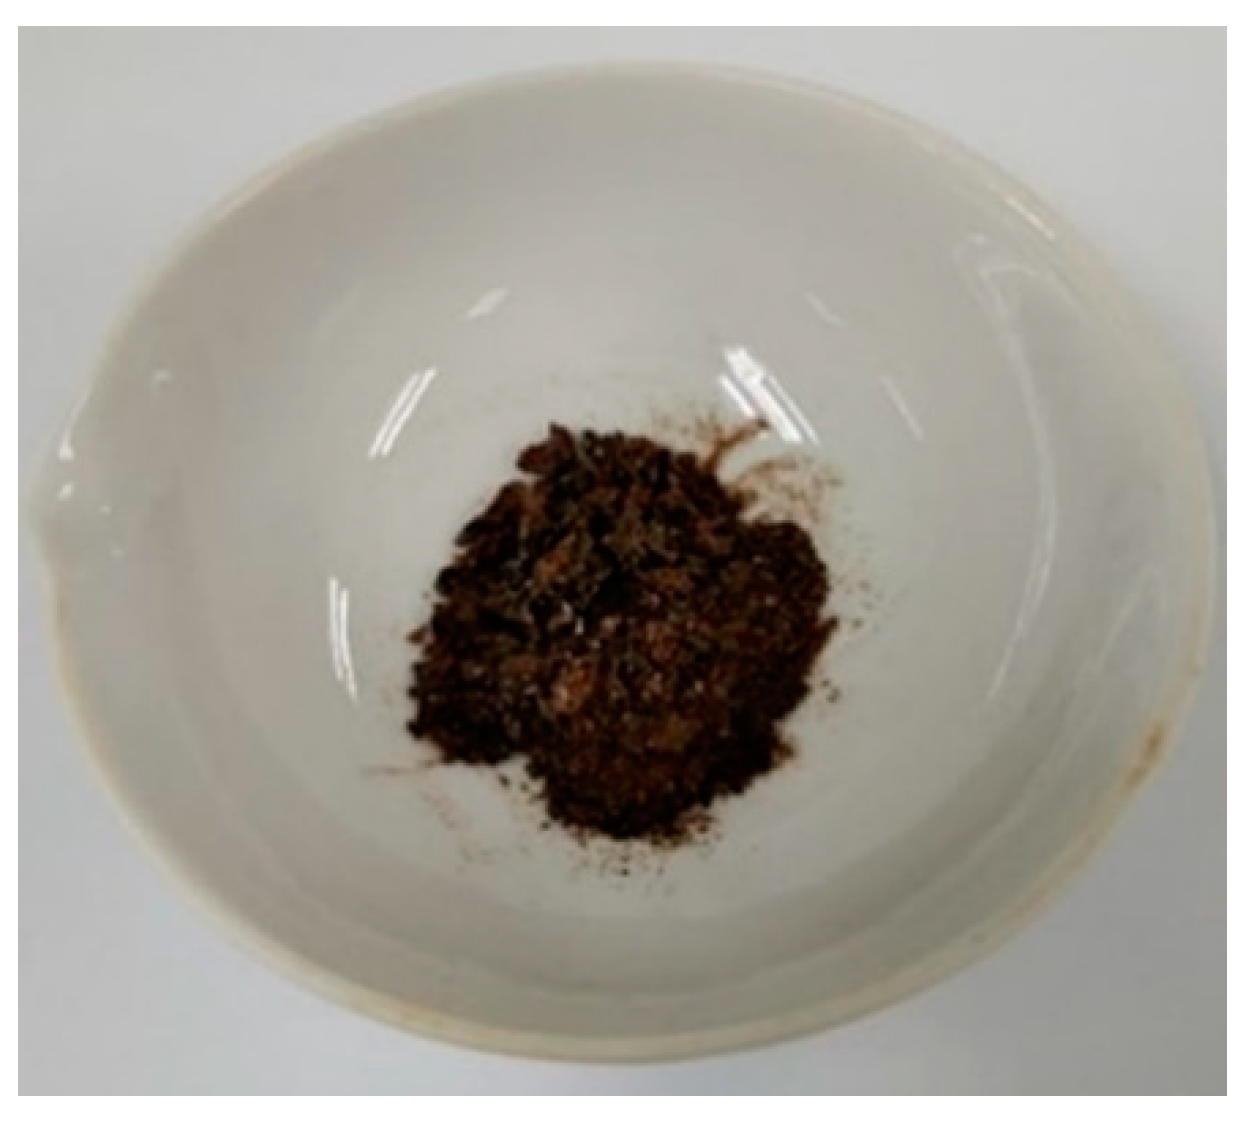
2.2. Preparation of GW Leaf Extract

GW leaves were washed to remove dust and impurities, air dried, and then dried in a hot air oven (UFE-700, Memmert GmbH, Schwabach, Germany) at 50 °C for 3 days. The dried GW leaves were then milled using a hammer mill (Olymix®PX-MFC 90 D, Kinematica AG, Luzern, Switzerland). The obtained dry powder of GW leaves was collected and stored in a tight, light-resistant, glass container for further extraction.
The extraction was performed using the ratio of dry powder of GW leaves and 95% ethanol (20 g/250 mL) in an Erlenmeyer flask. The extraction flask was continuously agitated at 25 °C for 12 h using a water bath shaker (WNB 22, Memmert GmbH, Schwabach, Germany). The resultant sample was then filtered first with a filter cloth and subsequently with a 0.45 µm filter paper with a diameter of 125 mm (WhatmanTM No.1, GE Healthcare UK Ltd., Buckinghamshire, UK) under vacuum to obtain a clear filtrate. Then, 0.5 g of activated charcoal was added to 100 mL of the filtrate and mixed by swirling for 1 h. The sample was filtered using the previously stated filtering process. The solvent of the filtrate was evaporated using a rotary evaporator (Hei-VAP Advantage ML, Heidolph Instruments GmbH, Schwabach, Germany) at 40 °C until the concentrate and viscous extracts were obtained. Finally, the viscous extract was placed in an evaporating dish and dried using a vacuum oven (VD23, Binder GmbH, Tuttlingen, Germany) at 40 °C for 4 days, collected, and stored in a tight, light-resistant, glass container.

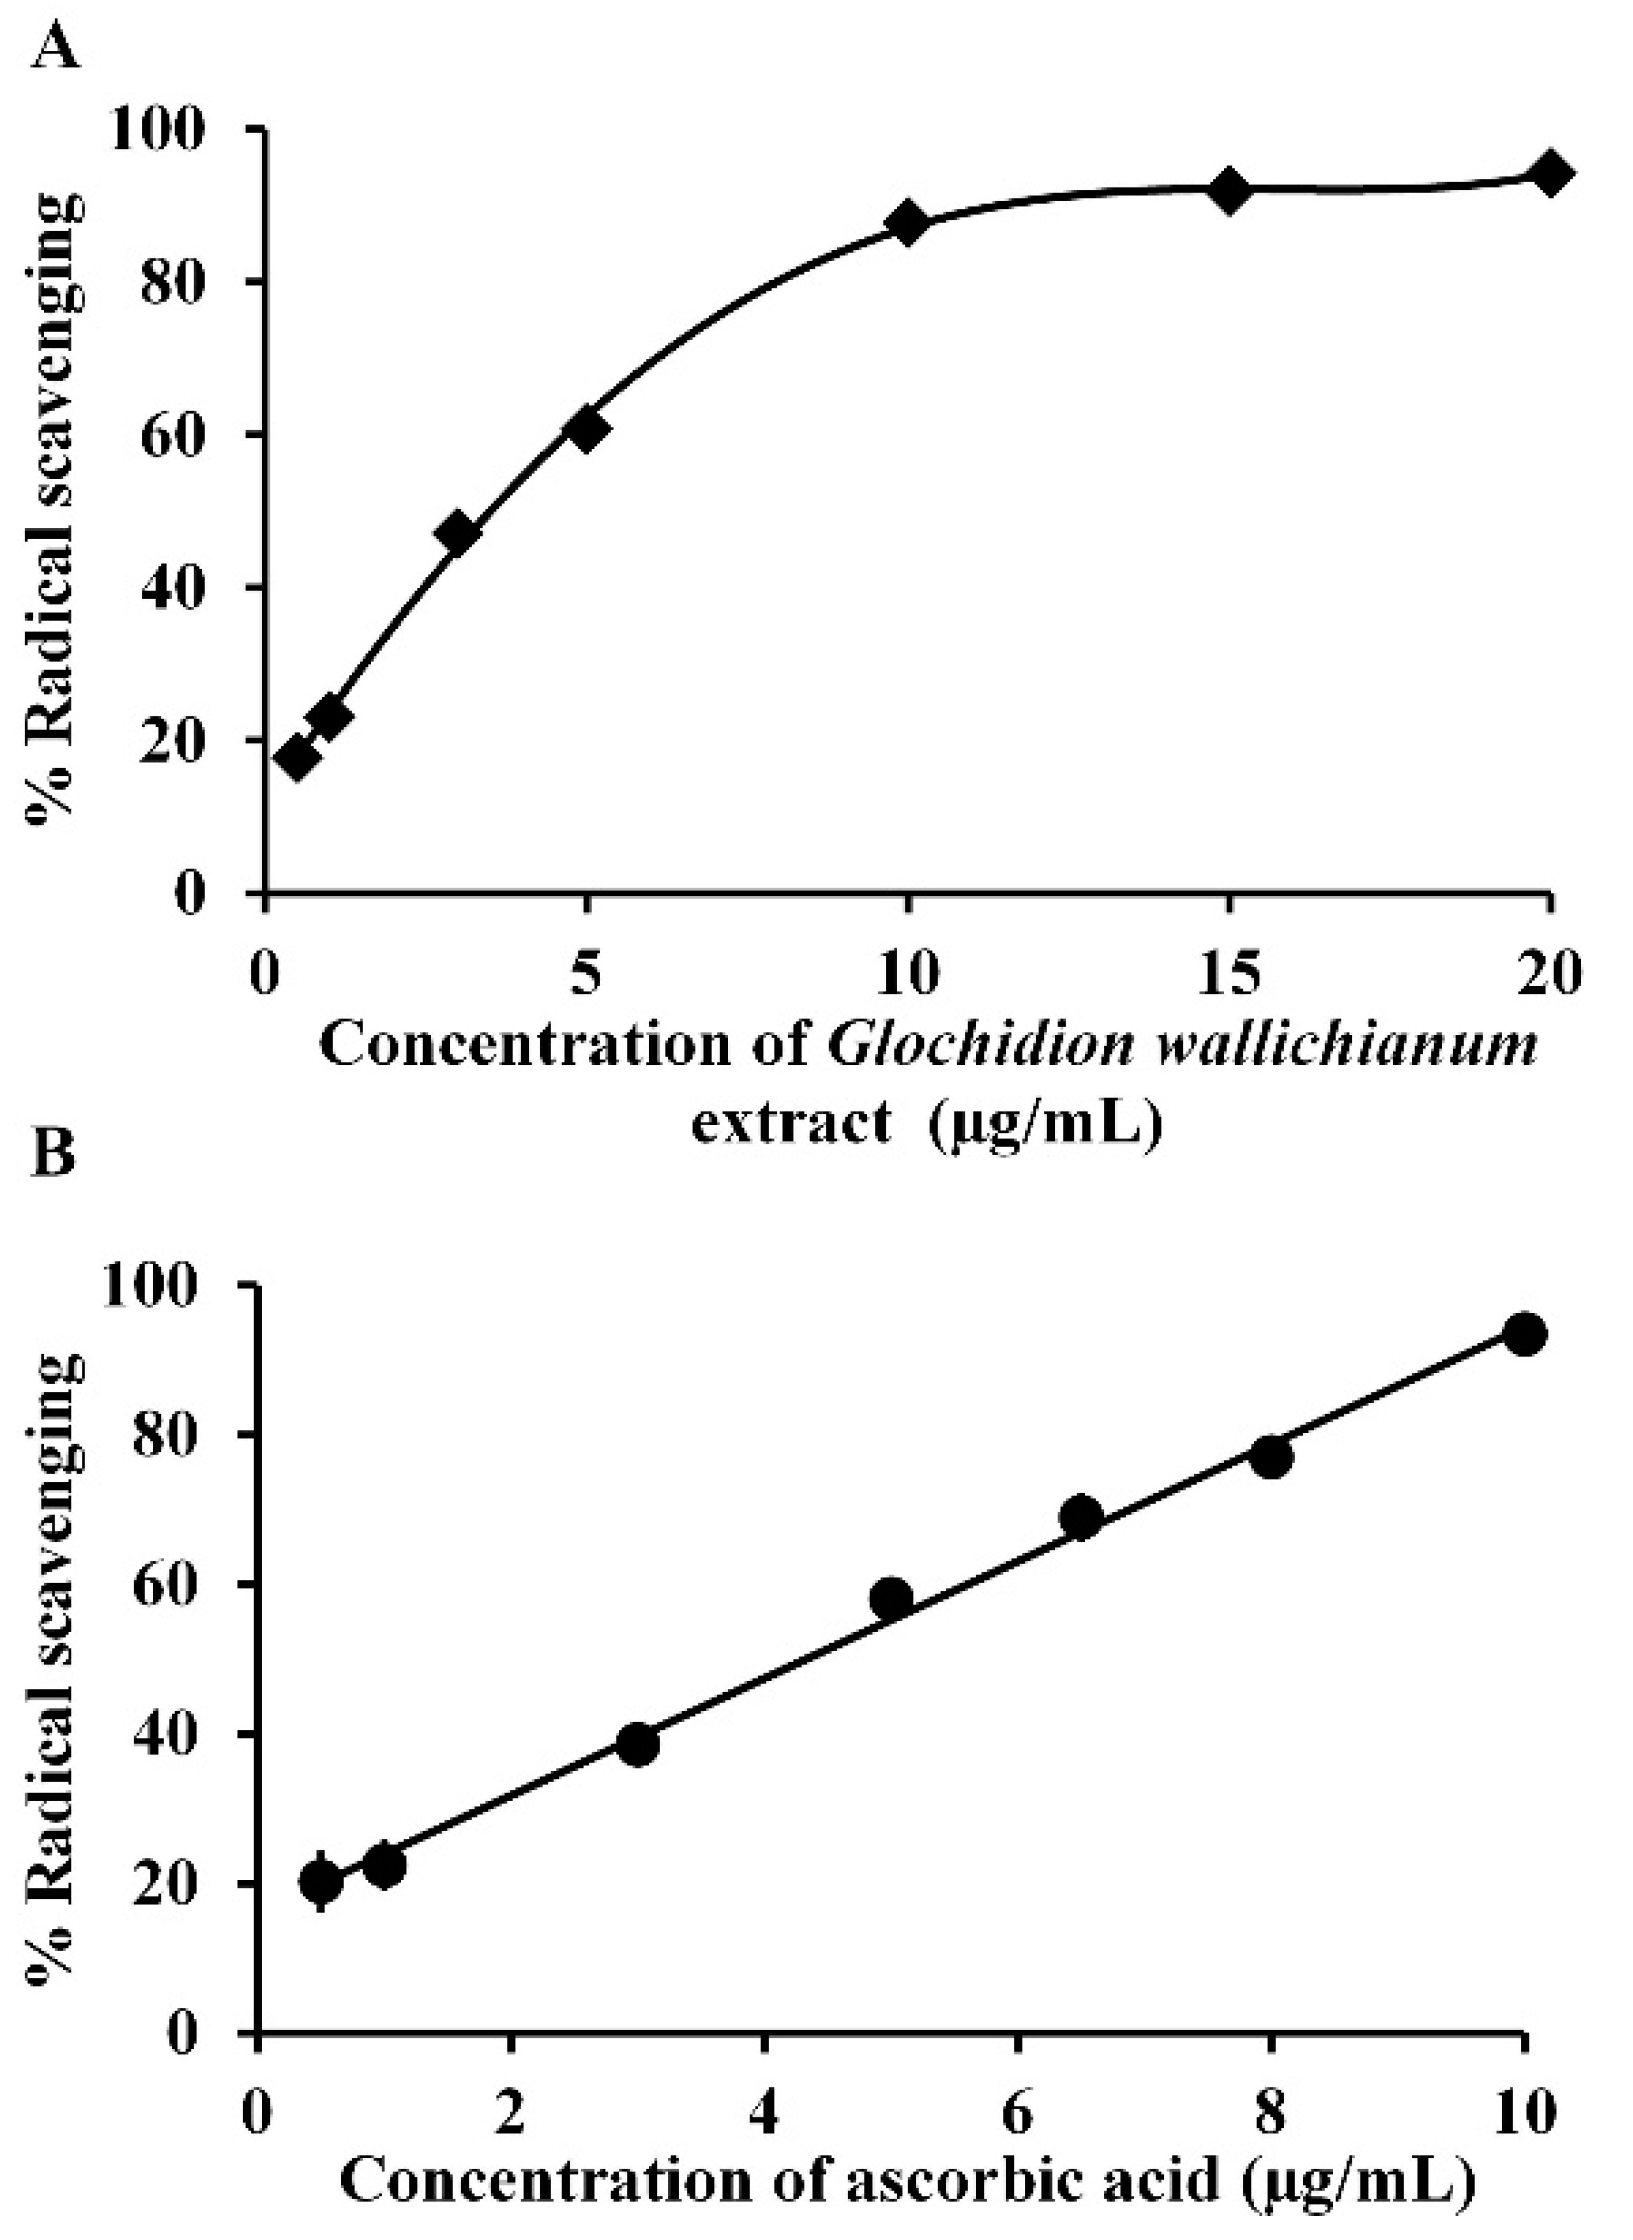
2.3. Determination of the Antioxidant Activity of GW Leaf Extract

The antioxidant activity of the obtained GW leaf extract was evaluated using the DPPH radical scavenging technique. The solution of DPPH in absolute ethanol was prepared at a concentration of 6 × 10⁻⁵ M [11]. The DPPH solution was mixed with different concentrations of GW leaf extract in 95% ethanol solution (0.5, 1, 3, 5, 10, 15, and 20 µg/mL) in a ratio of 1:1 by volume in 96-well plates. This setup was protected from light by wrapping the 96-well plate with aluminum foil and incubating at room temperature for 30 min. The absorbance of each sample was measured at 515 nm using a microplate reader (EonTM, BioTek Instruments, Inc., Winooski, VT, USA). Ethanol (95%) was used as a control. In addition, different concentrations of ascorbic acid (0.5, 1.0, 3.0, 5.0, 6.5, 8.0, and 10.0 µg/mL) were used as positive control samples. The DPPH radical scavenging activity was calculated using the following equation:
%   Radical   scavenging = ( OD   control     OD   sample   ) OD   control × 100
The EC50 values, which indicated the concentration of the GW extract or ascorbic acid required for the inhibition of 50% DPPH radicals, were obtained by the interpolation of the regression line of the plot between % radical scavenging and the concentration of samples. Each measurement was performed in triplicate.

2.4. Quantitative Analysis of Gallic Acid in GW Leaf Extract

Gallic acid, which is a phenolic acid abundant in GW, served as a marker for antioxidant compounds in GW. Gallic acid content in the GW leaf extract was determined using the high-performance liquid chromatography (HPLC) method modified from the study by Fernandes et al. [12]. The analysis was conducted on an HPLC system (Ultimate 3000TM HPLC systems, Thermo Scientific, Waltham, MA, USA) controlled by Chromeleon software. The column used was a reversed-phase C18 (250 × 4.6 mm, 5 µm particle size) column (Luna®, Phenomenex, Inc., Torrance, CA, USA) with the column temperature maintained at 30 °C.
Chromatographic separation was performed using a mobile phase of 0.05% phosphoric acid in water as solvent A and methanol as solvent B, at a flow rate of 1 mL/min, and an injection volume of 20 µL for 23 min. The mobile phase was filtered through a 0.45 µm nylon membrane filter with a diameter of 47 mm (Ligand Scientific Co., Ltd., Nonthaburi, Thailand) and degassed by sonication before use. The gradient program was as follows: 90–10% B (10 min), 20–80% B (10 min), 90–10% B (3 min). The peaks were detected at 271 nm and were identified by comparing the retention time with that of standard gallic acid.

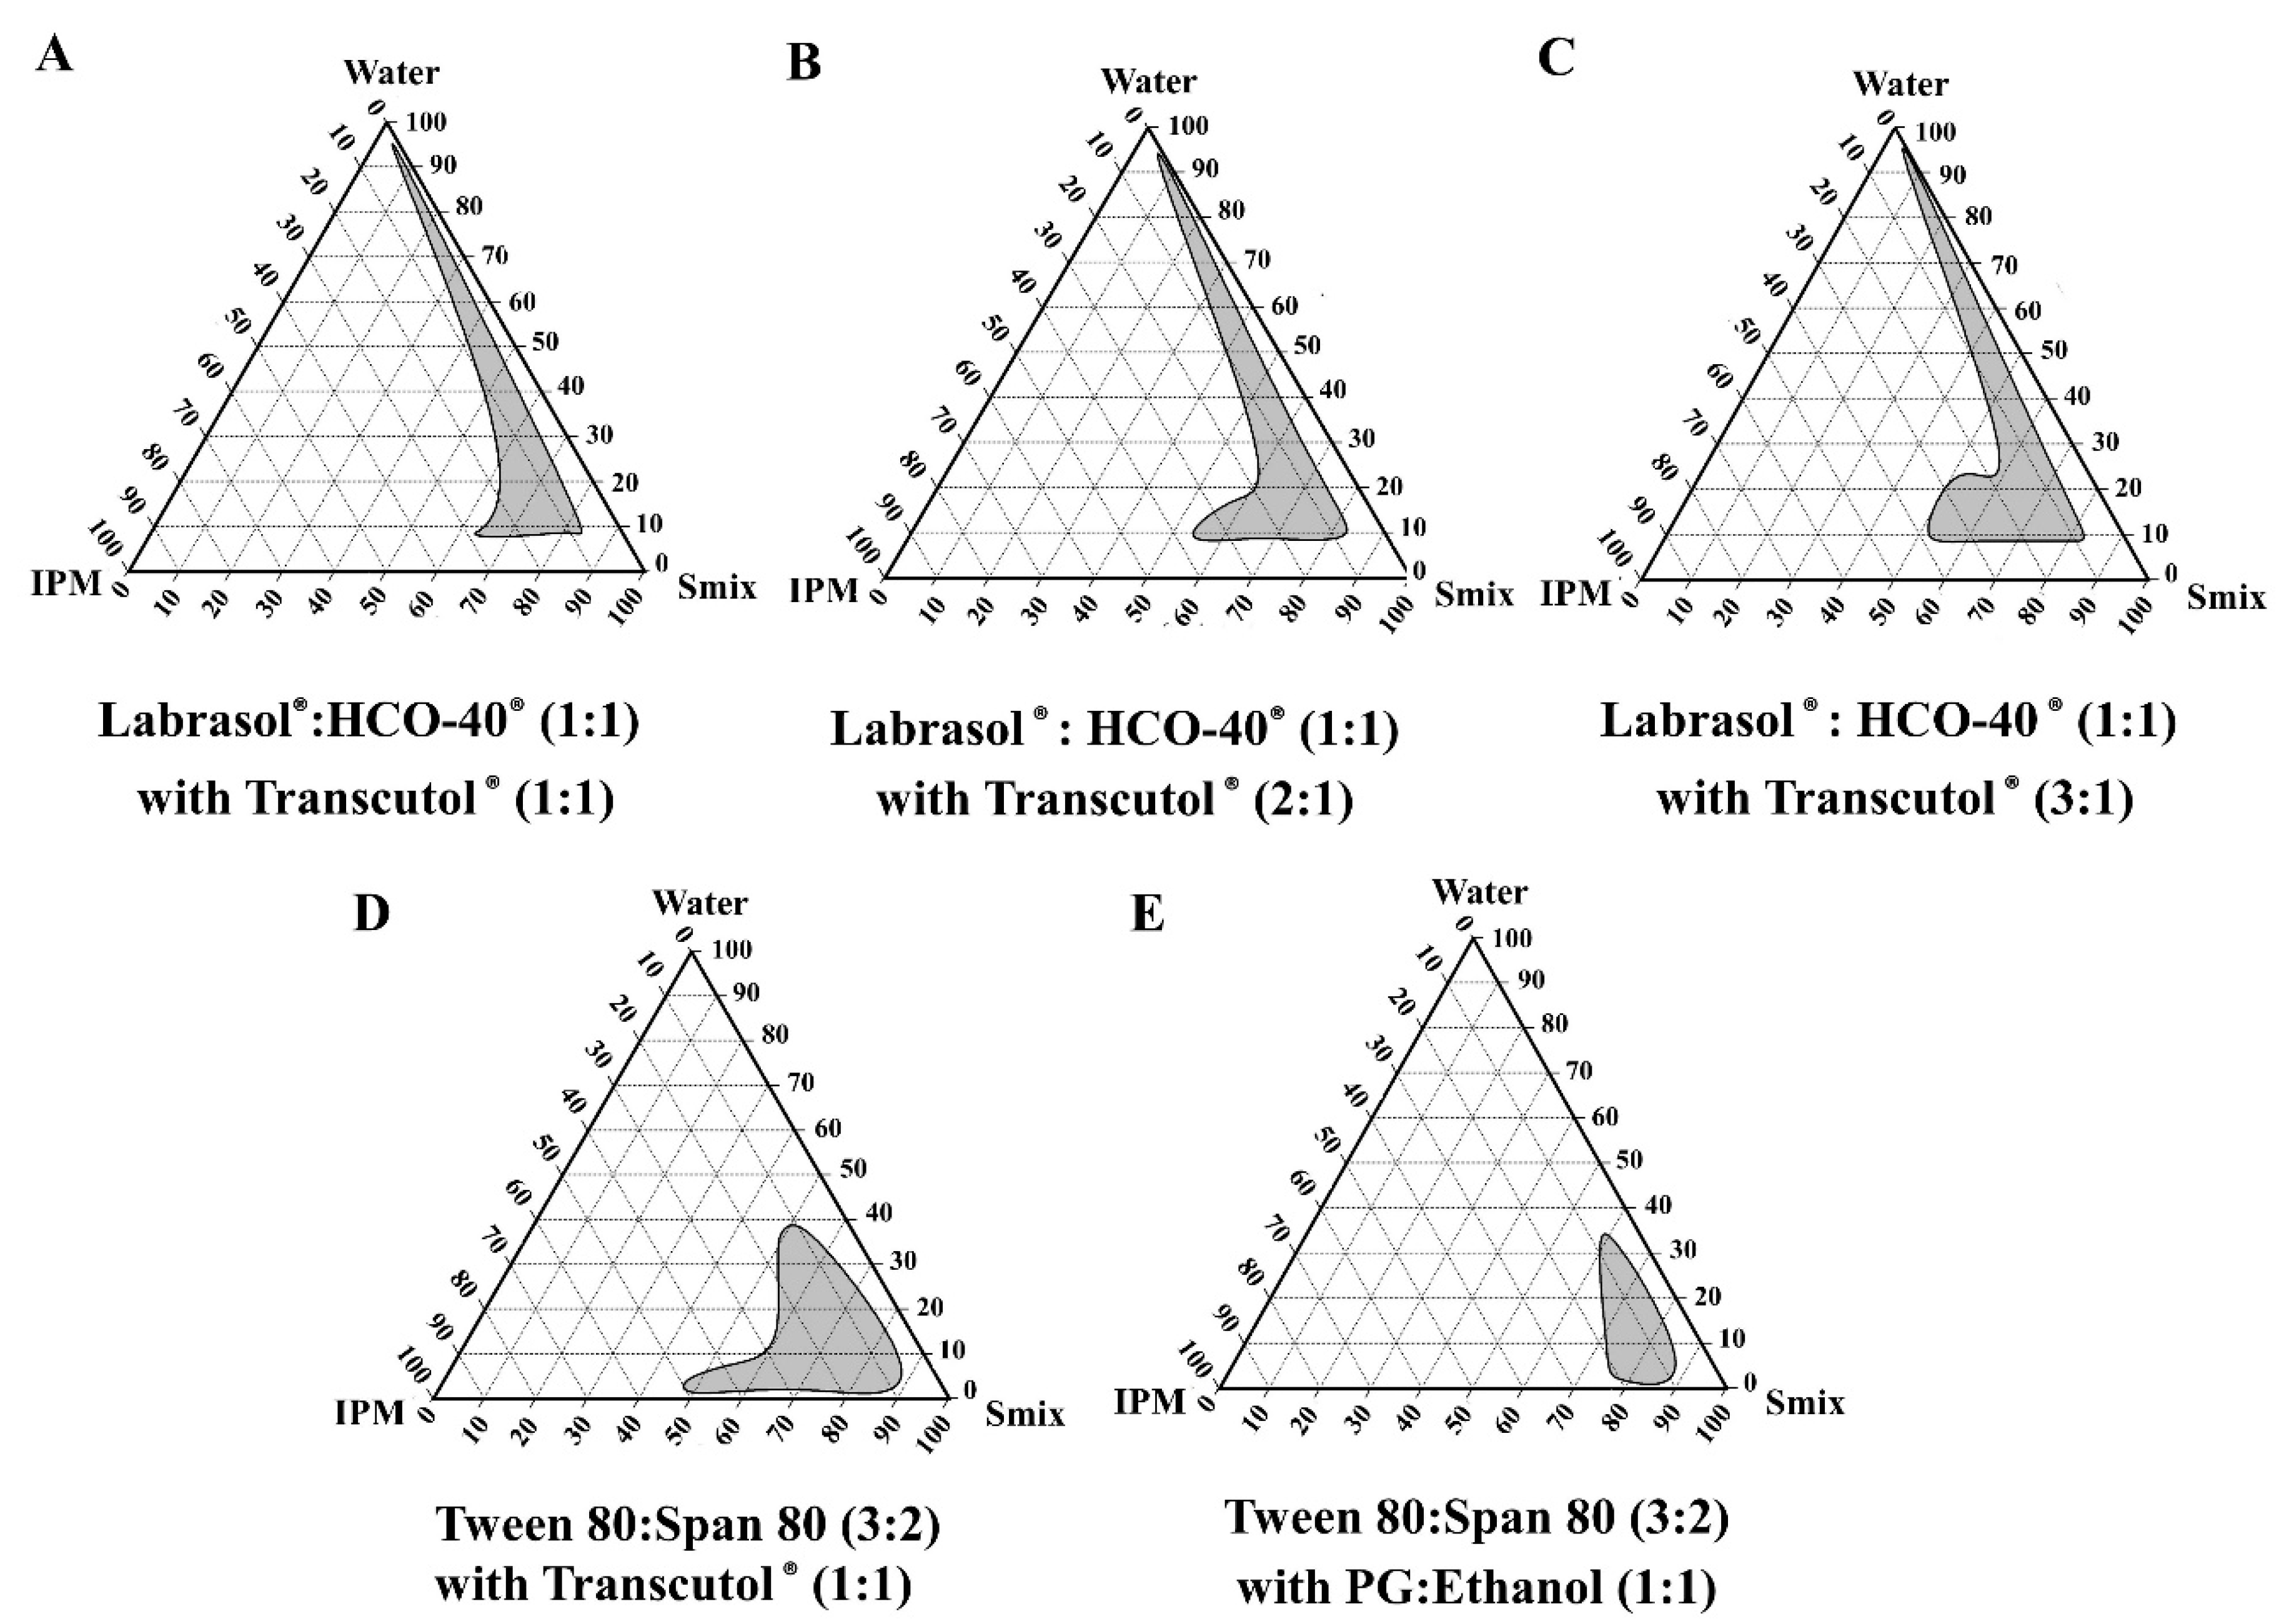
2.5. Construction of Pseudo-Ternary Phase Diagrams

Pseudo-ternary phase diagrams comprising oil, water, and surfactant:cosurfactant mixtures (Smix) were constructed. IPM was used as the oil phase. Deionized water was used as the water phase. The Smix used in this study consisted of Labrasol® and HCO-40® (1:1) as surfactants and Transcutol® as a cosurfactant in the ratios (w/w) of surfactant:cosurfactant 1:1, 2:1, and 3:1 (diagrams A, B, and C, respectively). In addition, other Smix systems comprising Tween 80 and Span 80 (3:2) as surfactants and Transcutol® (diagram D), or PG:ethanol (1:1) (diagram E) as cosurfactants in the ratio of surfactant:cosurfactants 1:1, were tested for comparison. Therefore, a total of five pseudo-ternary phase diagrams was obtained.
The water titration method was applied to construct the pseudo-ternary phase diagrams [9]. IPM was mixed with Smix at ratios of 1:9, 2:8, 3:7, 4:6, 5:5, 6:4, 7:3, 8:2, and 9:1 (w/w) to obtain 5 mL of the mixture. Distilled water was added in increments of 200 µL by micropipette into the mixture and stirred with a hot plate stirrer (AccuplateTM, Labnet International, Inc., Edison, NJ, USA) at room temperature (25 ± 2 °C). Isotropic regions presenting transparent, single-phase, and low viscous mixtures were plotted on the pseudo-ternary phase diagram.

2.6. Preparation of Blank Microemulsions and Microemulsions Containing the GW Extract

The ratio of IPM:Water:Smix, which obtained a clear isotropic mixture, was selected to prepare blank microemulsions. Two formulations from each diagram were selected, including the ratio of IPM:Water:Smix of 10:30:60 (high water content) and 30:10:60 (high oil content). However, only the systems comprising Smix of Tween 80:Span 80 and PG:ethanol (1:1) could not form microemulsions at a 10% water content. The ratios of the microemulsion constituents of these nine formulations are listed in Table 1. The microemulsions containing 1% GW extract were further prepared by adding the extract to the blank microemulsions and stirring until homogeneous mixtures were obtained. Furthermore, a control gel containing 1% HPMC in water was prepared, and the GW extract was added to the gel base to obtain 1% GW extract in the gel. Since the GW extract could not be fully dissolved in water and the precipitation of non-soluble GW extract was observed. We then prepared 1% HMPC gel as a vehicle to disperse the GW extract as a control formulation.

2.7. Characterization of Microemulsions

2.7.1. Droplet Size, Zeta Potential, and Conductivity Measurements

The droplet size of the internal phase, polydispersity index, zeta potential, and conductivity of the blank microemulsion and microemulsion containing the GW extract were analyzed using a particle size and zeta potential analyzer (Zetasizer, Nano Series, Malvern Instruments Ltd., Malvern, UK). The analysis was performed in a clear disposable zeta cell at 25 °C without dilution. All determinations were conducted in triplicate.

2.7.2. pH Measurement

The pH values of the blank microemulsions and microemulsions containing GW extract were determined at 25 °C using a pH meter (Jenway 3510, Cole-Parmer, Saint Neots, UK). All measurements were performed in triplicate.

2.7.3. Rheological Property

The viscosities of the blank microemulsions and microemulsions containing GW extract were determined at 25 °C using a rheometer system equipped with Hakke RheoWin (Haake Mars 60, ThermoFisher Scientific, Inc., Waltham, MA, USA). The samples (0.7 mL) were loaded onto the bottom plate of the rheometer. The upper plate of the rheometer was moved towards the bottom plate; the gap between the two plates was 0.5 mm. The flow experiments were performed over a shear rate range of 1 to 1000/s at a constant temperature of 25 °C. All determinations were performed in triplicate.

2.8. Skin Permeation Study of Microemulsions Containing GW Extract

Pig ear skins were obtained from the local fresh market in Thasala district, Nakhon Si Thammarat province, Thailand. The skins were frozen in a freezer (−20 °C) until further use. Before the skin permeation experiment, the pig ears were thawed to defrost the ice and cleaned with tap water followed by rinsing with deionized water. The skin was cut into 3 cm-diameter circles and the subcutaneous fat was removed using surgical scissors. Visual inspection was performed to assure the integrity of the skin prior to mounting and after the skin permeation experiment [13]. The full-thickness pig ear skins were then clamped onto Franz diffusion cells (effective diffusion area = 1.77 cm2) with the stratum corneum (SC) side upwards to the donor compartment. Twelve milliliters of phosphate buffer saline pH 7.4 (PBS) was added to the receptor compartment. Microemulsions (0.5 mL) containing GW extract were applied to the donor compartment. The Franz diffusion cells were placed on a transdermal diffusion cell (Model FDC-6, Logan Instrument Corp., Somerset, NJ, USA), maintained the skin surface temperature at 32 °C. The diffusion cells were stirred throughout the study period. At the predetermined time points of 0, 1, 2, 4, 6, 22, and 24 h, 1 mL samples were withdrawn from the receiver medium and replaced with 1 mL fresh PBS. All collected samples were then centrifuged (Sigma 4-16KS, Sigma Laborzentrifugen GmbH, Osterode, Germany) at 14,500 rpm and 4 °C for 5 min and analyzed using HPLC to determine the amount of gallic acid permeation. All determinations were performed in triplicate.
The cumulative amount of gallic acid permeated (Qt, µg/cm2) was calculated and displayed as a function of time. The slope of the linear portion of this plot showed the steady-state flux of gallic acid (Jss, µg/cm2/h) through the skin. The skin permeation enhancement ratio was calculated by comparing the flux of the microemulsion formulations with the flux of the control gel prepared from 1% HPMC and the same concentration of GW extract.

2.9. Skin Disposition Study of Microemulsions

The skin disposition study was performed using the procedure described by Dahlizar et al. [14]. At the end of the skin permeation experiments, the skin on each side at the SC and dermis was washed 10 times with 1 mL PBS and wiped with tissue paper. The skin was divided into two sides: the side with intact skin and that with SC removed. For the SC removal side (viable epidermis and dermis; VED), tapes were applied and removed from the skin 20 times. Then, each of the skin sides was weighed separately and reduced in size using scissors. Methanol (0.5 mL) was added to the minced skin and agitated using a shaking water bath at room temperature for 24 h. Samples were passed through a 0.45 µm syringe filter membrane (Agela Technologies, Torrance, CA, USA). The gallic acid content in the resulting supernatant was determined by HPLC. The amount of gallic acid in SC was calculated from the amount found in the intact skin minus the amount in the SC removal skin.

2.10. Statistical Analysis

All experimental data are presented as the mean ± standard deviation (SD). The test for significance between parameters was verified using the Student’s independent t-test. Differences were considered statistically significant at p < 0.05.

3. Results and Discussion

3.1. GW Leaf Extract, Antioxidant Activity, and Gallic Acid Content

The obtained GW leaf extract was a dark brown powder (Figure 1). The % yield of the extract as compared to that of the fresh leaves was 11.17 ± 1.73%. Although the decolorization process using activated carbon was applied to the preparation of the GW extract, it still presented a dark color. However, as compared to the previous process in our lab without the decolorization technique, this extract had a lighter color, which is more suitable for use in skin formulations. The antioxidant activity of the obtained GW extract as examined by DPPH radical scavenging activity is shown in Figure 2A. The calculated EC50 of the GW extract was 3.70 ± 0.11 µg/mL. A similar antioxidant activity, as compared to that of ascorbic acid, was observed with an EC50 of 4.33 ± 0.06, as shown in Figure 2B. This indicated the strong antioxidant activity of the obtained GW extract.
Gallic acid, which is a marker of the antioxidant compounds in GW, comprised 9.44 ± 0.01 mg/g of the crude GW extract, indicating a high quantity of gallic acid. Kongkachuichai et al. [1] reported that the antioxidant constituents in GW extract were beta-carotene 1405.46 ± 17.81 µg/100 g, lutein 3425.42 ± 94.46 µg/100 g, total polyphenol 4762.76 ± 83.07 mg GAE/100 g, vitamin C 18.99 ± 0.31 mg/100 g, and vitamin E 4.35 ± 0.15 mg/100 g. As the GW extract comprised a high amount of gallic acid, our study focused on gallic acid as a marker to observe the skin penetration efficiency of various microemulsion formulations.

3.2. Pseudo-Ternary Phase Diagrams of the Blank Microemulsions

The pseudo-ternary phase diagrams obtained from IPM, water, and Smix including Labrasol® and HCO-40® (1:1) with Transcutol® in the ratios of 1:1, 2:1, and 3:1 are shown in Figure 3A–C, respectively. The microemulsion (isotropic) region was observed in all diagrams. As reported in Panapisal, et al. [15], the isotropic region can be obtained when using IPM, water, and Smix of Labasol® and HCO-40® with Transcutol® at a weight ratio of 0.5:0.5:1. However, in our study, the Smix ratios used varied from 0.5:0.5:1, 1:1:1, and 1.5:1.5:1, respectively. As the ratio of Labasol® and HCO-40® compared to that of Transcutol® (cosurfactant) increased from 1:1 and 2:1 to 3:1, the isotropic region increased. Some studies reported that an increase in the cosurfactant ratio could stabilize the microemulsions and affect their formation [16,17]. However, similar to this study, there have been reports that an increase in the surfactant:cosurfactant ratio could increase the isotropic region by reducing the interfacial tension, hence improving the fluidity at the interface of the colloidal solution and increasing the entropy of the system [18,19,20].
In addition, other systems constructed using Tween 80 and Span 80 as surfactants and Transcutol® or PG: ethanol (1:1) as cosurfactants in the ratio of surfactant:cosurfactant at 1:1 were tested for comparison. Compared to the use of PG:ethanol, Transcutol® could increase the isotropic region, indicating that Transcutol® could better stabilize the microemulsion droplets. However, these two diagrams presented smaller isotropic regions than the region of the Smix of Labasol® and HCO-40®.

3.3. Preparation and Characterization of Blank Microemulsions and Microemulsions Containing GW Extract

Blank microemulsions and microemulsions containing GW extract were then prepared by selecting the IPM:Water:Smix ratio within the isotropic region. A total of nine formulations selected from the five diagrams were prepared and characterized.
The characterization results of the blank microemulsions are shown in Table 2. The droplet sizes of the blank microemulsions were within the range of 6–43 nm. It can be observed that the microemulsions with a high water content (ME_W1–W4) had larger droplet sizes than the corresponding formulations with a high oil content (ME_O1–O4). Similar results were observed that increasing the water content led to an increase in the droplet size of microemulsions [21,22]. All formulations showed zeta potential values near zero, indicating the neutral charge of the microemulsion droplets. Similar results have been found in other studies that contained nonionic surfactants as major components in microemulsions and these contribute to the neutral charge of the obtained microemulsion [23,24,25,26]. The type of microemulsion was evaluated by electrical conductivity measurements. According to Djordjevic et al. [27], the microemulsion type can be characterized by comparing the ratio of the oil (o) and water (w) phases, in which a higher ratio is specified as the external phase, in combination with the conductivity value (w/o 2.9–3.8 µS/cm, bicontinuous microemulsion 10.3–52.5 µS/cm, and o/w 80.5–94.3 µS/cm). Among the formulations prepared, the formulation using Labasol® and HCO-40® as surfactants with a high water content (ME_W1–W3) could be characterized as a bicontinuous phase (BP). For the formulations using Tween 80 and Span 80 (ME_W4 and W5), higher conductivities were observed than those of the Labasol® and HCO-40® formulations, and thus, could be characterized as o/w microemulsions. However, for the formulations with a high oil content (ME_O1–O4), lower conductivities were observed than their corresponding formulations and could be characterized as BP or w/o type.
Table 3 shows the characteristics of nine formulations of microemulsion containing the GW extract. The droplet size of all formulations increased significantly in comparison to that of the blank microemulsions. A similar result was found in the incorporation of Sompoi in microemulsions, showing that the extract may be solubilized and enriched in the external phase or surfactant layer resulting in a larger droplet size [28]. Unlike the blank microemulsions, the droplet size of the microemulsions containing GW extract with a high content of water (ME_W1–W4) and high content of oil (ME_O1–O4) were similar. The zeta potentials of these formulations were neutral. The importance of the highly negative charge of emulsion droplets for their stability has been reported [29]. Nevertheless, some studies found that neutrally charged microemulsions were physically stable after 3 months of storage [24,30]. As an evaluation of stability was not conducted in this study, which is a limitation of this study, the effect of neutral charge on the stability of microemulsions could not be determined. Therefore, further study on the stability of these microemulsions should be conducted in future work. The conductivity of all formulations increased, which might be owing to the ionized moieties of the phenolic compounds in the extract. Therefore, the conductivities in the formulations incorporating the GW extract were not counted as changes in the microstructure or type of microemulsions.
The viscosity and pH of all the blank microemulsions and microemulsions containing the GW extract are shown in Table 4. The viscosities of the blank microemulsions were low, in the range of 48 to 383 cP. However, the addition of 1% GW extract resulted in an increase in viscosity as high as 212–2273 cP. The formulations with the highest content of Transcutol® (ME_W1 and O1) had the lowest viscosity, and the viscosity increased as the cosurfactant content decreased. The explanation is that the presence of the cosurfactant molecules at the interfacial film could influence the fluidity of the interfacial film and thus reduce the apparent viscosity of the system [31]. Furthermore, the viscosity of the formulations with low water content was lower than that of its corresponding high water content formulations, as the high volume of water caused swelling of the microemulsion droplets, leading to stronger interactions between the interfacial membranes [32]. For pH, the addition of the GW extract caused a decrease in the pH of the corresponding blank microemulsions in all formulations, as it contained phenolic acids as the active compounds.

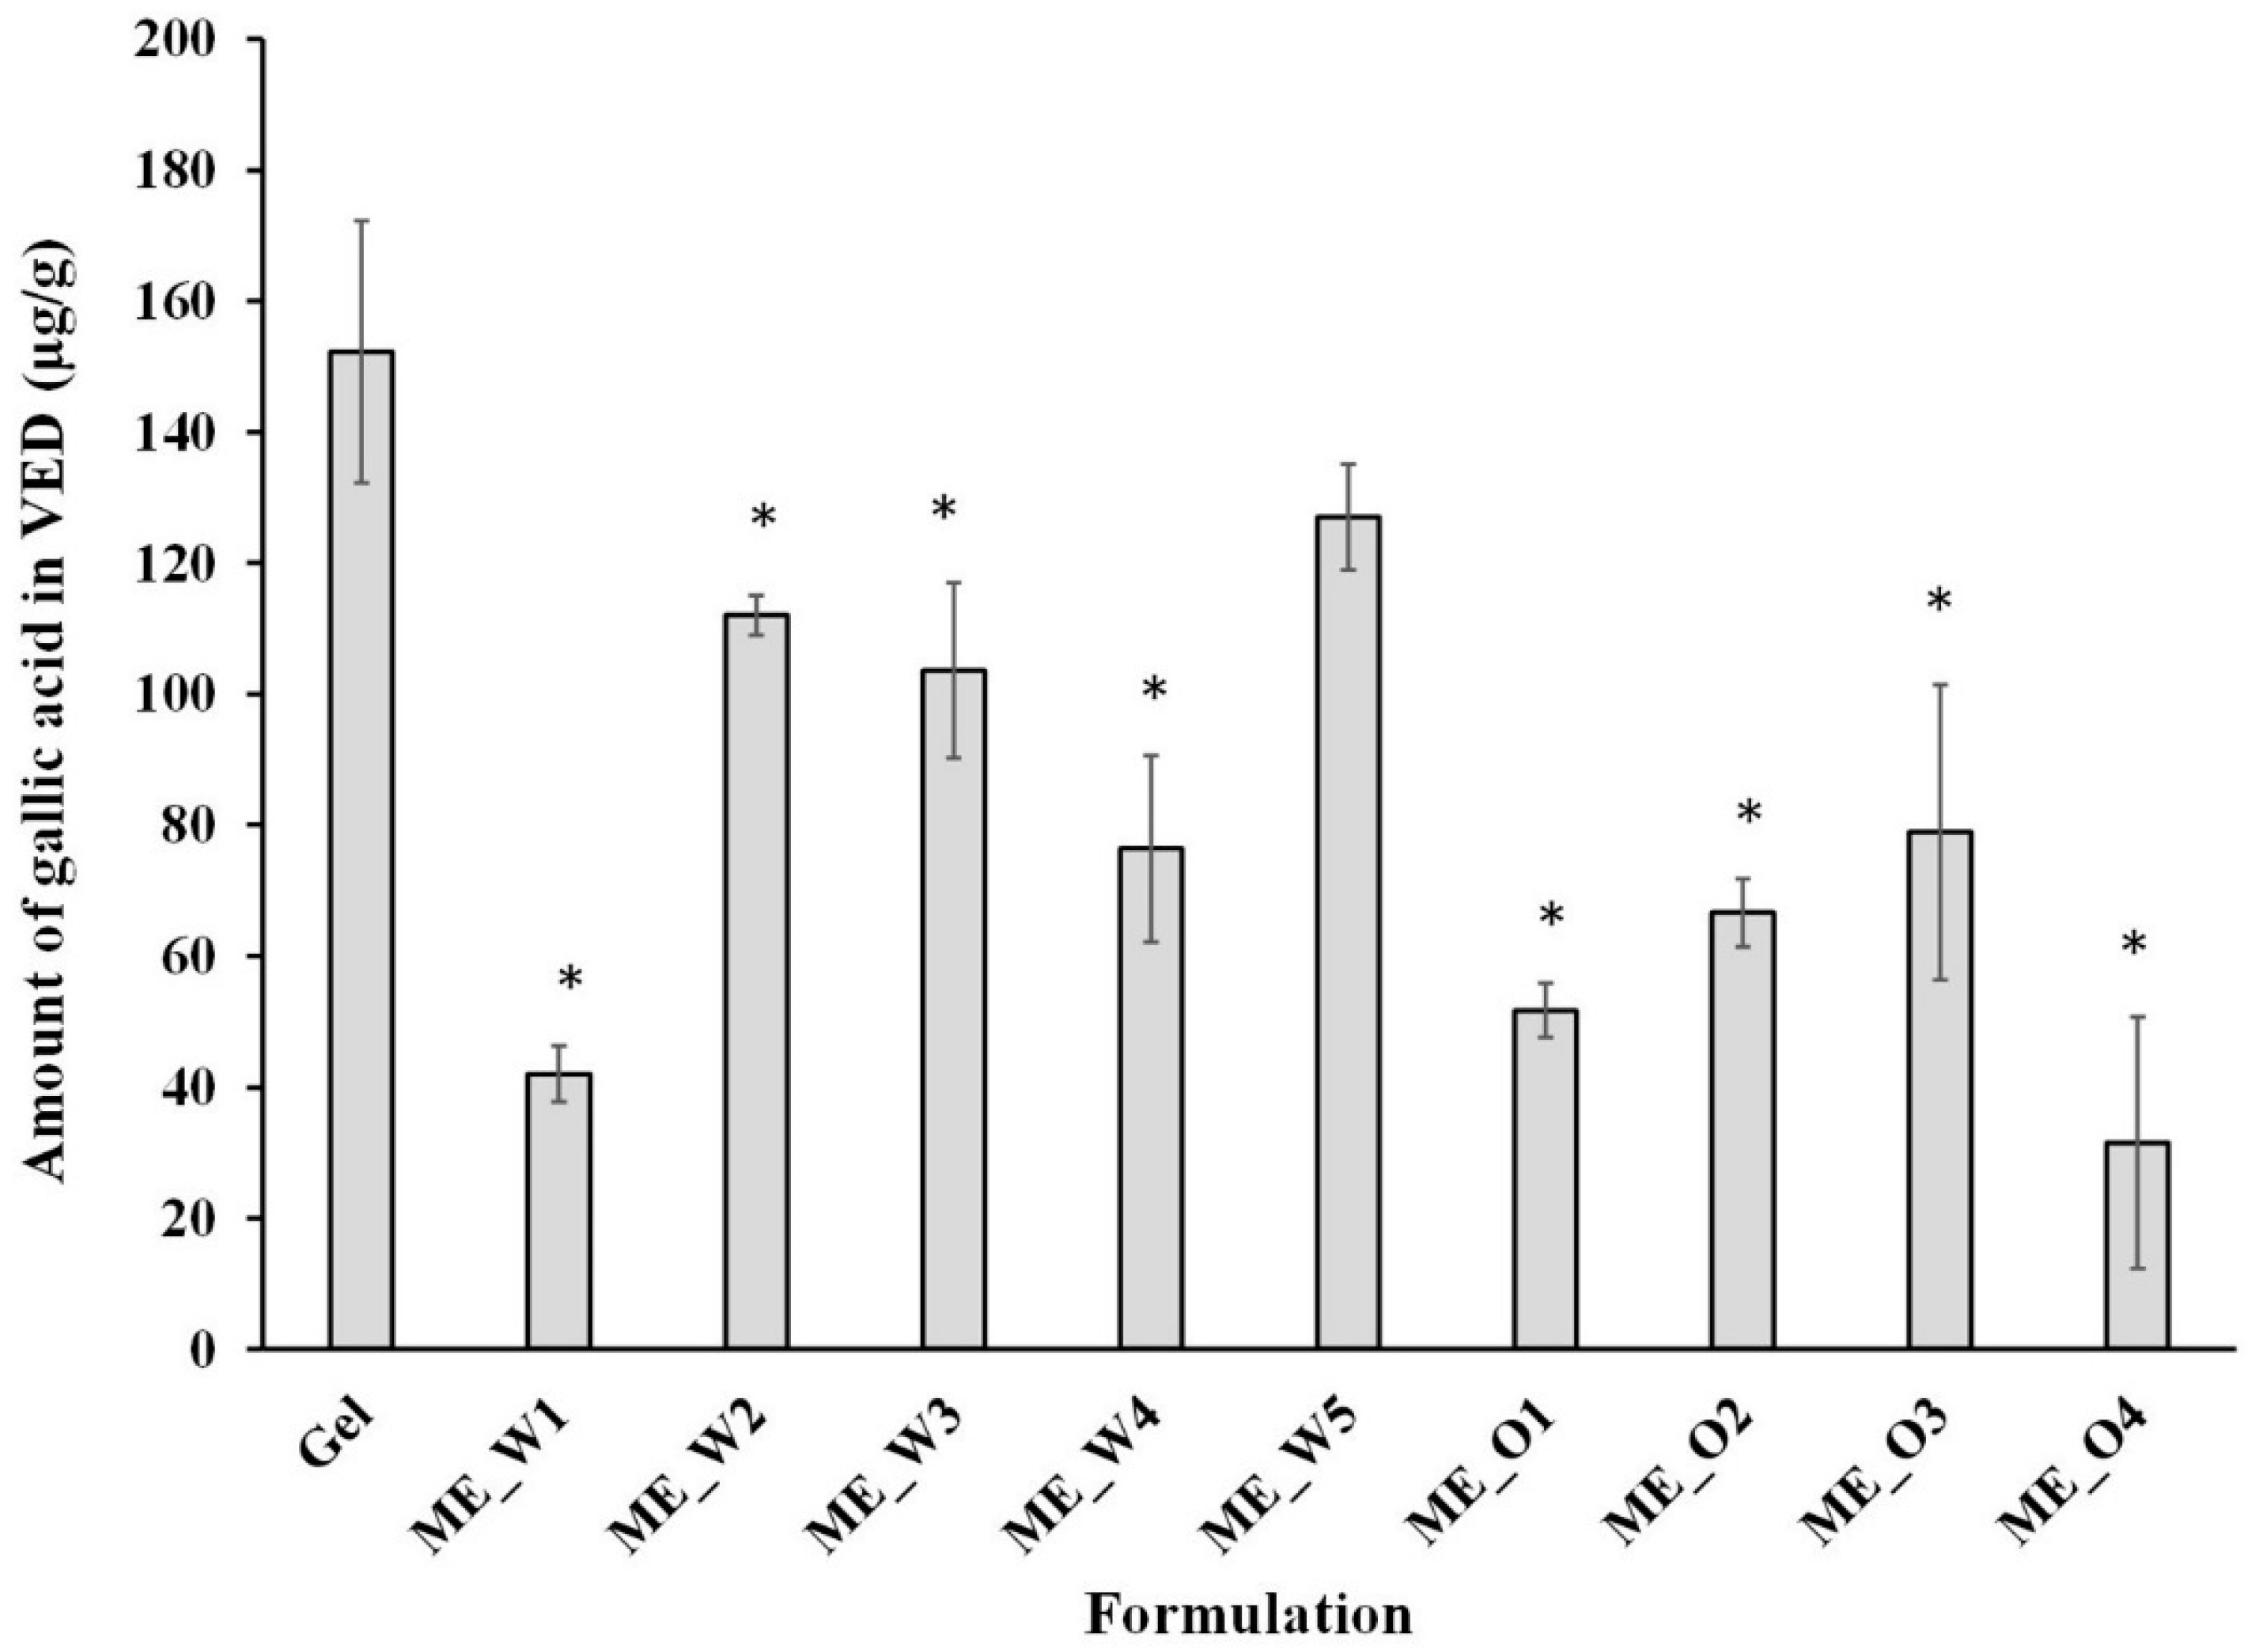
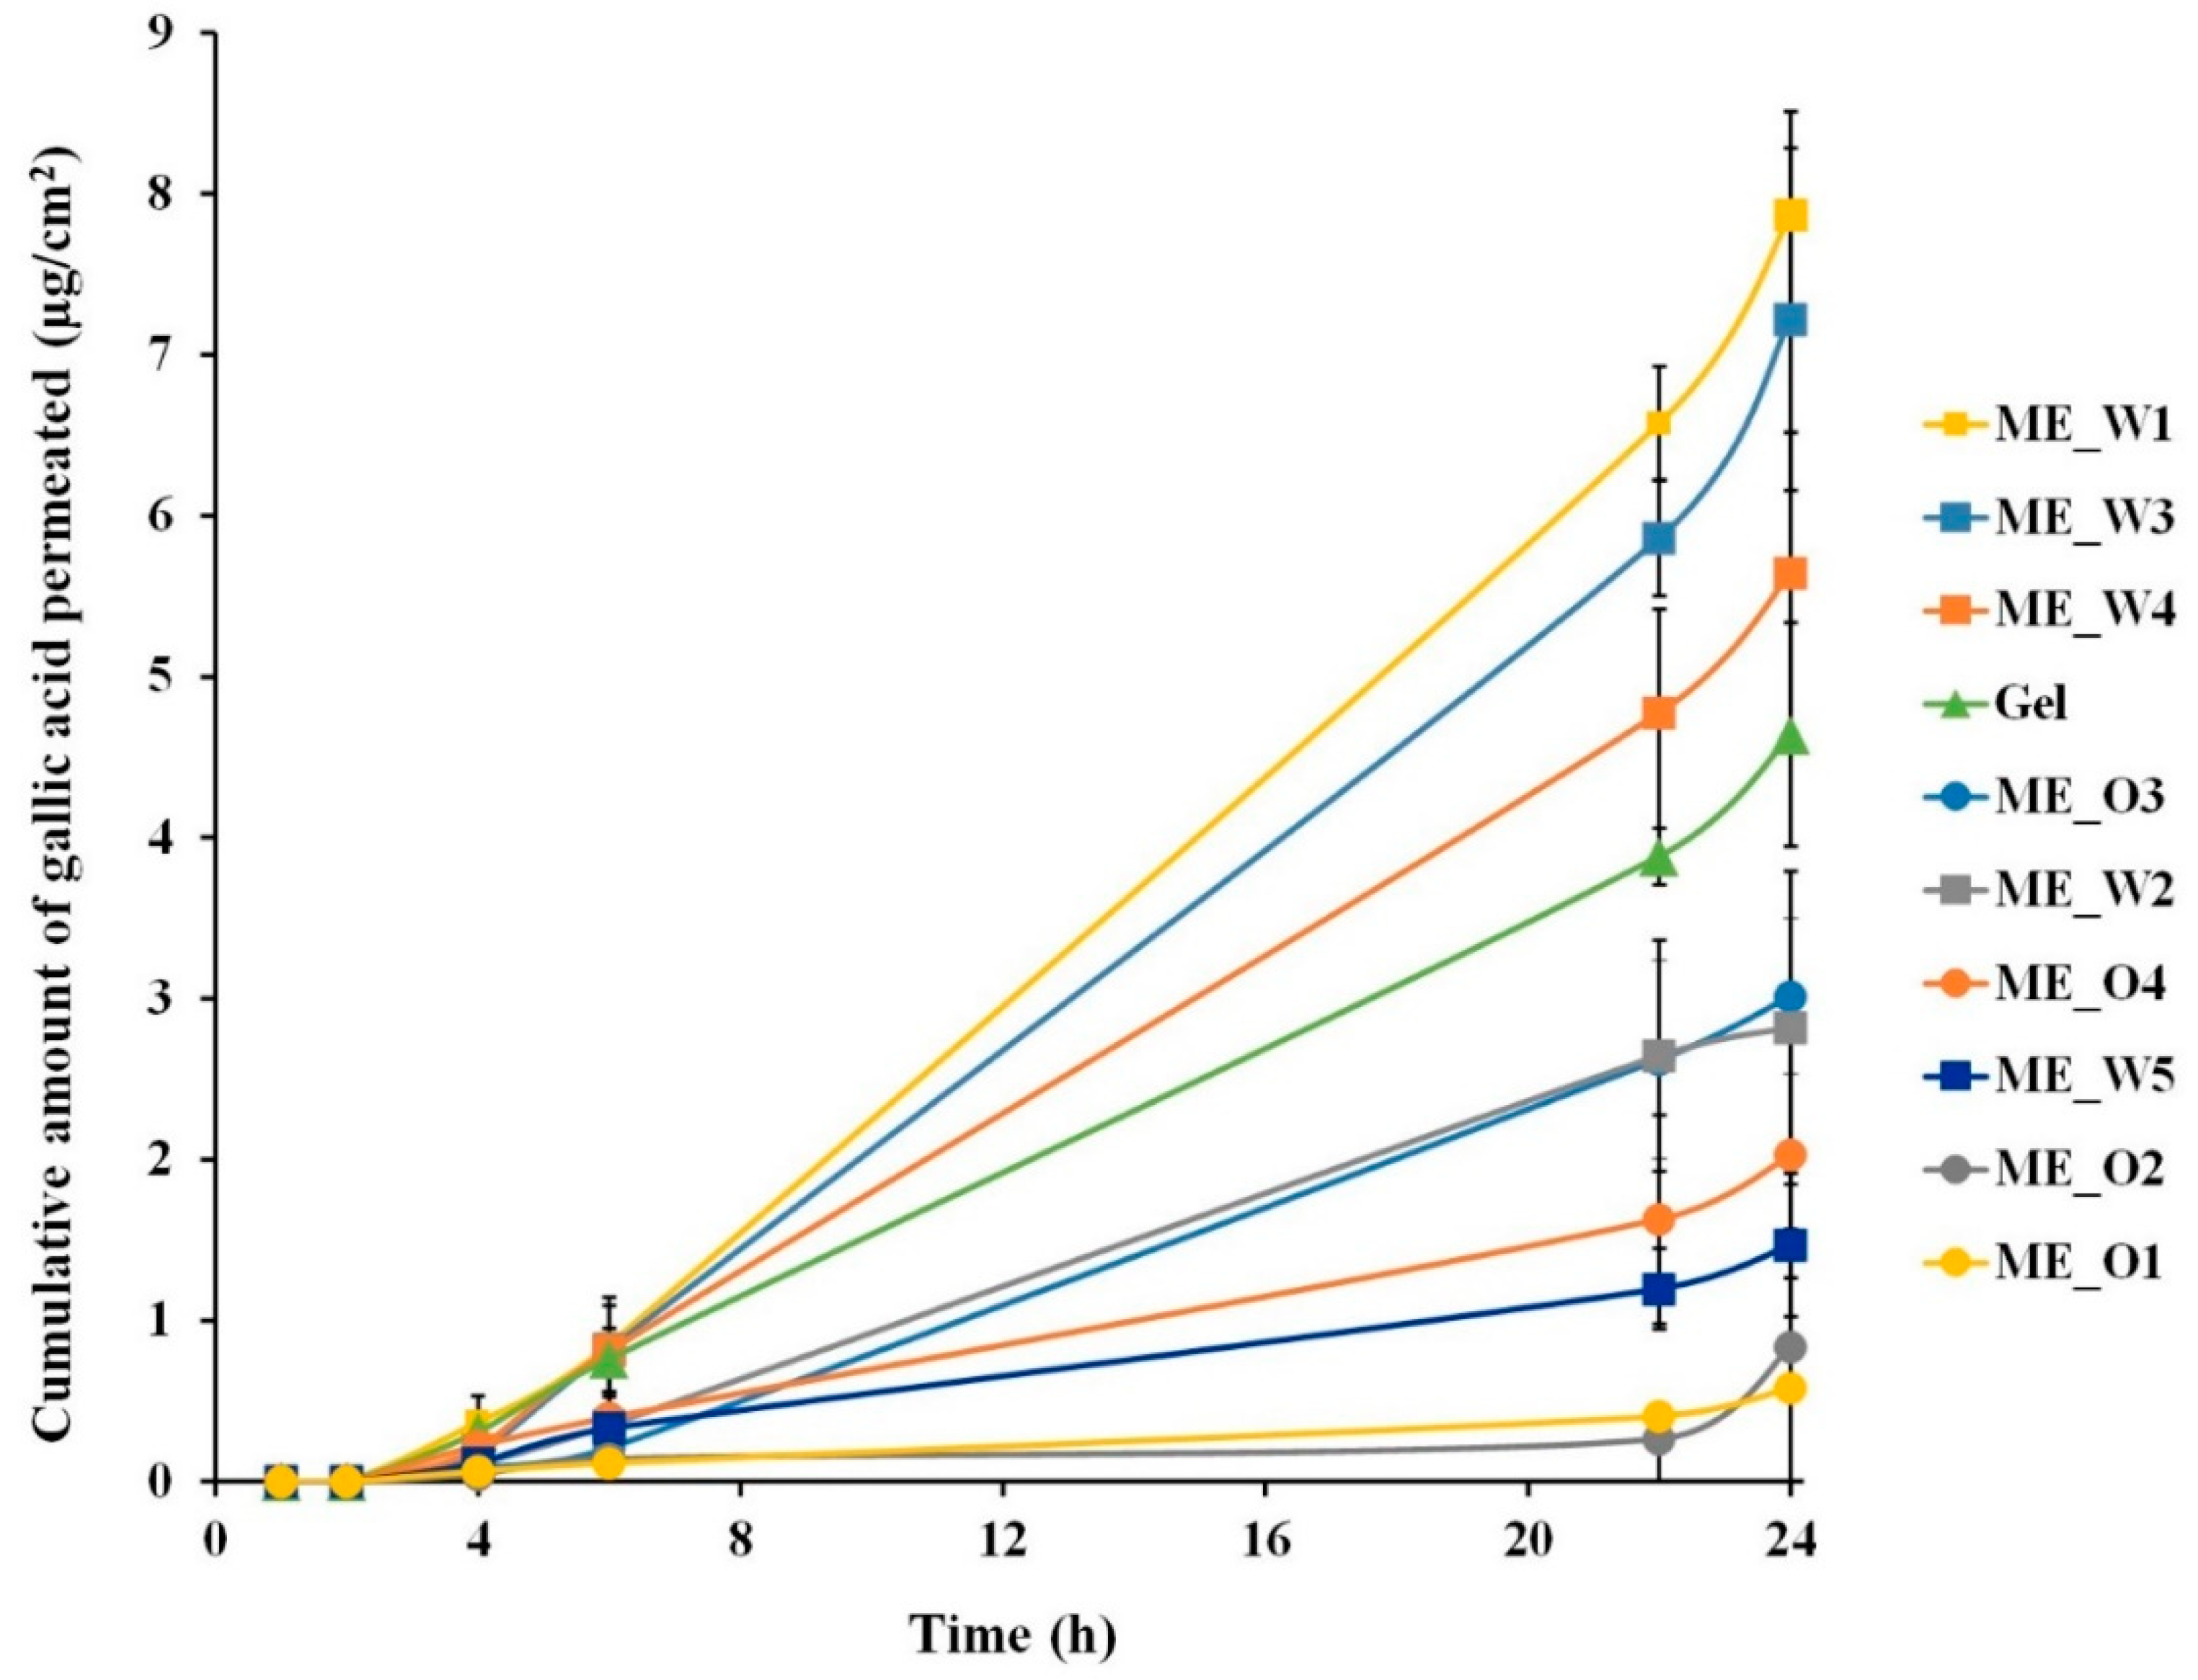
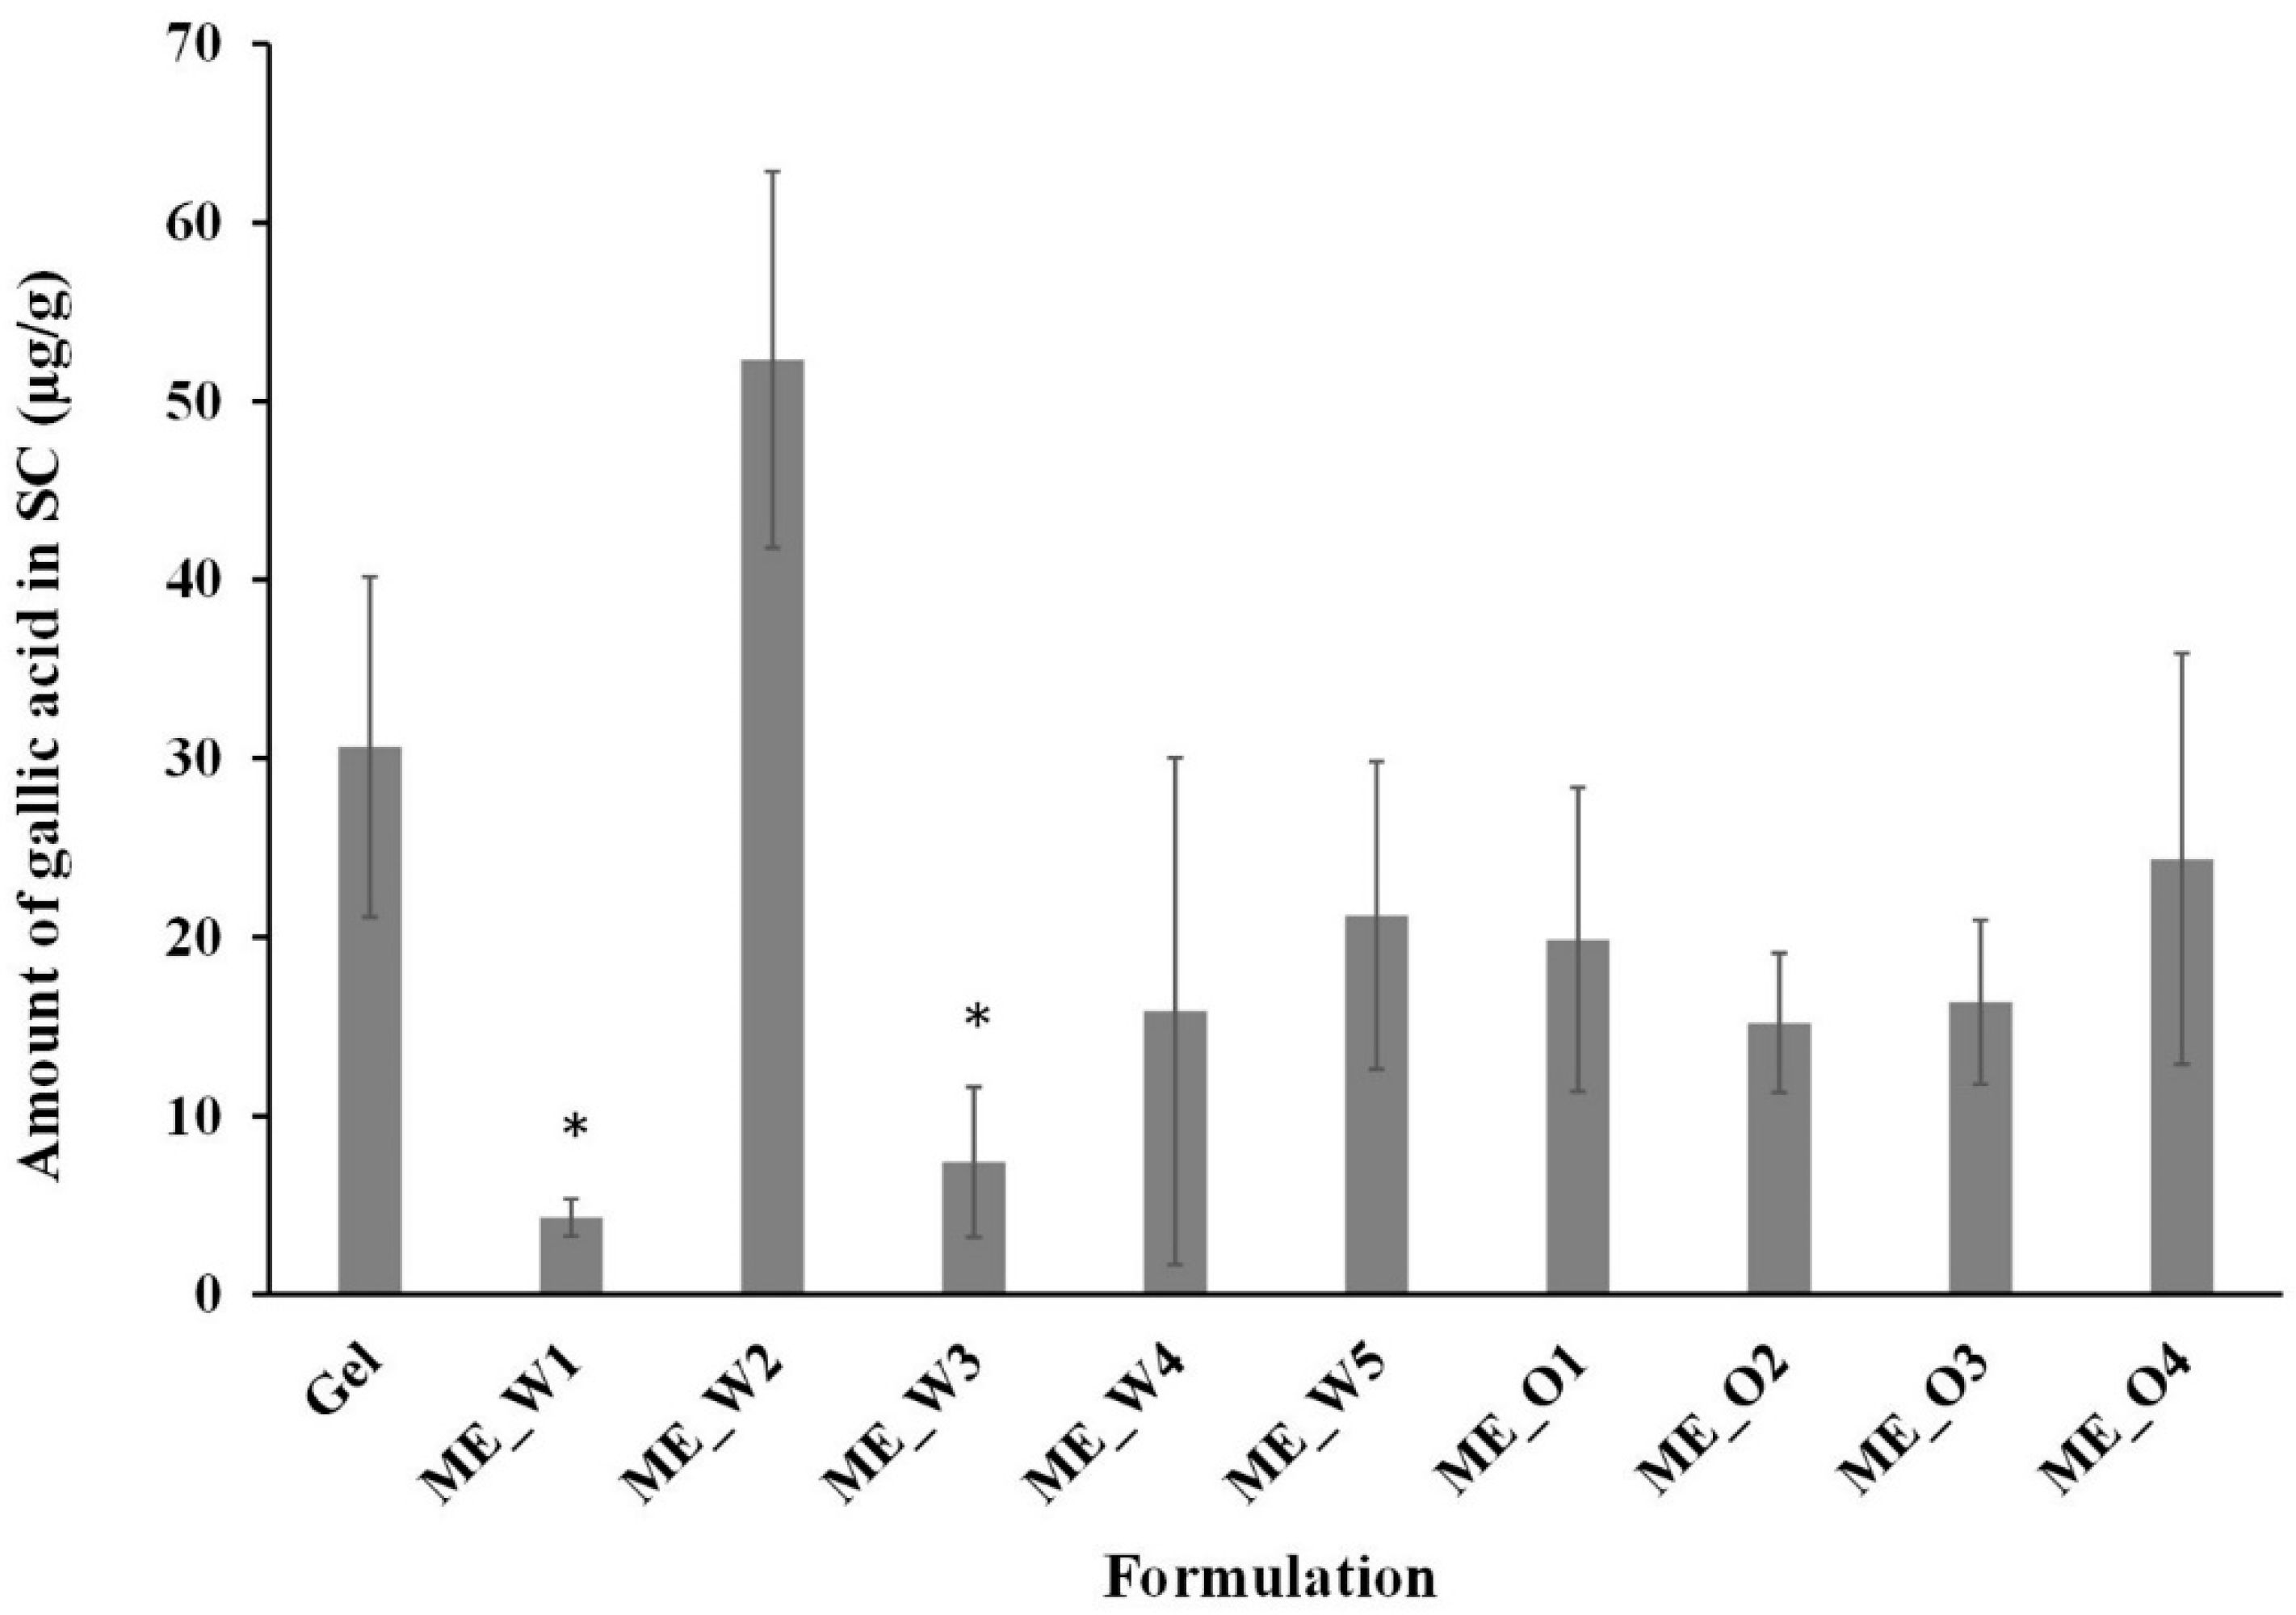
3.4. Skin Permeation and Disposition of Microemulsions Containing the GW Extract

The skin permeation profiles of all microemulsion formulations are shown in Figure 4, and the steady-state flux of gallic acid and enhancement ratio are shown in Table 5. The steady-state flux was calculated from 4–22 h, since the linear portion was observed during this period. In addition, at 24 h, the cumulative amount of gallic acid permeated slightly deviated from the linear line, indicating that the integrity of the skin might be changed. Among all formulations, ME_W1, which contained a high water content and the highest ratio of Transcutol®, showed the highest permeation at 22 h, followed by ME_W3, W4, and gel (enhancement ratio = 1.78, 1.60, 1.28, and 1.00, respectively). However, in the formulations with high oil content (ME_O1–O4) and ME_W2, a lower permeation of gallic acid was observed than that in the gel. This result indicated that the hydrophilic phenomenon of the microemulsion is useful for the skin penetration of gallic acid. As previously reported, the increase in water content could affect the microstructure of the microemulsions and enhance the skin permeation of hydrophilic and lipophilic compounds [32,33,34]. The explanations for this effect are the change in the thermodynamic activity of drugs, skin hydration, and loading of the skin penetration enhancers in the surfactant mixtures [35]. In addition, water in the formulations could hydrate the skin, swell the SC, and increase the drug diffusivity in the skin, which resulted in an increase in drug flux [36].
In addition to the water content, the compositions of the surfactants and cosurfactants used in this study might be a reason for the different levels of skin permeations. The results of this study indicated that 30% Transcutol® (ME_W1) could provide the highest skin permeation of gallic acid. However, 20% Transcutol® (ME_W2) decreased the skin permeation as compared to that with the 15% Transcutol® (ME_W3). In most cases, Transcutol® promoted higher drug permeation as its concentration increased, but an exception was found in some concentrations of Transcutol® when combined with IPM or Miglyol 812 [37]. Furthermore, because the concentration of Smix was fixed at 60%, the increase in Transcutol® concentration of Smix decreased the concentration of the other surfactants used. Therefore, suitable ratios of surfactant:cosurfactant needed to be optimized, in which the highest permeation observed in this study was from the 1:1 ratio.
A comparison of skin permeation from ME_W4 and W5, which contained Tween80:Span80 but had different cosurfactants, showed that gallic acid permeated more with the ME_W4 formulation, which contained Transcutol® as a cosurfactant and is a skin penetration enhancer. For the formulations with a high oil content (ME_O1–O3), the skin permeation of gallic acid seemed to increase as the ratio of surfactant:cosurfactant increased (from 1:1 and 2:1 to 3:1), or reduced the concentration of Transcutol®, but with lower permeation than the gel.
For the skin disposition experiment, the amounts of gallic acid in SC and VED are presented in Figure 5 and Figure 6, respectively. The highest amount of gallic acid accumulated in SC was observed in the formulation ME_W2, which provided low skin permeation compared to that with the other microemulsions containing high water content, followed by gel. Other formulations showed a lower amount of gallic acid accumulation than the control gel. Interestingly, ME_W1 gave the lowest gallic acid disposition among all formulations, in contrast to the skin permeation amount.
In the VED, the gel provided the highest gallic acid accumulation, followed by W5, W2, and W3. Although formulations W2 and W5 did not provide a high permeation of gallic acid through the skin, the accumulation in VED was high and suitable for use in dermal formulations. The enhancement in drug disposition, which is not concomitant to drug permeation, might be owing to the depot effect of some penetration enhancers. IPM, Transcutol®, and propylene glycol monocaprylate have been reported to be retained in the skin and increase the retention of anthramycin [38]. Transcutol® also caused swelling of the SC lipid and deposited the drug in the lipid [39,40]. However, the reason for the depot effect of ME_W2 and W5 found in this study was complex and requires further investigation.
For formulations with a high content of oil, low amounts of gallic acid were observed to be accumulated in both the SC and VED compared to that in the control gel, similar to the skin permeation results.
As seen in this study, ME_W1, W3, W4, and the gel could serve as the transdermal carriers for enhancing the skin permeation of gallic acid. The gel, W2, and W5 could be better used in the skin formulation aimed to form the drug depot in the skin.
Characteristics and mechanisms of microemulsions to enhance skin permeation and disposition have been proposed—e.g., its small droplet size and large surface/volume ratio, the penetration enhancing effect of the combination of its components, increase in drug solubility and drug loading by microemulsions, and improved skin hydration and occlusion [35]. The reason for the different skin permeation results of gallic acid from that of various microemulsion formulations observed in this study included the microstructure of the microemulsions, the optimal ratios of surfactant: cosurfactant, and the compositions. We observed that microemulsions with high water content could enhance the skin permeation of gallic acid. These microemulsions were characterized as an o/w type. In addition, we observed that the particular ratio of surfactant:cosurfactant could enhance the skin permeation of gallic acid compared to that of the gel, as previously described. Moreover, the choice of components used affects skin permeation and disposition.
The main components used in this study were non-ionic surfactants—i.e., Labrasol®, HCO40®, Tween 80, and Span 80. These nonionic surfactants act mainly to form the interfacial film of the microemulsion droplets. Moreover, they enhance skin penetration by fluidizing or solubilizing the intercellular lipid, or its interaction with the keratin of corneocytes [41,42].
The cosurfactant Transcutol® has been studied for its skin penetration enhancing effects on various drugs, such as caffeine, ibuprofen, diclofenac, and metronidazole [40,43,44,45]. Its mechanisms were proposed, including the effect on the thermodynamic driving force of drugs, increasing drug partitioning in the SC, hydrating the SC, and fluidizing the SC intercellular lipids [37]. PEG and ethanol have also been used as cosurfactants in various microemulsion formulations. They decreased the interfacial tension and stabilized the microemulsions, as well as enhanced the skin permeation of drugs [42,46,47,48].
Various mechanisms might be incorporated and influence the skin permeation and disposition of the microemulsions prepared in this study. These findings were beneficial in the development of suitable carriers for delivering phenolic antioxidant compounds from the GW extract for both transdermal and topical treatments.

4. Conclusions

The GW extract obtained in this study exhibited high antioxidant activity and was a good source of antioxidant compounds, such as gallic acid. The microemulsion formulations prepared from different amounts of IPM, water, and types and ratios of surfactant:cosurfactant provided different physical characteristics, skin permeation, and disposition. The microstructure of the microemulsions, the optimal ratio of surfactant to cosurfactant, and the composition could affect the skin permeation and disposition of gallic acid from microemulsions. These findings could be considered for the optimization of suitable microemulsion formulations for transdermal and topical delivery of the antioxidant compounds in the GW extract.

Author Contributions

Conceptualization, A.S.Y. and P.S.; methodology, A.S.Y. and P.S.; formal analysis, P.S.; investigation, A.S.Y. and P.S.; resources, A.S.Y. and P.S.; data curation, P.S.; writing—original draft preparation, P.S.; writing—review and editing, A.S.Y. and P.S.; funding acquisition A.S.Y. and P.S. All authors have read and agreed to the published version of the manuscript.

Funding

This research was funded by Walailak University, grant number WU-IRG-62-008.

Acknowledgments

The authors acknowledge with thanks the financial support from Walailak University (WU-IRG-62-008) and to thank the Center of Scientific and Technological Equipment, Walailak University for the research facilities.

Conflicts of Interest

The authors declare no conflict of interest.

References

  1. Kongkachuichai, R.; Charoensiri, R.; Yakoh, K.; Kringkasemsee, A.; Insung, P. Nutrients value and antioxidant content of indigenous vegetables from Southern Thailand. Food Chem. 2015, 173, 838–846. [Google Scholar] [CrossRef] [PubMed]
  2. Alzoreky, N.; Nakahara, K. Antioxidant activity of some edible Yemeni plants evaluated by ferrylmyoglobin/ABTS assay. Food Sci. Technol. Res. 2001, 7, 141–144. [Google Scholar] [CrossRef] [Green Version]
  3. Panpipat, W.; Suttirak, W.; Chaijan, M. Free radical scavenging activity and reducing capacity of five Southern Thai indigenous vegetable extracts. Walailak J. Sci. Technol. 2011, 7, 51–60. [Google Scholar]
  4. Tangkanakul, P.; Trakoontivakorn, G.; Jariyavattanavijit, C. Extracts of Thai indigenous vegetables as rancid inhibitor in a model system. Kasetsart J. (Nat. Sci.) 2005, 39, 274–283. [Google Scholar]
  5. Dzialo, M.; Mierziak, J.; Korzun, U.; Preisner, M.; Szopa, J.; Kulma, A. The potential of plant phenolics in prevention and therapy of skin disorders. Int. J. Mol. Sci. 2016, 17, 160. [Google Scholar] [CrossRef] [Green Version]
  6. Chhillar, R.; Dhingra, D. Antidepressant-like activity of gallic acid in mice subjected to unpredictable chronic mild stress. Fund. Clin. Pharmacol. 2013, 27, 409–418. [Google Scholar] [CrossRef]
  7. Mitsou, E.; Pletsa, V.; Sotiroudis, G.T.; Panine, P.; Zoumpanioti, M.; Xenakis, A. Development of a microemulsion for encapsulation and delivery of gallic acid. The role of chitosan. Colloids Surf. B Biointerfaces 2020, 190, 110974. [Google Scholar] [CrossRef]
  8. National Center for Biotechnology Information. PubChem Compound Summary for CID 370, Gallic Acid. 2020. Available online: https://pubchem.ncbi.nlm.nih.gov/compound/Gallic-acid (accessed on 27 August 2020).
  9. Benigni, M.; Pescina, S.; Grimaudo, M.A.; Padula, C.; Santi, P.; Nicoli, S. Development of microemulsions of suitable viscosity for cyclosporine skin delivery. Int. J. Pharm. 2018, 545, 197–205. [Google Scholar] [CrossRef]
  10. Boonme, P. Applications of microemulsions in cosmetics. J. Cosmet. Dermatol. 2007, 6, 223–228. [Google Scholar] [CrossRef]
  11. Pinsuwan, S.; Amnuaikit, T.; Ungphaiboon, S.; Itharat, A. Liposome-containing Hibiscus sabdariffa calyx extract formulations with increased antioxidant activity, improved dermal penetration and reduced dermal toxicity. J. Med. Assoc. Thail. 2010, 93, 216. [Google Scholar]
  12. Fernandes, F.H.A.; Batista, R.S.A.; Medeiros, F.D.; Santos, F.S.; Medeiros, A.C.D. Development of a rapid and simple HPLC-UV method for determination of gallic acid in Schinopsis brasiliensis. Rev. Bras. Farmacogn. 2015, 25, 208–211. [Google Scholar] [CrossRef] [Green Version]
  13. Arce, F.; Asano, N.; See, G.L.; Oshizaka, T.; Itakura, S.; Todo, H.; Sugibayashi, K. Prediction of skin permeation and concentration of rhododendrol applied as finite dose from complex cosmetic vehicles. Int. J. Pharm. 2020, 578, 119186. [Google Scholar] [CrossRef]
  14. Dahlizar, S.; Futaki, M.; Okada, A.; Yatomi, C.; Todo, H.; Sugibayashi, K. Combined use of n-palmitoyl-glycine-histidine gel and several penetration enhancers on the skin permeation and concentration of metronidazole. Pharmaceutics 2018, 10, 163. [Google Scholar] [CrossRef] [PubMed] [Green Version]
  15. Panapisal, V.; Charoensri, S.; Tantituvanont, A. Formulation of microemulsion systems for dermal delivery of silymarin. AAPS PharmSciTech 2012, 13, 389–399. [Google Scholar] [CrossRef] [PubMed] [Green Version]
  16. Sisak, M.A.A.; Daik, R.; Ramli, S. Study on the effect of oil phase and co-surfactant on microemulsion systems. Malays. J. Anal. Sci. 2017, 21, 1409–1416. [Google Scholar] [CrossRef]
  17. Moghimipour, E.; Salimi, A.; Eftekhari, S. Design and characterization of microemulsion systems for naproxen. Adv. Pharm. Bull. 2013, 3, 63–67. [Google Scholar] [CrossRef]
  18. Yang, J.; Xu, H.; Wu, S.; Ju, B.; Zhu, D.; Yan, Y.; Wang, M.; Hu, J. Preparation and evaluation of microemulsion based transdermal delivery of Cistanche tubulosa phenylethanoid glycosides. Mol. Med. Rep. 2017, 15, 1109–1116. [Google Scholar] [CrossRef] [PubMed] [Green Version]
  19. Hu, L.; Hu, Q.; Yang, J. Enhancement of transdermal delivery of ibuprofen using microemulsion vehicle. Iran J. Basic Med. Sci. 2014, 17, 760–766. [Google Scholar]
  20. Zhang, Y.; Zhao, J.; Zhang, S.; Zhong, Y.; Wang, Z.; Liu, Y.; Shi, F.; Feng, N. Enhanced transdermal delivery of evodiamine and rutaecarpine using microemulsion. Int. J. Nanomed. 2011, 6, 2469–2482. [Google Scholar] [CrossRef] [Green Version]
  21. Sintov, A.C. Transdermal delivery of curcumin via microemulsion. Int. J. Pharm. 2015, 481, 97–103. [Google Scholar] [CrossRef]
  22. Nazari, M.; Mehrnia, M.A.; Jooyandeh, H.; Barzegar, H. Preparation and characterization of water in sesame oil microemulsion by spontaneous method. J. Food Process Eng. 2019, 42, e13032. [Google Scholar] [CrossRef]
  23. Üstündağ Okur, N.; Çağlar, E.Ş.; Arpa, M.D.; Karasulu, H.Y. Preparation and evaluation of novel microemulsion-based hydrogels for dermal delivery of benzocaine. Pharm. Dev. Technol. 2016, 22, 500–510. [Google Scholar] [CrossRef] [PubMed]
  24. Subongkot, T.; Ngawhirunpat, T. Development of a novel microemulsion for oral absorption enhancement of all-trans retinoic acid. Int. J. Nanomed. 2017, 12, 5585–5599. [Google Scholar] [CrossRef] [Green Version]
  25. Subongkot, T.; Sirirak, T. Development and skin penetration pathway evaluation of microemulsions for enhancing the dermal delivery of celecoxib. Colloids Surf. B Biointerfaces 2020, 193, 111103. [Google Scholar] [CrossRef] [PubMed]
  26. Al-Karaki, R.; Awadallah, A.; Tawfeek, H.M.; Nasr, M. Preparation, characterization and cytotoxic activity of new oleuropein microemulsion against HCT-116 colon cancer cells. Pharm. Chem. J. 2020, 53, 1118–1121. [Google Scholar] [CrossRef]
  27. Djordjevic, L.; Primorac, M.; Stupar, M.; Krajisnik, D. Characterization of caprylocaproyl macrogolglycerides based microemulsion drug delivery vehicles for an amphiphilic drug. Int. J. Pharm. 2004, 271, 11–19. [Google Scholar] [CrossRef]
  28. Poomanee, W.; Chaiyana, W.; Randall Wickett, R.; Leelapornpisid, P. Stability and solubility improvement of Sompoi (Acacia concinna Linn.) pod extract by topical microemulsion. Asian J. Pharm. Sci. 2017, 12, 386–393. [Google Scholar] [CrossRef]
  29. Chansiri, G.; Lyons, R.T.; Patel, M.V.; Hem, S.L. Effect of surface charge on the stability of oil/water emulsions during steam sterilization. J. Pharm. Sci. 1999, 88, 454–458. [Google Scholar] [CrossRef]
  30. Acharya, S.P.; Pundarikakshudu, K.; Panchal, A.; Lalwani, A. Preparation and evaluation of transnasal microemulsion of carbamazepine. Asian J. Pharm. Sci. 2013, 8, 64–70. [Google Scholar] [CrossRef] [Green Version]
  31. Resende, K.X.; Correa, M.A.; Oliveira, A.G.; Scarpa, M.V. Effect of cosurfactant on the supramolecular structure and physicochemical properties of non-ionic biocompatible microemulsions. Rev. Bras. Cienc. Farm. 2008, 44, 35–42. [Google Scholar] [CrossRef] [Green Version]
  32. Sintov, A.C.; Shapiro, L. New microemulsion vehicle facilitates percutaneous penetration in vitro and cutaneous drug bioavailability in vivo. J. Control. Release 2004, 95, 173–183. [Google Scholar] [CrossRef]
  33. Araujo, L.M.; Thomazine, J.A.; Lopez, R.F. Development of microemulsions to topically deliver 5-aminolevulinic acid in photodynamic therapy. Eur. J. Pharm. Biopharm. 2010, 75, 48–55. [Google Scholar] [CrossRef]
  34. Zhang, J.; Michniak-Kohn, B. Investigation of microemulsion microstructures and their relationship to transdermal permeation of model drugs: Ketoprofen, lidocaine, and caffeine. Int. J. Pharm. 2011, 421, 34–44. [Google Scholar] [CrossRef]
  35. Lopes, L.B. Overcoming the cutaneous barrier with microemulsions. Pharmaceutics 2014, 6, 52–77. [Google Scholar] [CrossRef] [Green Version]
  36. Yousef, S.; Mohammed, Y.; Namjoshi, S.; Grice, J.; Sakran, W.; Roberts, M. Mechanistic evaluation of hydration effects on the human epidermal permeation of salicylate esters. AAPS J. 2017, 19, 180–190. [Google Scholar] [CrossRef] [PubMed]
  37. Osborne, D.W.; Musakhanian, J. Skin penetration and permeation properties of Transcutol®-neat or diluted mixtures. AAPS PharmSciTech 2018, 19, 3512–3533. [Google Scholar] [CrossRef]
  38. Haque, T.; Rahman, K.M.; Thurston, D.E.; Hadgraft, J.; Lane, M.E. Topical delivery of anthramycin I. Influence of neat solvents. Eur. J. Pharm. Sci. 2017, 104, 188–195. [Google Scholar] [CrossRef] [Green Version]
  39. Godwin, D.A.; Kim, N.H.; Felton, L.A. Influence of Transcutol CG on the skin accumulation and transdermal permeation of ultraviolet absorbers. Eur. J. Pharm. Biopharm. 2002, 53, 23–27. [Google Scholar] [CrossRef]
  40. Csizmazia, E.; Erős, G.; Berkesi, O.; Berkó, S.; Szabó-Révész, P.; Csányi, E. Penetration enhancer effect of sucrose laurate and Transcutol on ibuprofen. J. Drug Deliv. Sci. Technol. 2011, 21, 411–415. [Google Scholar] [CrossRef]
  41. Som, I.; Bhatia, K.; Yasir, M. Status of surfactants as penetration enhancers in transdermal drug delivery. J. Pharm. Bioallied Sci. 2012, 4, 2–9. [Google Scholar] [CrossRef]
  42. Lane, M.E. Skin penetration enhancers. Int. J. Pharm. 2013, 447, 12–21. [Google Scholar] [CrossRef]
  43. Touitou, E.; Levi-Schaffer, F.; Dayan, N.; Alhaique, F.; Riccieri, F. Modulation of caffeine skin delivery by carrier design: Liposomes versus permeation enhancers. Int. J. Pharm. 1994, 103, 131–136. [Google Scholar] [CrossRef]
  44. Manconi, M.; Caddeo, C.; Sinico, C.; Valenti, D.; Mostallino, M.C.; Biggio, G.; Fadda, A.M. Ex vivo skin delivery of diclofenac by transcutol containing liposomes and suggested mechanism of vesicle–skin interaction. Eur. J. Pharm. Biopharm. 2011, 78, 27–35. [Google Scholar] [CrossRef]
  45. Björklund, S.; Pham, Q.D.; Jensen, L.B.; Knudsen, N.O.; Nielsen, L.D.; Ekelund, K.; Ruzgas, T.; Engblom, J.; Sparr, E. The effects of polar excipients transcutol and dexpanthenol on molecular mobility, permeability, and electrical impedance of the skin barrier. J. Colloid Interface Sci. 2016, 479, 207–220. [Google Scholar] [CrossRef] [Green Version]
  46. Nastiti, C.M.R.R.; Ponto, T.; Abd, E.; Grice, J.E.; Benson, H.A.E.; Roberts, M.S. Topical nano and microemulsions for skin delivery. Pharmaceutics 2017, 9, 37. [Google Scholar] [CrossRef]
  47. Chen, H.; Chang, X.; Du, D.; Li, J.; Xu, H.; Yang, X. Microemulsion-based hydrogel formulation of ibuprofen for topical delivery. Int. J. Pharm. 2006, 315, 52–58. [Google Scholar] [CrossRef] [PubMed]
  48. Shukla, Y.; Upmanyu, N.; Agrawal, M.; Saraf, S.; Saraf, S.; Alexander, A. Biomedical applications of microemulsion through dermal and transdermal route. Biomed. Pharmacother. 2018, 108, 1477–1494. [Google Scholar] [CrossRef]
Figure 1. Appearance of the Glochidion wallichianum extract.
Scipharm 88 00053 g001
Figure 2. DPPH radical scavenging activity of (A) Glochidion wallichianum extract and (B) ascorbic acid, the positive control. Each point represents the mean ± SD (n = 3).
Scipharm 88 00053 g002
Figure 3. Pseudo-ternary phase diagrams of the systems comprising Labrasol®:HCO-40® (1:1) with Transcutol® in the ratio of (A) 1:1, (B) 2:1, and (C) 3:1, and the system comprising Tween 80:Span 80 (3:2) with (D) Transcutol® (1:1) and with (E) PG:Ethanol (1:1) as cosurfactants.
Scipharm 88 00053 g003
Figure 4. Skin permeation profile of the microemulsions containing Glochidion wallichianum extract. Each point represents the mean ± SD (n = 3–4).
Scipharm 88 00053 g004
Figure 5. Disposition of gallic acid in the stratum corneum (SC) from the microemulsions containing Glochidion wallichianum extract. Each point represents the mean ± SD (n = 3–4). * Significant difference compared to the gel formulation (p < 0.05).
Scipharm 88 00053 g005
Figure 6. Disposition of gallic acid in viable epidermis and dermis (VED) from the microemulsions containing Glochidion wallichianum extract. Each point represents the mean ± SD (n = 3–4). * Significant difference compared to the gel formulation (p < 0.05).
Scipharm 88 00053 g006
Table 1. Constituents of the selected microemulsion formulations from the pseudo-ternary phase diagrams.
FormulationWaterLabrasol®:HCO40® (1:1)Tween80:Span80 (3:2)Transcutol®PG:EthanolOil (IPM)Total
ME_W13030-30-10100
ME_W23040-20-10100
ME_W33045-15-10100
ME_W430-3030-10100
ME_W530-30-3010100
ME_O11030-30-30100
ME_O21040-20-30100
ME_O31045-15-30100
ME_O410-3030-30100
Table 2. Droplet size, polydispersity index, zeta potential, and conductivity of the blank microemulsions.
Sample NameZ-Ave (nm)Polydispersity IndexZeta Potential (mV)Conductivity (mS/cm)ME Type
ME_W127.11 ± 0.780.906 ± 0.059−0.0598 ± 0.04320.033 ± 0.004BP
ME_W243.25 ± 9.780.641 ± 0.037−0.2401 ± 0.26130.030 ± 0.000BP
ME_W330.35 ± 9.370.766 ± 0.086−0.1342 ± 0.08130.031 ± 0.000BP
ME_W413.78 ± 1.200.690 ± 0.178−0.0403 ± 0.00230.115 ± 0.004o/w
ME_W515.55 ± 4.501.000 ± 0.000−0.1041 ± 0.02340.152 ± 0.002o/w
ME_O119.74 ± 0.570.487 ± 0.104−0.1015 ± 0.11040.013 ± 0.009BP
ME_O29.02 ± 2.420.986 ± 0.024−0.0408 ± 0.03460.007 ± 0.004w/o
ME_O39.76 ± 0.770.939 ± 0.000−0.1232 ± 0.00000.004 ± 0.000w/o
ME_O46.55 ± 1.330.326 ± 0.031−0.0382 ± 0.02890.023 ± 0.001BP
Table 3. Droplet size, polydispersity index, zeta potential, and conductivity of the microemulsions containing Glochidion wallichianum extract.
Sample NameZ-Ave (nm)Polydispersity IndexZeta Potential (mV)Conductivity (mS/cm)ME Type
ME_W1338.40 ± 54.990.396 ± 0.125−0.036 ± 0.0680.329 ± 0.006o/w
ME_W2592.00 ± 78.710.617 ± 0.142−0.184 ± 0.1070.288 ± 0.007o/w
ME_W3551.13 ± 37.631.000 ± 0.000−0.038 ± 0.0240.268 ± 0.006o/w
ME_W4496.97 ± 84.850.419 ± 0.158−0.974 ± 0.5180.324 ± 0.005o/w
ME_W5392.40 ± 25.721.000 ± 0.0000.247 ± 0.0520.194 ± 0.004o/w
ME_O1379.90 ± 81.330.813 ± 0.110−0.920 ± 0.7080.024 ± 0.001BP
ME_O2607.43 ± 41.240.448 ± 0.487−0.017 ± 0.0430.008 ± 0.013w/o
ME_O3764.47 ± 39.481.000 ± 0.0000.428 ± 0.0360.042 ± 0.002BP
ME_O4338.60 ± 22.750.365 ± 0.1860.010 ± 0.0060.015 ± 0.001BP
Table 4. Viscosity and pH of the blank microemulsions and microemulsions containing Glochidion wallichianum extract.
FormulationViscosity (cP)pH
Blank MEME Containing GW ExtractBlank MEME Containing GW Extract
Gel (1% HPMC)-228.7 ± 41.0-4.0 ± 0.3
ME_W1125.0 ± 27.9487.7 ± 52.26.3 ± 0.34.2 ± 0.2
ME_W2311.7 ± 51.61248.7 ± 34.66.6 ± 0.14.1 ± 0.2
ME_W3383.1 ± 7.21577.7 ± 23.76.9 ± 0.24.4 ± 0.1
ME_W4155.2 ± 34.3475.4 ± 126.66.9 ± 0.24.4 ± 0.4
ME_W5162.9 ± 2.82273.0 ± 131.57.0 ± 0.14.5 ± 0.3
ME_O148.3 ± 26.4372.6 ± 20.95.5 ± 0.14.7 ± 0.3
ME_O2109.1 ± 25.7556.4 ± 23.66.6 ± 0.24.0 ± 0.2
ME_O3104.2 ± 16.5765.5 ± 4.96.7 ± 0.34.2 ± 0.4
ME_O482.4 ± 13.7212.0 ± 29.27.1± 0.24.3± 0.2
Table 5. Steady-state flux (Jss) and skin permeation enhancement ratio of the microemulsions containing Glochidion wallichianum extract.
FormulationFlux (Jss, µg/cm2/h)Enhancement Ratio
Gel (1% HPMC)0.197 ± 0.0041.00 ± 0.02
ME_W10.350 ± 0.024 *1.78 ± 0.12
ME_W20.142 ± 0.0470.72 ± 0.24
ME_W30.316 ± 0.014 *1.60 ± 0.07
ME_W40.252 ± 0.0341.28 ± 0.17
ME_W50.058 ± 0.010 *0.29 ± 0.05
ME_O10.019 ± 0.003 *0.10 ± 0.02
ME_O20.010 ± 0.002 *0.05 ± 0.01
ME_O30.145 ± 0.0330.74 ± 0.17
ME_O40.078 ± 0.029 *0.40 ± 0.15
* Significant difference compared to the gel formulation (p < 0.05).
Publisher’s Note: MDPI stays neutral with regard to jurisdictional claims in published maps and institutional affiliations.

