
Liquid Chromatographic Fingerprints for the Characterization of Flavanol-Rich Nutraceuticals Based on 4-Dimethylaminocinnamaldehyde Precolumn Derivatization


Abstract
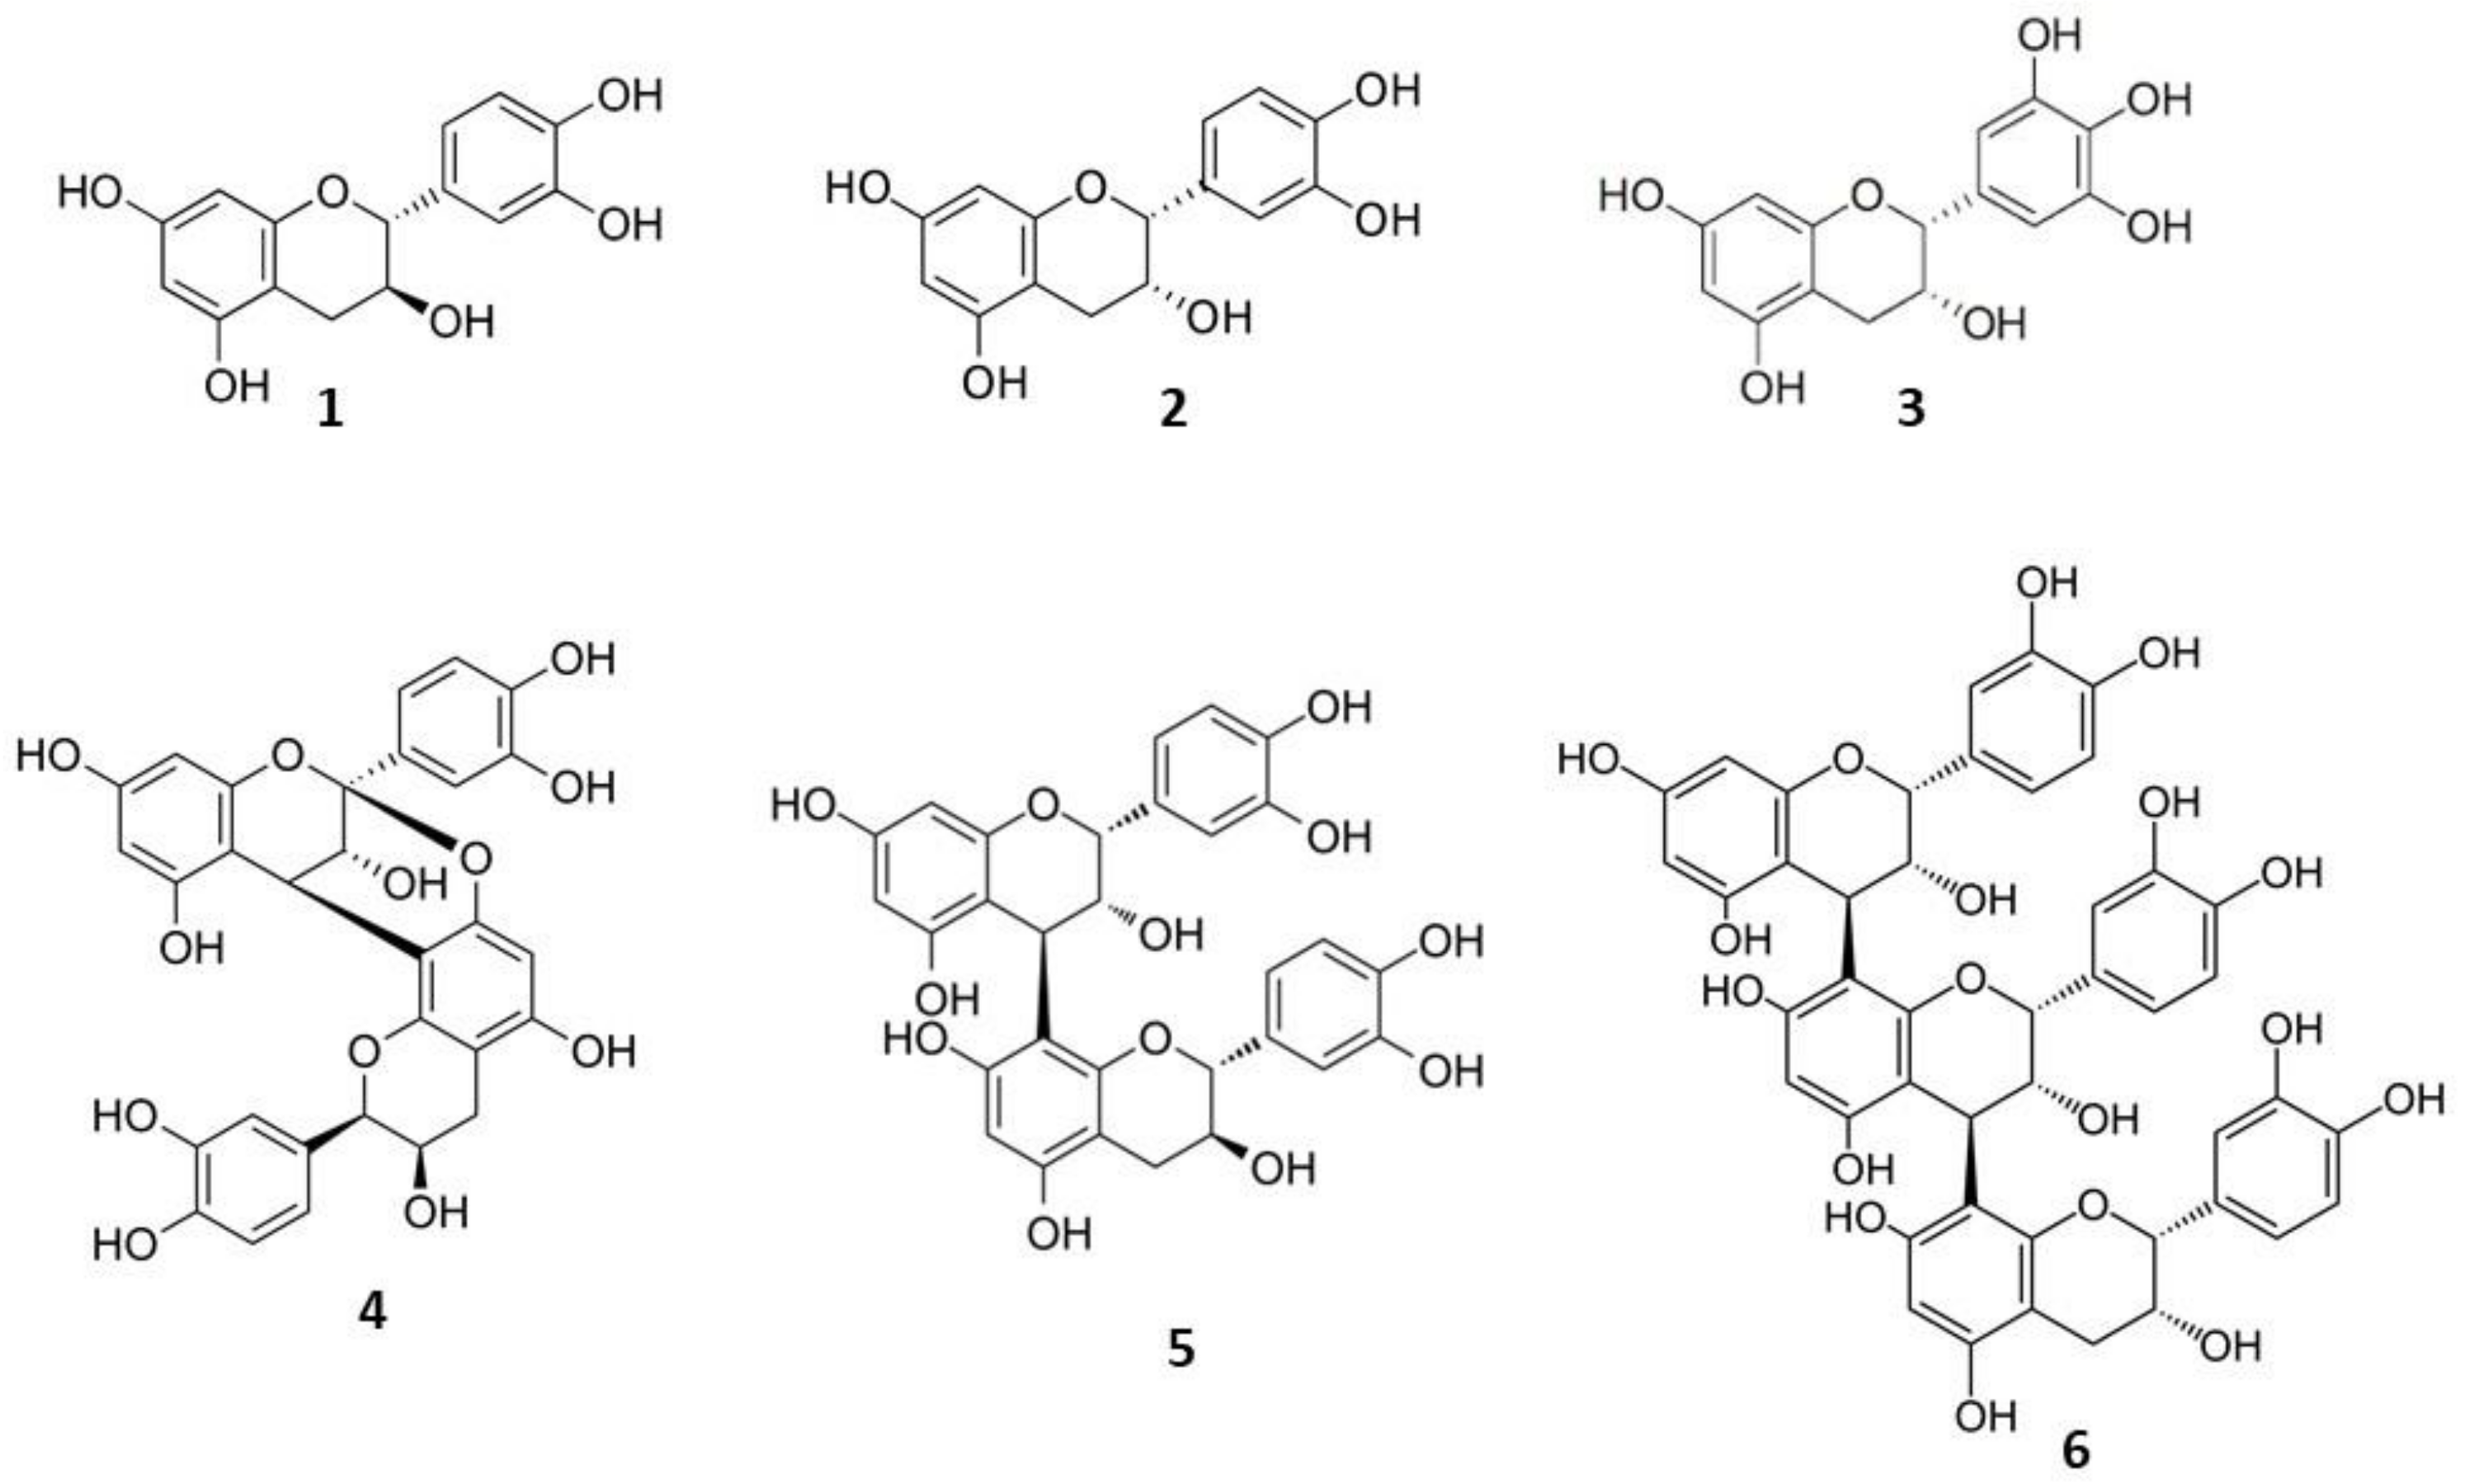
:1. Introduction
2. Materials and Methods
2.1. Reagents and Solutions
2.2. Instruments and Apparatus
2.3. Samples
2.4. Sample Treatment
2.5. Chromatographic Method
2.6. Data Analysis
3. Results and Discussion
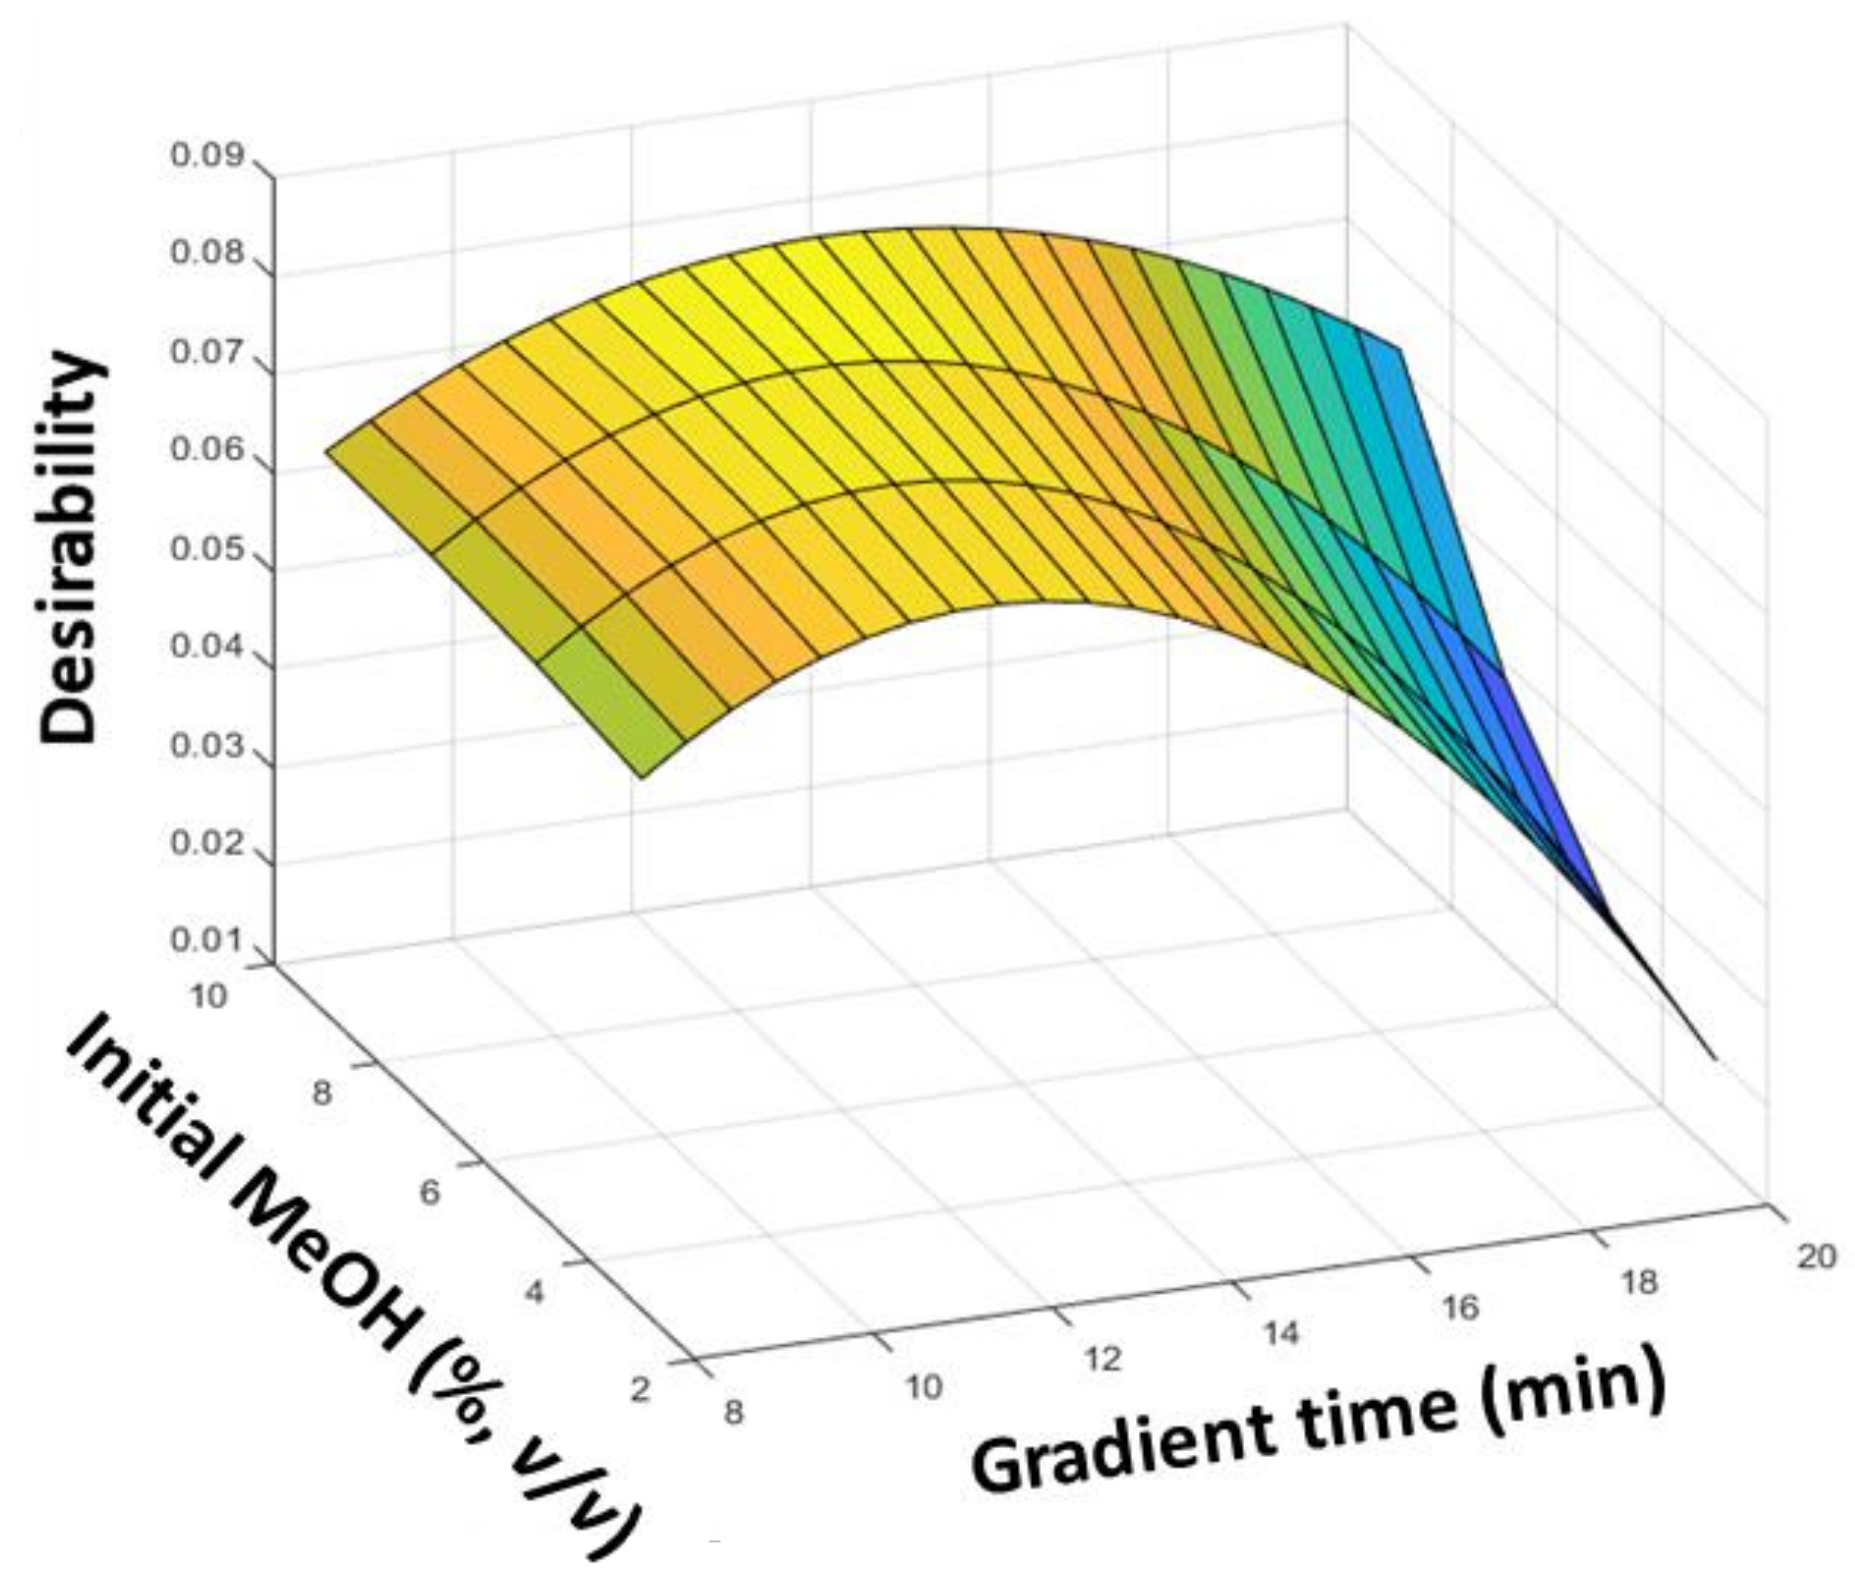
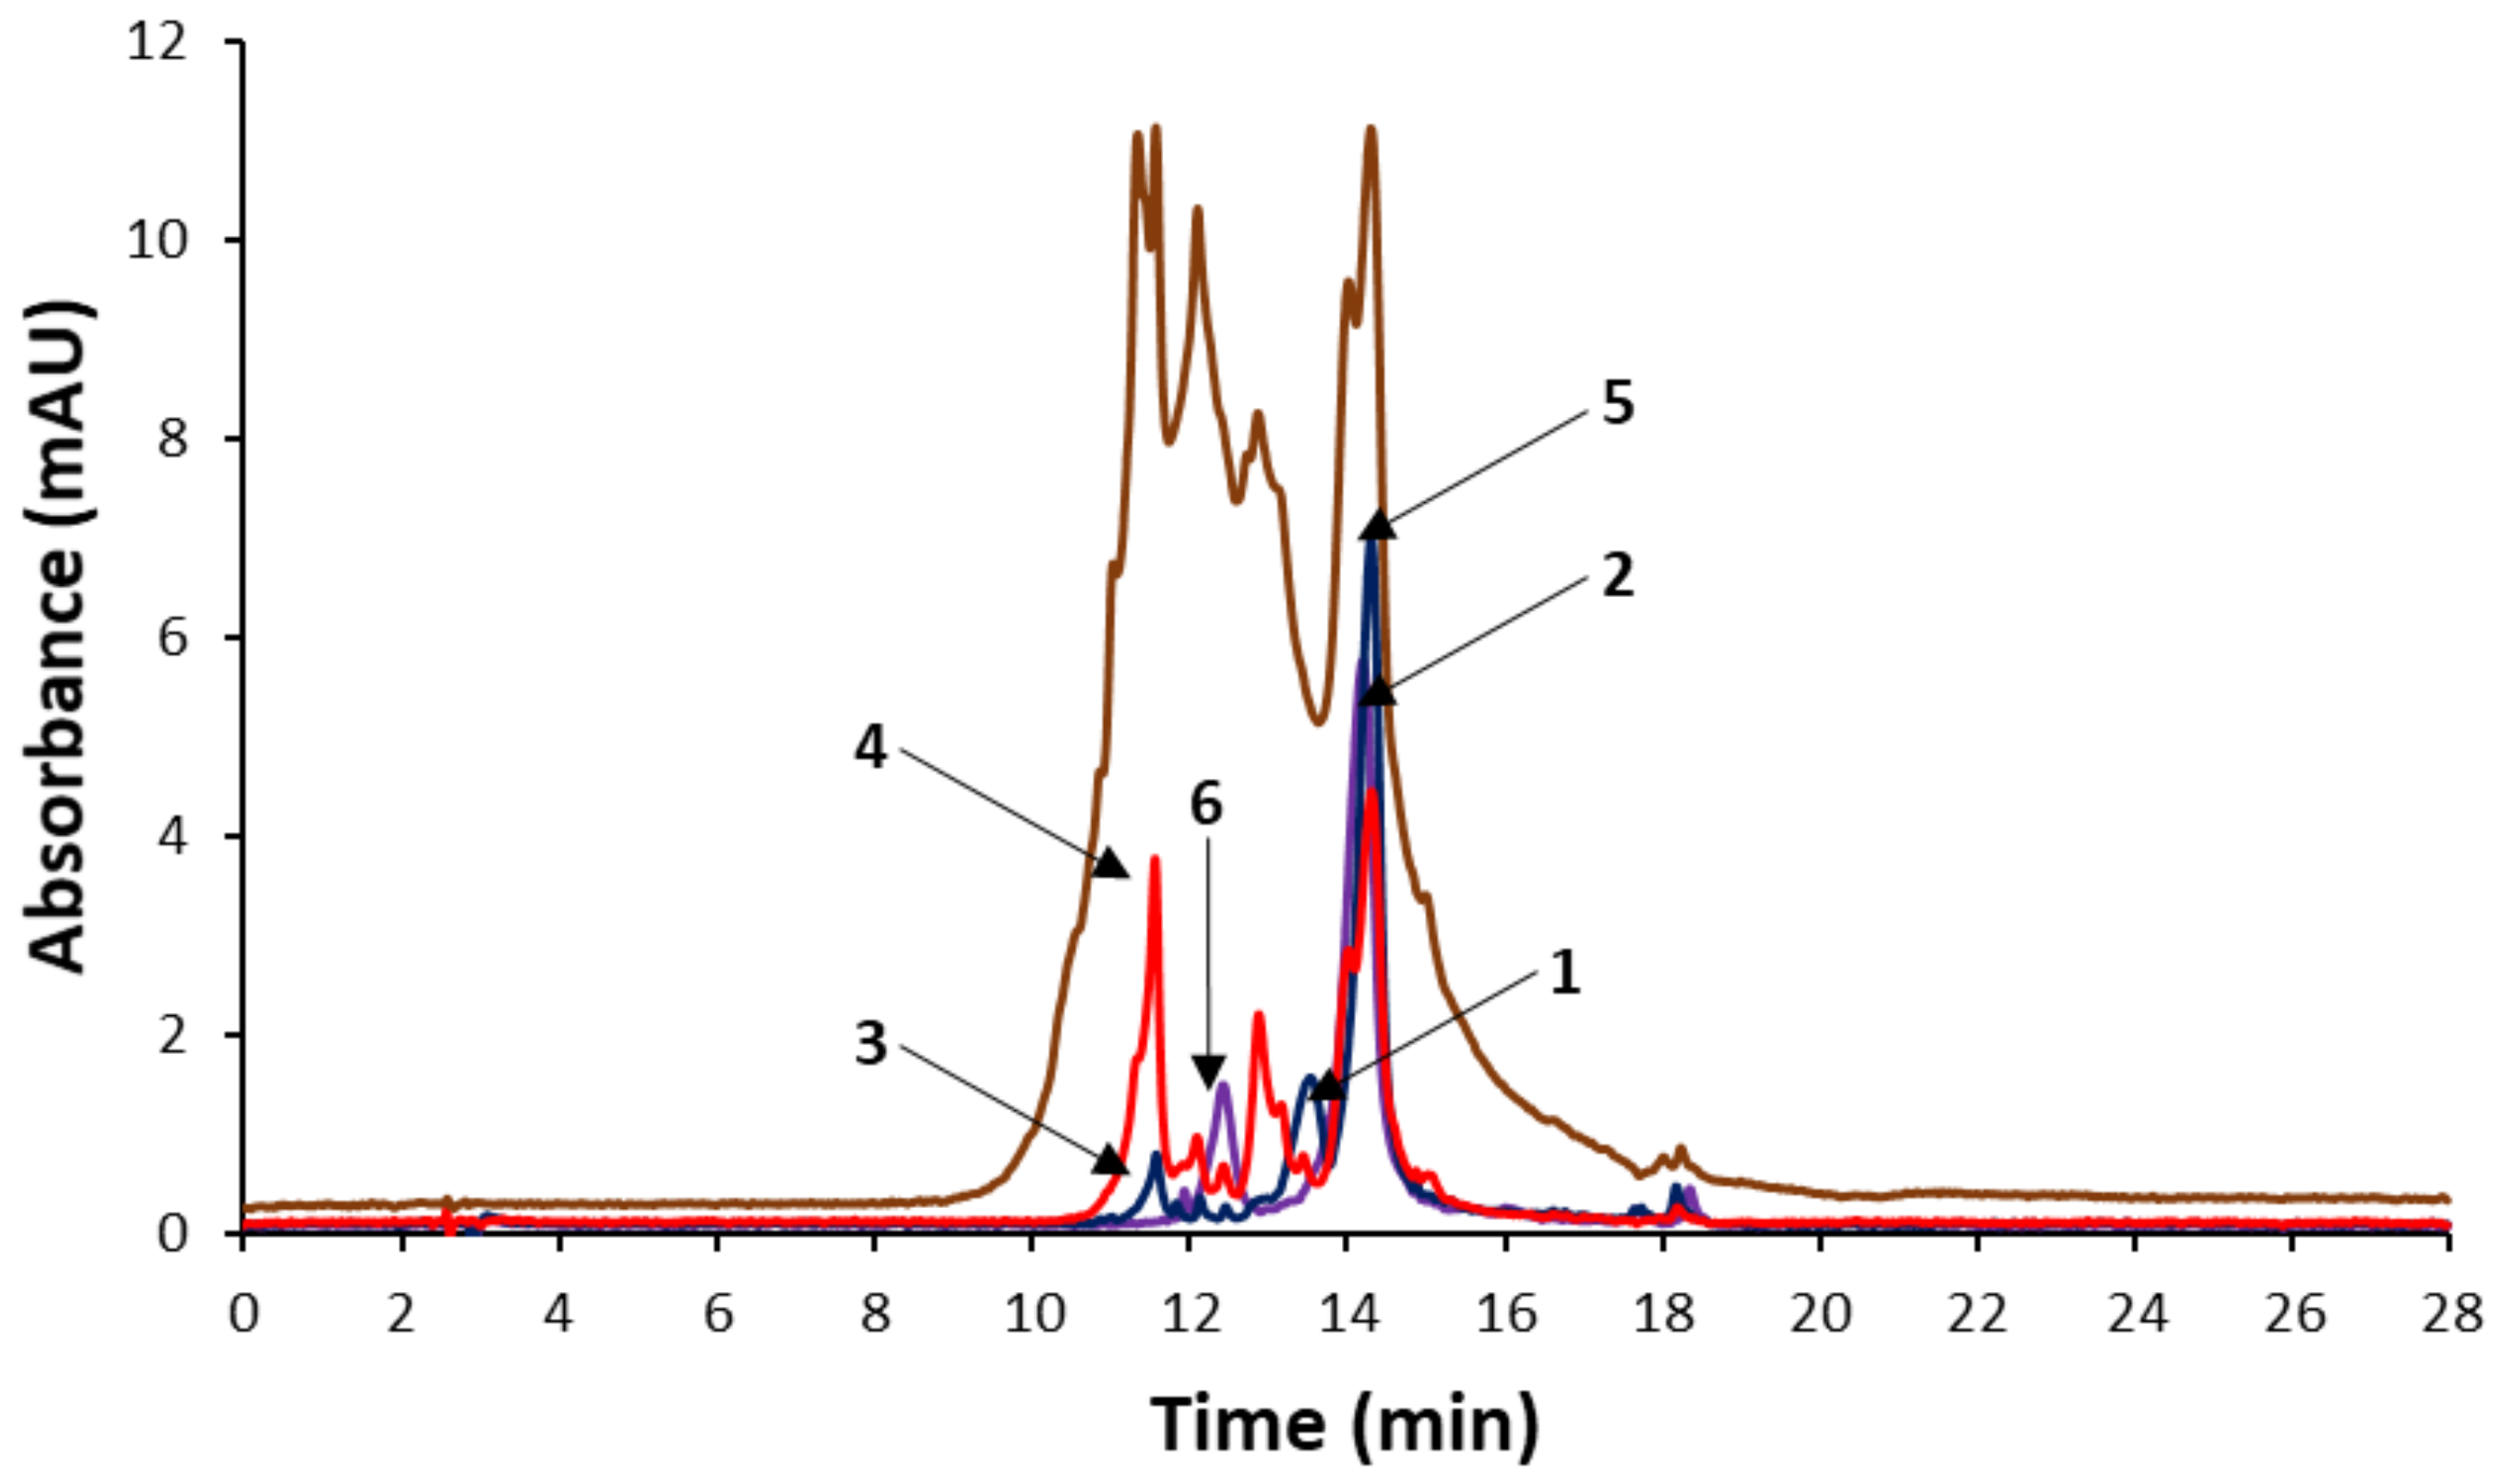
3.1. Optimization of Chromatographic Fingerprints
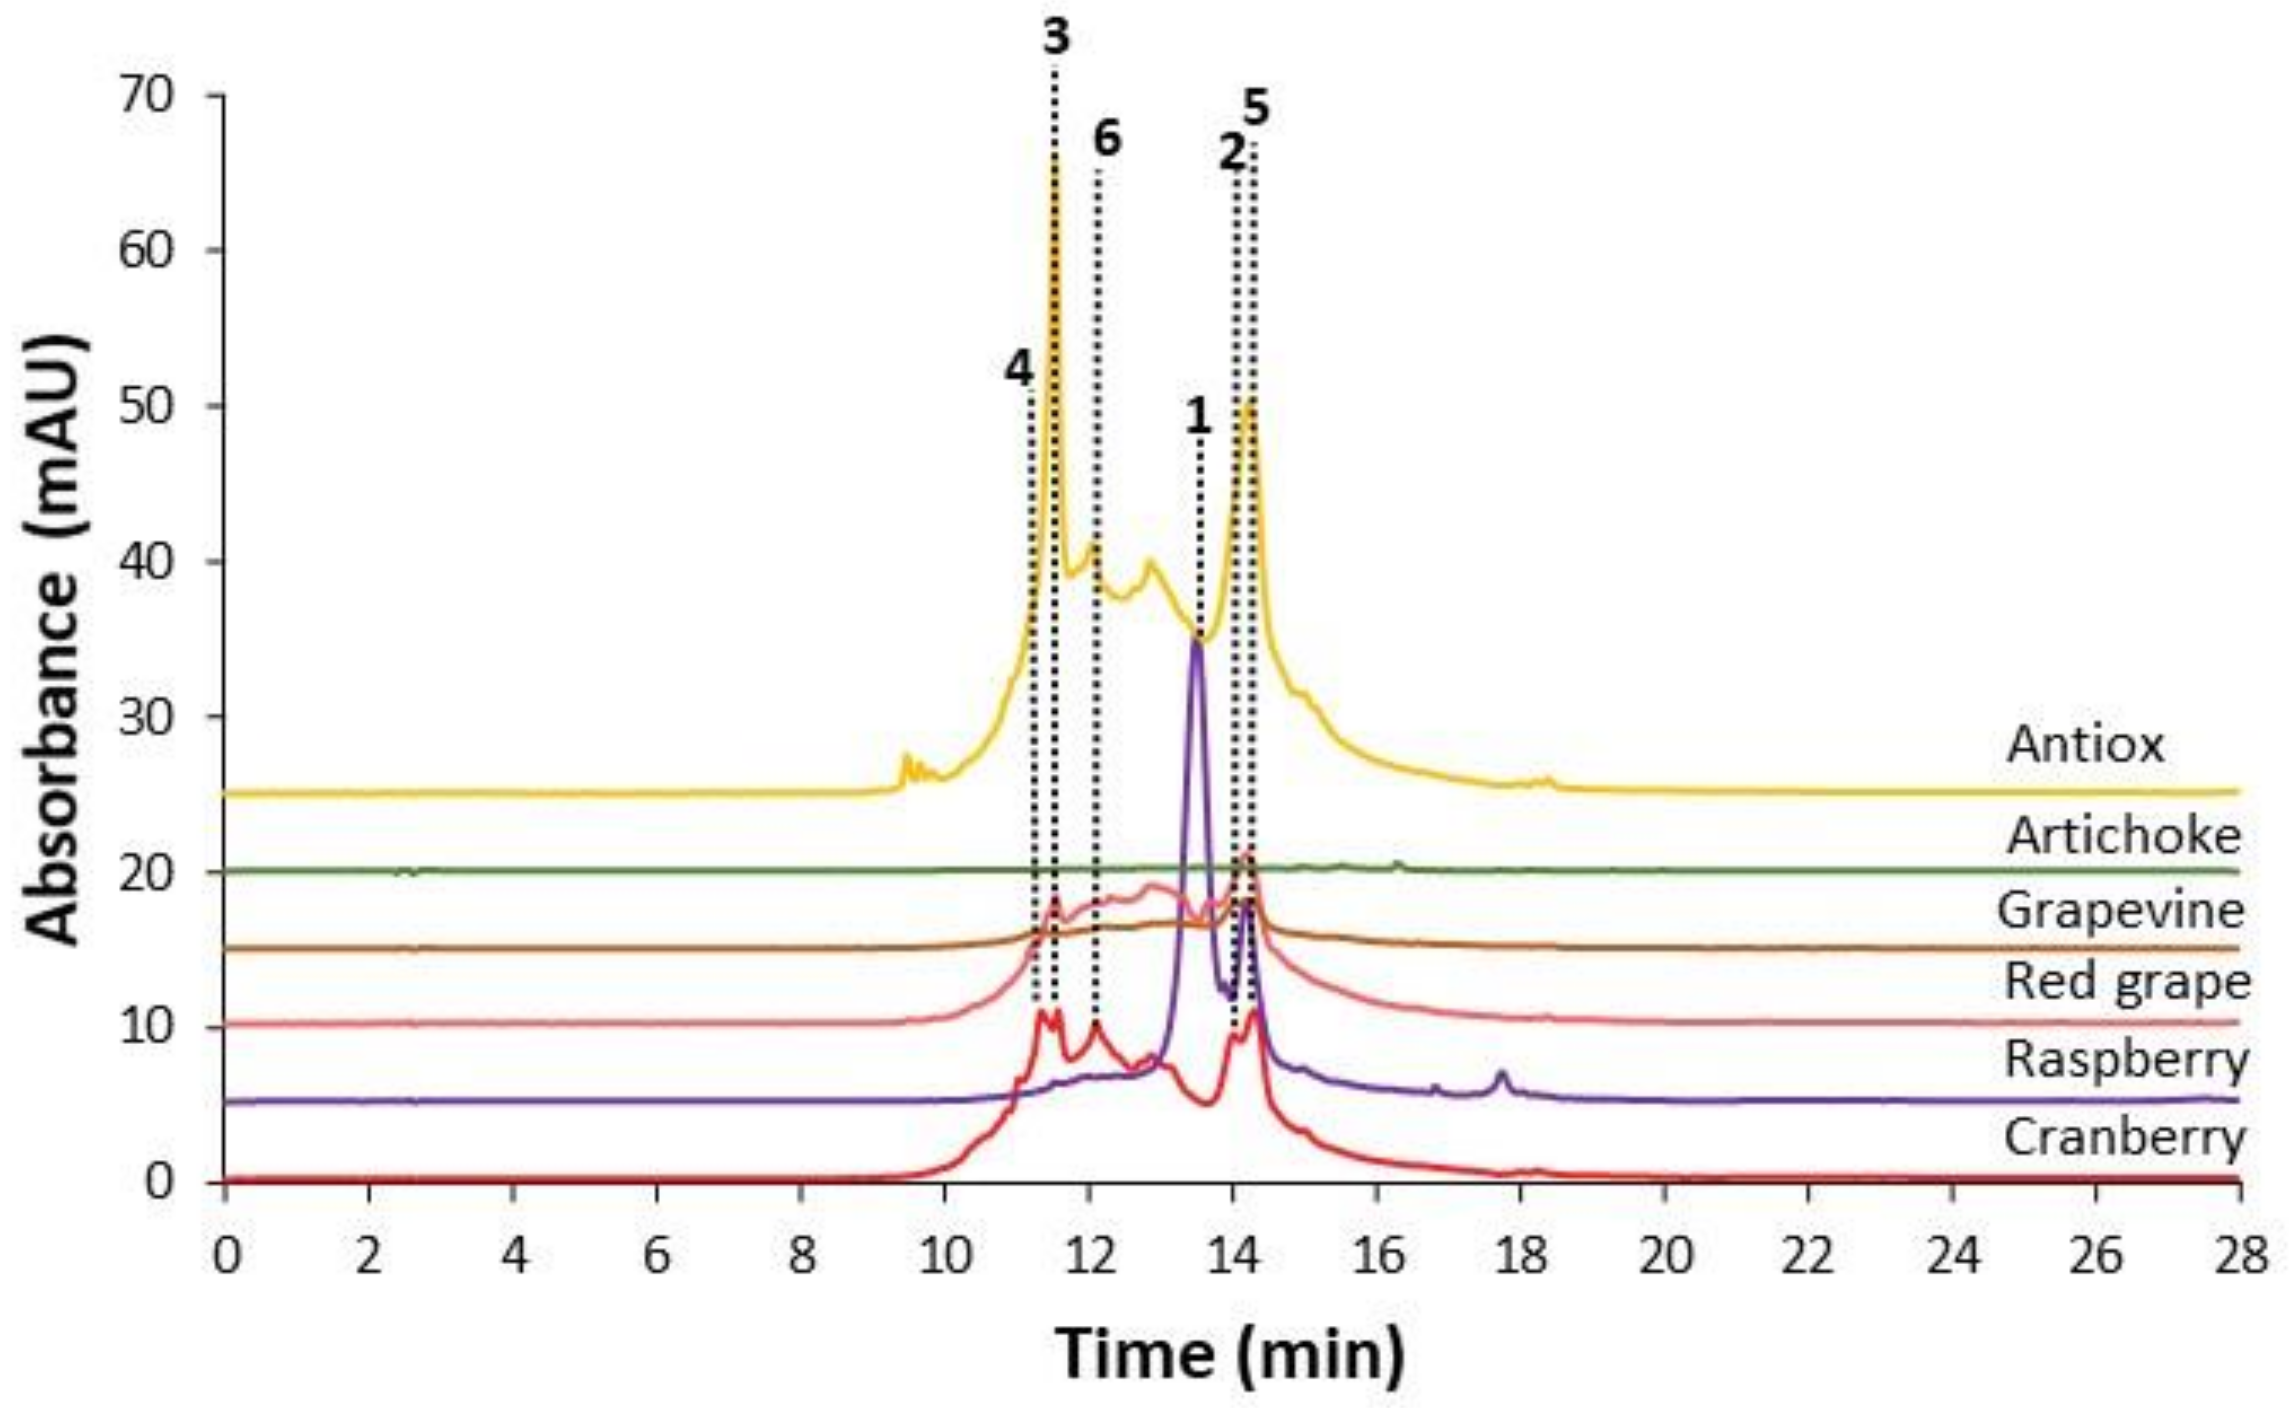
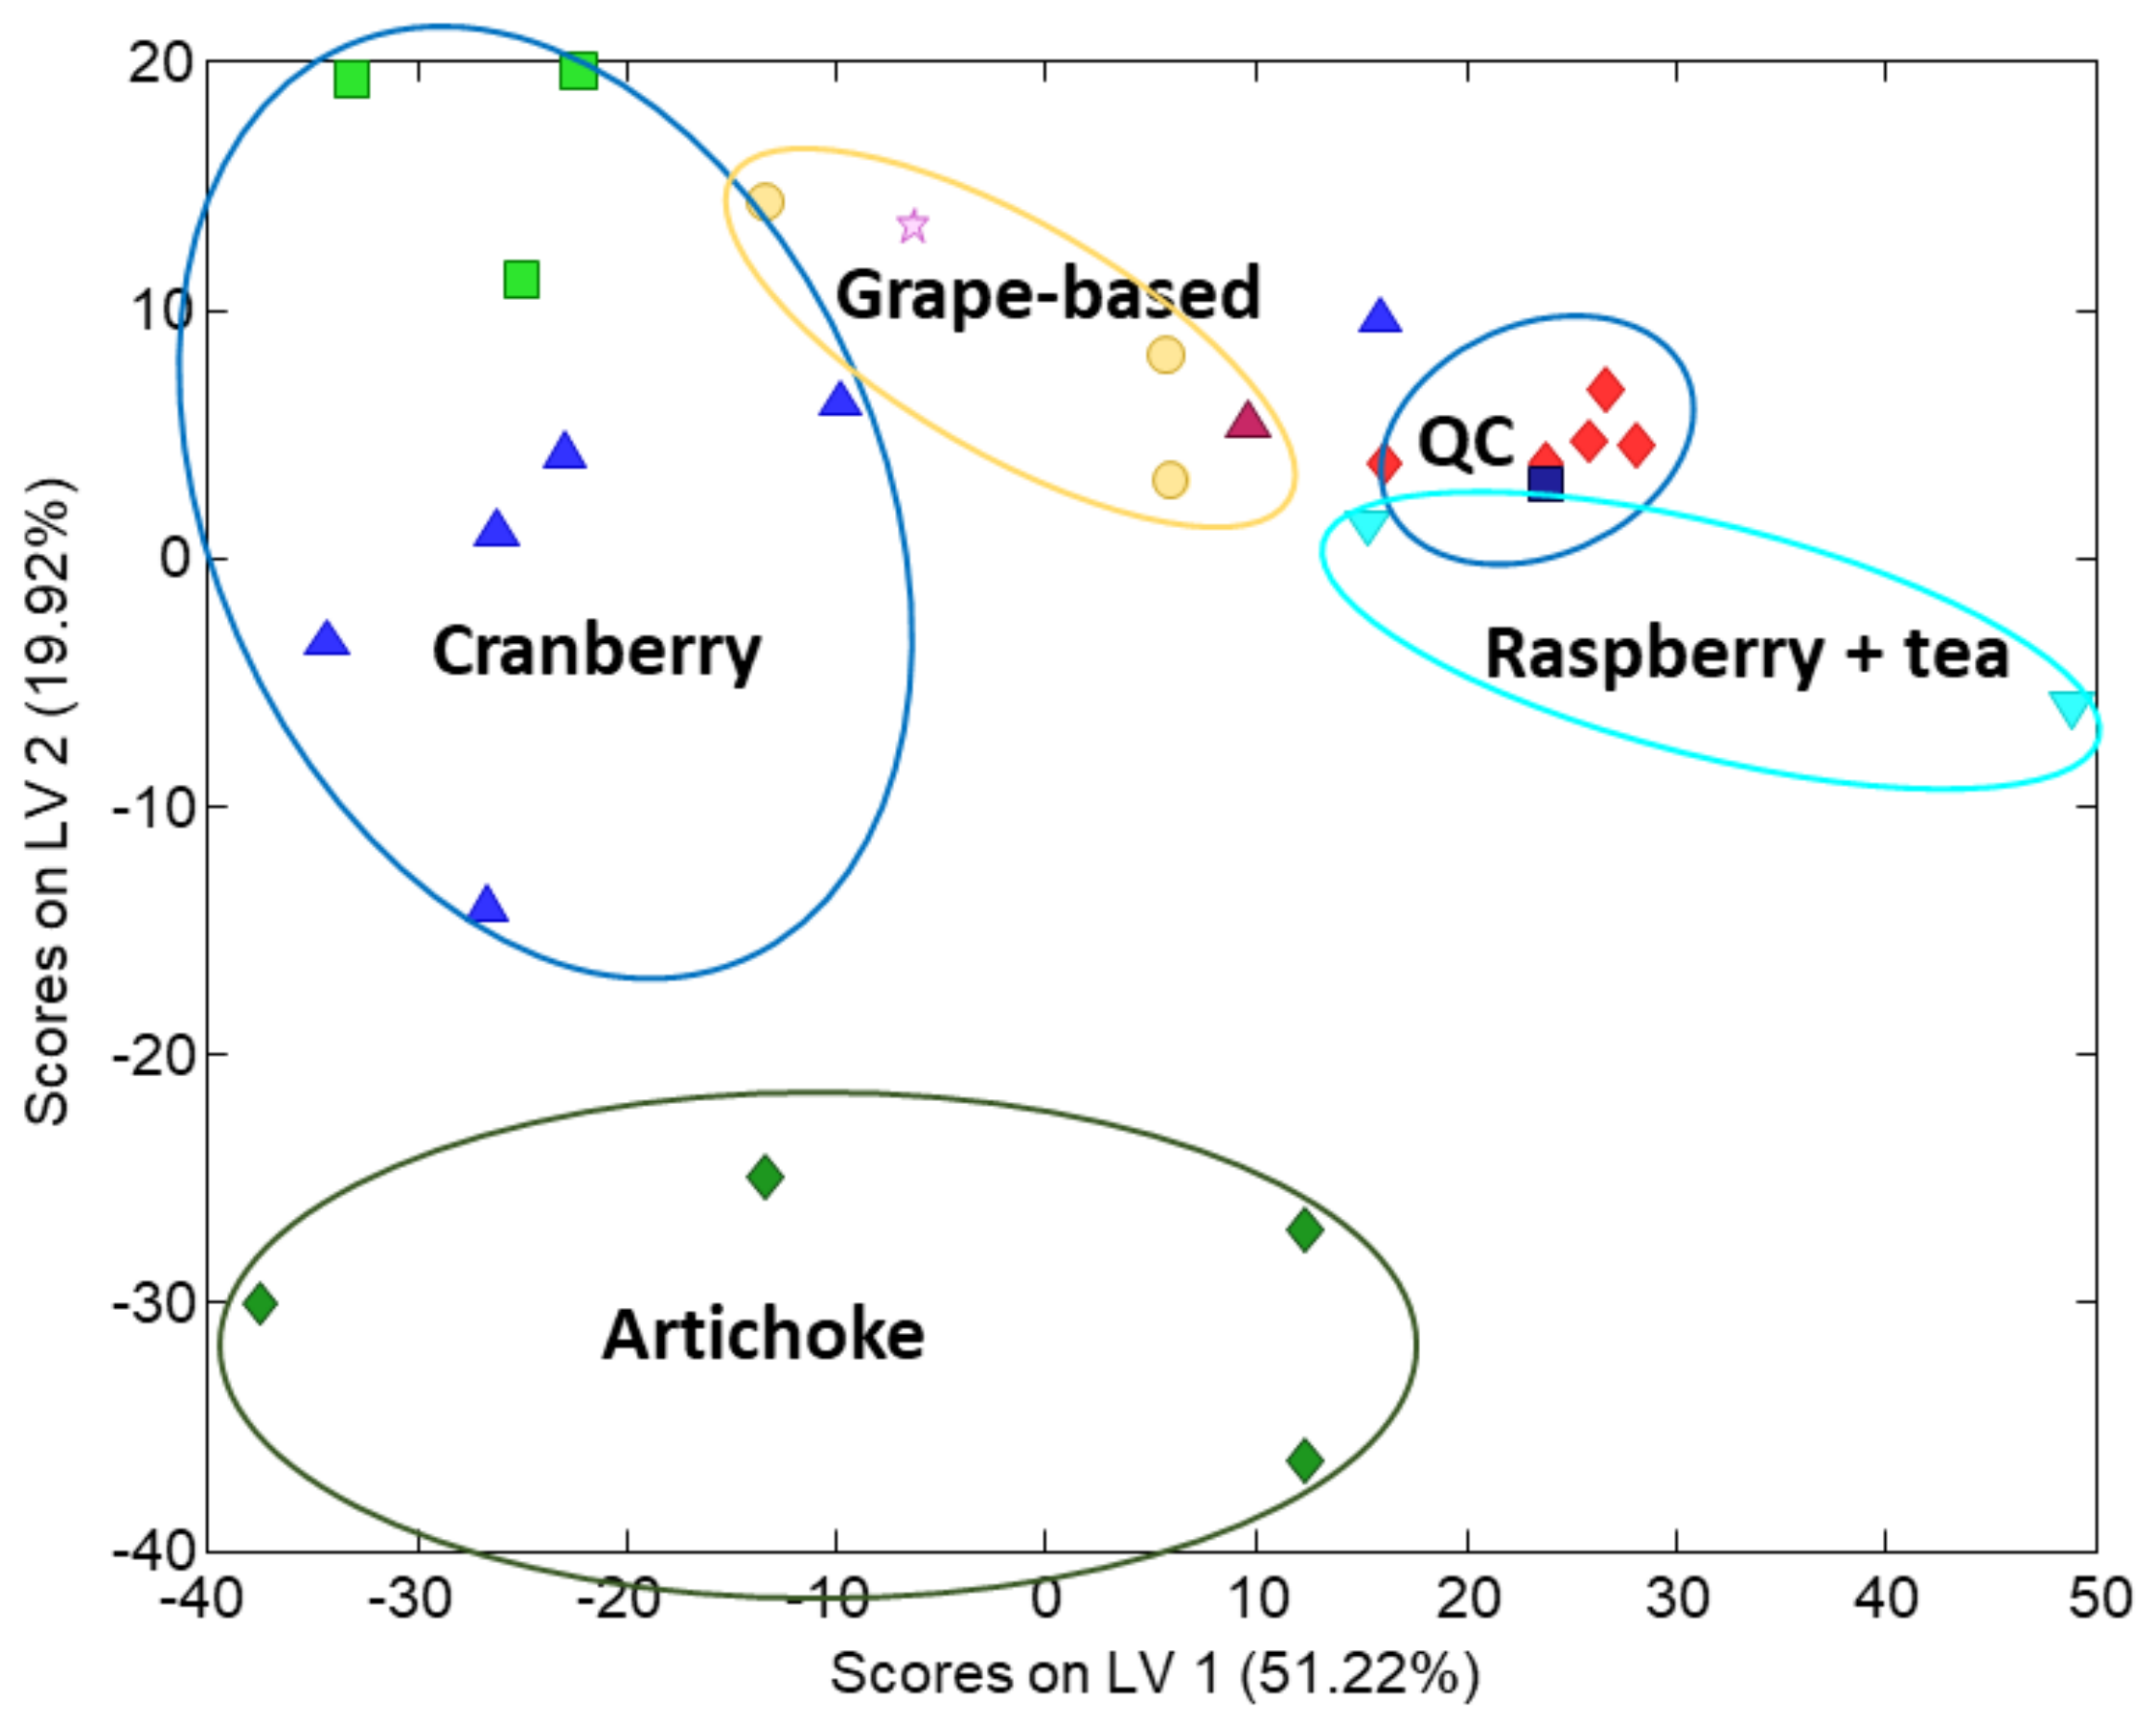
3.2. Sample Characterization by PCA and PLS–DA
4. Conclusions
Author Contributions
Funding
Institutional Review Board Statement
Informed Consent Statement
Conflicts of Interest
References
- Gu, L.; Kelm, M.A.; Hammerstone, J.F.; Beecher, G.; Holden, J.; Haytowitz, D.; Gebhardt, S.; Prior, R.L. Concentrations of Proanthocyanidins in Common Foods and Estimations of Normal Consumption. J. Nutr. 2004, 134, 613–617. [Google Scholar] [CrossRef] [PubMed]
- Neto, C.C. Cranberry and Its Phytochemicals: A Review of In Vitro Anticancer Studies. J. Nutr. 2007, 137, 186S–193S. [Google Scholar] [CrossRef] [PubMed] [Green Version]
- Česoniene, L.; Daubaras, R. Phytochemical Composition of the Large Cranberry (Vaccinium macrocarpon) and the Small Cranberry (Vaccinium oxycoccos). In Nutritional Composition of Fruit Cultivars; Academic Press: Cambridge, MA, USA, 2016; pp. 173–194. [Google Scholar] [CrossRef]
- Teleszko, M.; Wojdyło, A. Comparison of Phenolic Compounds and Antioxidant Potential between Selected Edible Fruits and Their Leaves. J. Funct. Foods 2015, 14, 736–746. [Google Scholar] [CrossRef]
- Lu, Y.; Pekerti, B.N.; Toh, Z.S.; Broom, F.; Savage, G.; Liu, S.Q.; Huang, D. Physico-Chemical Parameters and Proanthocyanidin Profiles of Cranberries Cultivated in New Zealand. J. Food Compos. Anal. 2017, 63, 1–7. [Google Scholar] [CrossRef]
- He, X.; Rui, H.L. Cranberry Phytochemicals: Isolation, Structure Elucidation, and Their Antiproliferative and Antioxidant Activities. J. Agric. Food Chem. 2006, 54, 7069–7074. [Google Scholar] [CrossRef]
- Côté, J.; Caillet, S.; Dussault, D.; Sylvain, J.F.; Lacroix, M. Effect of Juice Processing on Cranberry Antibacterial Properties. Food Res. Int. 2011, 44, 2922–2929. [Google Scholar] [CrossRef]
- Gramza-Michałowska, A.; Sidor, A.; Kulczyński, B. Berries as a Potential Anti-Influenza Factor—A Review. J. Funct. Foods 2017, 37, 116–137. [Google Scholar] [CrossRef]
- Rupasinghe, H.P.V.; Sekhon-Loodu, S.; Mantso, T.; Panayiotidis, M.I. Phytochemicals in regulating fatty acid beta-oxidation: Potential underlying mechanisms and their involvement in obesity and weight loss. Pharmacol. Ther. 2016, 165, 153–163. [Google Scholar] [CrossRef]
- Fernandez-Mar, M.I.; Mateos, R.; Garcia-Parrilla, M.C.; Puertas, B.; Cantos-Villar, E. Bioactive compounds in wine: Resveratrol, hydroxytyrosol and melatonin: A review. Food Chem. 2012, 130, 797–813. [Google Scholar] [CrossRef]
- Kraft, K. Artichoke leaf extract—Recent findings reflecting effects on lipid metabolism, liver and gastrointestinal tracts. Phytomedicine 1997, 4, 369–378. [Google Scholar] [CrossRef]
- Côté, J.; Caillet, S.; Doyon, G.; Sylvain, J.-F.; Lacroix, M. Bioactive Compounds in Cranberries and Their Biological Properties. Crit. Rev. Food Sci. Nutr. 2010, 50, 666–679. [Google Scholar] [CrossRef]
- Feghali, K.; Feldman, M.; La, V.D.; Santos, J.; Grenier, D. Cranberry Proanthocyanidins: Natural Weapons against Periodontal Diseases. J. Agric. Food Chem. 2012, 60, 5728–5735. [Google Scholar] [CrossRef]
- Weber, F.; Schulze-Kaysers, N.; Schieber, A. Characterization and Quantification of Polyphenols in Fruits. In Polyphenols in Plants: Isolation, Purification and Extract Preparation, 2nd ed.; Academic Press: Cambridge, MA, USA, 2014; pp. 293–304. [Google Scholar] [CrossRef]
- Lucci, P.; Saurina, J.; Núñez, O. Trends in LC-MS and LC-HRMS Analysis and Characterization of Polyphenols in Food. TrAC Trends Anal. Chem. 2017, 88, 1–24. [Google Scholar] [CrossRef] [Green Version]
- Wallace, T.C.; Giusti, M.M. Evaluation of Parameters That Affect the 4-Dimethylaminocinnamaldehyde Assay for Flavanols and Proanthocyanidins. J. Food Sci. 2010, 75, 619–625. [Google Scholar] [CrossRef]
- Granato, D.; Santos, J.S.; Maciel, L.G.; Nunes, D.S. Chemical Perspective and Criticism on Selected Analytical Methods Used to Estimate the Total Content of Phenolic Compounds in Food Matrices. TrAC Trends Anal. Chem. 2016, 80, 266–279. [Google Scholar] [CrossRef]
- Prior, R.L.; Gu, L. Occurrence and Biological Significance of Proanthocyanidins in the American Diet. Phytochemistry 2005, 66, 2264–2280. [Google Scholar] [CrossRef]
- Payne, M.J.; Hurst, W.J.; Stuart, D.A.; Ou, B.; Fan, E.; Ji, H.; Kou, Y. Determination of Total Procyanidins in Selected Chocolate and Confectionery Products Using DMAC. J. AOAC Int. 2010, 93, 89–96. [Google Scholar] [CrossRef] [Green Version]
- Krueger, C.G.; Reed, J.D.; Feliciano, R.P.; Howell, A.B. Quantifying and Characterizing Proanthocyanidins in Cranberries in Relation to Urinary Tract Health. Anal. Bioanal. Chem. 2013, 405, 4385–4395. [Google Scholar] [CrossRef]
- Wang, Y.; Singh, A.P.; Hurst, W.J.; Glinski, J.A.; Koo, H.; Vorsa, N. Influence of Degree-of-Polymerization and Linkage on the Quantification of Proanthocyanidins Using 4-Dimethylaminocinnamaldehyde (DMAC) Assay. J. Agric. Food Chem. 2016, 64, 2190–2199. [Google Scholar] [CrossRef]
- Puigventos, L.; Nunez, O.; Saurina, J. HPLC Fingerprints for the Authentication of Cranberry-Based Products Based on Multivariate Calibration Approaches. Curr. Anal. Chem. 2016, 13, 256–261. [Google Scholar] [CrossRef] [Green Version]
- Pardo-Mates, N.; Vera, A.; Barbosa, S.; Hidalgo-Serrano, M.; Núñez, O.; Saurina, J.; Hernández-Cassou, S.; Puignou, L. Characterization, Classification and Authentication of Fruit-Based Extracts by Means of HPLC-UV Chromatographic Fingerprints, Polyphenolic Profiles and Chemometric Methods. Food Chem. 2017, 221, 29–38. [Google Scholar] [CrossRef] [Green Version]
- Bakhytkyzy, I.; Nuñez, O.; Saurina, J. Size Exclusion Coupled to Reversed Phase Liquid Chromatography for the Characterization of Cranberry Products. Food Anal. Methods 2019, 12, 604–611. [Google Scholar] [CrossRef] [Green Version]
- Bakhytkyzy, I.; Nuñez, O.; Saurina, J. Determination of Flavanols by Liquid Chromatography with Fluorescence Detection. Application to the Characterization of Cranberry-Based Pharmaceuticals through Profiling and Fingerprinting Approaches. J. Pharm. Biomed. Anal. 2018, 156, 206–213. [Google Scholar] [CrossRef]
- Van Dooren, I.; Foubert, K.; Theunis, M.; Naessens, T.; Pieters, L.; Apers, S. Advantages of a Validated UPLC–MS/MS Standard Addition Method for the Quantification of A-Type Dimeric and Trimeric Proanthocyanidins in Cranberry Extracts in Comparison with Well-Known Quantification Methods. J. Pharm. Biomed. Anal. 2018, 148, 32–41. [Google Scholar] [CrossRef]
- Gu, L.; Kelm, M.; Hammerstone, J.F.; Beecher, G.; Cunningham, D.; Vannozzi, S.; Prior, R.L. Fractionation of Polymeric Procyanidins from Lowbush Blueberry and Quantification of Procyanidins in Selected Foods with an Optimized Normal-Phase HPLC-MS Fluorescent Detection Method. J. Agric. Food Chem. 2002, 50, 4852–4860. [Google Scholar] [CrossRef]
- Zou, T.; Li, Z.; Percival, S.S.; Bonard, S.; Gu, L. Fabrication, Characterization, and Cytotoxicity Evaluation of Cranberry Procyanidins-Zein Nanoparticles. Food Hydrocoll. 2012, 27, 293–300. [Google Scholar] [CrossRef]
- Liu, H.; Zou, T.; Gao, J.M.; Gu, L. Depolymerization of Cranberry Procyanidins Using (+)-Catechin, (-)-Epicatechin, and (-)-Epigallocatechin Gallate as Chain Breakers. Food Chem. 2013, 141, 488–494. [Google Scholar] [CrossRef]
- Neto, C.C.; Krueger, C.G.; Lamoureaux, T.L.; Kondo, M.; Vaisberg, A.J.; Hurta, R.A.R.; Curtis, S.; Matchett, M.D.; Yeung, H.; Sweeney, M.I.; et al. MALDI-TOF MS Characterization of Proanthocyanidins from Cranberry Fruit (Vaccinium macrocarpon) That Inhibit Tumor Cell Growth and Matrix Metalloproteinase Expression in Vitro. J. Sci. Food Agric. 2006, 86, 18–25. [Google Scholar] [CrossRef]
- Brown, P.N.; Turi, C.E.; Shipley, P.R.; Murch, S.J. Erratum: Comparisons of Large (Vaccinium macrocarpon Ait) and Small (Vaccinium oxycoccos, L., Vaccinium vitis-idaea, L.) Cranberry in British Columbia by Phytochemical Determination, Antioxidant Potential, and Metabolomic Profiling with Chemometric Analysis. Planta Med. 2012, 78, 630–640. [Google Scholar] [CrossRef]
- Iswaldi, I.; Gómez-Caravaca, A.M.; Arráez-Román, D.; Uberos, J.; Lardón, M.; Segura-Carretero, A.; Fernández-Gutiérrez, A. Characterization by High-Performance Liquid Chromatography with Diode-Array Detection Coupled to Time-of-Flight Mass Spectrometry of the Phenolic Fraction in a Cranberry Syrup Used to Prevent Urinary Tract Diseases, Together with a Study of Its Antibacterial Activity. J. Pharm. Biomed. Anal. 2012, 58, 34–41. [Google Scholar] [CrossRef] [PubMed]
- Bjorkman, M.; Klingen, I.; Birch, A.N.E.; Bones, A.M.; Bruce, T.J.A.; Johansen, T.J.; Meadow, R.; Molmann, J.; Seljasen, R.; Smart, L.E.; et al. Phytochemicals of Brassicaceae in plant protection and human health—Influences of climate, environment and agronomic practice. Phytochemistry 2011, 72, 538–556. [Google Scholar] [CrossRef] [PubMed]
- Yang, L.; Wen, K.S.; Ruan, X.; Zhao, Y.X.; Wei, F.; Wang, Q. Response of Plant Secondary Metabolites to Environmental Factors. Molecules 2018, 23, 762. [Google Scholar] [CrossRef] [PubMed] [Green Version]
- Heimler, D.; Romani, A.; Ieri, F. Plant polyphenol content, soil fertilization and agricultural management: A review. Eur. Food Res. Technol. 2017, 243, 1107–1115. [Google Scholar] [CrossRef]
- Lanza, B.; Ninfali, P. Antioxidants in Extra Virgin Olive Oil and Table Olives: Connections between Agriculture and Processing for Health Choices. Antioxidants 2020, 9, 41. [Google Scholar] [CrossRef] [Green Version]
- Croge, C.P.; Cuquel, F.L.; Pintro, P.T.M.; Biasi, L.A.; De Bona, C.M. Antioxidant Capacity and Polyphenolic Compounds of Blackberries Produced in Different Climates. Hotscience 2019, 54, 2209–2213. [Google Scholar] [CrossRef]
- Spinardi, A.; Cola, G.; Gardana, C.S.; Mignani, I. Variation of Anthocyanin Content and Profile Throughout Fruit Development and Ripening of Highbush Blueberry Cultivars Grown at Two Different Altitudes. Front. Plant Sci. 2019, 10, 1045. [Google Scholar] [CrossRef]
- Manukyan, A. Secondary metabolites and their antioxidant capacity of Caucasian endemic thyme (Thymus transcaucasicus Ronn.) as affected by environmental stress. J. Appl. Res. Med. Arom. Plants 2019, 13, 100209. [Google Scholar] [CrossRef]
- Chrysargyris, A.; Mikallou, M.; Petropoulos, S.; Tzortzakis, N. Profiling of Essential Oils Components and Polyphenols for Their Antioxidant Activity of Medicinal and Aromatic Plants Grown in Different Environmental Conditions. Agronomy 2020, 10, 727. [Google Scholar] [CrossRef]
- Gomes, J.D.; Terto, M.V.C.; do Santos, S.G.; da Silva, M.S.; Tavares, J.F. Seasonal Variations of Polyphenols Content, Sun Protection Factor and Antioxidant Activity of Two Lamiaceae Species. Pharmaceutics 2021, 13, 110. [Google Scholar] [CrossRef]
- Gardana, C.; Scialpi, A.; Fachechi, C.; Simonetti, P. Identification of Markers for the Authentication of Cranberry Extract and Cranberry-Based Food Supplements. Heliyon 2020, 6, e03863. [Google Scholar] [CrossRef]
- Hurkova, K.; Uttl, L.; Rubert, J.; Navratilova, K.; Kocourek, V.; Stranska-Zachariasova, M.; Paprstein, F.; Hajslova, J. Cranberries versus Lingonberries: A Challenging Authentication of Similar Vaccinium Fruit. Food Chem. 2019, 284, 162–170. [Google Scholar] [CrossRef]
- Vidal-Casanella, O.; Arias-Alpizar, K.; Nuñez, O.; Saurina, J. Hydrophilic Interaction Liquid Chromatography to Characterize Nutraceuticals and Food Supplements Based on Flavanols and Related Compounds. Separations 2021, 8, 17. [Google Scholar] [CrossRef]
- Vidal-Casanella, O.; Nuñez, O.; Hernández-Cassou, S.; Saurina, J. Assessment of Experimental Factors Affecting the Sensitivity and Selectivity of the Spectrophotometric Estimation of Proanthocyanidins in Foods and Nutraceuticals. Food Anal. Methods 2021, 14, 485–495. [Google Scholar] [CrossRef]
- Anand, J.; Upadhyaya, B.; Rawat, P.; Rai, N. Biochemical characterization and pharmacognostic evaluation of purified catechins in green tea (Camellia sinensis) cultivars of India. 3 Biotech 2015, 5, 285–294. [Google Scholar] [CrossRef] [Green Version]
- Tapia-Quiros, P.; Montenegro-Landivar, M.F.; Reig, M.; Vecino, X.; Alvarino, T.; Cortina, J.L.; Saurina, J.; Granados, M. Olive Mill and Winery Wastes as Viable Sources of Bioactive Compounds: A Study on Polyphenols Recovery. Antioxidants 2020, 9, 1074. [Google Scholar] [CrossRef]
- Alcalde, B.; Granados, M.; Saurina, J. Exploring the Antioxidant Features of Polyphenols by Spectroscopic and Electrochemical Methods. Antioxidants 2019, 8, 523. [Google Scholar] [CrossRef] [Green Version]
- Stojiljkovic, D.; Arsic, I.; Tadic, V. Extracts of wild apple fruit (Malus sylvestris (L.) Mill., Rosaceae) as a source of antioxidant substances for use in production of nutraceuticals and cosmeceuticals. Ind. Crop. Prod. 2016, 80, 165–176. [Google Scholar] [CrossRef]
- Weseler, A.R.; Bast, A. Masquelier’s grape seed extract: From basic flavonoid research to a well-characterized food supplement with health benefits. Nutr. J. 2017, 16, 5. [Google Scholar] [CrossRef] [Green Version]
- Paschoalinotto, B.H.; Dias, M.I.; Pinela, J.; Pires, T.C.S.P.; Alves, M.J.; Mocan, A.; Calhelha, R.C.; Barros, L.; Ineu, R.P.; Ferreira, I.C.F.R. Phytochemical Characterization and Evaluation of Bioactive Properties of Tisanes Prepared from Promising Medicinal and Aromatic Plants. Foods 2021, 10, 475. [Google Scholar] [CrossRef]
- Jia, W.; Shi, L.; Zhang, F.; Chang, J.; Chu, X.G. High-throughput mass spectrometry scheme for screening and quantification of flavonoids in antioxidant nutraceuticals. J. Chromatogr. A 2019, 1608, 460408. [Google Scholar] [CrossRef]
- Celano, R.; Campone, L.; Pagano, I.; Carabetta, S.; Di Sanzo, R.; Rastrelli, L.; Piccinelli, A.L.; Russo, M. Characterisation of nutraceutical compounds from different parts of particular species of Citrus sinensis ‘Ovale Calabrese’ by UHPLC-UV-ESI-HRMS. Nat. Prod. Res. 2019, 33, 244–251. [Google Scholar] [CrossRef]
- Donno, D.; Mellano, M.G.; De Biaggi, M.; Riondato, I.; Rakotoniaina, E.N.; Beccaro, G.L. Findings in Prunus padus L. Fruits as a Source of Natural Compounds: Characterization of Metabolite Profiles and Preliminary Evaluation of Antioxidant Activity. Molecules 2018, 23, 725. [Google Scholar] [CrossRef] [Green Version]


| Sample Type | Product Name | Manufacturing co. | Pharmaceutical Form | Composition | Indications |
|---|---|---|---|---|---|
| Cranberry (1) | Aquilea Cistitus | Uriach (Spain) | Tablet | Vaccinium macrocarpon | Urinary tract health, cystitis, |
| Cranberry (2) | Żurawina | Colfarm (Poland) | Tablet | Vaccinium macrocarpon, Urtica urens | Urinary tract health, cystitis, diuretic |
| Cranberry (2) | Urinal Intensiv | Walmark (Poland) | Tablet | Vaccinium macrocarpon, Solidago virgaurea, vitamin D | Urinary tract health, cystitis, diuretic, antispasmodic |
| Cranberry (2) | Urinal | Walmark (Poland) | Tablet | Vaccinium macrocarpon, Solidago virgaurea, vitamin D | Urinary tract health, cystitis, diuretic, antispasmodic |
| Cranberry (1) | High Strength Cranberry | Swisse (Australia) | Soft capsule | Vaccinium macrocarpon | Urinary tract health, cystitis, antioxidant |
| Cranberry (1) | Urell | Pharmatoka (France) | Capsule | Vaccinium macrocarpon | Urinary tract health, cystitis, antioxidant |
| Cranberry (2) | Monurelle | Zambon (Spain) | Tablet | Vaccinium macrocarpon, ascorbic acid | Urinary tract health, cystitis, antioxidant |
| Cranberry (2) | Arandano Rojo | Santiveri (Spain) | Tablet | Vaccinium macrocarpon, ascorbic acid, Echinacea purpurea | Urinary tract health, cystitis, antioxidant, immune system activation |
| Cranberry (2) | Antiox | NaturTierra (Spain) | Tablet | Vaccinium macrocarpon, ascorbic acid | Urinary tract health, cystitis, antioxidant |
| Raspberry, tea and others (3) | Cetonas de Frambuesa | Drasanvi (Spain) | Tablet | Rubus idaeus, Mangillera Indica, Camellia sinensis, Paullina cupana, Euterpe olercarcea, L-carnitine | Slimming, increasing fat metabolism, diuretic, stimulant, |
| Raspberry and tea (3) | Raspberry Ketones | Aquilea (Spain) | Tablet | Rubus idaeus, Camellia sinensis, pyridoxine hydrochloride | Slimming, increasing fat metabolism, diuretic, stimulant |
| Black grape (4) | Resverasor | Soria Natural (Spain) | Tablet | Vitis vinifera (skin and seeds) | Antioxidant, antiaging |
| Black grape (5) and others | Resveratrol | Aquilea (Spain) | Tablet | Vitis vinifera (seeds), Allium cepa, Polygonum cuspidatum | Antioxidant, antiaging |
| Black grape, (5) pomegranate | Revidox | Stillvid (Spain) | Capsule | Vitis vinifera (fruit extract), Punica granatum | Antioxidant, antiaging |
| Grapevine (5) | Arkocápsula Vid Roja | Arkopharma (Spain) | Capsule | Vitis vinifera (leaves extract) | Promoting blood circulation antioxidant, |
| Artichoke (6) | Alcachofa | Drasanvi (Spain) | Capsule | Cynara scolymus | Hypolipidemic, detox |
| Artichoke (6) | Alcachofa | Arkopharma (Spain) | Capsule | Cynara scolymus | Hypolipidemic, detox |
| Artichoke (6) | Alcachofa | Aquilea (Spain) | Capsule | Cynara scolymus | Hypolipidemic, detox |
| Artichoke (6) | Alcachofa | Roha (India) | Tablet | Cynara scolymus | Hypolipidemic, detox |
| Antiox mixture (7) | Antiox Forte | Santiveri (Spain) | Capsule | Vitis vinifera, Rubus idaeus, Vaccinium corymbosum, Punica granatum, Fragaria vesca, Vaccinium macrocarpom, Vaccinium myrtillus | Detox, antioxidant, |
| Antiox mixture (8) | Venox | Drasanvi (Spain) | Capsule | Vitis vinifera, Aesculus hippocastanum, Ruscus aculeatus, Hamamelis virginiana, Ribes nigrum, Vaccinium myrtillus, Ginkgo biloba, ascorbic acid, vitamin A and E | Detox, antioxidant, promoting blood circulation |
Publisher’s Note: MDPI stays neutral with regard to jurisdictional claims in published maps and institutional affiliations. |
© 2021 by the authors. Licensee MDPI, Basel, Switzerland. This article is an open access article distributed under the terms and conditions of the Creative Commons Attribution (CC BY) license (https://creativecommons.org/licenses/by/4.0/).
Share and Cite
Vidal-Casanella, O.; Nuñez, O.; Saurina, J. Liquid Chromatographic Fingerprints for the Characterization of Flavanol-Rich Nutraceuticals Based on 4-Dimethylaminocinnamaldehyde Precolumn Derivatization. Sci. Pharm. 2021, 89, 18. https://0-doi-org.brum.beds.ac.uk/10.3390/scipharm89020018
Vidal-Casanella O, Nuñez O, Saurina J. Liquid Chromatographic Fingerprints for the Characterization of Flavanol-Rich Nutraceuticals Based on 4-Dimethylaminocinnamaldehyde Precolumn Derivatization. Scientia Pharmaceutica. 2021; 89(2):18. https://0-doi-org.brum.beds.ac.uk/10.3390/scipharm89020018
Chicago/Turabian StyleVidal-Casanella, Oscar, Oscar Nuñez, and Javier Saurina. 2021. "Liquid Chromatographic Fingerprints for the Characterization of Flavanol-Rich Nutraceuticals Based on 4-Dimethylaminocinnamaldehyde Precolumn Derivatization" Scientia Pharmaceutica 89, no. 2: 18. https://0-doi-org.brum.beds.ac.uk/10.3390/scipharm89020018