Article

Olanzapine Loaded Nanostructured Lipid Carriers via High Shear Homogenization and Ultrasonication

1
Medway School of Pharmacy, University of Kent, Central Avenue, Chatham Maritime, Kent ME4 4TB, UK
2
University Institute of Technology, Aix-Marseille University, 413 Avenue Gaston Berger, 13625 Aix-en-Provence, France
*
Author to whom correspondence should be addressed.
Submission received: 26 April 2021 / Revised: 21 May 2021 / Accepted: 25 May 2021 / Published: 27 May 2021

Abstract

:
The aim of this study was to understand the effect of high shear homogenization (HSH) and ultrasonication (US) on the physicochemical properties of blank and olanzapine loaded nanostructured lipid carriers (NLCs) along with their drug loading potential and drug release profiles from formulated particles. NLCs were prepared with different ratios of Compritol and Miglyol as the solid and liquid lipids, respectively, under changing HSH and US times between 0 to 15 min. The surfactants (Poloxamer 188 (P188) and tween 80) and the drug content was kept constant in all formulations. The prepared NLCs were evaluated for particle size, polydispersity index, zeta potential, drug crystallinity and chemical interactions between lipids and OLZ. The in-vitro drug release was performed using dialysis tube method in phosphate buffer solution (PBS) at pH 7.4. The formulated NLCs were negatively charged, spherically shaped and monodisperse, with particle sizes ranging from 112 to 191 nm. There was a significant influence of US time on the preparation of NLCs in comparison to HSH, where a significant reduction in the mean particle diameter was seen after 5 min of sonication. An increase of Miglyol content in NLCs led to an increase in particle size. In general, application of US led to decrease in particle size after HSH but an increase in particle diameter of low Miglyol containing preparation was also observed with longer sonication time. OLZ was successfully encapsulated in the NLCs and a total release of 89% was achieved in 24 h in PBS at pH 7.4.

1. Introduction

The need for suitable alternatives to conventional drug delivery systems has led to a rising interest in lipid-based formulations. In particular, lipid nanoparticles (LNPs) are known to have a high drug encapsulation efficiency, high stability and are generally inexpensive to produce [1]. Additionally, as these lipid systems can be prepared without organic solvents and are made up of lipids similar to those found in the human body, hence they are considered to be biocompatible, biodegradable and non-toxic [1,2]. Solid lipid nanoparticles (SLNs) and nanostructured lipid carriers (NLCs) are two main types of LNPs [1].
Both lipid systems are prepared using pure lipids or a blend of lipidic compounds (e.g., triacylglycerols, fatty acids and oils), and a single surfactant (or combined with a co-surfactant) surrounding the particles. The formulation technique and lipid structure typically define several LNP characteristics, including the particle size and size distribution, the drug loading capacity and the encapsulation efficiency [3]. The solid lipid composition (Figure 1) of SLNs results in their perfect crystalline core, which often results in less space available for drug loading. On the other hand, NLCs are made up of both liquid and solid lipids resulting in a more amorphous matrix and less dense lipid packaging. This allows NLCs to have a higher drug encapsulation, minimal drug leakage and long-term storage stability in comparison to SLNs [4,5,6].
To date researchers have investigated the potential of LNPs for numerous therapeutic applications, as shown in Figure 2. For example, Lin et al., 2010 prepared lipophilic calcipotriol and hydrophilic methotrexate loaded NLC’s for the treatment of psoriasis. Their study revealed 2.4 to 4.4 times enhanced skin permeation with negligible skin irritation compared to the control experiment [7]. NLC’s have also been used for increasing the bioavailability of orally administered drugs by enhancing their uptake through the lymphatic system (M-cells in the intestinal membrane) and bypassing the first pass metabolism [8]. Chun-Yang Z. et al., 2010 prepared vinpocetine NLC formulation to estimate the potential of NLC as an oral delivery system for poorly water-soluble drugs. Their oral bioavailability study of the formulation, carried out using Wistar rats, revealed a 322% increase in drug concentration compared to the pure drug suspension [9]. Furthermore, Joshi M. et al., 2008 prepared NLCs containing artemether, a poorly water-soluble antimalarial agent. Their formulation ‘Nanoject’ was investigated in mice which showed significantly higher (p < 0.005) antimalarial activity as compare to the marketed injectable formulation [10].
Usage of the NLCs in ocular drug delivery has also been investigated to enhance pre-corneal retention time. Shen et al. 2010 prepared mucoadhesive NLC’s modified by thiolated agent which resulted in low systemic cyclosporine concentration but significantly higher residence time in aqueous humor, tear and ocular tissues than that of oil solution and non-thiolated NLCs (p < 0.05) [11]. Furthermore, Alam et al. 2012 prepared bromocriptine incorporated NLCs for the controlled delivery of drug to provide extended therapeutic effects for the treatment of Parkinson’s disease. Their drug loaded NLCs were found to be longer lasting (5 h more efficacy) compared to the non-encapsulated counterpart. Such beneficial applications of NLC’s also been achieved in the field of pulmonary drug delivery [12], delivery of chemotherapeutic agent [13,14] and gene delivery to actively suppress tumor growth or treat cancer [15,16].
The lipids used to prepare NLCs are usually triglycerides, fatty acids, waxes and partial glycerides. In this work, we prepared NLCs using Compritol® 888 ATO and Miglyol as these are considered GRAS substances and are commonly used to formulate LNPs [4,17,18,19]. Moreover, both excipients are cheap, widely available, highly biocompatible, highly stable and able to incorporate a range of pharmaceutical actives or cosmetics [17,18]. Another reason behind the choice of Compritol® as the solid lipid was its neutral cytotoxic behavior and its ability to solubilize Olanzapine (OLZ) [18,19].
OLZ was selected as the model drug for encapsulation into the formulated NLCs. OLZ is an essential atypical anti-psychotic agent that is effective in the treatment of schizophrenia [20]. OLZ is lipophilic, which means that it is highly permeable through biological membranes but suffers from low oral bioavailability due to poor aqueous solubility and extensive first pass metabolism [21]. Therefore, it is important to design a pharmaceutical system which provides a better dissolution rate and potentially results in higher OLZ bioavailability. Various methods have been investigated to help improve the oral delivery and controlled release of OLZ including the use of lipid-based carriers [21,22,23].
There are many formulation approaches for LNP formulation including solvent emulsification/evaporation, supercritical fluid extraction of emulsions, high pressure homogenization and spray-drying [24]. In this study, we employ a combination of high shear homogenization (HSH) and ultrasonication (US) for the production of OLZ-loaded NLCs. Both HSH and US are cost-effective methods that can be easily applied to the production of lipid nanosystems. However, these techniques can have some drawbacks, particularly associated with long processing times [25]. The impact of processing time on the properties of LNPs (e.g., influence on particle size) when these two techniques are used either in isolation or combination are hard to find. Therefore, the objective of this study was to understand the effect of HSH and US processing time on the physicochemical properties including particle size, polydispersity index (PDI) and surface charge of NLCs so that the production of LNPs can be optimized efficiently.
The aim of this study was to understand the effect of HSH and US on the development of NLCs containing Compritol® and Miglyol and its effect on the particle size and surface charge. The feasibility to encapsulate OLZ into these NLCs was also explored to improve dissolution rate of the drug using these formulations. In this study, Compritol® 888 ATO was used as the solid and Miglyol 812 N as liquid lipid along with the binary mixture of Poloxamer 188 and Tween 80 surfactants.

2. Materials and Methods

2.1. Materials

Olanzapine, Poloxamer 188 (Pluronic F68), Tween 80 (Polysorbate 80), Disodium hydrogen phosphate (Na2HPO4) and Potassium dihydrogen phosphate (KH2PO4) were purchased from Sigma Aldrich, Gillingham, UK. Compritol® 888 ATO (glyceryl behenate) is a mixture of mono-, di- and triesters of behenic acid (C22), and was obtained from Gattefossè, La Défense, France. Miglyol 812 N (caprylic/capric triglycerides) was provided by IOI Oleochemicals, Hamburg, Germany. All other chemical reagents used were of analytical grade.

2.2. Methods

2.2.1. Preparation of Blank and OLZ-Loaded NLCs

For this study, a combination of HSH and US was applied to produce blank and drug-loaded NLCs. To study the effects of both preparation techniques on the morphological and surface characteristics of NLCs, the total lipid content [Compritol® 888 ATO (C888) and Miglyol 812 N (Mig)] and the amount of surfactant [Poloxamer 188 (P188) and tween 80] were kept constant at 300 mg and 200 mg, respectively. The volume of aqueous media (40 mL) and quantity of OLZ (20 mg) also remained consistent for all experiments. Prior to the formulation of NLCs, both the lipid phase (C888 + Mig) and aqueous phase (P188 + tween 80 + distilled water) were heated separately at 85 °C to allow a complete melt of the excipients. For drug loaded NLCs, OLZ was added to the lipid phase after heating to minimize drug degradation. Subsequently, the aqueous phase was combined with the lipid mixture under high-speed stirring at 24,000 rpm using an UltraTurrax® T25 (IKA Company, Oxford, UK). The resulting emulsion was then processed using ultrasonic probe sonicator (Hielscher UP400St, Hielscher Ultrasonics, Teltow, Germany) at 200 W, followed by cooling in an ice bath for 10 min to solidify the lipid matrix and produce NLCs.
The percentage ratios (Table 1) of solid to liquid lipid were varied between 5 to 50% based on the weight of solid lipid. The HSH and US time were also altered between 0 to 15 min to understand the impact of processing time on the particle size and surface charge.

2.2.2. Determination of Particle Size, PDI and Zeta Potential

These measurements were carried out to determine the size and surface charge of the NLCs. The average particle sizes and PDI were measured by dynamic light scattering (DLS) using a Zetasizer Nano-ZS (Malvern Instruments Ltd., Malvern, UK). The instrument was equipped with a laser emitting at 633 nm, and backscattering detection was set at an angle of 173°. Samples were prepared by diluting 10 μL of NLC suspensions with 2 mL of deionized water previously filtered through a 0.2 μm syringe filter. The measurements were carried out in triplicate at room temperature (25 °C) and results reported as the average of the three independent measurements. The surface charge of the NLC dispersions was determined by performing zeta-potential (ζ-potential) measurements with the Zetasizer Nano-ZS at 25 °C. The ζ-potential was automatically calculated from the electrophoretic mobility based on Smoluchowski’ equation.

2.2.3. Bright Field Scanning Transmission Electron Microscopy (BF-STEM)

The BF-STEM was performed in order to determine the shape and surface morphology of the NLCs. Prior to this analysis, the samples were stained with 2% phosphotungstic acid solution to provide a clearer view of the NLCs. A drop of the stained NLC dispersion was placed on the sample stub, making sure to remove any overflowing suspension. Thereafter, the stub was mounted onto the sample holder and placed inside the Hitachi SU8030 (Hitachi High-Technologies, Maidenhead, UK) scanning electron microscope. Micrographs were collected in transmission mode at a voltage of 30.0 kV.

2.2.4. Attenuated Total Reflectance-Fourier Transform Infrared (ATR-FTIR) Spectroscopy

The ATR-FTIR spectra of prepared NLCs were obtained using a Spectrum Two FTIR spectrometer (Perkin Elmer, Beaconsfield, UK). The sample was spread uniformly on the surface of a single reflection horizontal ATR accessory with a zinc selenide (ZnSe) crystal. The spectra were collected from 3450–450 cm−1 range in transmission mode. Approximately 16 scans were collected for each spectrum with a resolution of 8 cm−1.

2.2.5. X-Ray Diffraction (XRD) Analysis

The crystallinity of freeze-dried NLCs was examined by performing XRD analysis using a Bruker D8 Advance (Bruker GmbH, Karlsruhe, Germany) diffractometer in theta-theta reflection mode with copper anode. The frozen aqueous NLC dispersions were freeze-dried under deep vacuum at −55 °C using a ScanVac CoolSafe freeze dryer (LaboGene ApS, Lynge, Denmark). Diffractograms were obtained at room temperature for all samples. For XRD analysis, samples were sandwiched between two Mylar films and placed in sample holder. Spectra were collected in transmission mode using CuKα radiations at a scan rate of 0.02 °/sec from 2 to 47° 2θ values by rotating the sample cell at 15 rpm. Data collection and interpretations were performed using DiffracPlus and the EVA V.16 program, respectively.

2.2.6. Drug Entrapment Efficiency

Drug entrapment efficiency was determined by an ultrafiltration-centrifugation (centrifugal filters Amicon Ultra-4 with 100 kDa molecular weight cut-off, Millipore, Germany) based indirect method reported by Cirri et al., 2012 [26]. Briefly, 500 µL of each OLZ-loaded NLC dispersion was placed into the upper chamber of the ultrafiltration device, and centrifuged at 12,000 rpm for 30 min. The concentration of unencapsulated drug in the outer chamber was then spectrophotometrically assayed at 258 nm (Cary 100 UV-Vis spectrometer, Agilent Technologies, Cheadle, UK). Entrapment efficiency (EE) of OLZ in nanoparticles was calculated according to Equation (1).
E E % = ( W t o t a l   d r u g W f r e e   d r u g / W t o t a l   d r u g ) 100
Where, W t o t a l   d r u g is the total drug in the formulation and W f r e e   d r u g is the amount of unencapsulated drug after ultrafiltration-centrifugation.

2.2.7. Drug Release Studies

The samples for drug release studies were prepared with 15 min HSH followed by 5 min of US. The in-vitro drug release studies for prepared OLZ-loaded NLCs was performed using dialysis tube method [27]. The dialysis tubes were cut in size and pretreated by dipping them in pH 7.4 phosphate buffer solution (PBS) for 24 h. The NLC suspension containing equivalent of 20 mg OLZ was filled in the tubing, and a thread was used to secure both ends of the tube. Thereafter, the tube was suspended in a beaker containing 200 mL PBS under stirring at 300 rpm and a constant temperature of 37 ± 2 °C. At regular time intervals, 4 mL aliquots of the external medium were removed and replaced with the same volume of fresh PBS. The withdrawn sample was filtered and analyzed by ultraviolet-visible (UV-Vis) spectroscopy (Cary 100 UV-Vis spectrometer, Agilent Technologies, Cheadle, UK) at 258 nm to determine OLZ release. These experiments were carried out in triplicate. The percentage drug release was determined using the Equation (2):
D % = 100 × C n × V P B S E n c a p s u l a t e d   d r u g   a m o u n t
Where, D % : drug amount (%), C n : corrected concentration (mg/mL), V P B S : volume of PBS in the beaker (mL) and E n c a p s u l a t e d   d r u g   a m o u n t relates to the total theoretical amount of the drug to be released (mg).
Drug release data were fitted into zero-order, first-order, Higuchi and Korsmeyer–Peppas to determine the best fitting kinetic model. The prevalent mechanism of drug release from NLCs was also inferred from the value of the diffusional release exponent of the Korsmeyer–Peppas equation.

2.2.8. Storage Stability Studies

All the selected drug-loaded NLC dispersions were stored at 4 ± 1 °C for 6 months and analyzed every 30 days for mean particle size, PDI and zeta potential Zetasizer Nano-ZS. Samples were also checked for drug EE% at the end of the storage period, to evaluate the drug expulsion from NLCs. At least three replicate analyses were done for each sample. Possible crystallization, precipitation, mold formation or gelling phenomena were also checked by visual inspection.

3. Results and Discussion

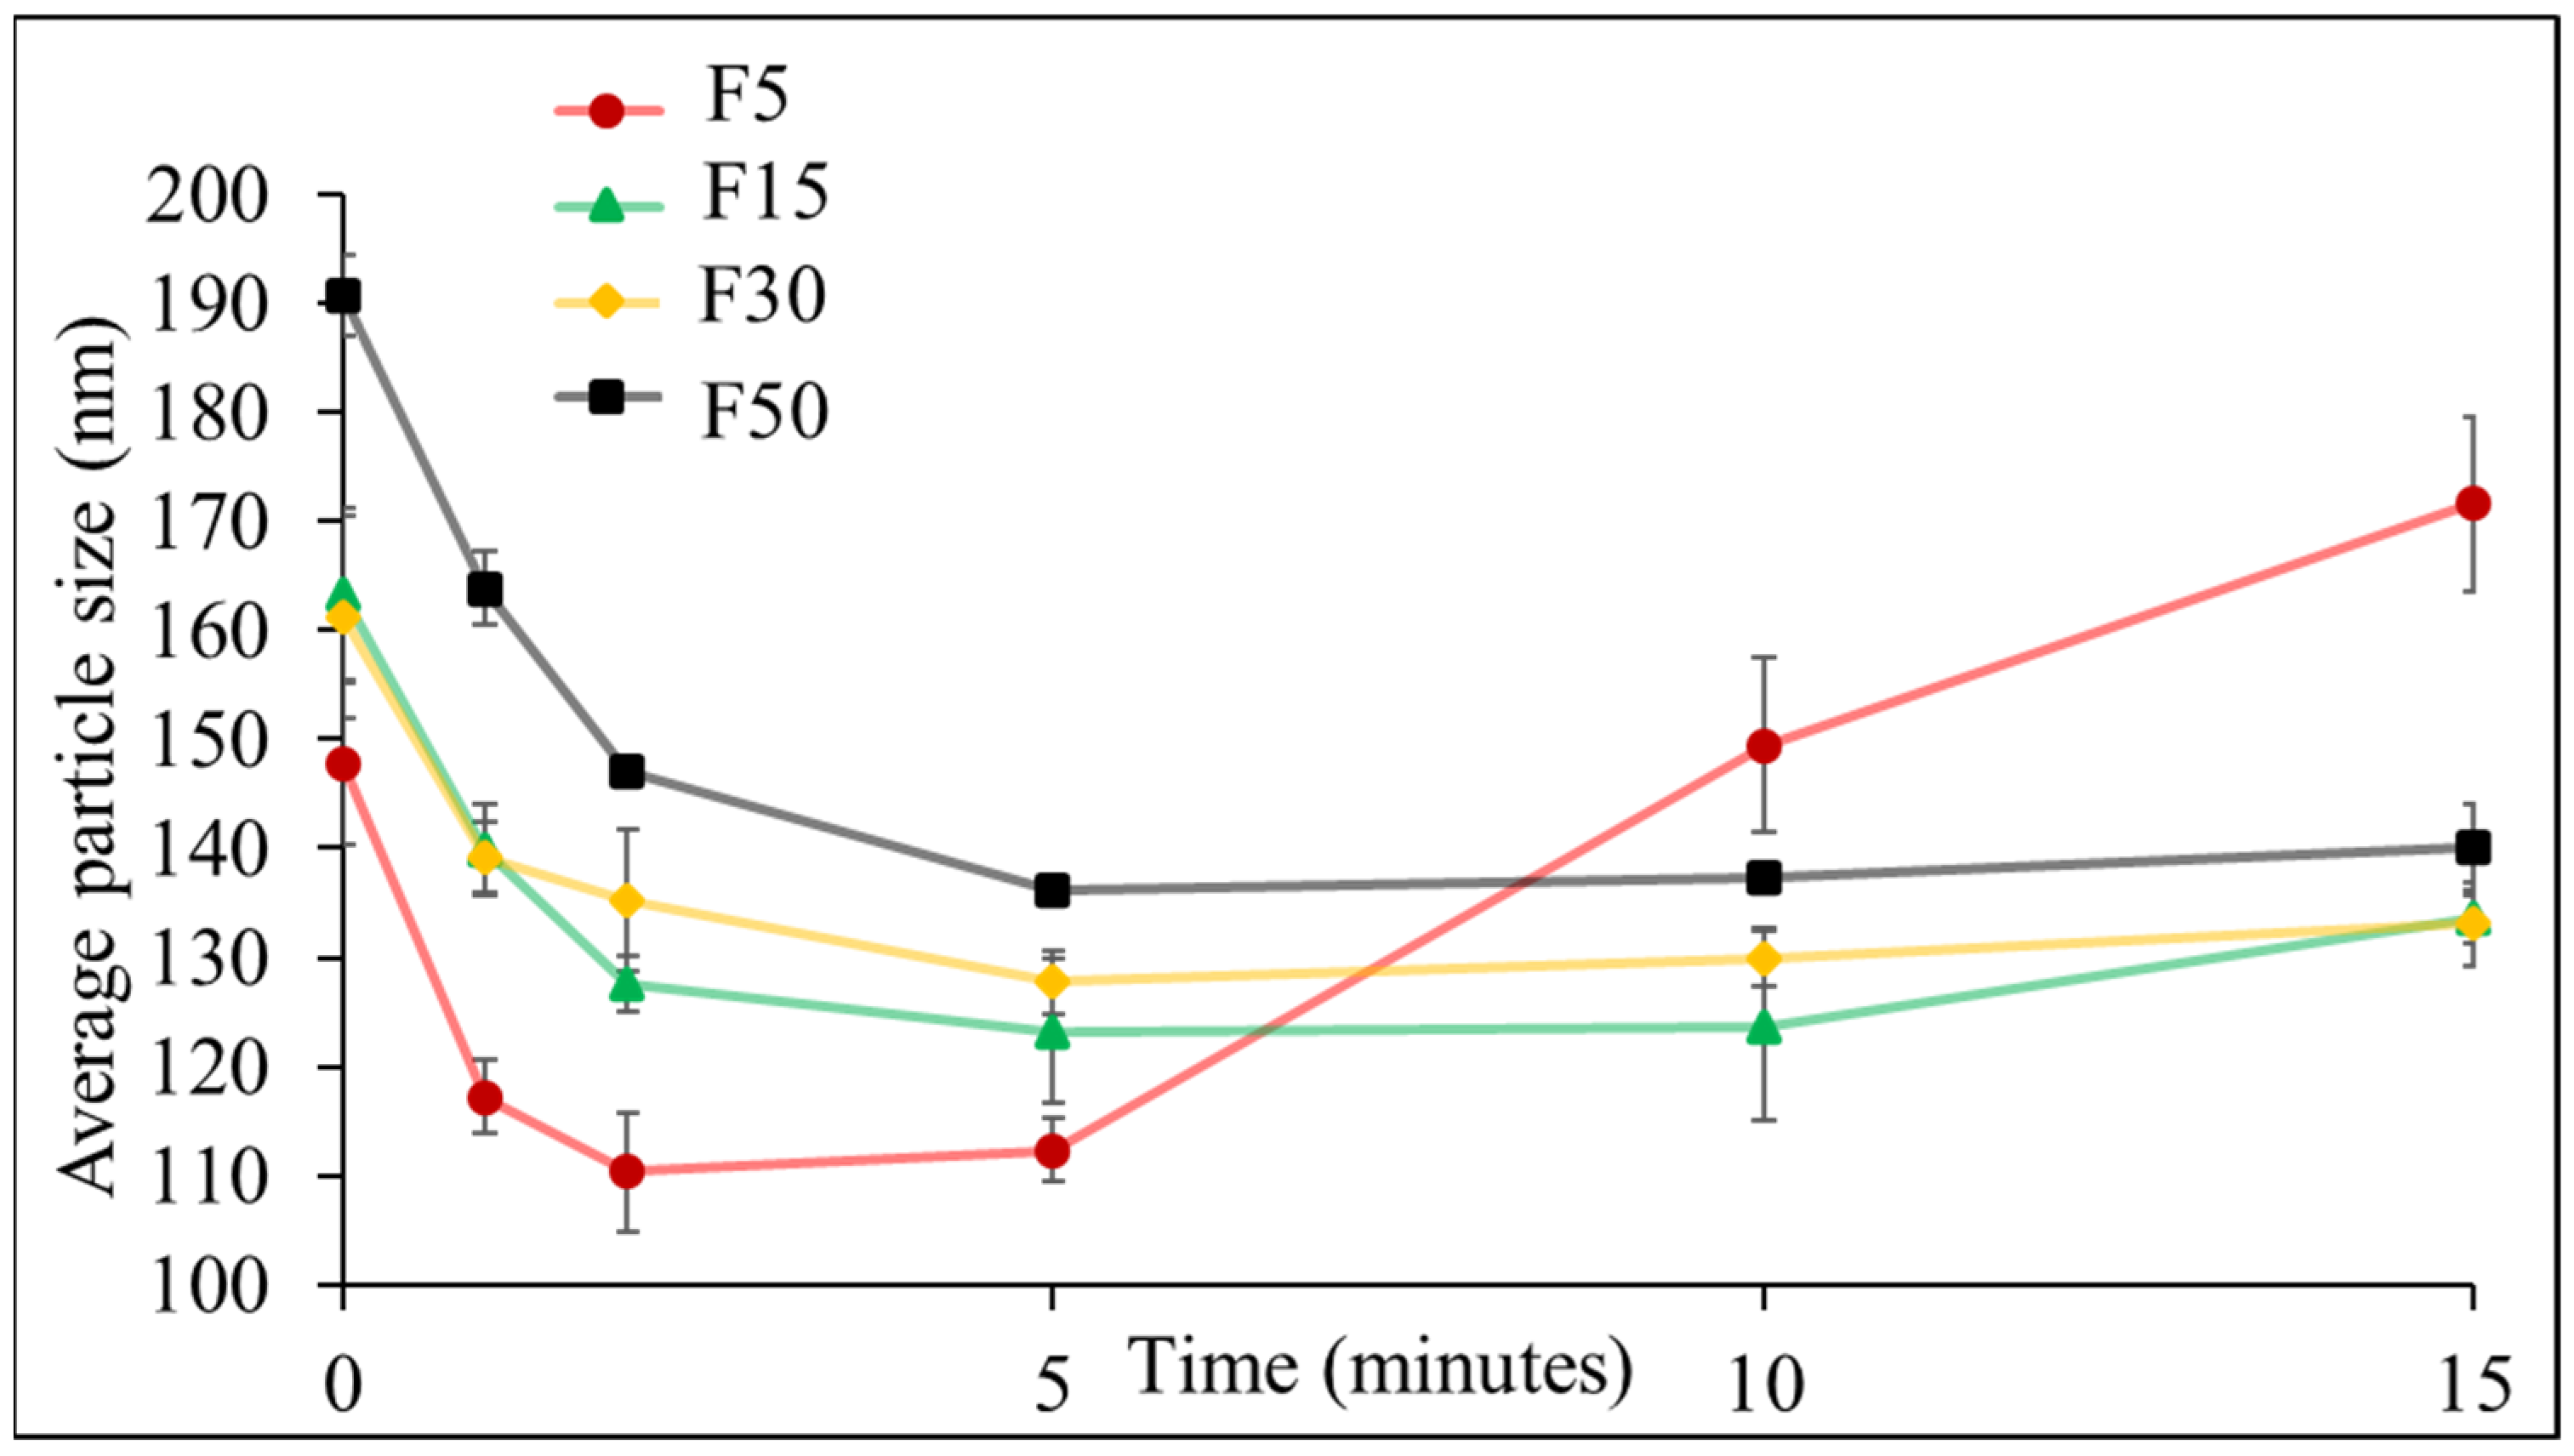
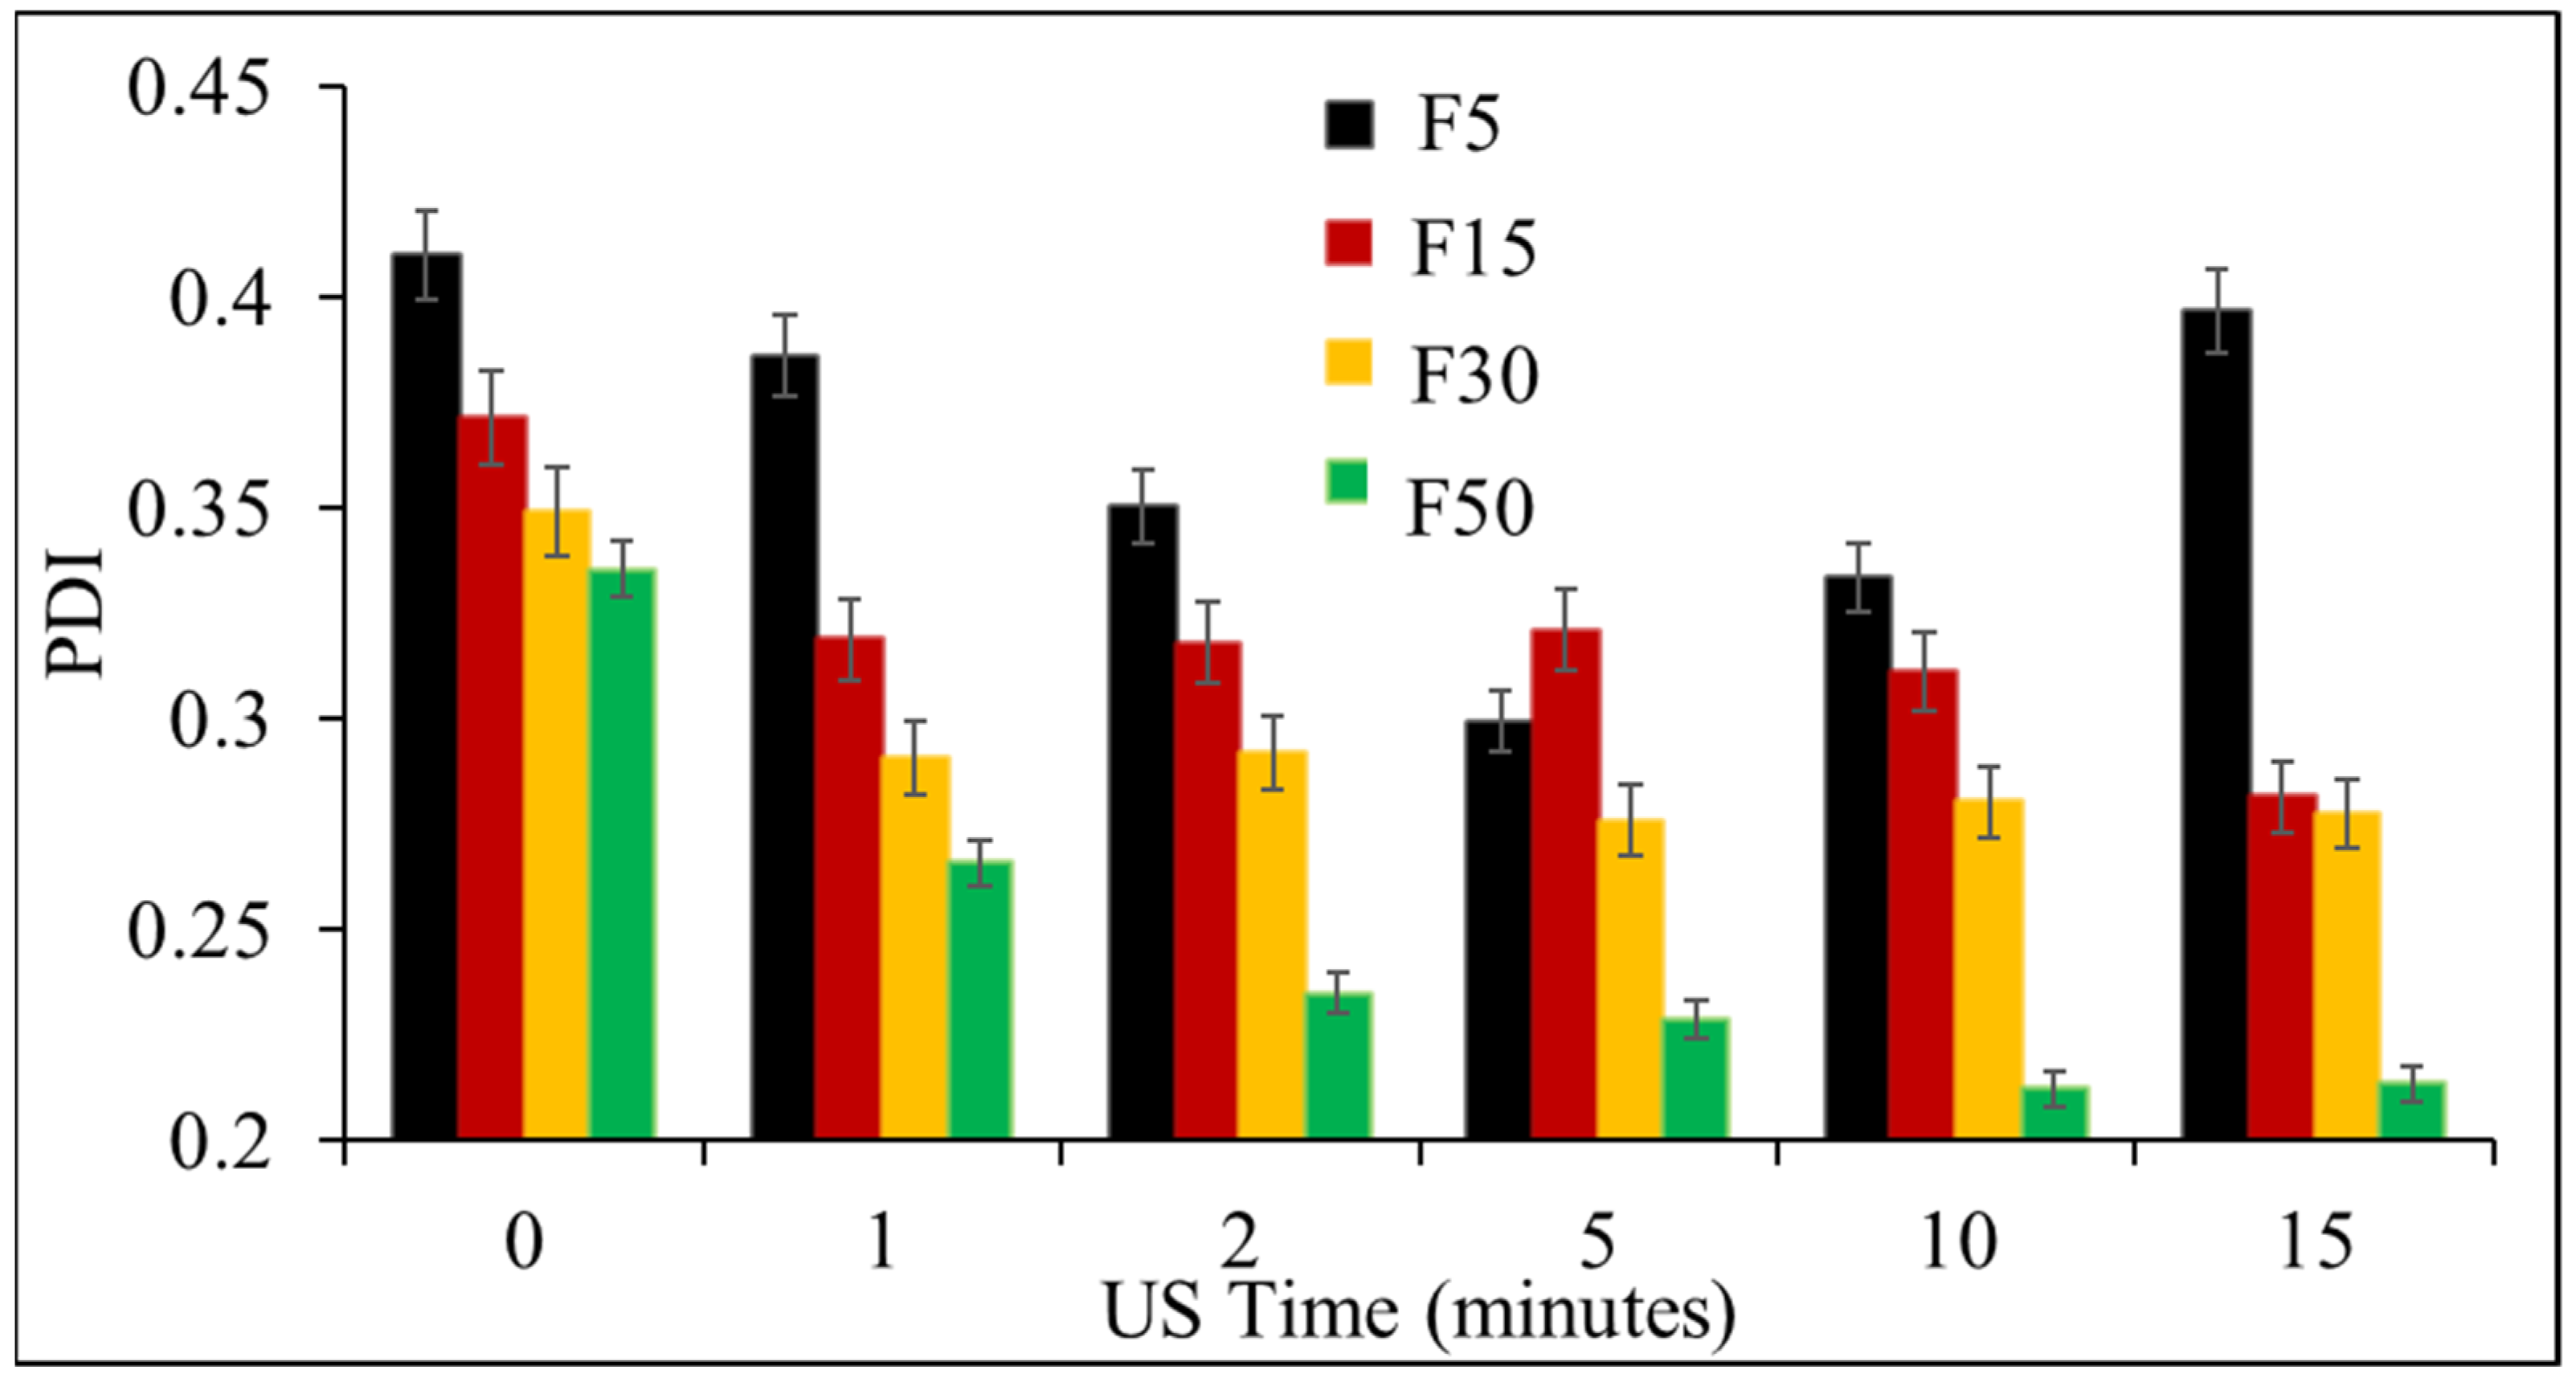
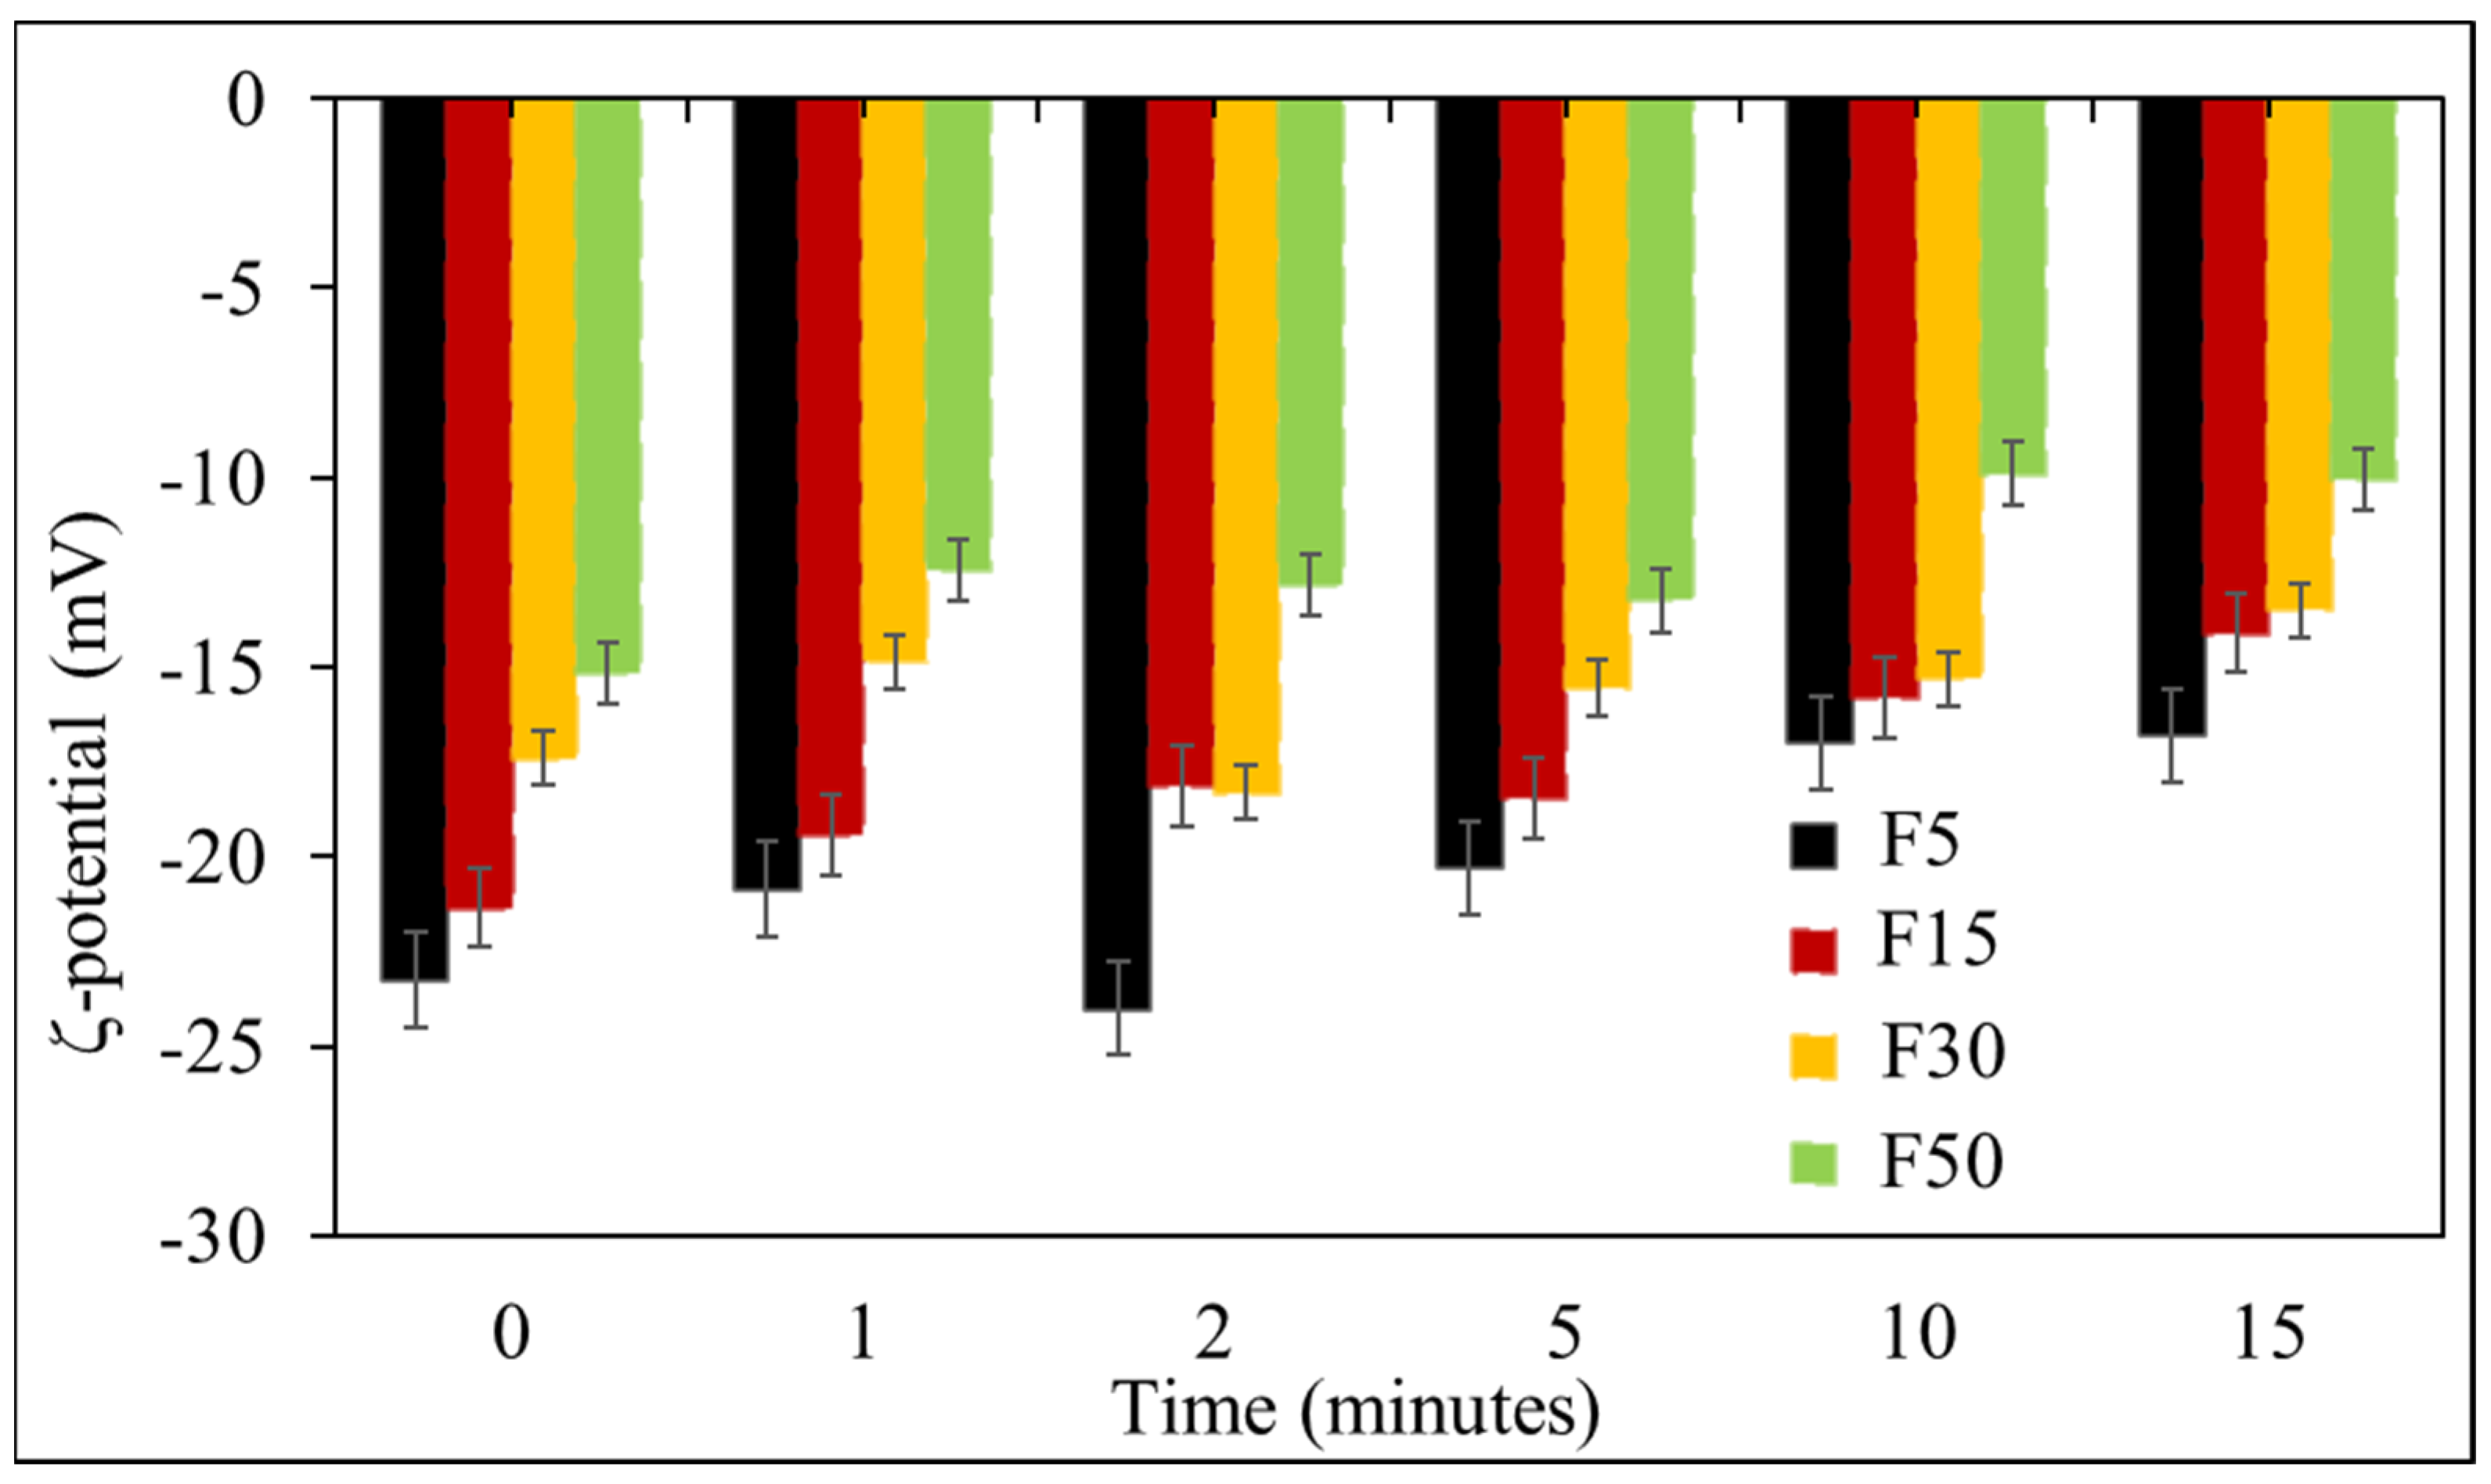
3.1. Effect of Ultrasonication on the Formulation of NLCs

The effect of US on average size, PDI and surface charge of prepared NLCs was investigated by varying US time between 0 to 15 min whilst keeping HSH time constant to 15 min. The Figure 3 presents the average particle sizes of the NLCs prepared with 5 to 50% Mig by the weight of C888 in the formulation (or F5 to F50).
It is evident from Figure 3 that HSH alone was not sufficient to reduce the particle size of NLCs, and there was a clear impact of US after homogenization. The particle size range (148–191 nm) obtained with HSH alone was lowered to 118–164 nm with just 1 min of US. The contribution of sonication energy to the NLC dispersions led to a breakdown of coarse emulsion drops into nanoemulsion droplets and, consequently, a decrease in particle size [28]. Generally, between 0 to 5 min of US, the particle sizes of prepared NLCs increased with the rise in Mig content in the formulation, where largest NLCs were observed with F50 and smallest with F5 formulations. The increase in size with rising liquid lipid content can be attributed to the swelling of nanoparticle core to accommodate higher quantities of Mig in the formulation [29,30]. There is also a possibility of forming more disordered crystalline structure within the particles at a higher Mig content, subsequently resulting in the production of larger sized particles [29,31]. After 5 min of US, an increase in particle size was observed for all formulations. This rise in size with increasing US time was particularly significant for F5 preparations, where the particle sizes ranged from 112 nm at 5 min to 172 nm at 15 min of US. It is well known that the energy supplied to the phases during emulsification and the processing time has a huge impact on the particle size and distribution of lipid particles [32]. In relation to the production of lipid carriers, some researchers have found that an increase in sonication energy input and processing time leads to lower particle sizes [33,34]. However, this is also dependent on the composition of the lipid formulation and the reverse can be obtained in some cases with the mean particle diameter rising with higher sonication time or energy [35]. This can be attributed to the coalescence of small particles into larger ones, which could not be separated or ruptured into smaller particles with further input of energy [32,35]. Hence, higher input of energy can be counterproductive especially when dealing with smaller particles as evident for the NLCs of F5 and F15 formulations as shown in the Figure 3. This study suggested that 5 min of US was sufficient to obtain smallest mean diameters of the NLCs containing C888 and Mig, and any further increase in processing time either led to the increase in particle sizes or had no further impact.
The PDI of prepared NLCs is presented in Figure 4.
Generally, all formulations showed mono-model distribution with small PDI (<0.41) which reduced further with the application of US in the NLC production. This decrease was clearly apparent for NLCs made with F50 formulations where PDI was lowered from 0.34 (without US) to 0.21 after 15 min of US. The US processing time had similar effect on PDI as the mean diameter (Figure 3) for F5, where an initial decrease was observed until 5 min and thereafter the PDI proceeded to increase with US time. This increase in PDI for particles containing small quantities of Mig (F5 formulations) once again suggests that higher energy input in the production of NLCs may not always be favorable, and hence it needs to be studied carefully for a set of lipids when developing these systems. Figure 5 presents ζ-potential values for the NLCs prepared by the combination of HSH and US.
The ζ-potential is a common measure of particle surface charge and the stability of a colloidal suspension. In general, higher ζ-potential values indicate a well-suspended colloidal system that is less likely to aggregate [36]. The negative ζ-potential values recorded for all formulated NLCs (−23 to −11 mV) was due to the presence of hydrophilic surfactants on the particle surface [37]. There was a slight decrease in ζ-potential with the change in particle size, which could be due to the difference in surfactant density on the particle/droplet surface [36,38].
A set of experiments using F30 formulations were conducted to understand if there was an impact of change in HSH time on the mean diameter and surface charge of prepared NLCs. Table 2 presents the results of NLCs formulated with varying HSH time with or without 5 min of US.
Interestingly, higher HSH time had no impact on the final particle size, PDI or ζ-potential and 5 min of both HSH and US appeared to be optimal to prepare these formulations. As observed from Table 2, at a constant US time of 5 min, there was no significant change in the particle size, PDI and surface charge of the prepared NLCs with the increase in HSH time. In general, the formulated lipid carriers had an average size and PDI of approximately 120 nm and 0.3, respectively. The low PDI value confirms that the NLCs are monodisperse and have narrow particle size distribution. Thus, it can be concluded that while HSH is important for the primary emulsification, the particle/droplet size reduction principally occurs after the application of US in the NLC formulation process.

3.2. Effect of Solid to Liquid Lipid Ratio on OLZ Encapsulation

The effect of drug encapsulation in NLCs prepared by varying liquid lipid (5, 10, 20, 30 and 50%) was studied by keeping OLZ amount (20 mg) constant in the formulations. Table 3 presents the comparison between blank, and drug loaded NLCs with respect to the mean diameter and PDI.
At a constant HSH and US processing time of 5 min each, there was a minimal effect of increasing liquid lipid content on the particle size and PDI of drug-loaded NLCs. The lack of significant change on the size of drug-loaded particles with increasing amount of liquid lipid has been previously reported by Teeranachaideekul et al. [39]. The sizes ranged from 114 to 125 nm with a low PDI (0.33 to 0.40) indicating that formulated NLCs are mono-disperse and have a narrow particle size distribution. The higher standard deviation for the mean particle size of F30 and F50 OLZ-loaded formulations can be associated with the higher liquid lipid content in these systems [40]. In comparison, the recorded PDI and particle size values for drug loaded NLCs were similar to those for blank NLCs. This can be due to the solubility of OLZ in the lipid phase, where drugs may be accommodated within the disordered crystalline lipid structure, resulting in no change into the NLC’s original morphology [39,40,41]. Table 4 presents the surface charge data recorded for OLZ-loaded NLCs prepared with varying Mig content at a constant HSH and US time of 15 and 5 min, respectively.
Similar to particle size and PDI (Table 3), there was a minimal effect of increasing Mig amount on the ζ-potential of drug-loaded NLCs. The high negative ζ-potential values recorded for the drug-loaded NLCs indicate that these colloidal suspensions are stable and less likely to aggregate [36]. Interestingly, the ζ-potential data recorded for drug-loaded preparations were noticeably higher than those for blank NLCs, which could be attributed to the presence of OLZ on the surface of the particles. The change in ζ-potential values after drug encapsulation in NLCs is common and has been reported previously [41,42,43].

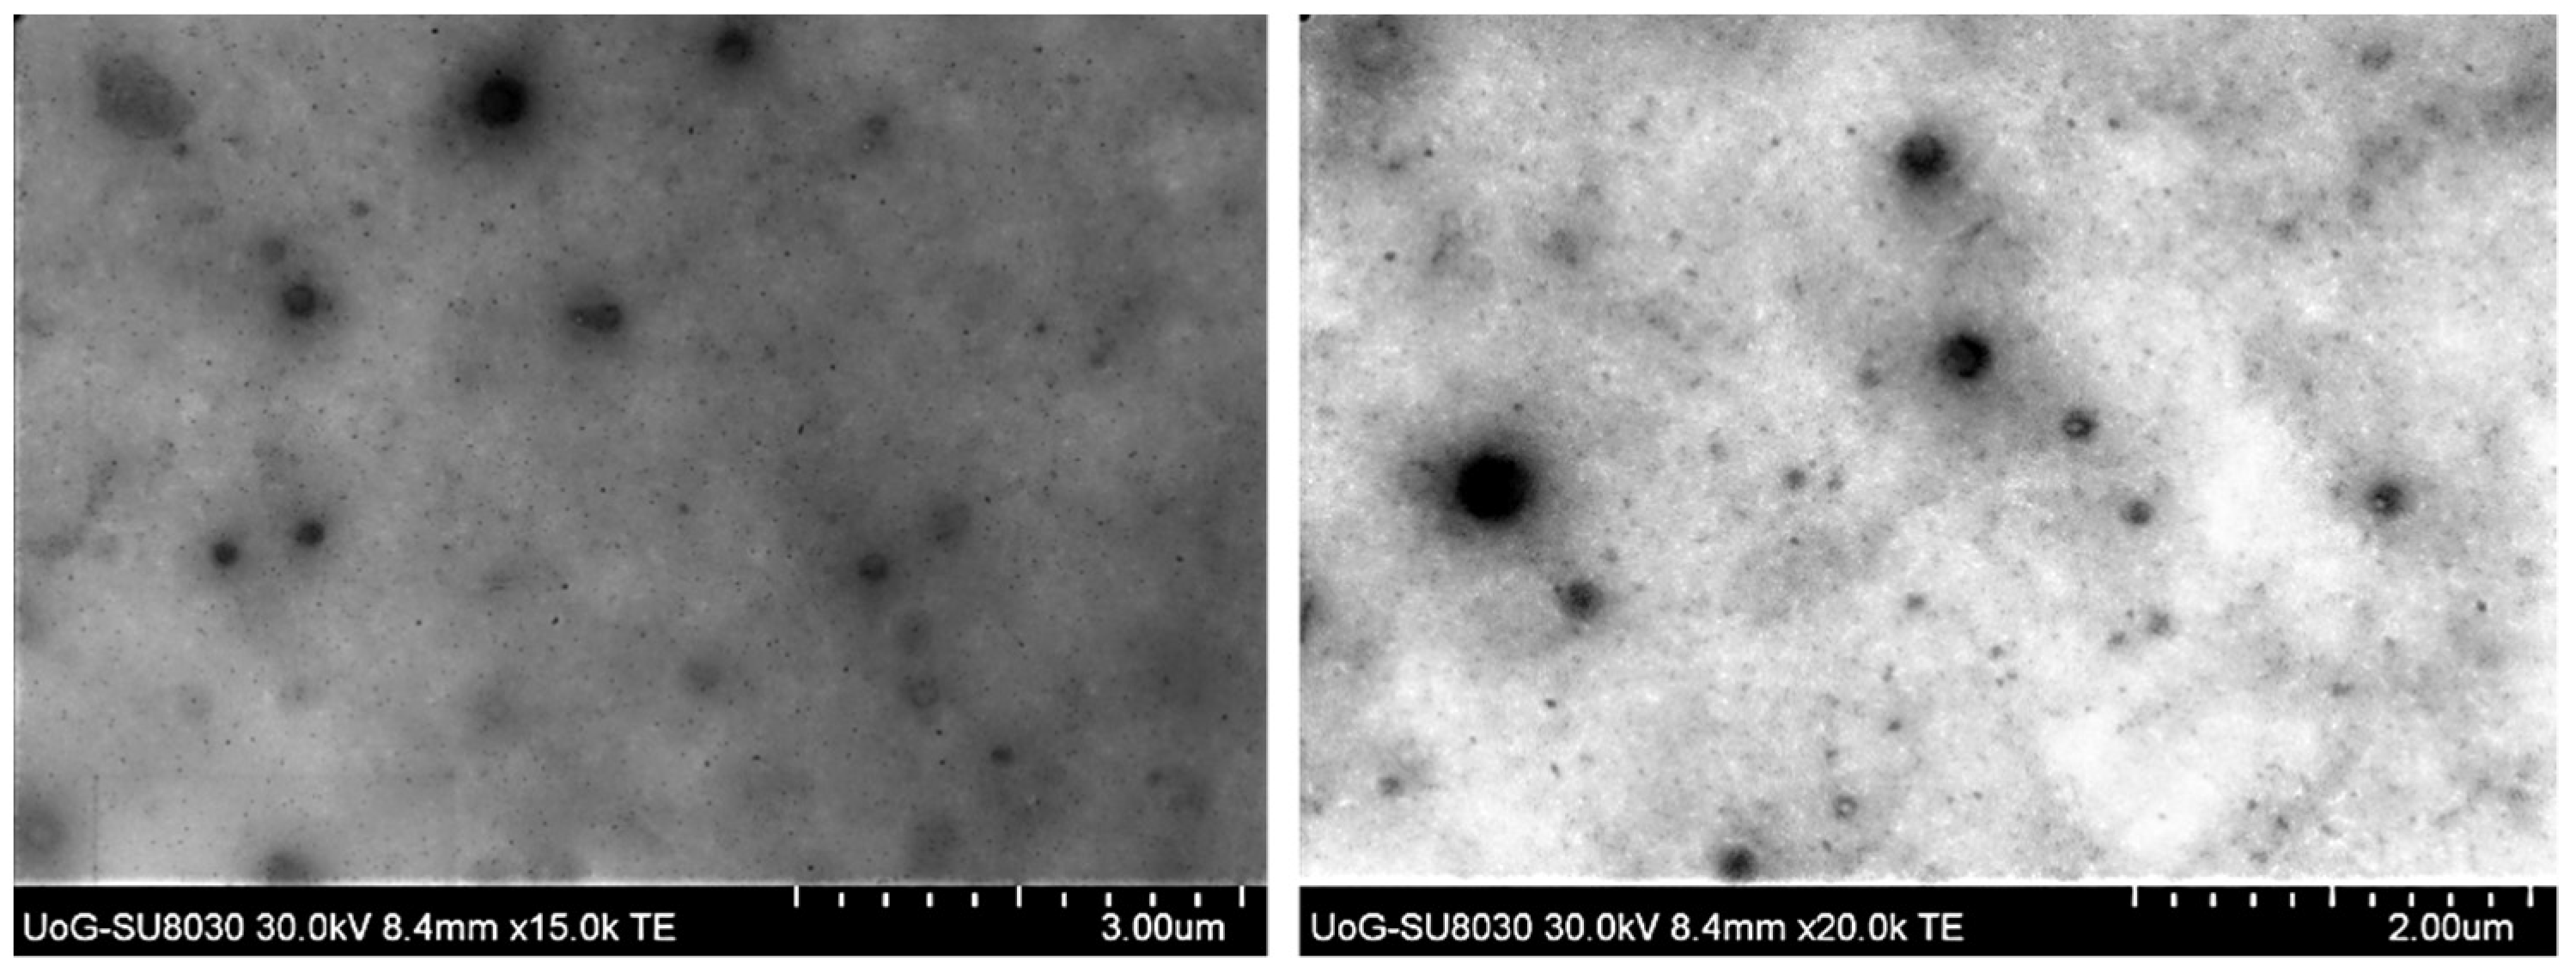
3.3. BF-STEM Analysis and Encapsulation Efficiency

The surface morphology of drug-loaded NLCs was investigated by BF-STEM and is presented in Figure 6.
The BF-STEM micrograph (Figure 6) showed that the prepared drug-loaded NLCs were spherical with a smooth surface. The particle size indicated by BF-STEM imaging was also similar to the data recorded by DLS for the formulated drug-loaded NLCs. The encapsulation efficiency (EE) of OLZ increased with the increase in Mig content in the formulation. The EE ranged from 33–60% for all formulations with F5 with the lowest and F50 with the highest. The EE obtained was 33, 36, 41 and 60% for F5, F15, F30 and F50, respectively. The higher encapsulation efficiency with increased Mig content in the formulation could be due to the lipophilic nature of OLZ. Although compritol itself is a long chain fatty acid that can facilitate the entrapment of OLZ in NLC, clearly an increase in Mig has substantial impact on resulting encapsulation in these formulations [44].

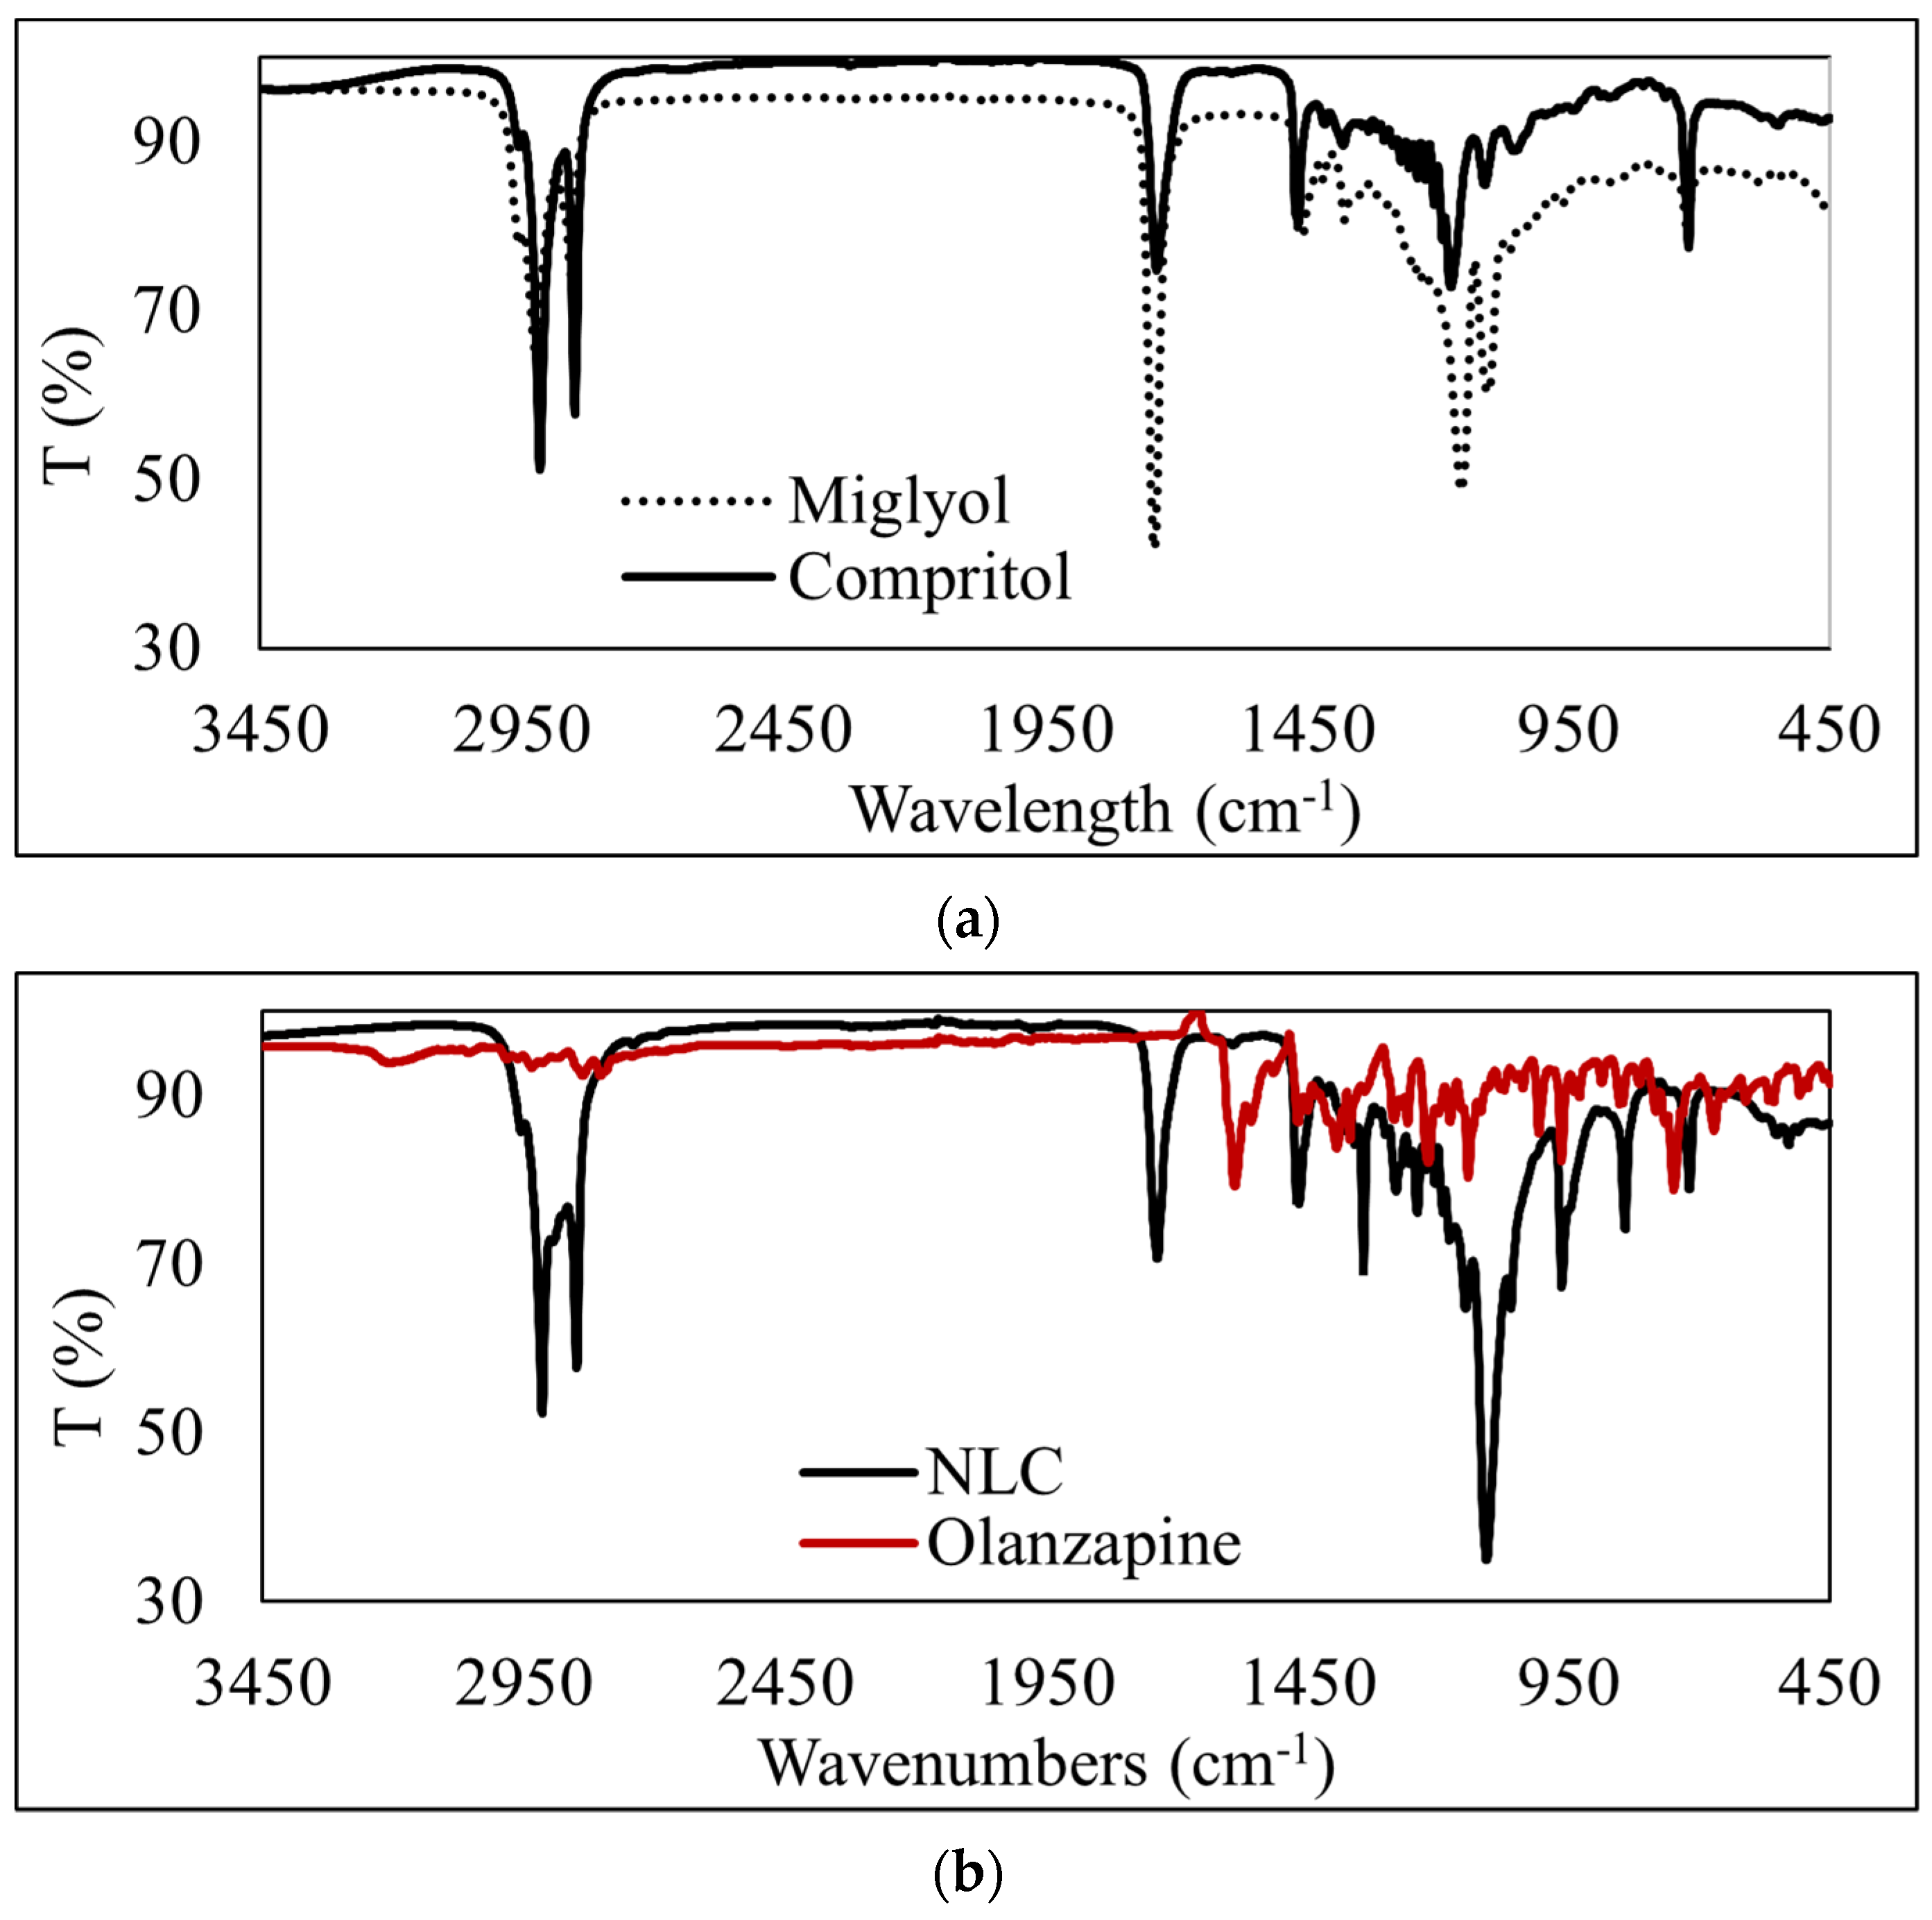
3.4. ATR-FTIR Analysis of OLZ-Loaded NLCs

The structural features of drug-loaded NLCs were studied by performing ATR-FTIR analysis, and the ATR-FTIR spectra for C888, Mig and OLZ were also collected to allow for a comparative analysis. As a result of the similarity in their structural composition, both the solid and liquid lipid do not show many differences in their ATR-FTIR spectra. For Mig and C888 (Figure 7a), major and common peaks were observed at 2915 and 2849 cm−1 due to symmetric and asymmetric aliphatic CH2 vibrations, and at 1742 cm−1 as a result of the presence of carboxylic groups [45,46].
The ATR-FTIR spectra for unprocessed OLZ and drug-loaded NLCs are presented in Figure 7b.
In relation to the spectrum obtained for the pure drug, a number of its characteristic peaks were observed at 1589 cm−1 (C–N stretching), 1143 cm−1 (aromatic ring stretching), 964 cm−1 (C–S stretching) and at 749 cm−1 (C–H bond out of plane deformation) [34,35]. Meanwhile, the ATR-FTIR spectrum collected for drug-loaded NLCs mostly showed the characteristic peaks of C888 and Mig, therefore indicating the presence of both lipids in the formulated NLCs. However, distinct peaks at 963 and 842 cm−1 can also be observed in the spectrum for the drug-loaded NLCs. Both peaks are not noticeable in the spectra for C888 and Mig, and also they overlap with the noted band peaks in the spectrum for unprocessed OLZ. This occurrence can signify the presence of OLZ in the drug-loaded systems.

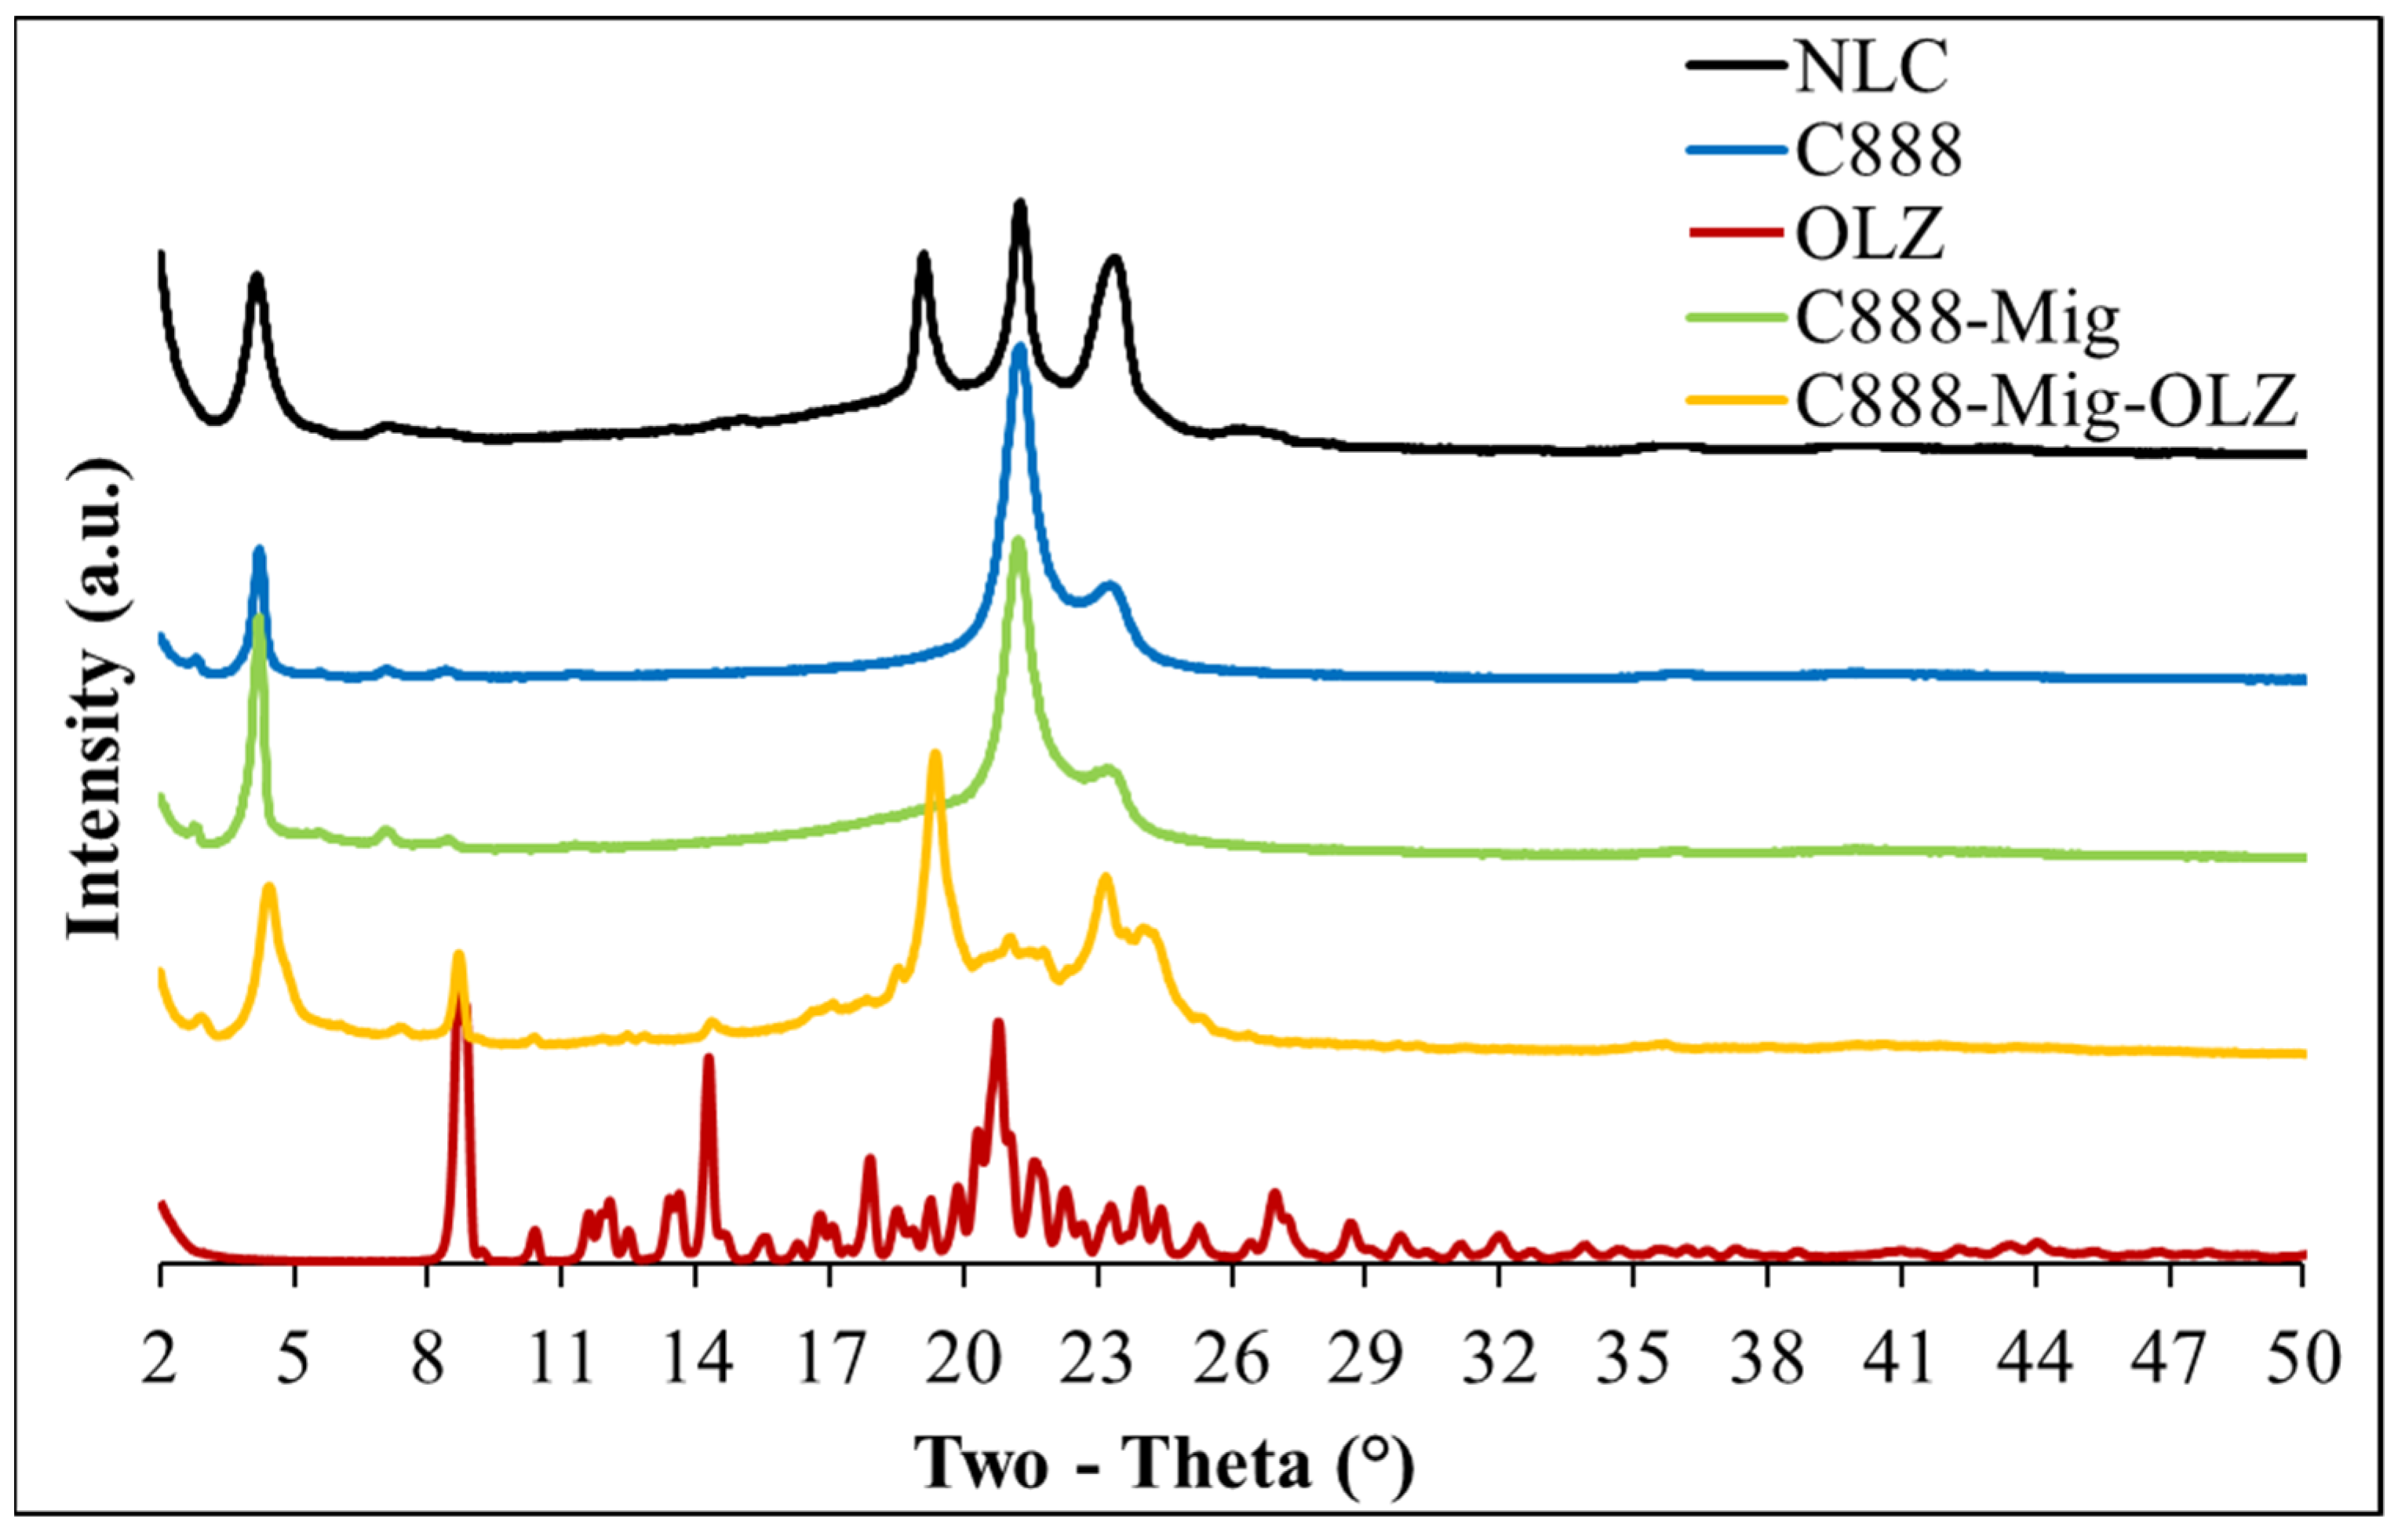
3.5. XRD Analysis of OLZ-Loaded NLCs

The XRD analysis was performed to investigate possible changes in the crystalline structure of OLZ during the formulation of NLCs. The X-ray diffraction patterns of the unprocessed drug, C888, physical mixtures of the lipids/lipids-drug and OLZ-loaded NLCs are presented in Figure 8.
The XRD pattern for C888 and C888-Mig mixtures shows two peaks between 19.6 and 24.4° 2θ corresponding to the β′ modifications typical of triacylglycerol [47]. The major diffraction peaks of OLZ appeared in the 2θ range of 8.8 to 30°, therefore signifying the crystalline nature of the unprocessed drug [48,49,50]. The diffractogram of the C888-Mig-OLZ physical mixture showed peaks at 8.8, 14, 20.8 and 24.1 2θ, values corresponding to the crystalline OLZ in the mixture, however their intensity was reduced due to the high excipients-drug ratio [50]. The diffraction pattern of OLZ-loaded NLCs did not have any peaks corresponding to OLZ. The peaks at 4.2, 19.1, 21.2 and 23.3° were related to lipids in the formulation. This may indicate that the OLZ present in drug-loaded NLCs is in amorphous form.

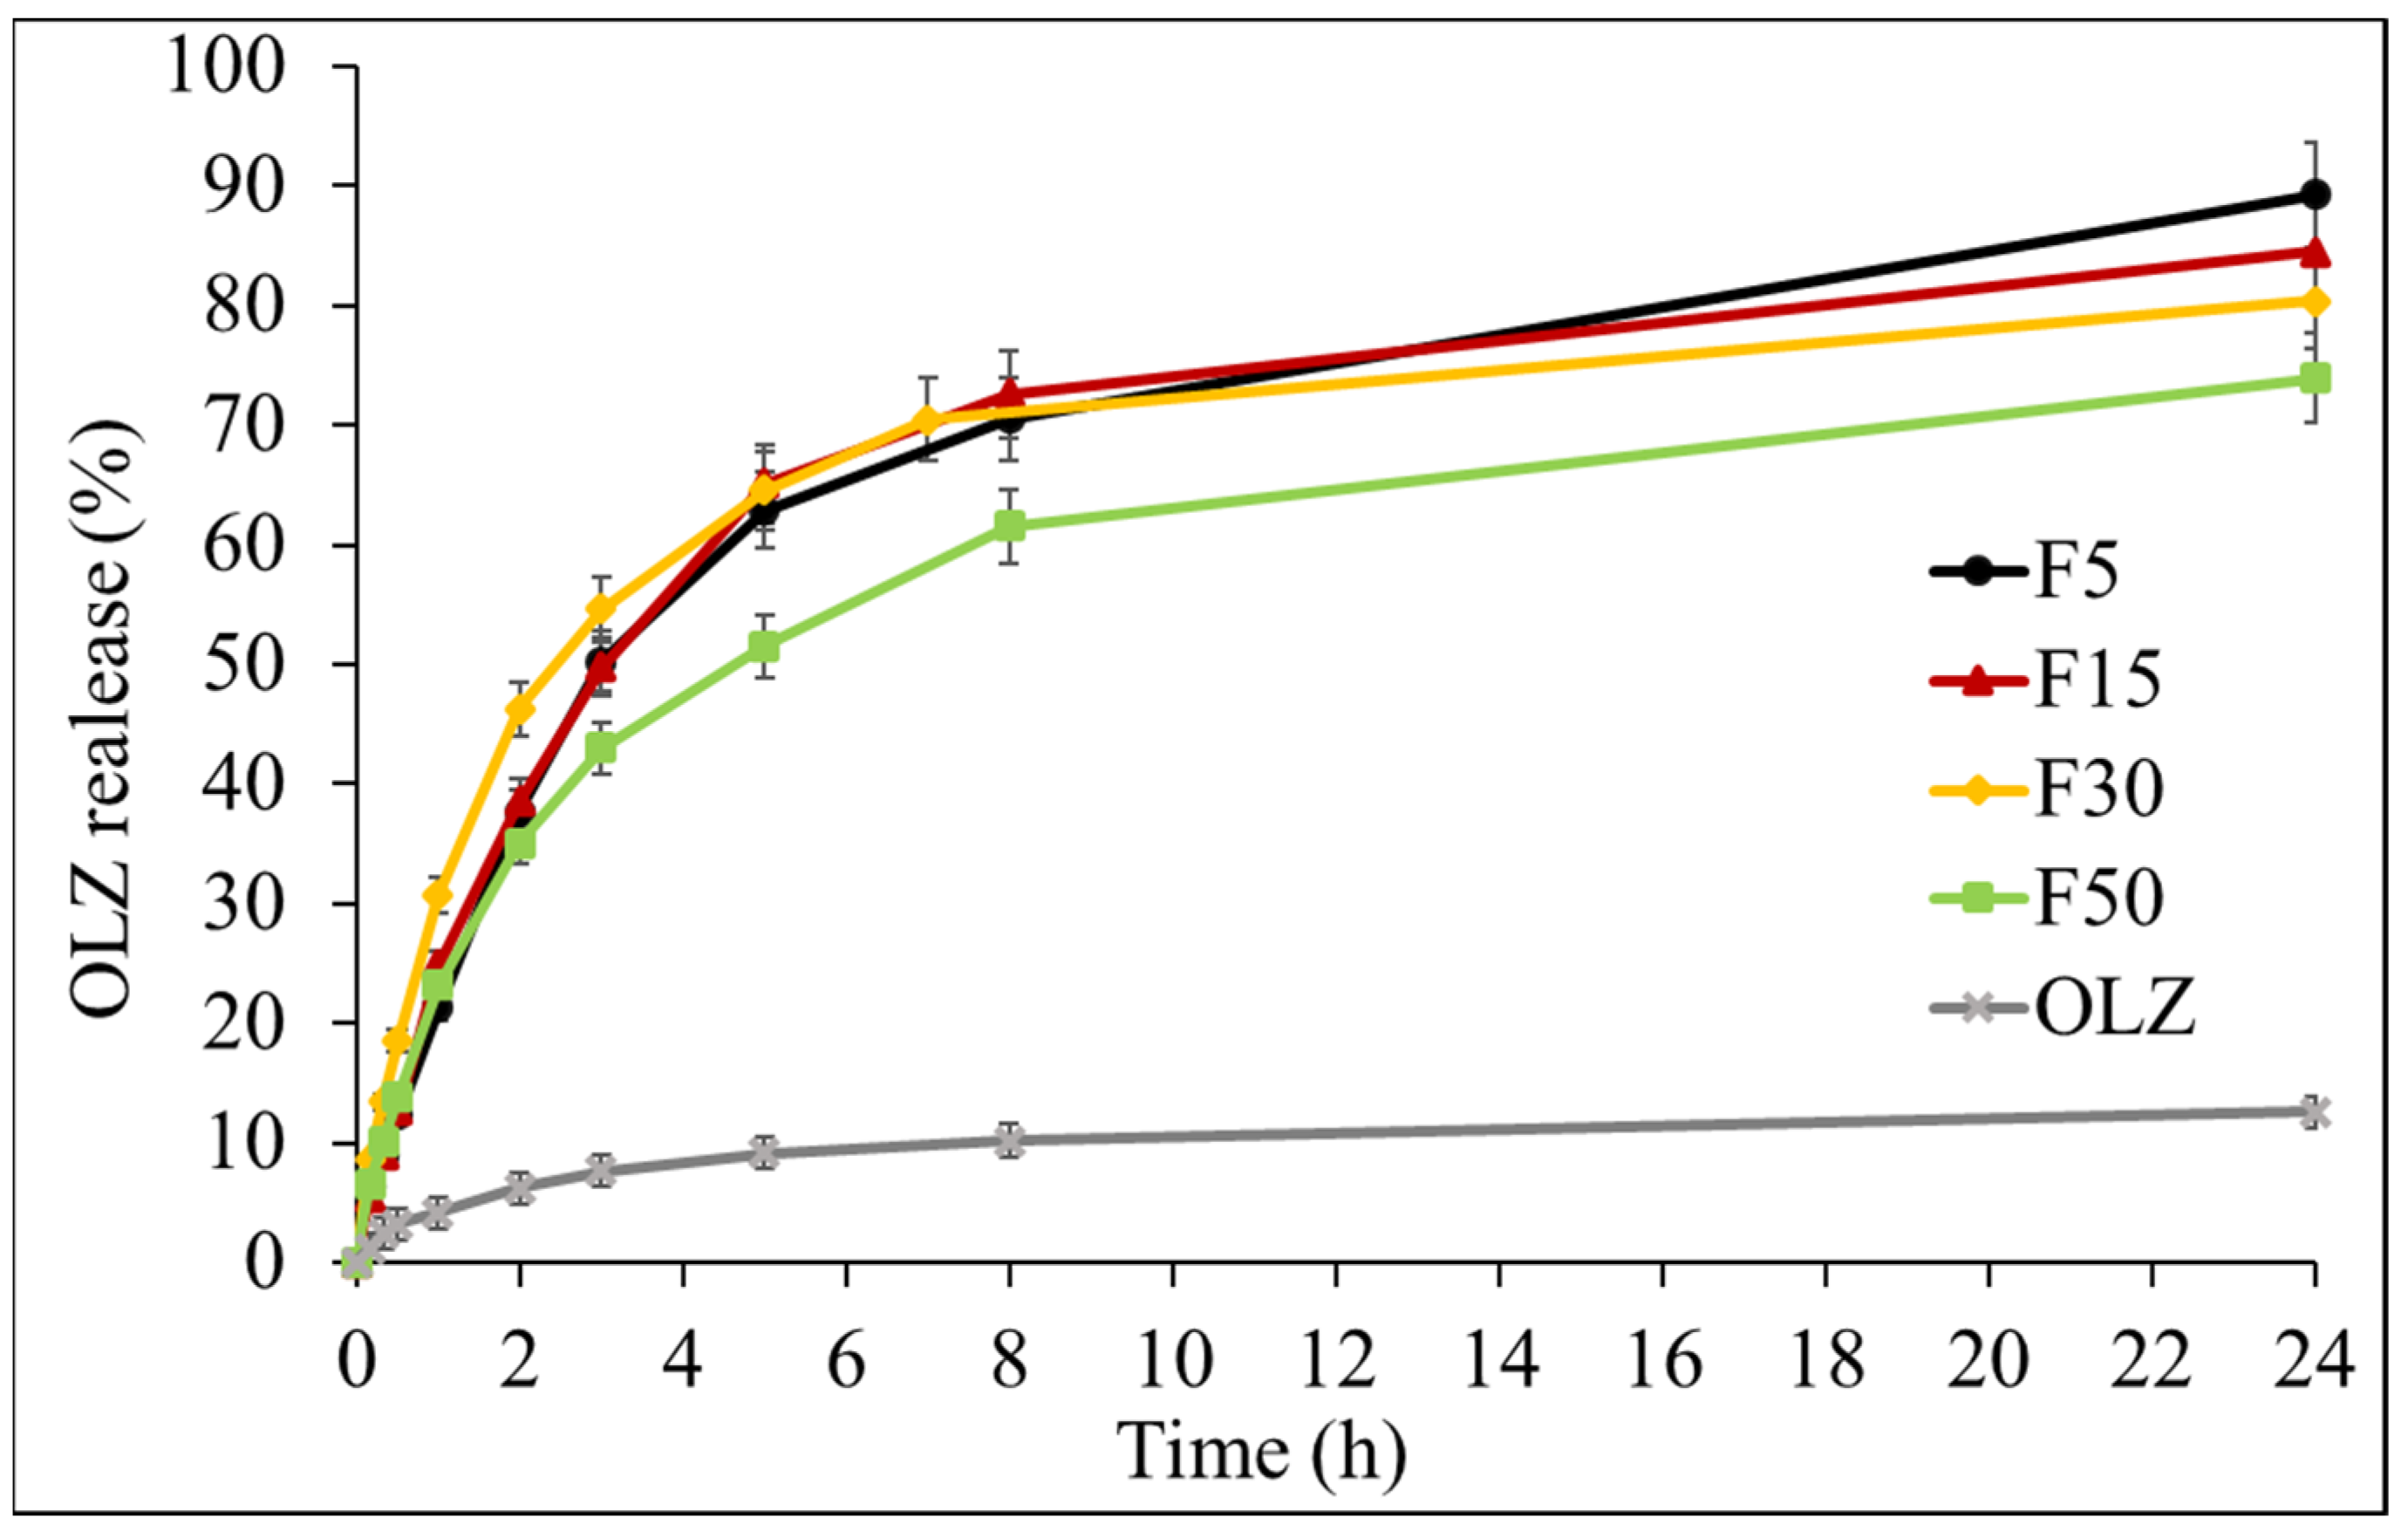
3.6. Drug Release Studies

The amount of OLZ released from drug-loaded NLCs was studied in PBS at pH 7.4 using the dialysis tubing method. The dialysis tubing is usually a reliable method to measure drug release as it is supposed to permit only the exit of the drug and block any loss of the enclosed particles [36]. The drug release kinetics for OLZ-loaded formulations prepared with increasing liquid lipid ratio are presented in Figure 9.
OLZ is a BCS class II drug, and its solubility decreases with the increase in pH. The dissolution rate and solubility obtained for OLZ form NLCs was higher than the drug alone. In general, there was a steady and continuous release of OLZ between 0 to 8 h from all formulations. At 8 h, the amount of drug released from F5, F15, F30 and F50 drug-loaded formulations were at 71, 73, 70 and 62%, respectively. An impact of the ratio of liquid lipid was also observed, where increase in Mig in the formulations led to slower and lower drug release, particularly evident for formulation F50 (50% Mig). The highest drug release of 89% was achieved with F5 after 24 h. The OLZ release reduced from 89% from F5 to 74% for F50 NLCs at the end of the experiment. This difference can be attributed to the variations in the particle size of these formulations that resulted in the changes in specific surface area required for diffusion of OLZ from lipid core into the release media [51,52]. Additionally, it is possible that OLZ remains solubilized for longer in formulations containing high ratios of liquid lipid and preferably stays in the matrix for extended periods before being released into the media due to its hydrophobic nature. Therefore, the kinetic data suggests that the NLCs are not only capable of increasing the drug dissolution rate but their liquid lipid content can also influence the release of incorporated drug. The drug release in this work was studied only in pH 7.4 PBS, which provides a general overview of the release behavior along with the impact of the ratio between solid and liquid lipids as well as the drug content in the formulation. However, it will be appropriate to conduct further studies in simulated gastric and intestinal fluids to understand the influence of variable gastrointestinal conditions on the release of olanzapine from NLCs.
Kinetic evaluation of drug release profiles from different NLCs was also performed to understand the mechanisms governing the drug release. The release data were fitted into zero order, first order, Higuchi and Korsmeyer–Peppas models. The calculated correlation coefficients (R2) and release exponent (n) values are presented in Table 5.
The best fit for the drug release data from NLCs was obtained for Korsmeyer–Peppas kinetic model with R2 values ranging from 0.9624 to 0.9861. The value of the diffusional release exponent (n) of the Korsmeyer–Peppas equation was calculated from Equation (3):
F t = k × t n
Where, F t is the drug fraction released at time t , k the release constant and, n the diffusional exponent relates to the mechanism of drug release. n < 0.5 indicates Fickian diffusion; 0.5 < n < 0.9, non-Fickian transport (anomalous transport); and n > 0.9, type-II transport. The n values for all four formulations were less than 0.5, suggesting a predominantly diffusion-controlled mechanism of drug release from formulated NLCs.

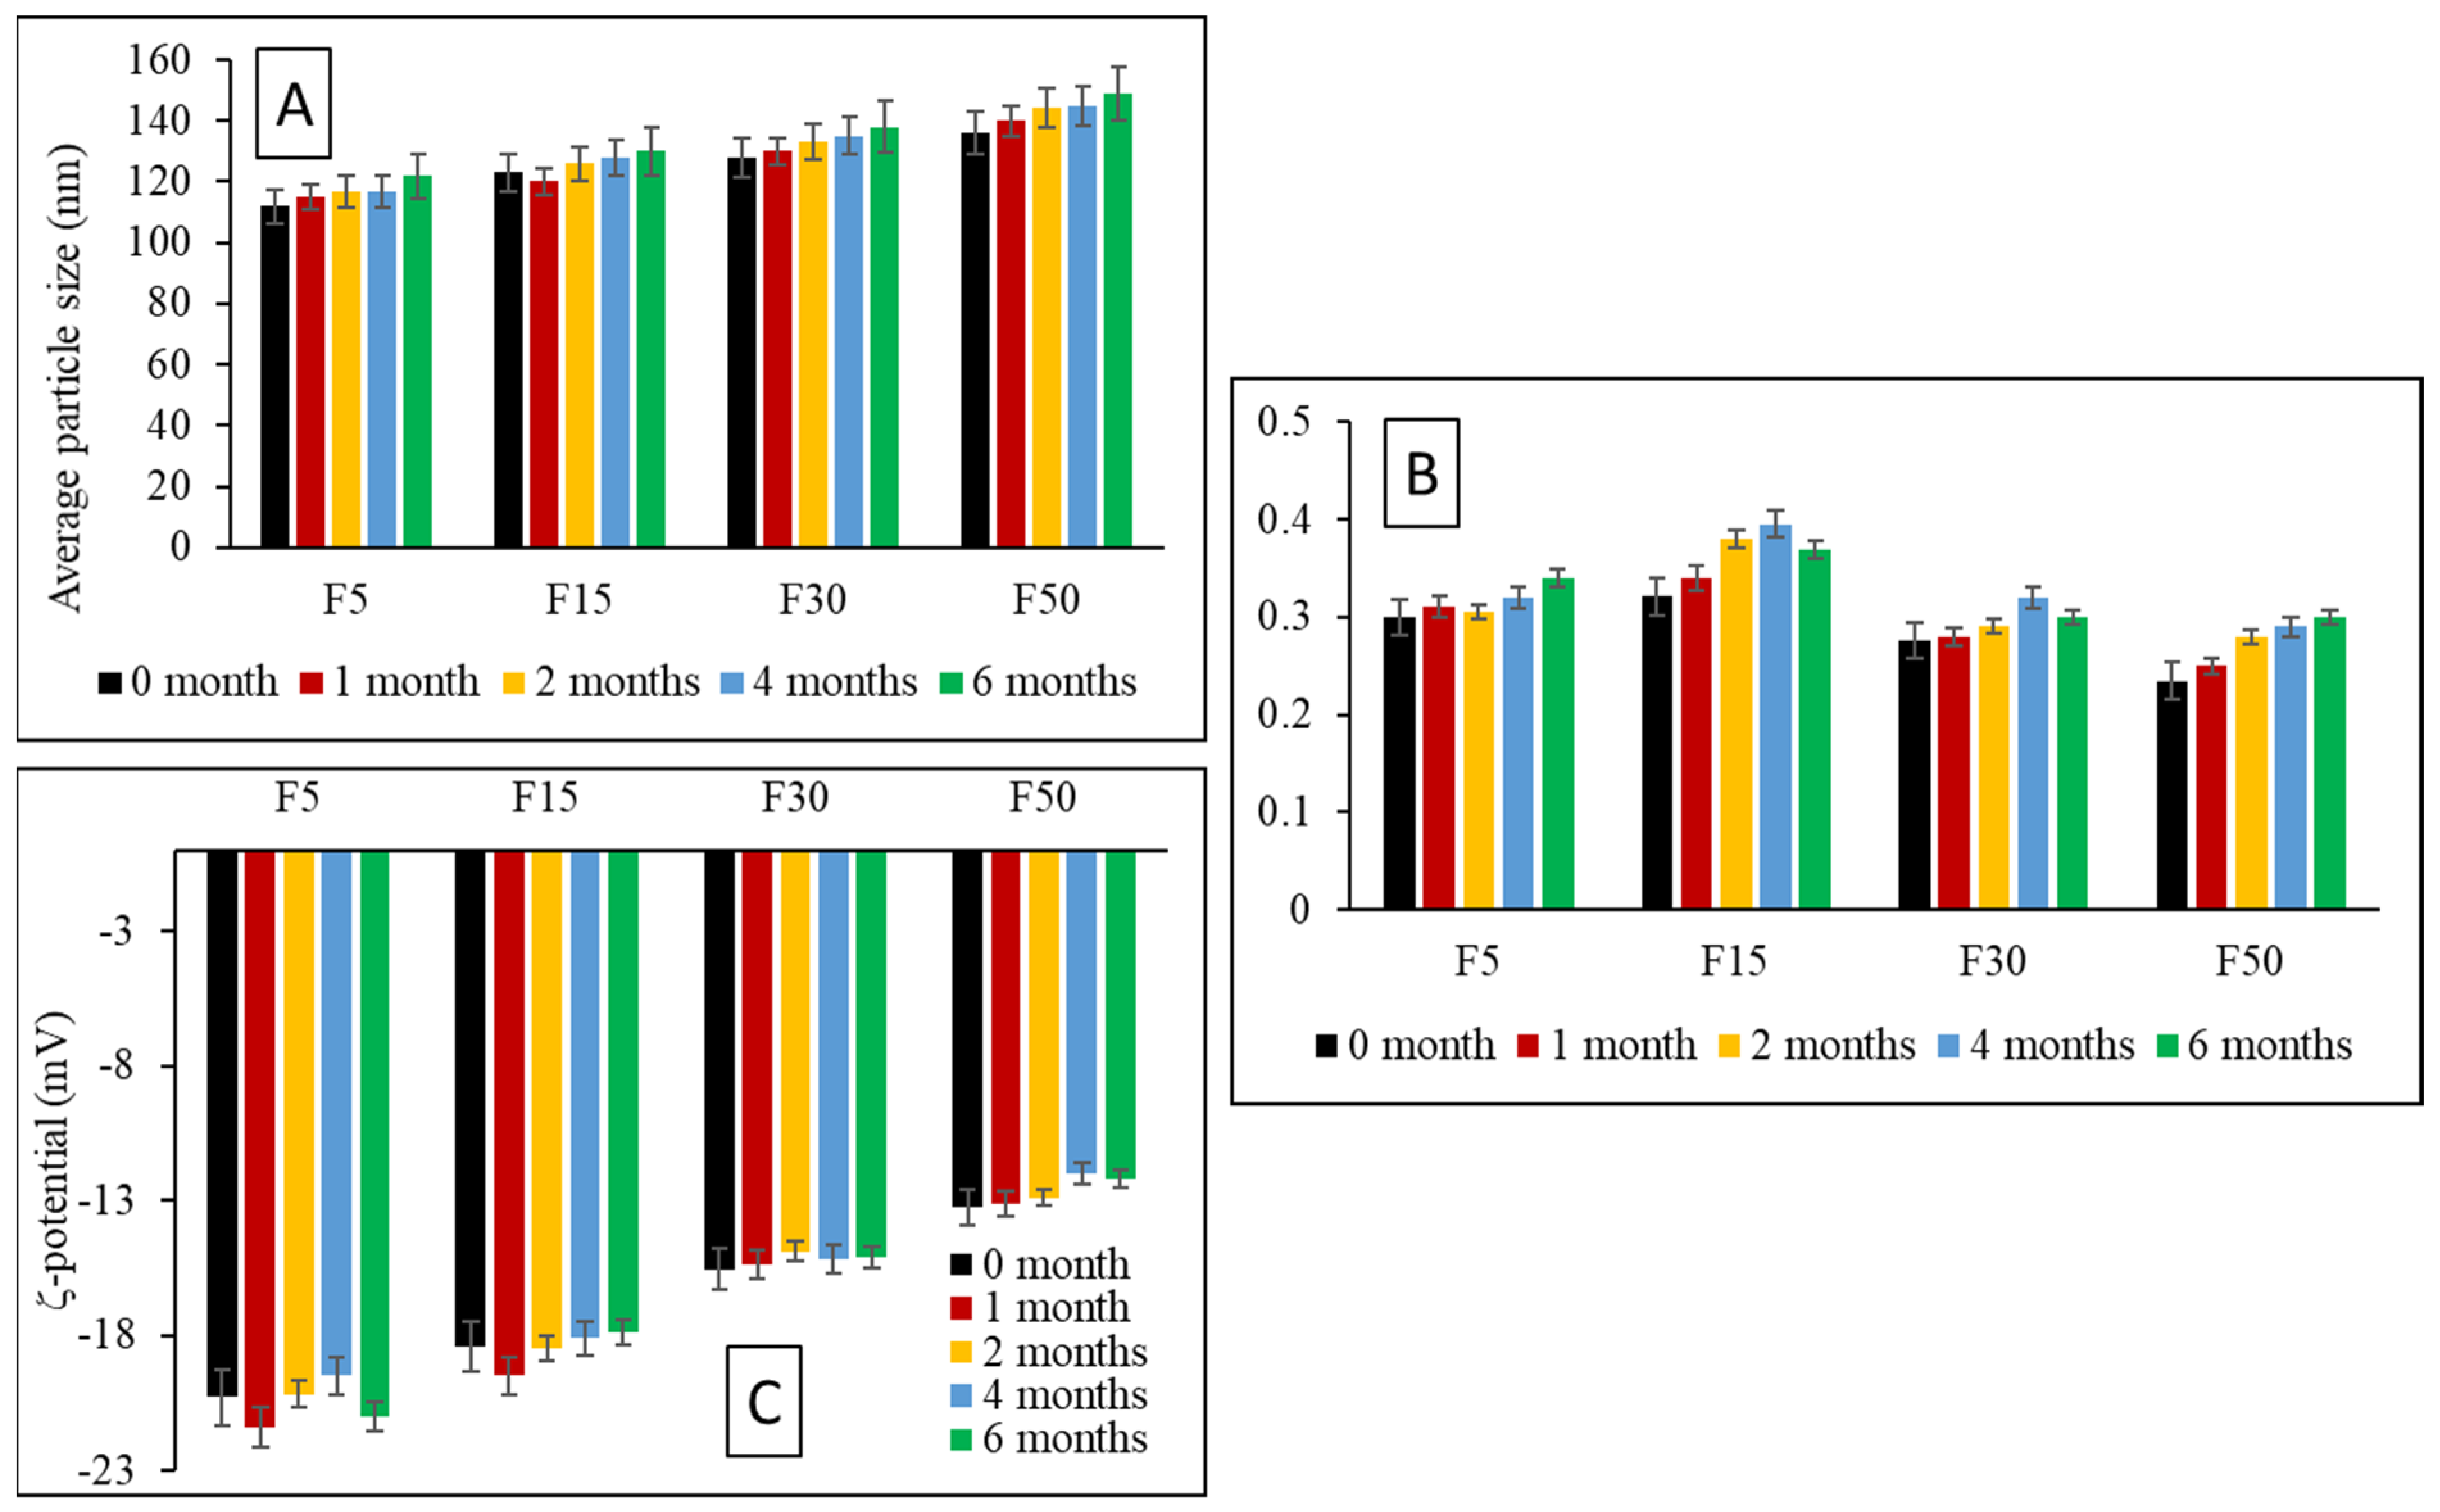
3.7. Storage Stability Studies

The storage stability of OLZ loaded NLCs was monitored at 4 °C for 6 months. The analysis included basic visual inspection and the determination of physicochemical properties of the colloidal dispersions. Visual inspection did not show any drug precipitation, crystallization or mold formation at specified storage condition. The mean particle size and surface charge of the nanoparticles is presented in Figure 10.
In all cases, no significant changes in the values of average particle sizes, PDI and surface charge were detected during the six-month storage period when compared to the freshly prepared NLCs. Hence, these results were considered suggestive of the good physical stability of all four NLCs dispersions prepared in this study.

4. Conclusions

Spherically shaped and monodispersed NLCs were successfully prepared with C888 (solid lipid) and Mig (liquid lipid) using combination of HSH and US techniques, where processing time and its impact on the properties of NLCs were also investigated. Varying the US processing time between 1 to 15 min allowed the design of particles with different size, PDI and surface charge. The particle size obtained after HSH alone was found to be 148–191 nm depending on the ratio between solid and liquid lipids, that decreased to 118–164 nm after just 1 min of US. There was also an increase in mean diameter with higher liquid lipid content in the NLC. For example, NLCs containing 5% liquid lipid resulted in particles with 118 nm in comparison to 191 nm for formulations containing 50% of Mig. The influence of increasing liquid lipid ratio on the particle size was not considerable when US processing time was extended after HSH. There was a minimal effect of longer HSH time on the properties of NLCs as 15 min of HSH did not result in the further reduction of particle size. On the other hand, US of 5 min was sufficient to reduce the particle size in all cases, further energy input beyond 5 min resulted in the coalescence of smaller particles that was particularly evident for the NLCs with lower Mig ratios.
OLZ was successfully encapsulated by the lipid systems, with little or no effect of increasing Mig ratio on the particle size and PDI of drug-loaded NLCs. An increase in ζ-potential values was observed for OLZ loaded NLCs that indicated incorporation of the drug in the formulation. This may also suggest presence of drug on the particle surface, but lack of diffraction peaks related to OLZ in XRD spectrum suggested otherwise. A steady and continuous release of drug from the OLZ-loaded lipid systems was recorded in PBS at pH 7.4 in 24 h, with a maximum drug release of 89% achieved in formulations prepared with 5% liquid lipid in the formulation that was approximately nine-fold higher than the drug alone. The in-vitro release in this study was performed only in pH 7.4 PBS that provided a general overview of the drug release from formulated NLCs. In future studies, it would be useful to determine the drug release profiles in simulated gastric and intestinal environments to establish the suitability of these formulations for oral administration.
The release data obtained from this work indicated that liquid lipid content in NLCs can influence the release of loaded drugs and it is important to study the processing parameters carefully when using US in combination with HSH whilst developing a protocol for NLP preparation. The NLCs prepared in this study showed good stability at 4 °C for six months as no significant changes in the values of average particle sizes, PDI and surface charge were detected during this period at the chosen condition. It could be of interest to study the stability profile of these formulation at standard ambient temperature (25 °C) to determine their shelf-life at higher temperature. Nonetheless, this could be concluded based on the data obtained from this study that US along with HSH can be an effective and fast method to prepare NLCs of varying particle sizes that can potentially improve the dissolution rate of BCS II drugs.

Author Contributions

Conceptualization, V.T.; Data curation, M.G. and U.N.; Formal analysis and investigation, M.G.; Methodology, A.L.A.; Project administration, V.T.; Supervision, V.T. and A.L.A.; Writing—original draft, A.L.A.; Writing—review & editing, U.N., A.L.A. and V.T. All authors have read and agreed to the published version of the manuscript.

Funding

This research received no external funding.

Data Availability Statement

All data presented or analyzed during this study are included in the article.

Conflicts of Interest

The authors declare no conflict of interest.

References

  1. Pinheiro, M.; Ribeiro, R.; Vieira, A.; Andrade, F.; Reis, S. Design of a nanostructured lipid carrier intended to improve the treatment of tuberculosis. Drug Des. Dev. Ther. 2016, 10, 2467–2475. [Google Scholar] [CrossRef] [PubMed] [Green Version]
  2. Nasirizadeh, S.; Malaekeh-Nikouei, B. Solid lipid nanoparticles and nanostructured lipid carriers in oral cancer drug delivery. J. Drug Deliv. Sci. Technol. 2020, 55. [Google Scholar] [CrossRef]
  3. Souto, E.B.; Müller, R.H. Lipid Nanoparticles: Effect on Bioavailability and Pharmacokinetic Changes. Organotypic Models Drug Dev. 2009, 197, 115–141. [Google Scholar] [CrossRef]
  4. Salvi, V.R.; Pawar, P. Nanostructured lipid carriers (NLC) system: A novel drug targeting carrier. J. Drug Deliv. Sci. Technol. 2019, 51, 255–267. [Google Scholar] [CrossRef]
  5. Müller, R.H.; Radtke, M.; Wissing, S.A. Solid lipid nanoparticles (SLN) and nanostructured lipid carriers (NLC) in cosmetic and dermatological preparations. Adv. Drug. Deliv. Rev. 2002, 54, S131–S155. [Google Scholar] [CrossRef]
  6. Liu, D.; Liu, Z.; Wang, L.; Zhang, C.; Zhang, N. Nanostructured lipid carriers as novel carrier for parenteral delivery of docetaxel. Colloids Surfaces B Biointerfaces 2011, 85, 262–269. [Google Scholar] [CrossRef]
  7. Lin, Y.-K.; Huang, Z.-R.; Zhuo, R.-Z.; Fang, J.-Y. Combination of calcipotriol and methotrexate in nanostructured lipid carriers for topical delivery. Int. J. Nanomed. 2010, 5, 117. [Google Scholar]
  8. Desai, P.; Date, A.A.; Patravale, V.B. Overcoming poor oral bioavailability using nanoparticle formulations—opportunities and limitations. Drug Discov. Today Technol. 2012, 9, e87–e95. [Google Scholar] [CrossRef] [PubMed]
  9. Zhuang, C.-Y.; Li, N.; Wang, M.; Zhang, X.-N.; Pan, W.-S.; Peng, J.-J.; Pan, Y.-S.; Tang, X. Preparation and characterization of vinpocetine loaded nanostructured lipid carriers (NLC) for improved oral bioavailability. Int. J. Pharm. 2010, 394, 179–185. [Google Scholar] [CrossRef]
  10. Medha, J.; Sulabha, P.; Shobhona, S. Design and in vivo pharmacodynamic evaluation of nanostructured lipid carriers for parenteral delivery of artemether: Nanoproject. Int. J. Pharm. 2008, 364, 119–126. [Google Scholar]
  11. Shen, J.; Deng, Y.; Jin, X.; Ping, Q.; Su, Z.; Li, L. Thiolated nanostructured lipid carriers as a potential ocular drug delivery system for cyclosporine A: Improving in vivo ocular distribution. Int. J. Pharm. 2010, 402, 248–253. [Google Scholar] [CrossRef]
  12. Patlolla, R.R.; Chougule, M.; Patel, A.R.; Jackson, T.; Tata, P.N.; Singh, M. Formulation, characterization and pulmonary deposition of nebulized celecoxib encapsulated nanostructured lipid carriers. J. Control. Release 2010, 144, 233–241. [Google Scholar] [CrossRef] [PubMed] [Green Version]
  13. Yang, X.-Y.; Li, Y.-X.; Li, M.; Zhang, L.; Feng, L.-X.; Zhang, N. Hyaluronic acid-coated nanostructured lipid carriers for targeting paclitaxel to cancer. Cancer Lett. 2013, 334, 338–345. [Google Scholar] [CrossRef] [PubMed]
  14. Mousa, S.A.; Bharali, D.J.; Khalil, M.; Gurbuz, M.; Simone, T.M. Nanoparticles and cancer therapy: A concise review with emphasis on dendrimers. Int. J. Nanomed. 2009, 4, 1–7. [Google Scholar] [CrossRef] [Green Version]
  15. Zhu, Q.; Feng, C.; Liao, W.; Zhang, Y.; Tang, S. Target delivery of MYCN siRNA by folate-nanoliposomes delivery system in a metastatic neuroblastoma model. Cancer Cell Int. 2013, 13, 65. [Google Scholar] [CrossRef] [Green Version]
  16. Taratula, O.; Kuzmov, A.; Shah, M.; Garbuzenko, O.B.; Minko, T. Nanostructured lipid carriers as multifunctional nanomedicine platform for pulmonary co-delivery of anticancer drugs and siRNA. J. Control. Release 2013, 171, 349–357. [Google Scholar] [CrossRef] [Green Version]
  17. Brugè, F.; Damiani, E.; Marcheggiani, F.; Offerta, A.; Puglia, C.; Tiano, L. A comparative study on the possible cytotoxic effects of different nanostructured lipid carrier (NLC) compositions in human dermal fibroblasts. Int. J. Pharm. 2015, 495, 879–885. [Google Scholar] [CrossRef]
  18. Gokce, E.; Korkmaz, E.; Dellera, E.; Sandri, G.; Bonferoni, M.C.; Ozer, O. Resveratrol-loaded solid lipid nanoparticles versus nanostructured lipid carriers: Evaluation of antioxidant potential for dermal applications. Int. J. Nanomed. 2012, 7, 1841–1850. [Google Scholar] [CrossRef] [PubMed] [Green Version]
  19. Gadhave, D.G.; Tagalpallewar, A.A.; Kokare, C.R. Agranulocytosis-Protective Olanzapine-Loaded Nanostructured Lipid Carriers Engineered for CNS Delivery: Optimization and Hematological Toxicity Studies. AAPS PharmSciTech 2019, 20, 22. [Google Scholar] [CrossRef]
  20. Gonçalves, M.L.C.M.; Lyra, M.A.M.; Oliveira, F.J.V.E.; Rolim, L.; Nadvorny, D.; Vilarinho, A.C.S.G.; Nunes, L.C.C.; Soares, M.F.D.L.R.; Silva-Filho, E.C.; Soares-Sobrinho, J.L. Use of phyllosilicate clay mineral to increase solubility olanzapine. J. Therm. Anal. Calorim. 2016, 127, 1743–1750. [Google Scholar] [CrossRef]
  21. Natarajan, J.; Baskaran, M.; Humtsoe, L.C.; Vadivelan, R.; Justin, A. Enhanced brain targeting efficacy of Olanzapine through solid lipid nanoparticles. Artif. Cells Nanomed. Biotechnol. 2017, 45, 364–371. [Google Scholar] [CrossRef] [Green Version]
  22. Salama, H.A.; Mahmoud, A.A.; Kamel, A.O.; Hady, M.A.; Awad, G.A. Brain delivery of olanzapine by intranasal administration of transfersomal vesicles. J. Liposome Res. 2012, 22, 336–345. [Google Scholar] [CrossRef]
  23. Joseph, E.; Reddi, S.; Rinwa, V.; Balwani, G.; Saha, R. Design and in vivo evaluation of solid lipid nanoparticulate systems of Olanzapine for acute phase schizophrenia treatment: Investigations on antipsychotic potential and adverse effects. Eur. J. Pharm. Sci. 2017, 104, 315–325. [Google Scholar] [CrossRef]
  24. Naseri, N.; Valizadeh, H.; Zakeri-Milani, P. Solid Lipid Nanoparticles and Nanostructured Lipid Carriers: Structure, Preparation and Application. Adv. Pharm. Bull. 2015, 5, 305–313. [Google Scholar] [CrossRef] [PubMed] [Green Version]
  25. Puglia, C.; Offerta, A.; Rizza, L.; Zingale, G.; Bonina, F.; Ronsisvalle, S. Optimization of Curcumin Loaded Lipid Nanoparticles Formulated Using High Shear Homogenization (HSH) and Ultrasonication (US) Methods. J. Nanosci. Nanotechnol. 2013, 13, 6888–6893. [Google Scholar] [CrossRef] [PubMed]
  26. Cirri, M.; Bragagni, M.; Mennini, N.; Mura, P. Development of a new delivery system consisting in “drug–in cyclodextrin–in nanostructured lipid carriers” for ketoprofen topical delivery. Eur. J. Pharm. Biopharm. 2012, 80, 46–53. [Google Scholar] [CrossRef] [PubMed]
  27. Shah, N.V.; Seth, A.K.; Balaraman, R.; Aundhia, C.J.; Maheshwari, R.A.; Parmar, G.R. Nanostructured lipid carriers for oral bioavailability enhancement of raloxifene: Design and in vivo study. J. Adv. Res. 2016, 7, 423–434. [Google Scholar] [CrossRef] [Green Version]
  28. Singh, A.; Neupane, Y.R.; Mangla, B.; Kohli, K. Nanostructured Lipid Carriers for Oral Bioavailability Enhancement of Exemestane: Formulation Design, In Vitro, Ex Vivo, and In Vivo Studies. J. Pharm. Sci. 2019, 108, 3382–3395. [Google Scholar] [CrossRef]
  29. Soleimanian, Y.; Goli, S.A.H.; Varshosaz, J.; Sahafi, S.M. Formulation and characterization of novel nanostructured lipid carriers made from beeswax, propolis wax and pomegranate seed oil. Food Chem. 2018, 244, 83–92. [Google Scholar] [CrossRef]
  30. Dai, W.; Zhang, D.; Duan, C.; Jia, L.; Wang, Y.; Feng, F.; Zhang, Q. Preparation and characteristics of oridonin-loaded nanostructured lipid carriers as a controlled-release delivery system. J. Microencapsul. 2010, 27, 234–241. [Google Scholar] [CrossRef]
  31. Gardouh, A.R.; Faheim, S.H.; Noah, A.T.; Ghorab, M.M. Influence Of Formulation Factors On The Size Of Nanostructured Lipid Carriers And Nanoemulsions Prepared By High Shear Homogenization. Int. J. Pharm. Pharm. Sci. 2018, 10, 61–75. [Google Scholar] [CrossRef]
  32. de Souza, I.D.L.; Saez, V.; de Campos, V.E.B.; Mansur, C.R.E. Size and Vitamin E Release of Nanostructured Lipid Carriers with Different Liquid Lipids, Surfactants and Preparation Methods. Macromol. Symp. 2019, 383, 1800011. [Google Scholar] [CrossRef] [Green Version]
  33. Gambhire, M.S.; Bhalekar, M.R.; Gambhire, V.M. Statistical optimization of dithranol-loaded solid lipid nanoparticles using factorial design. Braz. J. Pharm. Sci. 2011, 47, 503–511. [Google Scholar] [CrossRef] [Green Version]
  34. Gupta, B.; Poudel, B.K.; Pathak, S.; Tak, J.W.; Lee, H.H.; Jeong, J.-H.; Choi, H.-G.; Yong, C.S.; Kim, J.O. Effects of Formulation Variables on the Particle Size and Drug Encapsulation of Imatinib-Loaded Solid Lipid Nanoparticles. AAPS PharmSciTech 2015, 17, 652–662. [Google Scholar] [CrossRef] [PubMed] [Green Version]
  35. Emami, J.; Mohiti, H.; Hamishehkar, H.; Varshosaz, J. Formulation and optimization of solid lipid nanoparticle formulation for pulmonary delivery of budesonide using Taguchi and Box-Behnken design. Res. Pharm. Sci. 2015, 10, 17–33. [Google Scholar] [PubMed]
  36. Sheikh, F.A.; Barakat, N.A.M.; Kanjwal, M.A.; Aryal, S.; Khil, M.S.; Kim, H.-Y. Novel self-assembled amphiphilic poly(ε-caprolactone)-grafted-poly(vinyl alcohol) nanoparticles: Hydrophobic and hydrophilic drugs carrier nanoparticles. J. Mater. Sci. Mater. Electron. 2009, 20, 821–831. [Google Scholar] [CrossRef] [PubMed]
  37. Chaudhary, S.; Garg, T.; Murthy, R.; Rath, G.; Goyal, A.K. Development, optimization and evaluation of long chain nanolipid carrier for hepatic delivery of silymarin through lymphatic transport pathway. Int. J. Pharm. 2015, 485, 108–121. [Google Scholar] [CrossRef] [PubMed]
  38. Sanad, R.A.; Abdelmalak, N.S.; Elbayoomy, T.S.; Badawi, A.A. Formulation of a Novel Oxybenzone-Loaded Nanostructured Lipid Carriers (NLCs). AAPS PharmSciTech 2010, 11, 1684–1694. [Google Scholar] [CrossRef]
  39. Teeranachaideekul, V.; Souto, E.B.; Junyaprasert, V.B.; Müller, R.H. Cetyl palmitate-based NLC for topical delivery of Coenzyme Q10–Development, physicochemical characterization and in vitro release studies. Eur. J. Pharm. Biopharm. 2007, 67, 141–148. [Google Scholar] [CrossRef]
  40. Seyfoddin, A.; Al-Kassas, R. Development of solid lipid nanoparticles and nanostructured lipid carriers for improving ocular delivery of acyclovir. Drug Dev. Ind. Pharm. 2012, 39, 508–519. [Google Scholar] [CrossRef] [PubMed]
  41. Teeranachaideekul, V.; Müller, R.H.; Junyaprasert, V.B. Encapsulation of ascorbyl palmitate in nanostructured lipid carriers (NLC)—Effects of formulation parameters on physicochemical stability. Int. J. Pharm. 2007, 340, 198–206. [Google Scholar] [CrossRef] [PubMed]
  42. Teeranachaideekul, V.; Boonme, P.; Souto, E.B.; Müller, R.H.; Junyaprasert, V.B. Influence of oil content on physicochemical properties and skin distribution of Nile red-loaded NLC. J. Control. Release 2008, 128, 134–141. [Google Scholar] [CrossRef] [PubMed]
  43. Vitorino, C.; Almeida, A.; Sousa, J.; Lamarche, I.; Gobin, P.; Marchand, S.; Couet, W.; Olivier, J.-C.; Pais, A. Passive and active strategies for transdermal delivery using co-encapsulating nanostructured lipid carriers: In vitro vs. in vivo studies. Eur. J. Pharm. Biopharm. 2014, 86, 133–144. [Google Scholar] [CrossRef] [PubMed]
  44. Tran, T.H.; Ramasamy, T.; Truong, D.H.; Choi, H.-G.; Yong, C.S.; Kim, J.O. Preparation and Characterization of Fenofibrate-Loaded Nanostructured Lipid Carriers for Oral Bioavailability Enhancement. AAPS PharmSciTech 2014, 15, 1509–1515. [Google Scholar] [CrossRef] [PubMed] [Green Version]
  45. Tatke, A.; Dudhipala, N.; Janga, K.Y.; Balguri, S.P.; Avula, B.; Jablonski, M.M.; Majumdar, S. In Situ Gel of Triamcinolone Acetonide-Loaded Solid Lipid Nanoparticles for Improved Topical Ocular Delivery: Tear Kinetics and Ocular Disposition Studies. Nanomateries 2018, 9, 33. [Google Scholar] [CrossRef] [PubMed] [Green Version]
  46. Fini, A.; Cavallari, C.; Ospitali, F.; Gonzalez-Rodriguez, M.L. Theophylline-Loaded Compritol Microspheres Prepared by Ultrasound-Assisted Atomization. J. Pharm. Sci. 2011, 100, 743–757. [Google Scholar] [CrossRef]
  47. Bright, A.; Devi, T.S.R.; Gunasekaran, S. Qualitative and quantitative analysis of antipsychotic drugs-a spectroscopic study. Asian J. Chem. Asian J. Chem. 2010, 22, 5871. [Google Scholar]
  48. Shankarrao, K.A.; Mahadeo, G.D.; Balavantrao, K.P. Formulation and In-vitro Evaluation of Orally Disintegrating Tablets of Olanzapine-2-Hydroxypropyl-β-Cyclodextrin Inclusion Complex. Iran. J. Pharm. Res. IJPR 2010, 9, 335–347. [Google Scholar]
  49. Acevedo-Morantes, C.Y.; Acevedo-Morantes, M.T.; Suleiman-Rosado, D.; Ramirez-Vick, J.E. Evaluation of the cytotoxic effect of camptothecin solid lipid nanoparticles on MCF7 cells. Drug Deliv. 2013, 20, 338–348. [Google Scholar] [CrossRef]
  50. Dixit, M.; Kini, A.G.; Kulkarni, P.K. Enhancing the aqueous solubility and dissolution of olanzapine using freeze-drying. Braz. J. Pharm. Sci. 2011, 47, 743–749. [Google Scholar] [CrossRef] [Green Version]
  51. Hu, F.-Q.; Jiang, S.-P.; Du, Y.-Z.; Yuan, H.; Ye, Y.-Q.; Zeng, S. Preparation and characterization of stearic acid nanostructured lipid carriers by solvent diffusion method in an aqueous system. Colloids Surfaces B Biointerfaces 2005, 45, 167–173. [Google Scholar] [CrossRef] [PubMed]
  52. Harisa, G.I.; Badran, M.M. Simvastatin nanolipid carriers decreased hypercholesterolemia induced cholesterol inclusion and phosphatidylserine exposure on human erythrocytes. J. Mol. Liq. 2015, 208, 202–210. [Google Scholar] [CrossRef]
Figure 1. Schematic presentation of lipid nanocarriers; Solid lipid nanoparticles (A) and Nanostructured Lipid Careers (B).
Scipharm 89 00025 g001
Figure 2. Applications of NLC’s as drug delivery systems.
Scipharm 89 00025 g002
Figure 3. Effect of US time on particle size of blank NLCs.
Scipharm 89 00025 g003
Figure 4. Effect of US time on PDI of blank NLCs.
Scipharm 89 00025 g004
Figure 5. Effect of US time on ζ-potential of blank NLCs.
Scipharm 89 00025 g005
Figure 6. BF-STEM micrograph of OLZ-loaded NLCs.
Scipharm 89 00025 g006
Figure 7. (a): ATR-FTIR spectra for Mig and C888. (b) ATR-FTIR spectra for NLCs and unprocessed OLZ.
Scipharm 89 00025 g007
Figure 8. Diffractograms of OLZ-loaded NLCs, C888, OLZ, and physical mixtures (C-888-Mig and C888-Mig-OLZ).
Scipharm 89 00025 g008
Figure 9. OLZ release kinetics from drug-loaded NLCs and OLZ at 37 °C for 24 h in PBS.
Scipharm 89 00025 g009
Figure 10. Effect of storage at 4 ± 1 °C on mean particle size (A), PDI (B) and ζ-potential (C) of OLZ-NLC formulations.
Scipharm 89 00025 g010
Table 1. Description for the quantities of excipients used for NLC formulations.
Formulation C888 (mg)Mig (mg)P188 (mg)Tween 80 (mg)
F52851515050
F152554515050
F302109015050
F5015015015050
Table 2. Effect of HSH time on the formulation of blank F30 NLCs.
FormulationHSH Time (Minutes)US Time (Minutes)Particle Size (nm)PDIζ-Potential (mV)
F30150161 (±5)0.35−15 (±3)
55120 (±4)0.28−16 (±4)
105121 (±5)0.29−15 (±2)
155121 (±6)0.31−15 (±3)
Table 3. Effect of solid to liquid lipid ratio on the particle size and PDI of blank and drug-loaded NLCs.
Formulation Blank NLCsPDIOLZ-NLCsPDI
F5112 (±2.9)0.30114 (±4.0)0.40
F15123 (±6.6)0.32125 (±3.7)0.40
F30128 (±2.9)0.28123 (±17.7)0.38
F50136 (± 0.5)0.23123 (± 31.5)0.33
Table 4. Effect of solid to liquid lipid ratio on surface charge of blank and drug-loaded NLCs.
ζ-Potential (mV)
Formulation Blank NLCsOLZ-Loaded NLCs
F5−20 −40
F15−18−39
F30−16−38
F50−13−35
Table 5. Correlation coefficients (R2) and release exponent (n) values obtained from the different kinetic models for NLCs.
Kinetic ModelF5F15F30F50
Zero order0.79720.67420.59880.7219
First order0.91910.89590.87590.8386
Higuchi0.90540.83570.77350.879
Korsmeyer-Peppas0.97510.96240.97010.9861
Korsmeyer-Peppas (n)0.4030.3550.3240.369
Publisher’s Note: MDPI stays neutral with regard to jurisdictional claims in published maps and institutional affiliations.

