Article

Characterization of Phytochemical Components of Crocus sativus Leaves: A New Attractive By-Product

1
Department of Pharmaceutical Chemistry, National University of Pharmacy, 4-Valentynivska st., 61168 Kharkiv, Ukraine
2
Department of Analytical and Toxicological Chemistry, Lithuanian University of Health Sciences, A. Mickevičiaus g. 9, LT 44307 Kaunas, Lithuania
3
Department of Public Health, Dietetics and Lifestyle Disorders, Faculty of Medicine, University of Information Technology and Management in Rzeszow, Sucharskiego 2, 35-225 Rzeszow, Poland
*
Author to whom correspondence should be addressed.
Submission received: 15 May 2021 / Revised: 27 May 2021 / Accepted: 8 June 2021 / Published: 15 June 2021
(This article belongs to the Special Issue Feature Papers in Scientia Pharmaceutica)

Abstract

:
Crocus sativus L. is one of the world’s most famous saffron production crops and its enormous by-products, such as leaves, are an excellent source of bioactive compounds with potential nutritional applications. The total phenolic content of Crocus leaves was 5.44 ± 0.01 mg GAE/g, and the total flavonoid content was 2.63 ± 0.05 mg RE/g, respectively. The main bioactive compounds in the leaves, such as polyphenols, flavonoids by HPLC and carboxylic acids, and amino acids, were also identified by GC-MS. HPLC analyses revealed mangiferin as a dominant constituent (1.26 ± 0.02 mg/g). C. sativus contains seven essential amino acids (ILE, LEU, LYS, MET, PHE, THR, TRP, VAL) in high concentration. Among them, isoleucine (7965 µg/g) was the dominant compound. In addition, the K and Ca concentrations in the leaves were significant (p < 0.05). The chemical composition revealed α-linolenic acid (22,490 µg/g) and linoelaidic acid (9880 µg/g) to be major constituents among all the acids found in the Crocus leaves. The extracts of C. sativus leaves showed the highest inhibitory activity for Gram-positive (B. subtilis and S. aureus) bacteria in the in vitro assay. The current results identify and underline the potential of natural products from C. sativus leaves that can add value to saffron production.

Graphical Abstract

1. Introduction

Recently, traditional herbal medicine has gained more attention from consumers, especially when the use of synthetic drugs does not provide results or drug side effects occur. Herbal medicine is still the most common alternative medicine that is based on natural products and is safe [1]. As a rule, the pharmacological activity of the plant extracts is not determined by a specific active ingredient but by the interaction of a group or a whole complex of components. Their content may vary depending on the type of plant, cultivation season, geographical location, method of drying, grinding, storage, etc. [2,3,4]. Crocus sativus L. is a famous plant from the Iridaceae family. From its stigmas, the most expensive spice in the world, “saffron”, is obtained. Crocus is cultivated in different countries, such as Iran, India, Afghanistan, Italy, France, New Zealand, Spain, Portugal, Greece, Morocco, Turkey, and some parts of China [5,6]. Since saffron is widely cultivated and harvested in different parts of the world, planting methods can also vary based on climate, soil type, planting depth, and distance between corms. Recent studies [6,7,8] have shown that saffron has many pharmacological effects, such as anticonvulsant, antihypertensive, antitussive, antigenotoxic, anxiolytic, cytotoxic, antioxidant, antidepressant, anti-inflammatory, and relaxant properties. Saffron also helps to improve memory and learning skills and to increase blood flow in the retina and choroid. These pharmacological activities occur because of several active compounds, such as crocin, picrocrocin, and safranal [9].
The production of only 1 kg of saffron generates a huge amount of residues, such as flower waste (350 kg), low-quality corms (several hundred), and Crocus leaves (1500 kg), which gradually dry out and are not used [5,10,11]. However, these plant raw materials also contain various biologically active compounds. Thus, they can be considered as useful byproducts for obtaining biologically active complexes or additional raw materials for the development of herbal drugs. It is known that plant leaves can exhibit pronounced antioxidant and antibacterial activities, especially due to the presence of phenolic compounds. Analysis of the literature has shown that study of the chemical composition of C. sativus leaves is very limited. Smolskaite et al. [12] analyzed 46 samples of Crocus leaves from Azerbaijan, India, New Zealand, Morocco, France, Turkey, Iran, Italy, and Spain by High-performance liquid chromatography with ultra-violet (UV) spectroscopy (HPLC-UV) and Liquid chromatography with mass spectrometry (LC-MS). Several flavonoids have been identified; among them, kaempferol-8-C-gluco-6,3-O-diglucoside and kaempferol-8-C-gluco-6-O-glucose were found for the first time. At the same time, the authors noted that different samples of Crocus leaves did not differ in chemical composition but differed in the concentration of each component. Jadouali et al. [13] only studied the total phenolic compounds and total flavonoid contents in the leaves and flowers of C. sativus from Morocco. Naringenin was found in C. sativus leaves using LC-MS [14]. A qualitative analysis of C. sativus leaves from Morocco showed that glycosylated derivatives of luteolin (luteolin-C-(O-caffeoyl-hexosyl)-O-hexoside) and glycosylated kaempferol (kaempferol 3,7-di-O-glucoside) were the major identified polyphenols in leaves [15]. A significant amount of polyphenols, the main glycosides being kaempferol, luteolin, and quercetin, have been determined in C. sativus leaves from Spain [2]. Thus, data from the literature on the chemical composition of C. sativus leaves are very scarce and contradictory.
Ukraine is a new country to the saffron market, and its climatic features affect the composition of secondary metabolites, which determine the pharmacological value of the plant. Therefore, the research objectives included analysis of the chemical composition of the phenolic compounds, carboxylic acids, amino acids, and mineral components of the leaves of Ukrainian C. sativus as well as the potential of antibacterial activity of plant extracts.

2. Materials and Methods

2.1. Plant Material

C. sativus leaves were collected from a plantation in the village Lyubimivka (Ukraine, Kherson region) in November 2020. Raw material was collected and identified by Dr. Mykhailenko, and the identification was verified by Dr. Gamulya (V.M. Karazin Kharkiv National University, Ukraine). A specimen was deposited at the Herbarium of V.M. Karazin Kharkiv National University, Ukraine (CWN, voucher specimen No. CWN0056541). Leaves were air dried at room temperature with suitable ventilation and then crushed to grit (1.0 mm size) for further extraction.

2.2. Chemicals

The acetonitrile and methanol were of HPLC grade and purchased from Roth GmbH (Karlsruhe, Germany). Reference compounds (chlorogenic acid, trans-cinnamic acid, mangiferin, kaempferol, ononin, irigenin) were purchased from ChromaDex (Santa Ana, CA, USA), Sigma-Aldrich (Saint Louis, MO, USA), HWI ANALYTIK GmbH, and Roth GmbH (Karlsruhe, Germany). All the other chemicals were of analytical grade.

2.3. Qualitative Analysis

Crushed Crocus leaves were extracted with 70% methanol (in a ratio of raw material to extractant of 1:5 w/v) and kept in an ultrasonic bath at room temperature (20 ± 2 °C) for 20 min. Then, the sample was filtered through microfilters into a 10 mL flask and diluted with methanol to the mark. Preliminary qualitative analysis of the phenolic compounds of the leaves was established as described by Morsy [16] and by TLC analysis [17]. The following methods were used to separate or identify substances on the TLC plates (silica gel 60 F254, Merck, Germany) of Crocus samples: physical (individual color of a substance or fluorescence of a substance in UV light) and chemical (colored reactions of separated substances with imaging reagents). Phenolic compounds have a weak natural fluorescence in UV light at 365 nm and 254 nm wavelengths and must be enhanced during separation on chromatography plates. The phenolic compounds’ fluorescence was enhanced by spraying the TLC plates with different complex agents (ammonium vapors; 2% alcoholic solution of aluminum chloride; 10% sodium/potassium hydroxide solution; 5% alcoholic solution of diazotized sulfanilic acid).

2.4. Determination of Total Phenolic and Flavonoid Contents

The total phenolic and flavonoid content of the ethanol extract of Crocus leaves was estimated using the methods of the State Pharmacopoeia of Ukraine 2.0 [18] by absorption spectrophotometry on an Evolution TM 60S UV–visible light spectrophotometer (Thermo Fisher Scientific, Waltham, MA, USA) with slight modifications. Extract solutions (1 mL of the concentration of 2 mg/mL) were mixed with ethanol/water 70/30 (v/v) (by volume 25 mL) and the solutions were incubated for 5 min at room temperature. The determination was at the wavelength 270 nm and the reference solution was 70% ethanol. The amount of total phenols was determined based on a mg of gallic acid equivalent per gram of sample (mg GAE/g). The total flavonoid content was assessed based on the aluminum trichloride method [19] at the wavelength 410 nm. Extract solutions (0.5 mL of the concentration of 2 mg/mL) were mixed with 1 mL of AlCl3 ethanolic (3%). The absorbance of the extracts was measured at 410 nm after a 40 min incubation (room temperature, in the dark). The total content of flavonoids was expressed as mg of rutin equivalents per gram of sample (mg RE/g), using a rutin calibration curve.

2.5. Sample Extraction

A measurement of 0.1 g of the dried Crocus leaves was extracted with 10 mL of methanol in an ultrasonic bath at room temperature (20 ± 2 °C) for 30 min. The solutions were filtered through a membrane filter (0.45 μm) prior to use. An aliquot of 10 μL was injected into the HPLC system for analysis.

2.6. Standard Preparation

A standard stock solution of the phenolic reference compounds at a concentration of 1.0 mg/mL for each compound was prepared by dissolving the substance in methanol. After preparation of standard stock solutions, all of them were mixed and dissolved with methanol to obtain working concentrated solutions. All samples were kept at 4 °C before use.

2.7. HPLC Conditions

For separation, the Shimadzu Nexera X2 LC-30AD HPLC chromatographic system (Shimadzu, Japan) composed of a quaternary pump, an on-line degasser, and a column temperature controller; the SIL-30AC autosampler (Shimadzu, Japan); the CTO-20AC thermostat (Shimadzu, Japan); and the SPD-M20A diode array detector (DAD) were used. Chromatographic separation of phenolic compounds was carried out using an ACE C18 column (250 mm × 4.6 mm, 5.0 μm; Bellefonte, PA, USA) with the column thermostat at 25 °C (±1 °C) as described previously [20]. Briefly, the mobile phase consisted of 0.1% acetic acid in water (solvent A) and acetonitrile (solvent B). The flow rate was maintained at 1 mL/min. The gradient elution was performed as follows: 0 min—95% A and 5% B, 7 min—95% A and 5% B, 67 min—0% A and 100% B, 69 min—95% A and 5% B, and 75 min—95% A and 5% B. The individual phenolic compounds were identified using MS spectra and UV spectra and verified by reference substances. The analyses were performed in duplicate. Validation of the HPLC method was performed according to the ICH guidelines [21] by the following parameters: specificity, linearity, precision, LOD, and LOQ.

2.8. UPLC-MS/MS Analysis of Components

Separation of the samples’ components was carried out with the ACQUITY H-class UPLC system (Waters, Milford, MA, USA) equipped with ACQUITY UPLC BEH C18 (50 × 2.1 mm, particle size 1.7 µm) (Merck Millipore, Darmstadt, Germany). Gradient elution was performed with 0.1% formic acid water solution (solvent A) and acetonitrile (solvent B) with the flow rate at 0.5 mL/min. The following proportions of the solvent system were applied using a linear gradient profile B: initial 5%, 3 min 30%, 7 min 50%, 7 to 8 min 95%, and 15 to 16 min 5%. A Xevo TQD triple quadrupole mass spectrometer detector (Waters) was used to obtain MS/MS data. Positive electrospray ionization was applied with the following settings: capillary voltage was 1.5 kV, source temperature was 150 °C, desolvation temperature was 350 °C, with a desolvation gas flow of 650 L/h and cone gas flow of 25 L/h. Collision energy and cone voltage were optimized for each compound separately. Collision energy varied in the range from 6 eV to 20 eV and cone voltage was selected from 8 V to 38 V.

2.9. Mineral Composition

The graphite furnace atomic absorption spectroscopy (GF-AAS) method with photographic registration on the DFS-8 device was used to determine the qualitative and quantitative content of macro- and microelements in Crocus leaves. The method is based on the evaporation of samples from craters of graphite electrodes and the excitation of spectra in the arc and registration of the obtained spectra on IBS-28 photographic plates. Measuring conditions: amperage arc—16 A, ignition phase—60 °C, ignition pulse frequency—100 bps, analytical gap—2 mm, gap width—0.015 mm, and exposure—60 s. The spectra were photographed in the 240–350 nm region. A set of standard LNG-24 samples (GSO 2820-83) was used in the determination.

2.10. Amino Acids and Carboxylic Acids Assays

The methanol extracts (prepared as indicated above) were evaporated under nitrogen to dry the residue. It was dissolved in a 200 μL mixture of acetonitrile and MTBSTFA (1:1), then heated in a glycerol bath and subjected to amino acid gas chromatography analysis. The gas chromatography method has been previously described by Mykhailenko et al. [22] and Jarukas et al. [23]. Briefly, the SHIMADZU GC-MS-QP2010 system and Rxi-5 ms (Restek Corporation, Bellefonte, PA, USA) capillary column (30 m, 0.25 mm outer diameter, 0.25 μm) were applied. The MS was operated in positive mode (electron energy 70 eV). The full-scan acquisition was performed with the mass detection range set to 35–500 m/z to determine the retention times of analytes, optimize the oven temperature gradient, and observe characteristic mass fragments for each compound. Amino acids and carboxylic acids were identified by comparison with the database (NIST14, NIST14s, WR10, WR10R) mass spectra of compounds, analyzing ions characteristic of mass spectra and retention times of standards. 4-Aminobutyric acid was quantified in glutamic acid equivalents. The content of the carboxylic acids was calculated and expressed in terms of the lactic acid equivalent; the contents of 2-aminobutyric acid, γ-aminobutyric acid, and L-aspartic acid were re-calculated in glutamic acid; the content of β-alanine was calculated via L-alanine; and L-tryptophan was calculated via L-proline.

2.11. Extraction Procedure of C. sativus Leaves for Bioassay

C. sativus leaves were dried and ground, and the powder was extracted with distilled water in a water bath at 100 °C (100 g, 1 L, 60 min × 3) or 70% ethanol at room temperature (100 g, 1 L, 60 min × 3). The extracts were concentrated to dryness.

2.12. Antibacterial Activity Assays

The agar well diffusion method and serial dilution technique were used to screen the antibacterial and antifungal activities of water and ethanolic C. sativus leaf extracts [24]. According to the WHO recommendations [25], the following test strains were used: Staphylococcus aureus ATCC 25923, Escherichia coli ATCC 25922, Proteus vulgaris NCTC 4636, Pseudomonas aeruginosa ATCC 27853, Bacillus subtilis ATCC 6633, and Candida albicans 885/653 ATCC. Detailed information concerning the method conditions has been previously provided [26]. The concentration of extracts (1% w/v) was selected based on our pre-experiments and the previous literature. An alcohol solution of chlorophyllipt (“Chlorophyllipt ethanolic 1%solution” 100 mL, “DP”, “OZ GNTSLSHOOKUkrmedprom”, Pilot Plant Medicines, Kharkiv, Ukraine) at a dose of 10 mg/mL was employed as a positive control. Antibacterial activity was evaluated by measuring the diameter of the inhibition zone (including the wells diameter) appearing after the incubation period. The assay was repeated thrice. Antibacterial activity was expressed as the mean zone of inhibition diameters (mm) produced by the Crocus leaf extract. The method of serial dilutions was used for the examination of the antibacterial properties of selected extracts. The principle of the method consists in the determination of the minimal inhibitory concentration (MIC) that characterizes the bacteriostatic properties of the objects of the examination. The concentration of substances was 1000 µg/mL; 500 µg/mL; 250 µg/mL; 125 µg/mL; and 62.5 µg/mL. The MIC was considered as the lowest concentration which inhibited the growth of the respective microorganisms. All assays were performed in triplicate.

2.13. Data Analysis

All data processing was carried out using the LabSolutions Analysis Data System (Shimadzu Corporation, Kyoto, Japan). Statistical analysis was performed by one-way analysis of variance (ANOVA) followed by Tukey’s multiple comparison test with the software package Prism v.5.04 (GraphPad Software Inc., La Jolla, CA, USA). The value of p < 0.05 was taken as a level of significance.

3. Results and Discussion

3.1. Preliminary Phytochemical Screening

The phytochemical study of the methanol extract of Crocus leaves revealed the presence of various bioactive compounds (Table 1), including polyphenols, tannins, flavonoids, xanthones, hydroxycinnamic acids, hydrolysable tannins, triterpenoids, saponins, aminoacids, and proteins. Alkaloids and coumarins were not found in this raw material.
Quantitative phytochemical analysis showed that C. sativus leaves contained the largest amount of biologically active compounds, primarily phenolic and flavonoid compounds.
Previously, Baba et al. [14] reported that the total phenolic content of ethanolic extracts of C. sativus leaves from Jammu and Kashmir (India) was 5.62 mg/g, using the Folin–Ciocalteu reagent method, and that the total flavonoid content was 1.61 ± 0.12 mg RE/g. According to Jadouali et al. [13], the total phenolic content for C. sativus leaves from Morocco was 81.69 ± 1.58 mg GAE/mg of powder crude extract, and the total flavonoids content was 50.64 ± 1.63 mg of CE/g of dry plant material. In another investigation [15] of saffron from Morocco, the total phenolic and flavonoid content of the methanolic C. sativus leaf extracts was 94 ± 17 mg of GA eq/g and 27 ± 4 mg of quercetin eq/g, respectively. This data is practically correlated with previous studies and is probably due to a single area of plant cultivation. In Spain, in C. sativus leaves, the total polyphenol content was 1.5 g GAE/100 g [11]. Thus, it can be seen that the place of cultivation and climatic factors [27,28,29] have a great influence on the composition of phenolic compounds in Crocus leaves.
The current phytochemical analysis revealed the high total phenolic content of C. sativus leaves from Ukraine, corresponding to 5.44 ± 0.01 mg GAE/g DW and a flavonoid content of 2.63 ± 0.05 mg RE/g DW. Phenolic compounds play a key role in scavenging free radicals, inhibiting hydrolytic and oxidative enzymes, and exhibiting anti-inflammatory effects [30]. Therefore, it is possible to expect a pronounced antioxidant effect for Crocus leaves from Ukraine. Therefore, a deeper study of the chemical profile of Crocus leaves was carried out.

3.2. Identification and Content of Phenolic Compounds by HPLC

The most common constituents in the leaves of the Iridaceae plant family are flavone C-glycosides, flavanols, and isoflavones derivatives [7,20,31]. The most studied are leaves and rhizomes of Iris spp. In plant derivatives of 7-methyl ester and 7,4-dimethyl ester of apigenin, derivatives of 6,7-methylenedioxyflavans, as well as various isoflavonoids and xanthones, have been found. Derivatives of myricetin, kaempferol, and quercetin were found in the leaves of different Crocus species [6]. However, data on the composition of flavonoids in Crocuses are very limited.
Compounds identification in Crocus leaves extract was based on their coelution with reference compounds and on the UV/MS spectroscopic data according to the HPLC-DAD method. For the identification of phenolic compounds, a more selective and sensitive UPLC method for plants using the negative ionization mode was selected [32]. Six phenolic compounds were detected in the studied Crocus leaves for the first time (Figure 1). The quantification of the phenolic compounds using the available standards was carried out (Table 2). All identified compounds were of a minor amount, among them two hydroxycinnamic acid derivatives, i.e., trans-cinnamic acid (0.15 ± 0.002 mg/g) and chlorogenic acid (0.31 ± 0.004 mg/g); flavonoid kaempferol (0.032 ± 0.001 mg/g); and two isoflavones—ononin (0.04 ± 0.001 mg/g) and irigenin (0.002 ± 0.001 mg/g)—were determined. Additionally, xanthone mangiferin was found in C. sativus leaves for the first time, and its content was the highest (1.26 ± 0.02 mg/g) among all identified compounds. As a result, trans-cinnamic acid, chlorogenic acid, ononin, irigenin, and mangiferin were identified first in C. sativus leaves from Ukraine.
The HPLC method used was validated for such parameters as linearity range, LOD, LOQ, accuracy, precision, repeatability, and specificity for each analyte. These are presented in Table 3 and Table 4. A regression equation and correlation coefficient ranging from 0.9999 to 1.000 revealed a good linearity response within the tested ranges. The series of calibration solutions were prepared and separated under the optimal conditions as described above. The LOD and LOQ values (Table 3) indicate that the proposed method demonstrates good sensitivity for quantifying seven phenolic compounds in Crocus leaves. The repeatability was observed in the range of 0.24–1.05%, which was satisfactory and demonstrated the good repeatability of the proposed method. The determination of the main compounds in the test solutions was carried out by comparing the retention times of peaks and UV spectrum obtained from the chromatogram of the standard solution (Table 2). All results showed the repeatability, accuracy, high sensitivity, and good linearity of the method.

3.3. UPLC-MS/MS Analysis of Phenolic Compounds

To confirm the identified compounds in Crocus leaves, further UPLC-MS/MS analysis of these components was performed in negative ion mode. Their retention times (tR), calculated molecular weights, and MS/MS data are shown in Table 2, respectively. All compounds were unambiguously identified with the reference standards comparison. Peak 1 ([MH] at m/z 353) was assigned to monocaffeoyquinic acids. The MS spectrum of peak 1 was characterized by the loss of one moiety of caffeic acid, due to the ester bond, which readily dissociated and was identified as 3-O-caffeylquinic acid or chlorogenic acid in comparison with the reference standards. In the MS spectrum, peak 2 produced the [MH] ion at m/z 421. The MS2 spectrum gave the predominant fragment ions at m/z 331 and 301 owing to the neutral loss of C3H6O3 and C4H8O4, respectively. The low-intensity product ion at m/z 259 appeared in the MS2 spectrum due to the loss of the glucose residue from the [MH] ion. The MS3 spectrum of the precursor ion at m/z 301 gave the product ion at m/z 273, 271, and 257 resulting from the loss of CO, CH2O, and CO2, respectively. The RDA fragmentation reaction was also observed in the MS/MS spectrum and corresponded with the literature data [33]. Peak 4 produced the [MH] ion at m/z 147 at 44.76 min and was identified as trans-cinnamic acid. Peaks 5 produced the [MH] ion at m/z 285 and were identified as kaempferol (calculated for C15H10O6, m/z 286). They were further confirmed by comparing the retention time and the MS/MS spectra with the corresponding standards. In the MS spectrum, peak 6 produced the [MH] ion at m/z 459 and lost three methyl groups, showing fragments at m/z 344 and m/z 329. The isoflavonoid ononin was identified in the positive ionization mode according to the retro-Diels–Adel reaction (RDA) [33]. Since we were able to identify almost all substances in the negative ion mode, we did not carry out a separate determination for ononin. According to Luo et al. [33], the excimer ion peak [M+H]+ of ononin has a m/z of 431. However, we did not perform such a definition.

3.4. GF-AAS Analysis of Mineral Composition

The literature data of macro- and microelement analysis in C. sativus leaves are limited. It is known that Jadouali et al. [13] only established the calcium, potassium, sodium, nitrogen, iron, and zinc elements, as well as a high concentration of iron (985 mg/kg), in C. sativus leaves from Morocco.
As a result of the element profile of Crocus leaves from Ukraine, the presence of 15 minerals has been determined (Table 5). Among the identified elements were three macroelements, five mezoelements, and seven ultramicroelements. It is interesting to note the presence of a significant amount of essential and conditionally essential elements, such as calcium (Ca), iron (Fe), manganese (Mn), zinc (Zn), silica (Si), phosphorus (P), and nickel (Ni).
The results of the mineral content of C. sativus leaves from Ukraine are presented in Table 5. In leaves, potassium and calcium were found to be the most abundant minerals with a value of 1525 mg/100 g and 550 mg/100 g, respectively. The high content of potassium in Crocus leaves is due to the physiological function of potassium in the process of transport in plants: first and foremost, with the participation of a highly osmotic active substance in the induction of corms pressure and transport of assimilates in the leaf phloem [34]. Calcium accumulates at the deposit places in the cell (vacuole, endoplasmic reticulum), is gradually released, and performs its physiological function [35]. The plant has the highest calcium content in the photosynthetically active leaves vacuole in the form of oxalate or other hardly soluble salts. Calcium passes slowly through the xylem, so its content is lower than potassium. A significant decrease in the content of magnesium (6.73 mg/100 g) in Crocus leaves is directly related to the content of potassium in the raw material and is associated with the mechanisms of absorption of these nutrients from the soil [36,37]. It should be noted that the crop C. sativus is cultivated without any nitrates, pesticides, or additional growth stimulants [29,38]. Nitrogen, phosphorus, and potassium fertilizers are applied only in April after harvesting Crocus corms from the field. The current study showed that C. sativus leaves have a pronounced mineral composition without additional fertilizers.

3.5. GC-MS Analysis of Amino Acids and Short-Chained and Long-Chain Carboxylic Acids

The amino acid composition was studied only for C. sativus stigma from Spain, Italy, Greece, and Iran, and high levels of alanine, proline, and aspartic acid were found [39]. Fatty acids, such as myristic, stearic, palmitic, palmitoleic, oleic, linoleic, linolenic, and arachidonic acids, have also been found in C. sativus stigmas [40,41].
Linoleic acid, linolenic acid, and palmitic acid were the predominant fatty acids of C. sativus flowers [42]. Lauric acid and hexadecanoic acid have been found in C. sativus tepals, stamens, and stigmas [43]. Ursolic, oleanolic, palmitic, palmitoleic, oleic, linolenic, and linoleic acids were found in C. sativus corms [44], as well as amino acids (aspartic acid, glutamic acid, cysteine, serine, glycine, proline, phenylalanyl, leucine, valine, and methionine) [45]. No published data on the amino acids and fatty acids composition of C. sativus leaves has been found.
For the investigation, a method for the simultaneous study of fatty acids, short-chained carboxylic acids, and amino acids in C. sativus leaves from Ukraine was used. As a result, 44 metabolites were found. This separation was achieved by the derivatization method. The derivatization procedure is highly dependent on the solvent used. Therefore, in our previous work [22,23], we developed the GC-MS method for organic acid investigation. Different times, temperatures and the effect of the reagent amount on the derivatization process were tested. The optimal conditions for the complete derivatization of most amino acids and organic acids were ultrasonic extraction for 10 min, followed by derivatization with acetonitrile and N-Methyl-N-tert-butyldimethylsilyltrifluoroacetamide MTBSTFA (1:1) for 4 h at 70 °C.
All compounds were identified by comparing the retention times of selected acids in specific MS chromatograms. The content of identified carboxylic acids and amino acids is presented in Table 6.
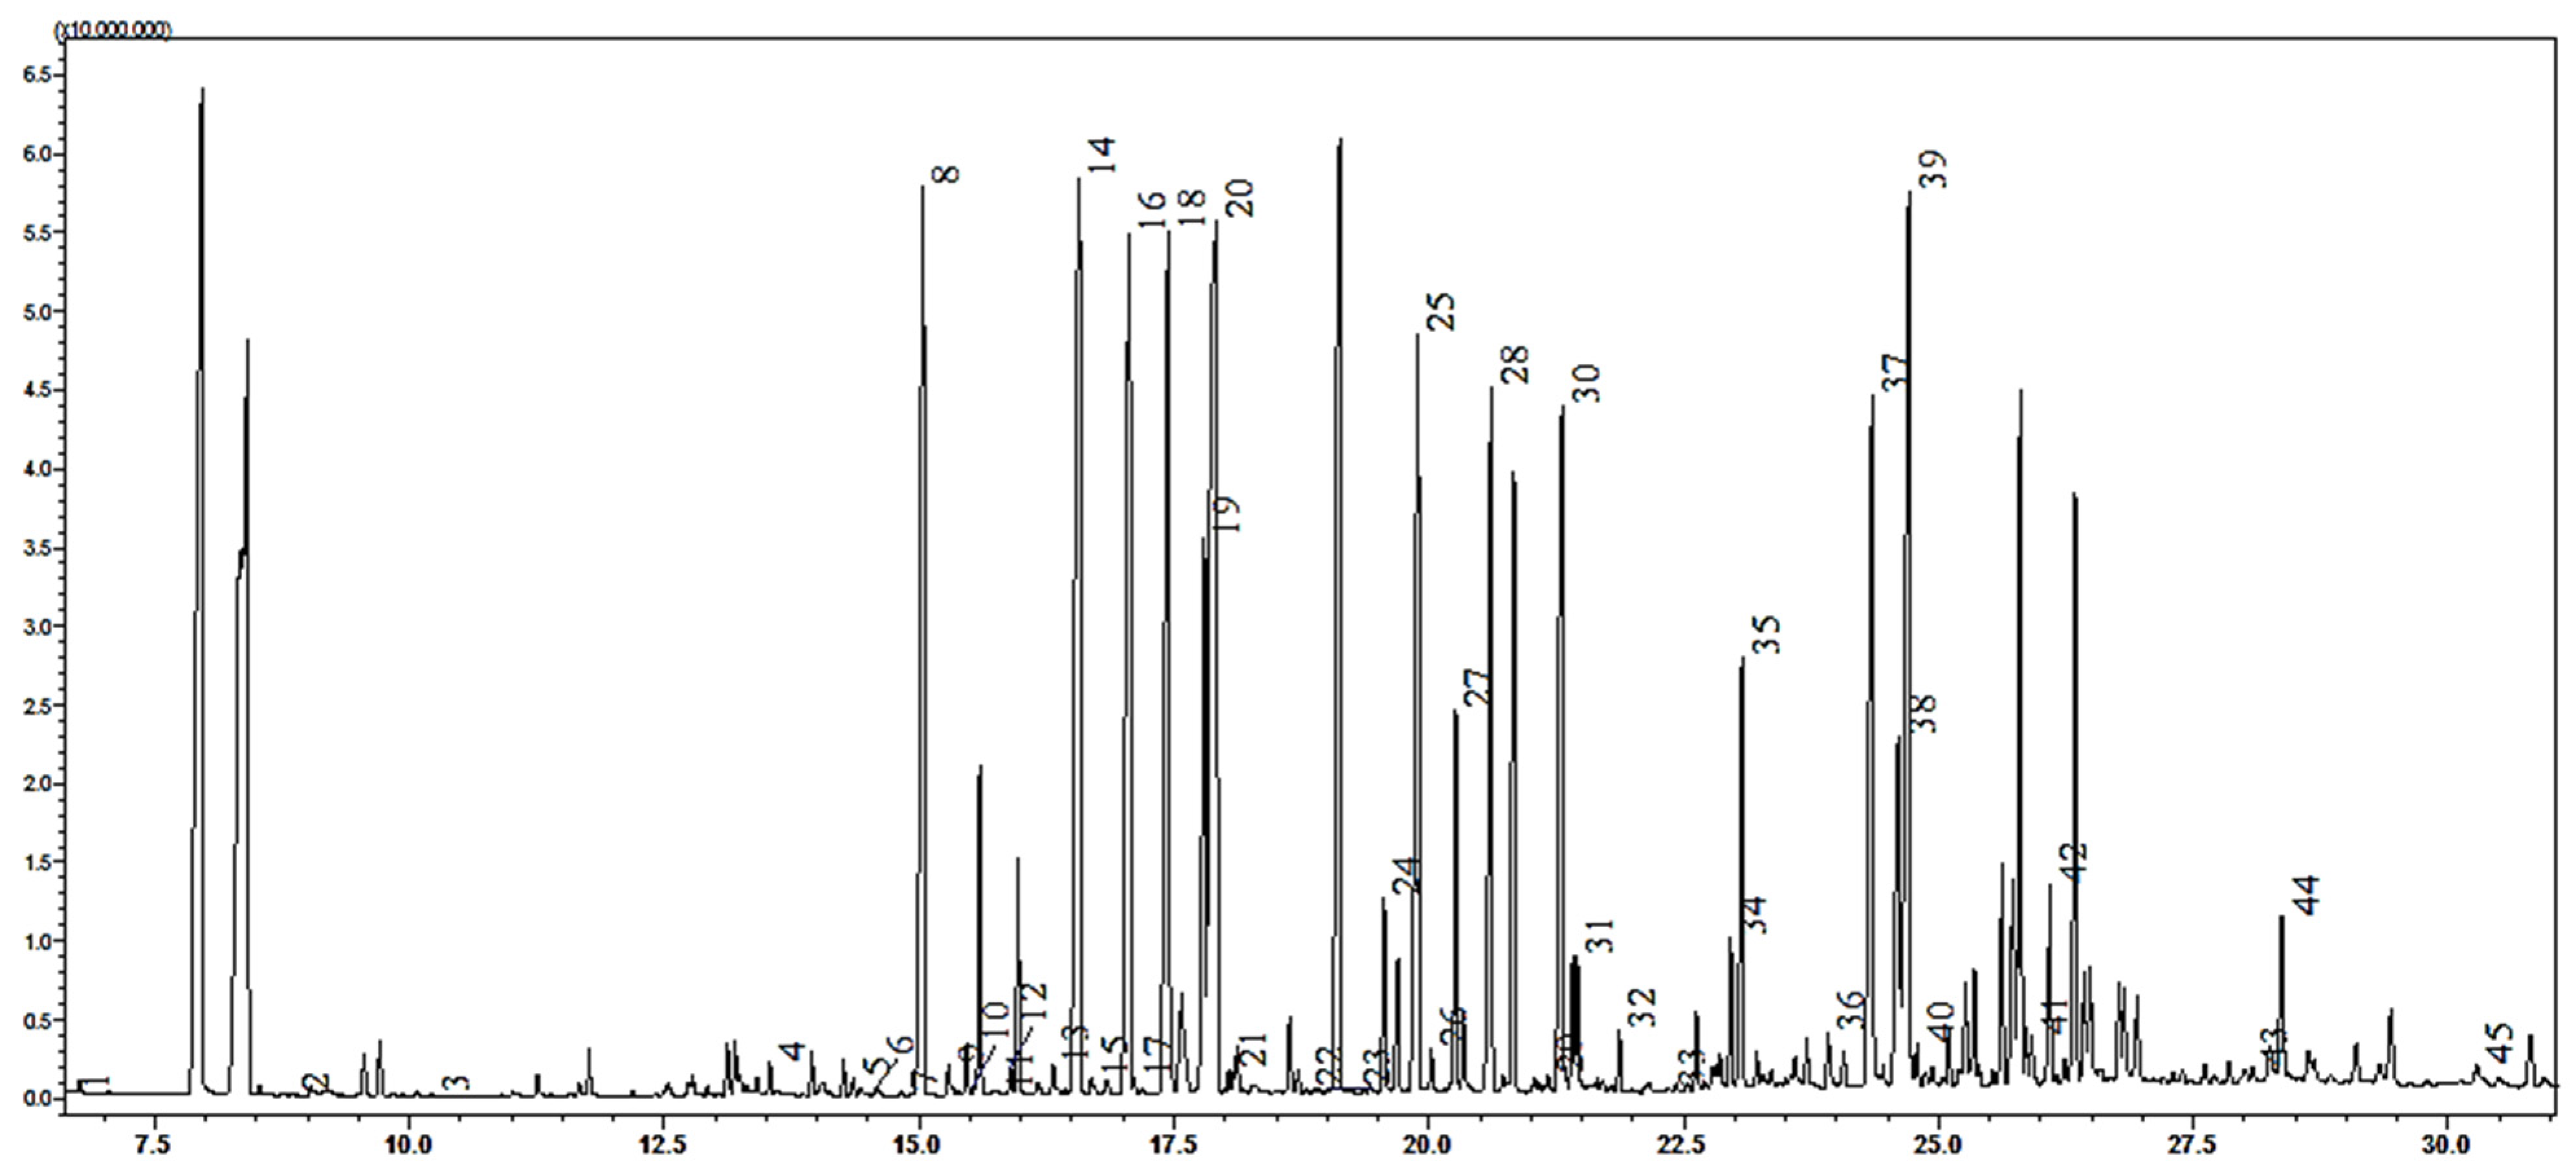
In the current study, we have determined the presence and quantity of 22 amino acids, 14 short-chained carboxylic acids, 7 fatty acids, and 1 phosphorus acid (tris-phosphoric acid) in C. sativus leaves by the GC-MS method. According to the results, 45 different acids are present in Crocus leaves. These are the first complete results of the composition of carboxylic and amino acids in Crocus leaves. Furthermore, this method was used to quantify the acids content in the raw material (Table 6, Figure 2).
L-Glutamine, Isoleucine, L-alanine, L-leucine, L-pyroglutamic, and L-phenylalanine acids were present in large amounts—7374 µg/g, 7965 µg/g, 6744 µg/g, 6955 µg/g, 6233 µg/g, and 6032 µg/g, respectively. High amounts of L-glutamine may be due to the glutamate synthase cycle [46], where L-glutamine is formed from simple compounds, such as ammonia, and only then are other amino acids, such as arginine, tryptophan, histidine, or asparagine, formed [47]. The seven essential amino acids in leaves that were present in high concentration included isoleucine (7965 µg/g), L-leucine (6955 µg/g), L-lysine (866 µg/g), L-methionine (398 µg/g), L-phenylalanine (6032 µg/g), L-threonine (2701 µg/g), L-tryptophan (1186 µg/g), and L-valine (6151 µg/g). As for the total amino acids content in C. sativus leaves, it exceeds 43,174 µg/g and shows that this raw material can be an excellent and underestimated source of proteinogenic amino acids [48], especially glutamine, phenylalanine, isoleucine, alanine, and leucine.
For the composition of amino acids, a high content of isoleucine, L-leucine, L-phenylalanine, L-pyroglutamic acid, L-glutamine, L-alanine, and L-tryptophan was observed along with a low content of L-glycine, which indicates the plant’s response to cold stress [49,50] as well as consistent with previously published data for this genus [51].
Among the organic acids of the tricarboxylic acid cycle (TCA cycle) in C. sativus leaves were found citric acid (834 µg/g), fumaric acid (195 µg/g), and malic acid (925 µg/g), which had the highest content of all short-chain carboxylic acids. In a TCA cycle, citric acid and malic acid are generally the most accumulated organic acids in plants [52]; at the same time, Crocus leaves have an increased content of malic acid during acclimatization to the low temperature [53,54] of Ukraine in the postharvest period. In addition, the path analysis of the effects of different acids on malic acid content revealed that citric acid has a maximum direct effect on malic acid [55]. Furthermore, 3,3-dimethylacrylic acid, 4-hydroxybutanoic acid, and lactic acid were found in amounts of 187 µg/g, 162 µg/g, and 98 µg/g, respectively. The content of other organic acids found did not exceed 50 µg/g. Additionally, polyphenols and organic acids may be responsible for the antioxidant activity of the plant extracts.
The analysis of fatty acids of C. sativus leaves showed that seven acids (myristic acid, palmitic acid, linoelaidic acid, α-linolenic acid, stearic acid, behenic acid, and lignoceric acid) were detected. The total long-chain carboxylic acids content was 63,544 µg/g of the total acids yield and is the largest part of all identified acids in the Crocus leaves. The dominant saturated acid was palmitic (C16:0) in Crocus leaves, with a content of 6997 µg/g, followed by lignocerinic acid (C24:0), with a content of 1611 µg/g. The content of unsaturated fatty acids was two times higher than that of saturated acids.
The GC-MS analyses revealed the essential fatty acids α-linolenic acid (ω3) (22,490 µg/g) and linoelaidic acid (ω6) (9880 µg/g) as major constituents among the acids that were found in Crocus leaves for the first time. The biosynthesis of dienoic and trienoic acids 18:2ω6 and 18:3ω3 plays a defining role in the adaptation of plants to hypothermia. These polyunsaturated fatty acids regulate the “fluidity” of cell membranes in a wide temperature range and influence the resistance of plants to difficult environments. In stressful environments (low temperature, freezing, salinity, drought), the amount of unsaturated fatty acids is much higher than the saturated acids content in the plant organs [56,57]. The high content of linolenic acid in Crocus leaves is probably due precisely to the plant’s adaptation to the low temperatures in Ukraine (December +3/−5 °C) during the harvested period.
The presence of tris-phosphoric acid (1305 µg/g) in Crocus leaves, according to Hu et al. [58], also signals the plant’s response to temperature stress, which is expressed in shifts in the metabolite profile. Tris-phosphoric acid could supply adequate P secondary compounds for cell energy metabolism in stress conditions. In this case, an increase of organic acids (malic acid, citric acid, tris-phosphoric acid), amino acids (isoleucine, pyroglutamic acid, phenylalanine, alanine, glutamine), and unsaturated fatty acids (linoelaidic acid, linoleic acid) for this plant was established. Some of the phenolic compounds and organic acids might be responsible for the high antioxidant activities, antimicrobial activity, blood glucose control, and regulation of lipid abnormalities [59,60]. Thus, the leaves of C. sativus from Ukraine need to be further explored.

3.6. Antibacterial Activity

The results showed that ethanolic and water extracts of C. sativus leaves effectively suppressed the growth of the test strains of microorganisms with variable potency. As indicated in Table 7, the ethanolic and water leaf extracts had the maximum zone of inhibition against B. subtilis at 20.30 ± 0.36 mm and 18.00 ± 0.32 mm, respectively. Both extracts showed almost the same inhibitory effect against four pathogenic strains (E. coli, P. vulgaris, P. aeruginosa, C. albicans). Concerning S. aureus, only ethanolic C. sativus leaves extract showed potential activity, with an inhibition zone of 18.00 ± 0.32 mm. It has been reported previously that the methanolic extract of C. sativus leaves from Morocco [13] did not show antibacterial activity against S. aureus, B. subtilis, P. aeruginosa, and P. mirabilis; however, it had antibacterial activity against Listeria spp. Our data confirmed that the leaf extracts of C. sativus from Ukraine possessed significant (p < 0.05) antibacterial activities against Gram-positive bacteria.
The data of the serial dilutions method showed that the lowest MIC values (125 µg/mL) were demonstrated by both leaf extracts against S. aureus and B. subtilis. In general, the ethanolic extract had lower MIC values than the water extract, due to the chemical composition of the extracts. In addition, this is consistent with the literature data that ethanolic extracts have a higher antimicrobial activity than aqueous extracts [61,62]. In further studies, it is necessary to select an extractant for the maximum yield of phenolic compounds, amino acids, fatty acids, and terpenes in crude extracts of C. sativus leaves for pharmacological assessment. The established antibacterial activity of Crocus leaves may be due to the presence of various phenolic compounds and other classes of plant compounds. Therefore, despite the well-known medicinal properties of C. sativus (saffron) stigma, our research suggests that Crocus leaves may also be used as a valuable plant source of naturally occurring bioactive molecules to develop new functional food and pharmaceutical ingredients, with the potential not only to promote human health but also to improve the biovalorisation of saffron.

4. Conclusions

The results obtained show that C. sativus leaves as a saffron by-product are a good source of phenolic compounds; they contain sufficient amounts of macro- and microelements, essential amino acids, different organic acids, and fatty acids. In addition, the aerial part of Crocus adapts to the weather conditions of Ukraine due to the increased content of polyunsaturated fatty acids and malic acid. The results of antimicrobial analyses showed that Crocus leaf extracts have significantly higher bactericidal activities than fungicidal ones (p < 0.05). This is the first complete study of the chemical composition of Ukrainian C. sativus leaves. Saffron obtained from C. sativus in Ukraine has shown good results as a food spice and, according to ISO 3632, Crocus stigma correspond to the I quality category [29]. Thus, the cultivation of this plant is in demand, and there is a wide raw material base of Crocus leaves for the pharmaceutical industry. The presented study shows the prospects for the integrated use of Crocus raw materials and excludes the formation of production waste.

Author Contributions

Conceptualization and methodology, O.M., R.L., and V.G.; investigation, O.M., I.B., L.S., and L.I.; writing—original draft preparation, O.M.; writing—review and editing, R.L., L.I., and V.G. All authors have read and agreed to the published version of the manuscript.

Funding

This research received no external funding.

Institutional Review Board Statement

Not applicable.

Informed Consent Statement

Not applicable.

Data Availability Statement

UPLC-MS and mass spectra data of compounds will be supplied upon request.

Conflicts of Interest

The authors declare no conflict of interest.

Abbreviations

HPLC-UVHigh-performance liquid chromatography with ultraviolet detection
HPLC-MSHigh-performance liquid chromatography mass spectrometry
GF-AASGraphite furnace atomic absorption spectroscopy
TLCThin-layer chromatography
GAE/ggallic acid equivalent
RE/grutin equivalent
DWdry weight
MTBSTFAN-Methyl-N-tert-butyldimethylsilyltrifluoroacetamide

References

  1. Salmerón-Manzano, E.; Garrido-Cardenas, J.A.; Manzano-Agugliaro, F. Worldwide Research Trends on Medicinal Plants. Int. J. Environ. Res. Public Health 2020, 17, 3376. [Google Scholar] [CrossRef]
  2. Sofowora, A.; Ogunbodede, E.; Onayade, A. The role and place of medicinal plants in the strategies for disease prevention. Afr. J. Tradit. Complement. Altern. Med. 2013, 10, 210–229. [Google Scholar] [CrossRef]
  3. Zagayko, A.L.; Kolisnyk, T.Y.; Chumak, O.I.; Ruban, O.A.; Koshovyi, O.M. Evaluation of anti-obesity and lipid-lowering properties of Vaccinium myrtillus leaves powder extract in a hamster model. J. Basic Clin. Physiol. Pharmacol. 2018, 29, 697–703. [Google Scholar] [CrossRef]
  4. Mykhailenko, O.; Gudžinskas, Z.; Kovalyov, V.; Desenko, V.; Ivanauskas, L.; Bezruk, I.; Georgiyants, V. Effect of ecological factors on the accumulation of phenolic compounds in Iris species from Latvia, Lithuania and Ukraine. Phytochem. Anal. 2020, 31, 1–19. [Google Scholar] [CrossRef] [PubMed]
  5. Fernández, J.A.; Santana, O.; Guardiola, J.L.; Molina, R.V.; Heslop-Harrison, P.; De-Los-Mozos-Pascual, M. The world saffron and Crocus collection: Strategies for establishment, management, characterisation and utilisation. Genet. Resour. Crop Evol. 2011, 58, 125–137. [Google Scholar] [CrossRef] [Green Version]
  6. Mykhailenko, O.; Kovalyov, V.; Goryacha, O.; Ivanauskas, L.; Georgiyants, V. Biologically active compounds and pharmacological activities of species of the genus Crocus: A review. Phytochemistry 2019, 162, 56–89. [Google Scholar] [CrossRef] [PubMed]
  7. Maggi, M.A.; Bisti, S.; Picco, C. Saffron: Chemical composition and neuroprotective activity. Molecules 2020, 25, 5618. [Google Scholar] [CrossRef]
  8. Almodóvar, P.; Briskey, D.; Rao, A.; Prodanov, M.; Inarejos-García, A.M. Bioaccessibility and pharmacokinetics of a commercial saffron (Crocus sativus L.) extract. Evid-Based Compl. Alt. 2020, 2020, 1575730. [Google Scholar] [CrossRef] [Green Version]
  9. Lambrianidou, A.; Koutsougianni, F.; Papapostolou, I.; Dimas, K. Recent advances on the anticancer properties of saffron (Crocus sativus L.) and its major constituents. Molecules 2020, 26, 86. [Google Scholar] [CrossRef] [PubMed]
  10. Moratalla-López, N.; Bagur, M.J.; Lorenzo, C.; Salinas, M.E.M.R.; Alonso, G.L. Bioactivity and bioavailability of the major metabolites of Crocus sativus L. flower. Molecules 2019, 24, 2827. [Google Scholar] [CrossRef] [Green Version]
  11. Sánchez-Vioque, R.; Santana-Méridas, O.; Polissiou, M.; Vioque, J.; Astraka, K.; Alaiz, M.; Herraiz-Peñalver, D.; Tarantilis, P.A.; Girón-Calle, J. Polyphenol composition and in vitro antiproliferative eect of corm, tepal and leaf from Crocus sativus L. on human colon adenarcinoma cells (Caco-2). J. Funct. Foods 2016, 24, 18–25. [Google Scholar] [CrossRef] [Green Version]
  12. Smolskaite, L.; Talou, T.; Fabre, N.; Venskutonis, P.R. Valorization of saffron industry by-products: Bioactive compounds from leaves. In Innovations for Food Science and Production, Proceedings of the 6th Baltic Conference on Food Science and Technology FOODBALT-2011, Jelgava, Latvia, 5–6 May 2011; Straumite, E., Ed.; Faculty of Food Technology: Riga, Latvia, 2011; pp. 67–72. [Google Scholar]
  13. Jadouali, S.M.; Atifi, H.; Bouzoubaa, Z.; Majourhat, K.; Gharby, S.; Achemchem, F.; Elmoslih, A.; Laknifli, A.; Mamouni, R. Chemical characterization, antioxidant and antibacterial activity of Moroccan Crocus sativus L. petals and leaves. J. Mater. Environ. Sci. 2018, 9, 113–118. [Google Scholar] [CrossRef]
  14. Baba, S.A.; Malik, A.H.; Wani, Z.A.; Mohiuddin, T.; Shah, Z.; Abbas, N.; Ashraf, N. Phytochemical analysis and antioxidant activity of different tissue types of Crocus sativus and oxidative stress alleviating potential of saffron extract in plants, bacteria, and yeast. S. Afr. J. Botany 2015, 99, 80–87. [Google Scholar] [CrossRef]
  15. Lahmass, I.; Lamkami, T.; Delporte, C.; Sikdar, S.; Antwerpen, P.V.; Saalaoui, E.; Megalizzi, V. The waste of saffron crop, a cheap source of bioactive compounds. J. Funct. Foods 2017, 35, 341–351. [Google Scholar] [CrossRef]
  16. Morsy, N. Phytochemical analysis of biologically active constituents of medicinal plants. Main Group Chem. 2014, 13, 7–21. [Google Scholar] [CrossRef]
  17. Mykchailenko, O.O.; Kovalyov, V.M. Phenolic compounds of the genus Iris plants (Iridaceae). Ceska. Slov. Farm. 2016, 65, 70–77. [Google Scholar]
  18. SO Ukrainian Scientific Pharmacopoeial Center of Drugs Quality. State Pharmacopoeia of Ukraine, 2nd ed.; SO Ukrainian Scientific Pharmacopoeial Center of Drugs Quality: Kharkiv, Ukraine, 2015; Volume 3. (In Ukrainian)
  19. Ilina, T.; Kashpur, N.; Granica, S.; Bazylko, A.; Shinkovenko, I.; Kovalyova, A.; Goryacha, O.; Koshovyi, O. Phytochemical profiles and in vitro immunomodulatory activity of ethanolic extracts from Galium aparine L. Plants 2019, 8, 541. [Google Scholar] [CrossRef] [Green Version]
  20. Mykhailenko, O.; Korinek, M.; Ivanauskas, L.; Bezruk, I.; Myhal, A.; Petrikaitė, V.; El-Shazly, M.; Yen, C.-H.; Chen, B.-H.; Georgiyants, V.; et al. Qualitative and quantitative analysis of Ukrainian Iris species: A fresh look on their content and biological activities. Molecules 2020, 25, 4588. [Google Scholar] [CrossRef] [PubMed]
  21. European Medicines Agency. Validation of Analytical Procedures: Text and Methodology; Q2 (R1); International Conference on Harmonization Secretariat: Geneva, Switzerland, 2005; p. 17.
  22. Mykhailenko, O.; Ivanauskas, L.; Bezruk, I.; Lesyk, R.; Georgiyants, V. Comparative investigation of amino acids content in the dry extracts of Juno bucharica, Gladiolus hybrid zefir, Iris hungarica, Iris variegata and Crocus sativus raw materials of Ukrainian flora. Sci. Pharm. 2020, 88, 8. [Google Scholar] [CrossRef] [Green Version]
  23. Jarukas, L.; Mykhailenko, O.; Baranauskaite, J.; Marksa, M.; Ivanauskas, L. Investigation of organic acids in saffron stigmas (Crocus sativus L.) extract by derivatization method and determination by GC/MS. Molecules 2020, 25, 3427. [Google Scholar] [CrossRef] [PubMed]
  24. Clinical and Laboratory Standards Institute. Performance Standards for Antimicrobial Susceptibility Testing; Twenty-Second Informational Supplements; Document M100-S22; CLSI: Wayne, PA, USA, 2012; Volume 32, p. 188. [Google Scholar]
  25. Coyle, M.B. Manual of Antimicrobial Susceptibility Testing; American Society for Microbiology: Washington, DC, USA, 2005; p. 236. [Google Scholar]
  26. Kovalev, V.M.; Mykhailenko, O.O.; Krechun, A.V.; Osolodchenko, T.P. Antimicrobial activity of extracts of Iris hungarica and Iris sibirica. Ann. Mechnikov. Inst. 2017, 2, 57–64. [Google Scholar] [CrossRef] [Green Version]
  27. Yuan, Y.; Tang, X.; Jia, Z.; Li, C.; Ma, J.; Zhang, J. The effects of ecological factors on the main medicinal components of Dendrobium officinale under Different Cultivation Modes. Forests 2020, 11, 94. [Google Scholar] [CrossRef] [Green Version]
  28. Liu, W.; Yin, D.; Li, N.; Hou, X.; Wang, D.; Li, D.; Liu, J. Influence of environmental factors on the active substance production and antioxidant activity in Potentilla fruticosa L. and its quality assessment. Sci. Rep. 2016, 6, 28591. [Google Scholar] [CrossRef]
  29. Mykhailenko, O.; Desenko, V.; Ivanauskas, L.; Georgiyants, V. Standard operating procedure of Ukrainian saffron cultivation according with Good Agricultural and Collection Practices to assure quality and traceability. Ind. Crops Prod. 2020, 151, 112376–112387. [Google Scholar] [CrossRef]
  30. Frankel, E.N. Nutritional Benefits of Flavonoids. In Food Factors for Cancer Prevention; Ohigashi, H., Osawa, T., Terao, J., Watanabe, S., Yoshikawa, T., Eds.; Springer: Tokyo, Japan, 1997; pp. 613–616. [Google Scholar] [CrossRef]
  31. Singab, A.N.B.; Ayoub, I.M.; El-Shazly, M.; Korinek, M.; Wu, T.-Y.; Cheng, Y.-B.; Chang, F.-R.; Wu, Y.-C. Shedding the light on Iridaceae: Ethnobotany, phytochemistry and biological activity. Ind. Crops Prod. 2016, 92, 308–335. [Google Scholar] [CrossRef]
  32. Lim, T.K. Edible Medicinal and Non Medicinal Plants; Springer: Dordrecht, The Netherlands, 2014; Volume 8, pp. 77–136. [Google Scholar]
  33. U.S. Department of Agriculture, Agricultural Research Service (USDA). USDA National Nutrient Database for Standard Reference, Release 26. Nutrient Data Laboratory Home Page. 2013. Available online: http://www.ars.usda.gov/ba/bhnrc/ndl (accessed on 9 May 2021).
  34. Fabre, N.; Rustan, I.; de Hoffmann, E.; Quetin-Leclercq, J. Determination of flavone, flavonol, and flavanone aglycones by negative ion liquid chromatography electrospray ion trap mass spectrometry. J. Am. Soc. Mass Spectrom. 2001, 12, 707–715. [Google Scholar] [CrossRef] [Green Version]
  35. Luo, L.; Gao, W.; Zhang, Y.; Liu, C.; Wang, G.; Wu, H.; Gao, W. Integrated phytochemical analysis based on UPLC-MS and network pharmacology approaches to explore the quality control markers for the quality assessment of Trifolium pratense L. Molecules 2020, 25, 3787. [Google Scholar] [CrossRef] [PubMed]
  36. Taiz, L.; Zeiger, E. Plant Physiology, 2nd ed.; Sinauer Association Inc. Publ.: Sunderland, MA, USA, 1998. [Google Scholar] [CrossRef]
  37. Tůma, J.; Skalický, M.; Tůmová, L.; Bláhová, P.; Rosůlková, M. Potassium, magnesium and calcium content in individual parts of Phaseolus vulgaris L. plant as related to potassium and magnesium nutrition. Plant Soil Environ. 2004, 50, 18–26. [Google Scholar] [CrossRef] [Green Version]
  38. Marschner, H. Mineral Nutrition of Higher Plants, 2nd ed.; Academic Press Inc.: London, UK, 1997; 889p. [Google Scholar]
  39. Tůma, J.; Matula, J. The effect of gradated nitrogen application rates on the yield, nutritive value, and mineral composition of orchard-grass herbage. Rostl. Výr. 1994, 40, 241–252. [Google Scholar]
  40. Gresta, F.; Avola, G.; Lombardo, G.M.; Siracusa, L.; Ruberto, G. Analysis of flowering, stigmas yield and qualitative traits of saffron (Crocus sativus L.) as affected by environmental conditions. Sci. Hort. 2009, 119, 320–324. [Google Scholar] [CrossRef]
  41. Del Campo, C.P.; Garde-Cerdan, T.; Sanchez, A.M.; Maggi, L.; Carmona, M.; Alonso, G.L. Determination of free amino acids and ammonium ion in saffron (Crocus sativus L.) from different geographical origins. Food Chem. 2009, 114, 1542–1548. [Google Scholar] [CrossRef]
  42. Feizy, J.; Reyhani, N. Gas chromatographic determination of phytosterols and fatty acids profile in saffron petals. Can. Chem. Trans. 2016, 4, 389–397. [Google Scholar] [CrossRef]
  43. Zheng, C.J.; Li, L.; Ma, W.H.; Han, T.; Qin, L.P. Chemical constituents and bioactivities of the liposoluble fraction from different medicinal parts of Crocus sativus. Pharm. Biol. 2011, 49, 756–763. [Google Scholar] [CrossRef] [Green Version]
  44. Masuda, A.; Mori, K.; Miyazawa, M. Comparative analysis of volatile compounds from corms of Crocus sativus and C. vernus. Chem. Nat. Com. 2012, 48, 319–321. [Google Scholar] [CrossRef]
  45. Bagri, J.; Yadav, A.; Anwar, K.; Dkhar, J.; Singla-Pareek, S.L.; Pareek, A. Metabolic shift in sugars and amino acids regulates sprouting in Saffron corm. Sci. Rep. 2017, 7, 11904–11914. [Google Scholar] [CrossRef] [Green Version]
  46. Walker, M.C.; van der Donk, W.A. The many roles of glutamate in metabolism. J. Ind. Microbiol. Biotechnol. 2016, 43, 419–430. [Google Scholar] [CrossRef] [Green Version]
  47. Keller, B.; Keller, E.; Salcher, O.; Lingens, F. Arogenate (Pretyrosine) pathway of tyrosine and phenylalanine biosynthesis in Pseudomonas aureofaciens ATCC 15926. Microbiology 1982, 128, 1199–1202. [Google Scholar] [CrossRef] [PubMed] [Green Version]
  48. Ayon, N.J. Features, roles and chiral analyses of proteinogenic amino acids. AIMS Mol. Sci. 2020, 7, 229–268. [Google Scholar] [CrossRef]
  49. Taïbi, K.; Del Campo, A.D.; Vilagrosa, A.; Bellés, J.M.; López-Gresa, M.P.; López-Nicolás, J.M.; Mulet, J.M. Distinctive physiological and molecular responses to cold stress among cold-tolerant and cold-sensitive Pinus halepensis seed sources. BMC Plant Biol. 2018, 18, 236–247. [Google Scholar] [CrossRef] [PubMed] [Green Version]
  50. Chen, T.H.H.; Uemura, M.; Fujikawa, S. Cold Hardiness in Plants: Molecular Genetics, Cell Biology, and Physiology; CABI Publishing: Wallingford, UK, 2006. [Google Scholar]
  51. Pastor-Férriz, T.; De-los-Mozos-Pascual, M.; Renau-Morata, B.; Nebauer, S.G.; Sanchis, E.; Busconi, M.; Fernández, J.A.; Kamenetsky, R.; Molina, R.V. Ongoing evolution in the genus Crocus: Diversity of flowering strategies on the way to hysteranthy. Plants 2021, 10, 477. [Google Scholar] [CrossRef]
  52. Igamberdiev, A.U.; Eprintsev, A.T. Organic acids: The pools of fixed carbon involved in redox regulation and energy balance in higher plants. Front. Plant Sci. 2016, 7, 1042. [Google Scholar] [CrossRef] [Green Version]
  53. Crecelius, F.; Streb, P.; Feierabend, J. Malate metabolism and reactions of oxido reduction in cold-hardened winter rye (Secale cereale L.) leaves. J. Exp. Bot. 2003, 54, 1075–1083. [Google Scholar] [CrossRef] [Green Version]
  54. Streb, P.; Josse, E.; Gallouet, E.; Baptist, F.; Kuntz, M.; Cornic, G. Evidence for alternative electron sinks to photosynthetic carbon assimilation in the high mountain plant species Ranunculus glacialis. Plant Cell Environ. 2005, 28, 1123–1135. [Google Scholar] [CrossRef]
  55. Kumar, V.; Sharma, A.; Bhardwaj, R.; Thukral, A.K. Analysis of organic acids of tricarboxylic acid cycle in plants using GC-MS, and system modeling. J. Anal. Sci. Technol. 2017, 8, 20–29. [Google Scholar] [CrossRef]
  56. Upchurch, R.G. Fatty acid unsaturation, mobilization, and regulation in the response of plants to stress. Biotechnol. Lett. 2008, 30, 967–977. [Google Scholar] [CrossRef]
  57. Mykhailenko, O.; Kovalyov, V.; Kovalyov, S.; Toryanik, E.; Osolodchenko, T.; Buidin, Y. Fatty acid composition of lipids of Iris sibirica. Ceska Slov. Farm. 2017, 66, 220–227. [Google Scholar]
  58. Hu, T.; Liu, S.Q.; Amombo, E.; Fu, J.M. Stress memory induced rearrangements of HSP transcription, photosystem II photochemistry and metabolism of tall fescue (Festuca arundinacea Schreb.) in response to high-temperature stress. Front. Plant Sci. 2015, 16, 403. [Google Scholar] [CrossRef] [Green Version]
  59. Liu, Q.; Tang, G.Y.; Zhao, C.N.; Feng, X.L.; Xu, X.Y.; Cao, S.Y.; Meng, X.; Li, S.; Gan, R.Y.; Li, H.B. Comparison of antioxidant activities of different grape varieties. Molecules 2018, 23, 2432. [Google Scholar] [CrossRef] [Green Version]
  60. Liu, Q.; Tang, G.Y.; Zhao, C.N.; Gan, R.Y.; Li, H.B. Antioxidant activities, phenolic profiles, and organic acid contents of fruit vinegars. Antioxidants 2019, 8, 78. [Google Scholar] [CrossRef] [Green Version]
  61. Al-Hashimi, A.G. Antioxidant and antibacterial activities of Hibiscus sabdariffa L. extracts. Afr. J. Food Sci. 2012, 6, 506–511. [Google Scholar] [CrossRef]
  62. Xu, D.H.; Huang, Y.S.; Jiang, D.Q.; Yuan, K. The essential oils chemical compositions and antimicrobial, antioxidant activities and toxicity of three Hyptis species. Pharm. Biol. 2013, 51, 1125–1130. [Google Scholar] [CrossRef]
Figure 1. HPLC-DAD chromatogram of the methanolic extract of C. sativus leaves: chlorogenic acid (1), mangiferin (2), ononin (3), trans-cinnamic acid (4), kaempferol (5), and irigenin (6).
Scipharm 89 00028 g001
Figure 2. GC-MS chromatograms of the simultaneous study of fatty acids, short-chained carboxylic acids, and amino acids in C. sativus leaves from Ukraine.
Scipharm 89 00028 g002
Table 1. Qualitative analysis of biological active compounds in C. sativus leaves.
Group of BACsTestReactions
XanthonesTLC: n-butanol–acetic acid–water (4:1:2); 15% acetic acid++
FlavonoidsAlCl3 test, Ammonia test, Shinoda; cyanidine reaction by Bryant. TLC: n-butanol–acetic acid–water (4:1:2)+++
CoumarinsLactone reaction; formation of azo dye-
Hydroxycinnamic acidsTLC: n-butanol–acetic acid–water (4:1:2); 15% acetic acid+++
TanninsFerric chloride; gelatin solution; quinine hydrochloride solution+++
AlkaloidsDragendorff, Mayer’test-
SaponinsFoam test, Lieberman-Bourchard++
Amino acids0.25% Ninhydrin+++
ProteinsXantoproteica++
TriterpenoidsSalkowski++
PolysaccaridesMolisch reaction++
Note: evaluation of reactions: “-”—any reaction; “+”—weak reaction; “++”—strong reaction, but with some deficiencies in coloration; “+++”—best reaction.
Table 2. HPLC identification of the major constituents of C. sativus leaf extracts: chromatographic, UV, mass spectroscopic data of identified compounds, and their content (mg/g).
Peak NotR (min)UV λmax (nm)Mol. FormulaMol. Weight, g/molRetention Time, min (UPLC-MS)[M-H] (m/z)Fragment Ions (−)CompoundContent, mg/g
111.66218, 241, 327C16H8O9354.313.69353191, 179, 135 Chlorogenic acid0.31 ± 0.01
214.18240, 318, 257, 365C19H18O11422.304.21421403, 331, 301, 259, 271Mangiferin1.26 ± 0.02
339.11250C22H22O9430.40---Ononin0.04 ± 0.00
444.76322, 276C9H8O2148.166.80147103trans-Cinnamic acid0.15 ± 0.00
548.99265, 365C15H10O6286.247.41285239, 187Kaempferol0.03 ± 0.00
649.78269C18H16O8360.307.58359344, 329, 314, 286, 258Irigenin0.002 ± 0.00
Values of mean ± standard deviation are reported. Statistical comparisons were performed using ANOVA test (p < 0.05).
Table 3. Calibration curves, limit of detection (LOD), and limit of quantification (LOQ) data of 6 phenolic reference compounds.
Peak NoCompoundCalibration Curve aCorrelation Coefficient r2 (n = 6)Linear Range (μg/mL)RSD (%)LOD b (ng/mL)LOQ c (ng/mL)
1Chlorogenic acidy = 29930.2x − 538.3610.99990.36–461.292070
2Mangiferin y = 29263.5x + 13863.90.99970.28–145.001.32310940
3Ononiny = 37456.2x + 5132.420.99980.21–26.241.2949150
4trans-Cinnamic acidy = 78502.3x + 01.00000.30–38.750.123090
5Kaempheroly = 29888.8x + 1814.270.99990.14–18.320.9037110
6Irigeniny = 81832.6x + 1376680.99940.54–277.000.6450160
a Compound concentration (mg/mL); y, peak area; b LOD, limit of detection (S/N = 3); c LOQ, limit of quantification (S/N = 10).
Table 4. Precision and stability of 6 quantified compounds.
Peak No.CompoundConcentration (µg/mL)PrecisionRepeatability
Intra-Day (n = 3)Inter-Day (n = 3)Recovery (%)RSD (%)
RSD (%)Accuracy (%)RSD (%)Accuracy (%)
1Chlorogenic acid5.751.31101.120.3898.40100.690.86
230.4299.080.7399.4399.581.05
460.96100.270.4898.24101.910.97
2Mangiferin9.060.33100.460.29100.41100.290.25
36.250.2499.660.32100.45100.030.39
1450.22100.321.1098.4599.580.99
3Ononin3.280.81100.120.3298.39100.560.79
13.120.69100.440.7599.08100.720.93
26.240.8499.500.82100.0099.750.75
4trans-Cinnamic acid4.770.68100.410.62100.0999.410.29
21.011.0999.550.80100.9799.550.31
38.7951.1098.990.47101.5399.990.56
5Kaempherol2.290.48100.690.4499.81100.350.49
9.160.77100.971.0199.54100.490.68
18.321.1499.661.12100.8499.830.34
6Irigenin17.311.08101.541.29101.84101.120.98
69.250.80101.141.16101.65100.930.84
2770.3399.530.2099.7199.740.24
Table 5. Mineral profile of C. sativus leaves.
MineralContent, mg/100 gMineralContent, mg/100 g
Fe60.02 ± 1.05Mg6.73 ± 0.12
Si395.11 ± 9.95Pb0.03 ± 0.01
Al73.21 ± 1.28Mo0.06 ± 0.01
Mn8.04 ± 1.14P130.04 ± 2.29
K1525.10 ± 26.81Ni0.06 ± 0.01
Ca550.12 ± 9.67Cu0.30 ± 0.01
Zn7.30 ± 0.13Na75.02 ± 1.32
Sr2.41 ± 0.04
Co < 0.03; Cd < 0.01; As < 0.01; Hg < 0.01. Values of mean ± standard deviation are reported. Statistical comparisons were performed using ANOVA test (p < 0.05).
Table 6. The content of carboxylic acids and amino acids in C. sativus leaves, µg/g.
Peak No. *tR (min)CompoundChemical FormulaMolar Mass, g·mol−1Mass
Peaks
Content
Carboxylic acids
16.71Butyric Acid C4H8O288.1123511.97 ± 0.21
28.85Crotonic acidC4H6O286.093075.10 ± 0.09
310.23Formic acidCH2O246.032544.03 ± 0.07
413.543,3-Dimethylacrylic acidC5H8O2100.12308187.72 ± 0.30
514.36Lactic acidC3H6O390.0827198.93 ± 1.74
614.59Glycolic acidC2H4O376.0528551.90 ± 0.91
714.83Phenylacetic acidC8H8O2136.1528233.83 ± 0.60
1015.543-Hydroxypropionic acidC3H6O390.0825221.85 ± 0.38
1115.77Malonic acidC3H4O4104.0624529.23 ± 0.51
1516.694-Hydroxybutanoic acidC4H8O3104.10310162.36 ± 2.85
2118.04Fumaric acidC4H4O4116.07280195.59 ± 3.44
2218.80Glutaric acidC5H8O4132.1132051.19 ± 0.90
2921.17Myristic acidC14H28O2228.37274304.08 ± 5.35
3121.46Malic acidC4H6O5134.09324925.24 ± 16.27
3523.07Palmitic AcidC16H32O2256.424026997.26 ± 123.03
3824.60Linoelaidic acidC18H32O2280.404349880.26 ± 173.72
3924.71α-Linolenic acidC18H30O2278.4044122,490.08 ± 395.43
4024.79Stearic acidC18H36O2284.50336974.33 ± 17.13
4125.91Citric acidC6H8O7192.12376834.86 ± 14.68
4328.08Behenic acidC22H44O2340.60346916.91 ± 16.12
4530.28Lignoceric acid C24H48O2368.603341611.20 ± 28.33
Amino acids
1617.07L-LeucineC6H13NO2131.173976955.65 ± 122.30
1717.11L-SerineC3H7NO3105.0929135.87 ± 0.63
1817.44IsoleucineC6H13NO2131.174007965.70 ± 140.06
1917.80γ-Aminobutyric acid (recalculated to Glutamic acid)C4H9NO2103.123662809.52 ± 49.40
2017.92L-ProlineC5H9NO2115.133701725.11 ± 30.33
2319.01L-Aspartic acid (recalculated to Glutamic acid)C4H7NO4133.1024238.54 ± 0.68
2519.90L-Pyroglutamic acidC5H7NO3129.114396233.15 ± 109.60
2620.03L-MethionineC5H11NO2S149.21344398.40 ± 7.00
2720.26L-SerineC3H7NO3105.09414920.59 ± 16.19
2820.61L-ThreonineC4H9NO3119.124432701.71 ± 47.50
3021.30L-PhenylalanineC9H11NO2165.194326032.94 ± 106.07
3221.87L-Aspartic acid (recalculated to Glutamic acid)C4H7NO4133.10399350.57 ± 6.16
3322.36L-CysteineC3H7NO2S121.1629338.71 ± 0.68
3422.96L-Glutamic acidC5H9NO4147.134171000.94 ± 17.60
3623.91L-LysineC6H14N2O2146.19424866.09 ± 15.23
3724.35L-GlutamineC5H10N2O3146.144487374.10 ± 129.66
4226.09L-TyrosineC9H11NO3181.19450837.27 ± 14.72
4428.37L-Tryptophan (recalculated to Proline)C11H12N2O2204.224301186.92 ± 20.87
Phosphorus Compound
2419.56Tris-Phosphoric acidC24H51O4P434.64171305.02 ± 22.05
Total short-chained carboxylic acids2613.80
Total long-chain carboxylic acids63,544.28
Total amount of aminoacids43,174.12
Other compounds1305.02
*—The numbering of compounds in Table 6 and Figure 2 are identical. Values of mean ± standard deviation are reported. Statistical comparisons were performed using ANOVA test (p < 0.05).
Table 7. Antimicrobial activity and minimum inhibitory concentration (MIC) of C. sativus leaf extracts.
Test StrainsWater ExtractEthanolic ExtractChlorophyllipt
Zone of Inhibition (mm)MIC Values (μg/mL)Zone of Inhibition (mm)MIC Values (μg/mL)
S. aureus 25,923 ATCC16.55 ± 0.30125 18.00 ± 0.32125 22.50 ± 0.40
E. coli 25,922 ATCC16.00 ± 0.2825016.70 ± 0.30250 12.50 ± 0.22
P. vulgaris 4636 NCTC16.50 ± 0.30500 17.00 ± 0.30250 growth
P. aeruginosa 27,853 ATCC15.40 ± 0.27500 15.60 ± 0.27250 growth
B. subtilis 6633 ATCC18.00 ± 0.32125 20.30 ± 0.36125 growth
C. albicans 885/653 ATCC15.20 ± 0.27250 15.70 ± 0.28125 growth
The difference is relatively accurate to control, (p ≤ 0.05).
Publisher’s Note: MDPI stays neutral with regard to jurisdictional claims in published maps and institutional affiliations.

