
A Comprehensive Spectroscopic Analysis of the Ibuprofen Binding with Human Serum Albumin, Part II


1
Faculty of Chemistry, University of Opole, Oleska 48, 45-052 Opole, Poland
2
Institute of Chemistry, University of Silesia in Katowice, Szkolna 9, 40-006 Katowice, Poland
*
Author to whom correspondence should be addressed.
Sci. Pharm. 2021, 89(3), 30; https://0-doi-org.brum.beds.ac.uk/10.3390/scipharm89030030
Submission received: 30 April 2021
/
Revised: 30 May 2021
/
Accepted: 11 June 2021
/
Published: 22 June 2021
(This article belongs to the Special Issue Feature Papers in Scientia Pharmaceutica)
Abstract
:Human serum albumin (HSA) is the most abundant human plasma protein. HSA plays a crucial role in many binding endos- and exogenous substances, which affects their pharmacological effect. The innovative aspect of the study is not only the interaction of fatted (HSA) and defatted (dHSA) human serum albumin with ibuprofen (IBU), but the analysis of the influence of temperature on the structural modifications of albumin and the interaction between the drug and proteins from the temperature characteristic of near hypothermia (308 K) to the temperature reflecting inflammation in the body (312 K and 314 K). Ibuprofen is a non-steroidal anti-inflammatory drug. IBU is used to relieve acute pain, inflammation, and fever. To determine ibuprofen’s binding site in the tertiary structure of HSA and dHSA, fluorescence spectroscopy was used. On its basis, the fluorescent emissive spectra of albumin (5 × 10⁻⁶ mol/dm3) without and with the presence of ibuprofen (1 × 10⁻⁵–1 × 10⁻⁴ mol/dm3) was recorded. The IBU-HSA complex’s fluorescence was excited by radiation of wavelengths of λex 275 nm and λex 295 nm. Spectrophotometric spectroscopy allowed for recording the absorbance spectra (zero-order and second derivative absorption spectra) of HSA and dHSA under the influence of ibuprofen (1 × 10⁻⁴ mol/dm3). To characterize the changes of albumin structure the presence of IBU, circular dichroism was used. The data obtained show that the presence of fatty acids and human serum albumin temperature influences the strength and type of interaction between serum albumin and drug. Ibuprofen binds more strongly to defatted human serum albumin than to albumin in the presence of fatty acids. Additionally, stronger complexes are formed with increasing temperatures. The competitive binding of ibuprofen and fatty acids to albumin may influence the concentration of free drug fraction and thus its therapeutic effect.
1. Introduction
Serum albumin is the most frequently occurring protein in blood plasma [1,2,3]. A standard concentration of albumin in plasma is in the range of 35–45 g/L [4,5]. Human serum albumin (HSA) forms a heart-shaped molecule consist of 585 amino acid residues. HSA is characterized by a high cysteine content and low tryptophan content [1,4,5,6]. Crystal structure analysis of human serum albumin revealed that HSA contains three homologous domains (I–III). All domains are divided into two subdomains A and B, composed of four and six α-helices [1,6]. Human serum albumin exhibits the ability to bind many endogenous and exogenous ligands such as drugs, fatty acids, amino acids, hormones, vitamins [5,7,8]. Sudlow and Carter conducted studies that proved specific sites in the human serum albumin structure bind to drugs—binding sites I and II [7,9,10,11]. The first binding site, called the warfarin or phenylbutazone binding site, is located in subdomain IIA. The typical ligands for the first binding site are dicarboxylic acids and large, negatively charged heterocyclic compounds. The second binding site is called the indoles binding site, and the benzodiazepines binding site is located in subdomain IIIA. The typical ligands for the second binding site are aromatic carboxylic acids with ionized COO− group outlying from their hydrophobic center, for example, non-steroidal anti-inflammatory drugs [1,7,9,10,11,12].
In this work, an analysis was performed of the conformational changes of human serum albumin caused by interaction with ibuprofen in the presence and absence of fatty acids.
Ibuprofen ((RS)-2-(4-(2-methylpropyl) phenyl) propanoic acid, IBU) is a non-steroidal anti-inflammatory drug (NSAIDs) belonging to the group of propionic acid derivatives. Ibuprofen is the most widely used over-the-counter non-steroidal anti-inflammatory drug [13,14]. Ibuprofen belongs to a nonselective cyclooxygenase enzyme (COX) inhibitor. It takes part in inhibiting the cyclooxygenase enzymes COX-1 and COX-2 [15]. Ibuprofen exhibiting a high affinity for plasma proteins. The primary binding sites for ibuprofen in the HSA are found in subdomain IIA, IIB, and IIIA [13]. According to the Food and Drug Administration (FDA) recommendations, ibuprofen can be used to treat migraine pain, sore throat, pain caused by colds or flu, rheumatoid disorders, inflammatory diseases, muscle sprains, or strains, joint aches. Ibuprofen is also indicated as an antipyretic, used for fever reduction in both adults and children [16,17].
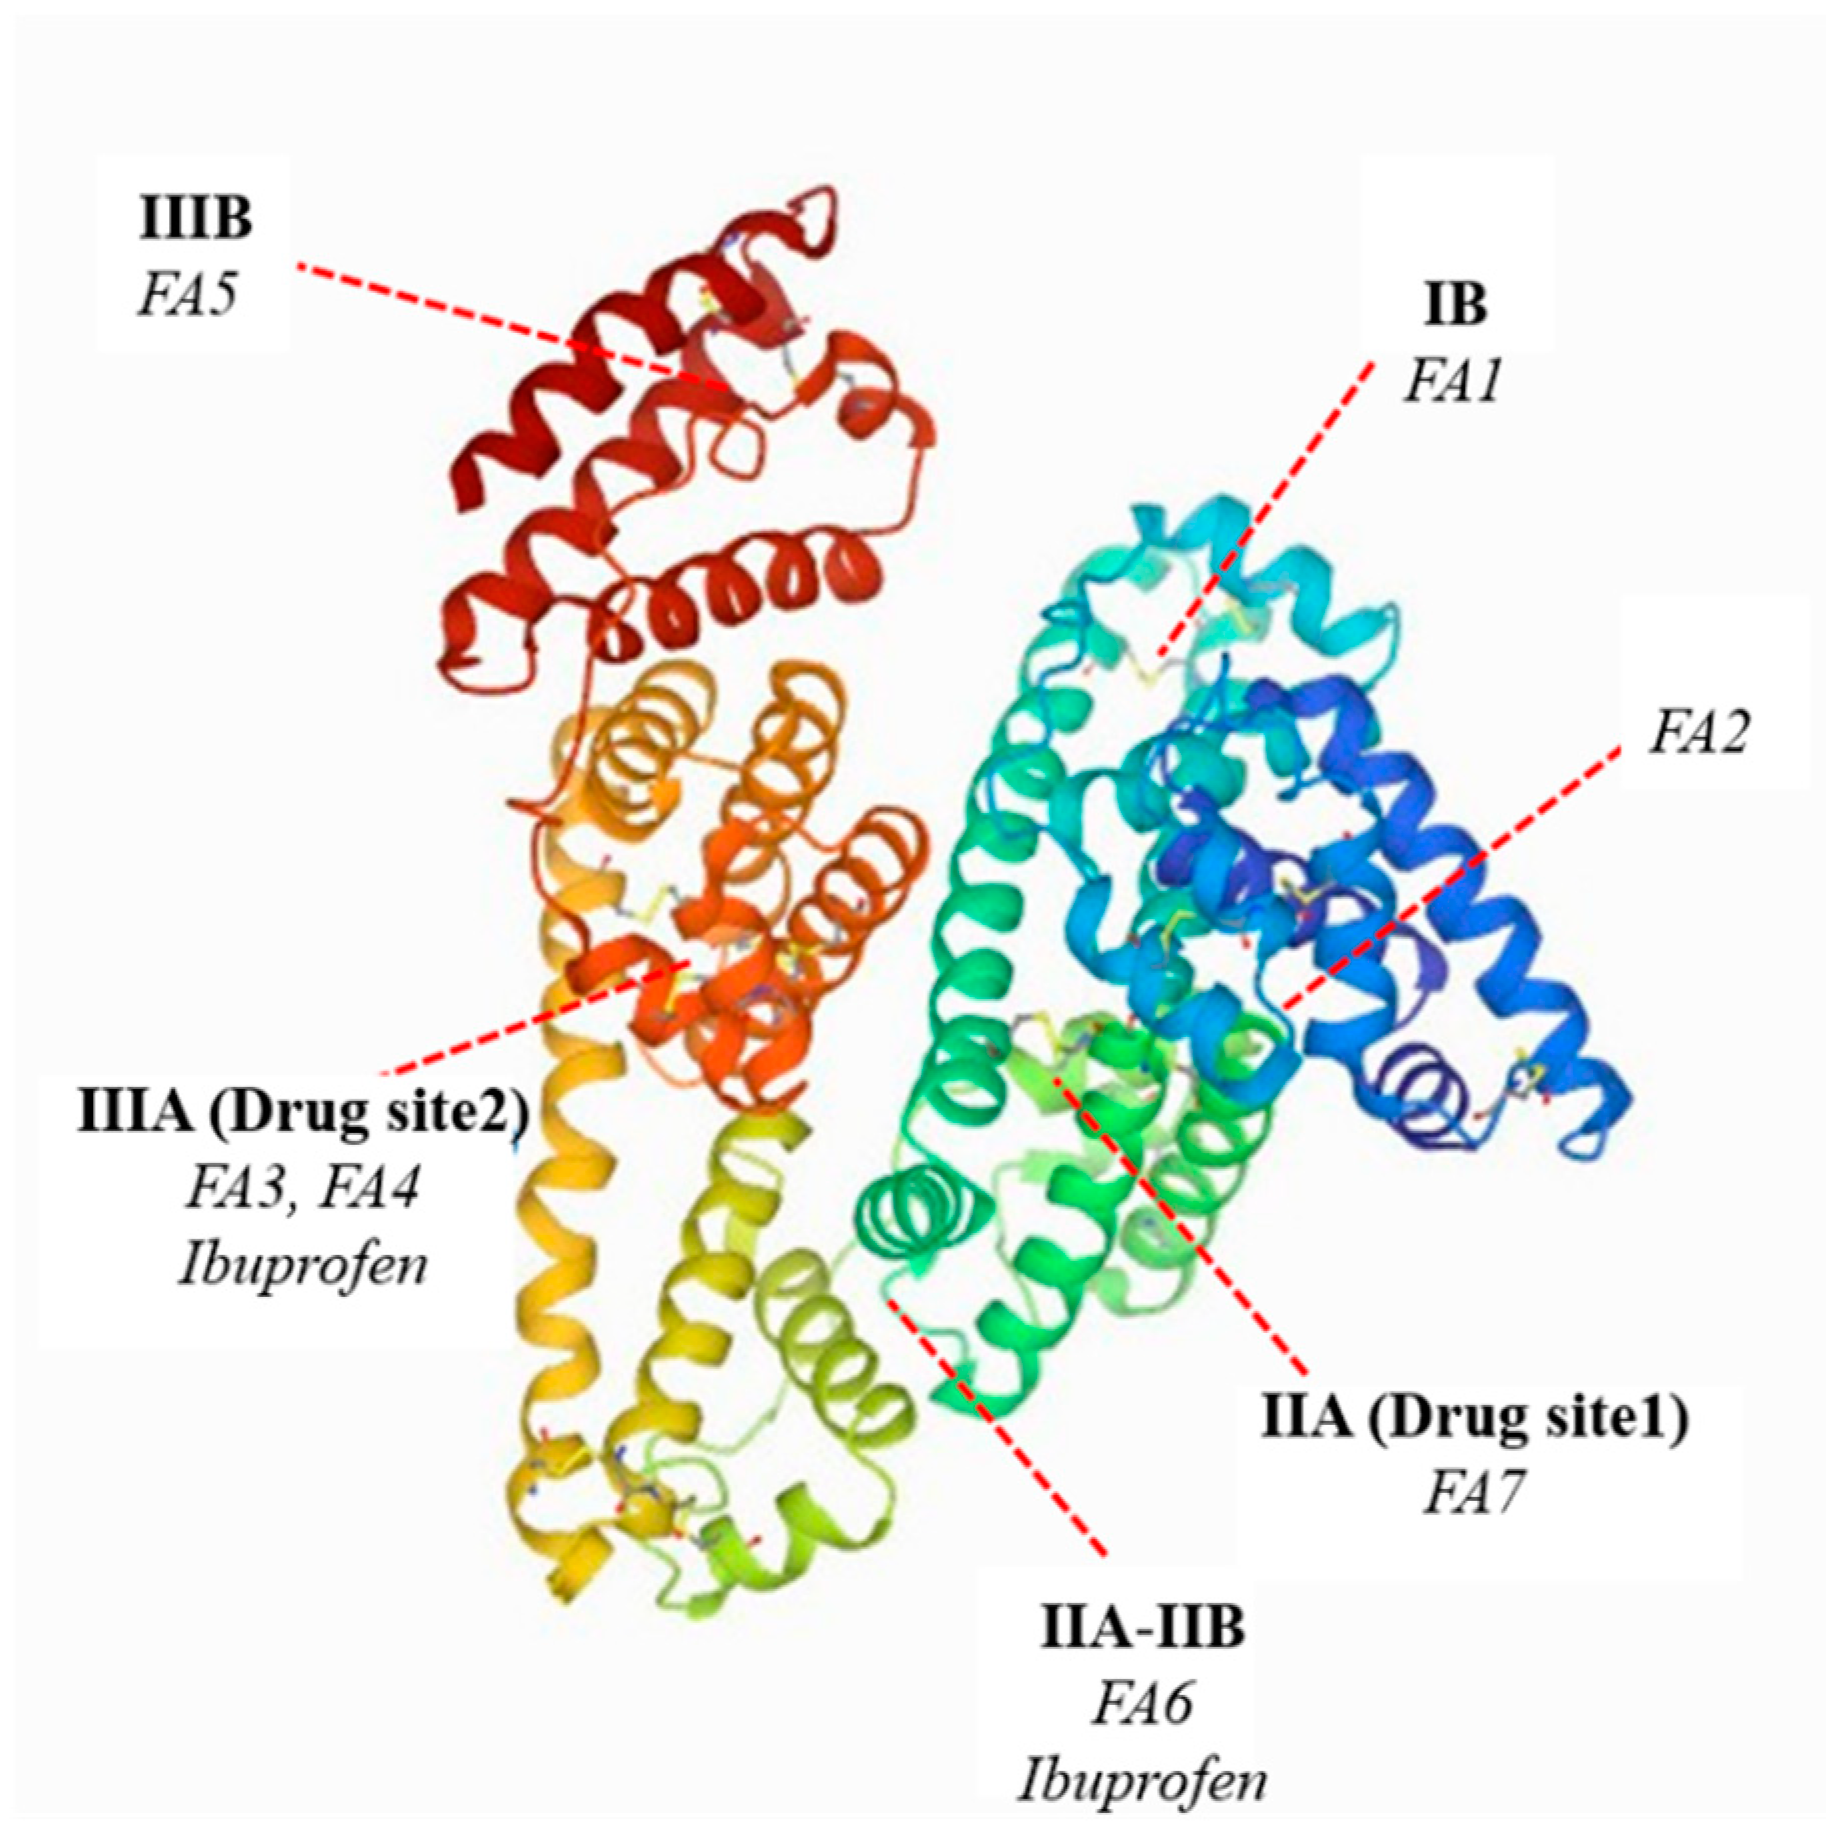
Fatty acids (FA) play an important role in the human body’s energy metabolism but are not soluble in aqueous solutions, for example, in blood plasma and interstitial fluids. To increase fatty acids concentration in vascular and interstitial compartments is need binding protein such as albumin, which binds fatty acids in extracellular fluids [18]. The tertiary structure of HSA and its interaction with fatty acids have been studied over the past decades using X-ray crystallography and NMR spectroscopy [19]. The affinity of fatty acids to albumin depends on the chemical structure of fatty acids, e.g., on the length of the chain and the position of the double bonds in the case of unsaturated acids [20]. The crystal structure of the SA-FAs complex showed that fatty acids bind at seven binding sites in the tertiary structure of albumin [18,20]. The major binding sites for fatty acids in the human serum albumin are found in subdomain IB (FA1), IIA (FA7), IIA-IIB (FA6), IIIA (FA3 and FA4), IIIB, and between domain I and II (FA2) (Scheme 1) [21].
The fatty acid-binding sites shown in the diagram (Scheme 1) bind medium-chain, long-chain, monounsaturated, and also polyunsaturated fatty acids [23]. As a result of the interaction between fatty acids and the albumin molecule, dramatic changes in the conformation of the spatial structure of protein occur. There is a significant left-shift of subdomain I and III in relation to the central subdomain II and rotation of the side chains of amino acid residues, which has been confirmed by X-ray crystallographic studies [12]. In consequence, changes in the biological properties of the protein occur. Similar conclusions were made by Yamasaki in his study on the influence of long-chain fatty acids on the ligand binding interaction at two main drug binding sites (drug sites I and II) in human serum albumin. Their results indicate that the fatty acids present in human serum albumin not only contribute to changing the conformation of the protein structure but also modify individual ligand binding to albumin and interaction between the ligands [24].
Competition between ligands such as drugs and fatty acids is unlikely. Still, the fatty acids can occupy several binding sites in the tertiary structure of albumin and cause instability in the drug-protein complex. In the case of IBU–HSA and IBU–dHSA interactions, fatty acids may compete with ibuprofen for the binding site IIIA and IIA-IIB. Therefore the most important aspect of research is estimating the binding parameters for a drug-albumin complex, which provides information on changes in protein-drug affinity in the presence of fatty acids in the temperature range of 308–314 K [25,26,27]. The temperature of 308 K is the temperature close to the extreme therapeutic value of hypothermia (307 K) used in clinical conditions [28]. The temperature of 310 K is the temperature corresponding to physiological conditions. The temperature of 312 K and 314 K correspond to inflammation in the human body.
The aim of our research was to show the influence of the presence of fatty acids on changes in the concentration of the free drug fraction, which is of significant pharmacological importance. The combination of research techniques such as circular dichroism and spectrofluorescence allowed the identification of significant differences in drug binding to serum albumin.
2. Materials and Methods
2.1. Chemicals
Fatted and defatted human serum albumin (HSA and dHSA) fraction V were obtained from MP Biomedicals LLC (Illkirch, France). Ibuprofen (IBU), sodium dihydrogen phosphate (Na2HPO4), dipotassium phosphate (K2HPO4), and methanol were purchased from Sigma-Aldrich Chemical Co. (Darmstadt, Germany). All reagents and solvents were of the highest analytical quality.
2.2. Solutions and Sample Preparation
A 0.05 M phosphate-buffered saline solution (PBS) at pH 7.4 was prepared by dissolving 3.4836 g of K2HPO4 and 0.6000 g of NaH2PO4 with the appropriate amount of distilled water. For human serum albumin-ibuprofen interaction analysis, a stock solution of ibuprofen at 1.5 × 10⁻² M concentration was prepared in methanol. The methanol content in the samples did not exceed 1% of the tested protein solution total volume. Fatted (HSA) and defatted (dHSA) human serum albumin at the concentration of 5 × 10⁻⁶ M were prepared in a phosphate buffer solution.
2.3. Fluorescence and the UV-VIS Spectra
The fluorescence and absorbance measurements of the samples were recorded in the temperature range between 308 K and 314 K and pH albumin solution 7.4. For the measurement standards, quartz cuvettes 1 cm × 1 cm × 4 cm were used. To obtain the complex IBU–HSA and IBU–dHSA, the fatted and defatted human serum albumin solution (5 × 10⁻⁶ M) was titrated directly into the cuvette by the addition of increasing aliquots of IBU stock solution (1.5 × 10⁻² M).
Absorption spectra were recorded on spectrophotometer LAMBDA BIO 40 Perkin-Elmer in the wavelength range between 250–400 nm. Correcting error of the apparatus was equal to ±0.3 nm and ±0.002 Abs. at 0.5 Abs for wavelength and photometric, respectively. Absorption of second derivative spectra using the Savitzky and Golay algorithm, second-order polynomial, and 15 data points were obtained using the UV WinLab program.
The fluorescence emission spectra were recorded on fluorescence spectrophotometer JASCO FP-6300 (Jasco International Co., Ltd., Tokyo, Japan) equipped with a Peltier thermostat (∆T ± 0.2 °C). The correcting error of the apparatus was equal to ±1.5 nm. The fluorescence emission spectra were collected in the wavelength range of 285–450 nm for λex 275 nm (exites tyrosyls and tryptophanyl residues) and 305–450 nm for λex 295 nm (excites tryptophanyl residue). Light scattering caused by phosphate buffer was subtracted from the fluorescence of analyzed samples using the JASCO (Spectra Manager) software. The intensity of fluorescence was corrected for the inner filter effect [29], and then the obtained spectra were analyzed using OriginPro version 8.5.0 SR1 software (Northampton, MA, USA). The study results were presented as a mean ± relative standard deviation (RSD) which were determined from three independent experiments.
Based on fluorescence data, the fluorescence curves of human serum albumin (HSA and dHSA) in the presence of ibuprofen (IBU) have been plotted. The Stern–Volmer (KSV) and association (Ka) constants have been determined to analyze the interactions between ibuprofen and fatted and defatted human serum albumin.
The Stern–Volmer constants KSV were calculated using the Stern–Volmer equation modified by [30] (Equation (1)):
where is the difference between the fluorescence intensities of HSA/dHSA in the absence () and presence () of ibuprofen; is the maximum fractional fluorescence accessible for the quencher.
Klotz curves allow the determination of association constants Ka and the number of drug molecules bound to one protein molecule (n) (Equation (2)) [31,32]:
where is the number of binding sites in the albumin molecule; is the free drug concentration; is the number of ligands bound to one protein molecule.
To determine the association, Ka and interaction coefficients were used in the Hill equation (Equation (3)) [33]:
where is Hill’s coefficient.
2.4. Circular Dichroism
Circular dichroism (CD) is an absorption spectroscopy method based on the differential absorption of left and right circularly polarized light [34]. The CD spectra of 5 × 10⁻⁶ M fatted and defatted human serum albumin in phosphate buffer (pH 7.4) were performed using a Jasco model J-815 spectropolarimeter (Hachioji, Tokyo, Japan) equipped with a Peltier cell holder with an accuracy of ±0.05 °C. Circular dichroism measurements were made in a nitrogen atmosphere at a temperature range between 308 K and 314 K in a 1 mm path-length quartz cuvette. The spectra were recorded in the wavelength range of 200 nm to 250 nm. The CD spectrum of far-ultraviolet (far-UV CD) proteins below 250 nm reflects the secondary structure of the protein, i.e., the α-helical structure, β-sheet, β-turn, and unstructured elements. The correcting error of the apparatus was equal to ±0.1 nm for the wavelength measurement, and the wavelength repeatability was ±0.05 nm. To reduce random error and noise, each measured spectrum was the average of three different measures taken under identical conditions and corrected for the buffer’s absorbance. Then using Savitzky and Golay method, obtained spectra were smoothed. The observed ellipticity () was converted to the Mean Residue Ellipticity () in deg × cm2 × dmol−1 using the following equation:
where is observed ellipticity for a given wavelength (deg), MRW is a mean residue weight (MRWHSA = 113.7 Da), is the path length of the cuvette (cm) and is the protein concentration (g/cm3).
2.5. Statistical Analysis
In this work, all experiments and measurements were carried out in triplicate, and data were expressed as a mean ± standard deviation (SD). The resulting data were analyzed using OriginPro 8.5.0 SR1 (OriginLab Corporation, Northampton, MA, USA).
3. Results and Discussion
Spectroscopic analysis (spectrophotometry, spectrofluorimetry, and circular dichroism) of ibuprofen interactions with human serum albumin.
3.1. The UV-VIS Analysis of Effect of Fatty Acids and Temperature on the Binding of Human Serum Albumin with Ibuprofen
The UV-VIS absorption spectroscopy technique was used to determine the structural changes of fatted (HSA) and defatted (dHSA) human serum albumin under the influence of ibuprofen [35,36].
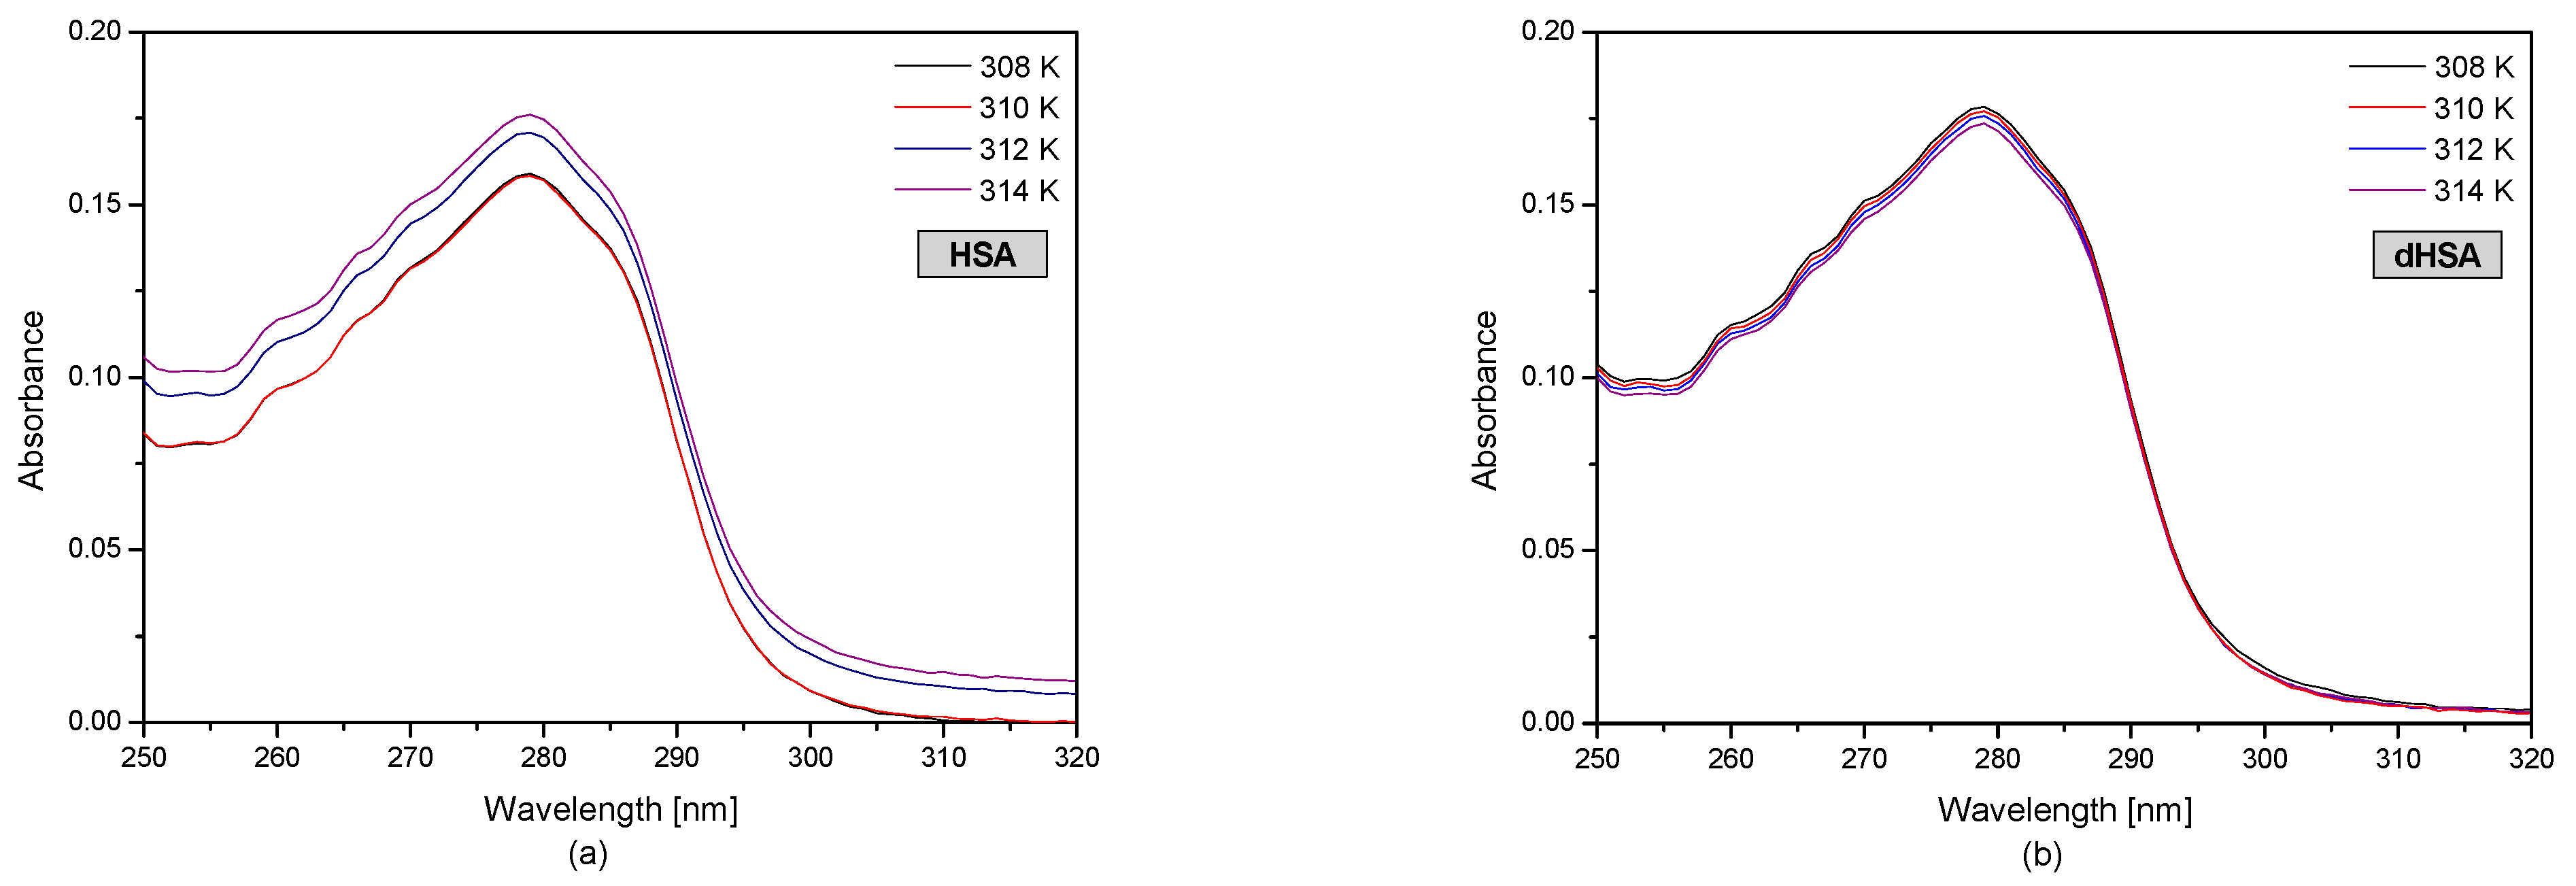
Figure 1 shows the UV-VIS human serum albumin (HSA and dHSA) spectra at various temperature conditions.
The HSA and dHSA UV-VIS spectrum in the wavelength range of 250–305 nm shows the absorption spectrum of aromatic amino acids (tryptophanyl, tyrosyl residues, and phenylalanine) present in the protein structure. Based on the results, it was found that in the case of defatted human serum albumin, the temperature changes in the range of 308–314 K did not significantly change the value of protein absorbance. In the case of fatty human serum albumin at 308 K and 310 K, the HSA absorbance is the same. However, an increase in the temperature influences changes in the tertiary structure of albumin. Based on the spectrophotometric spectra of fatted human serum albumin (Figure 1a), it was found that at the temperature of 312 K and 314 K, baseline drift occurred. Baseline drift is a commonly encountered problem. It is difficult to avoid this problem during the measurements due to the many parameters associated with it. This may be due to the occurrence of solution opacity when increasing the temperature. The fatty acid system with human serum albumin is not very stable. Fatty acids can leave the binding site at higher temperatures, with the consequent formation of micelles and the turbidity of the solution [37].
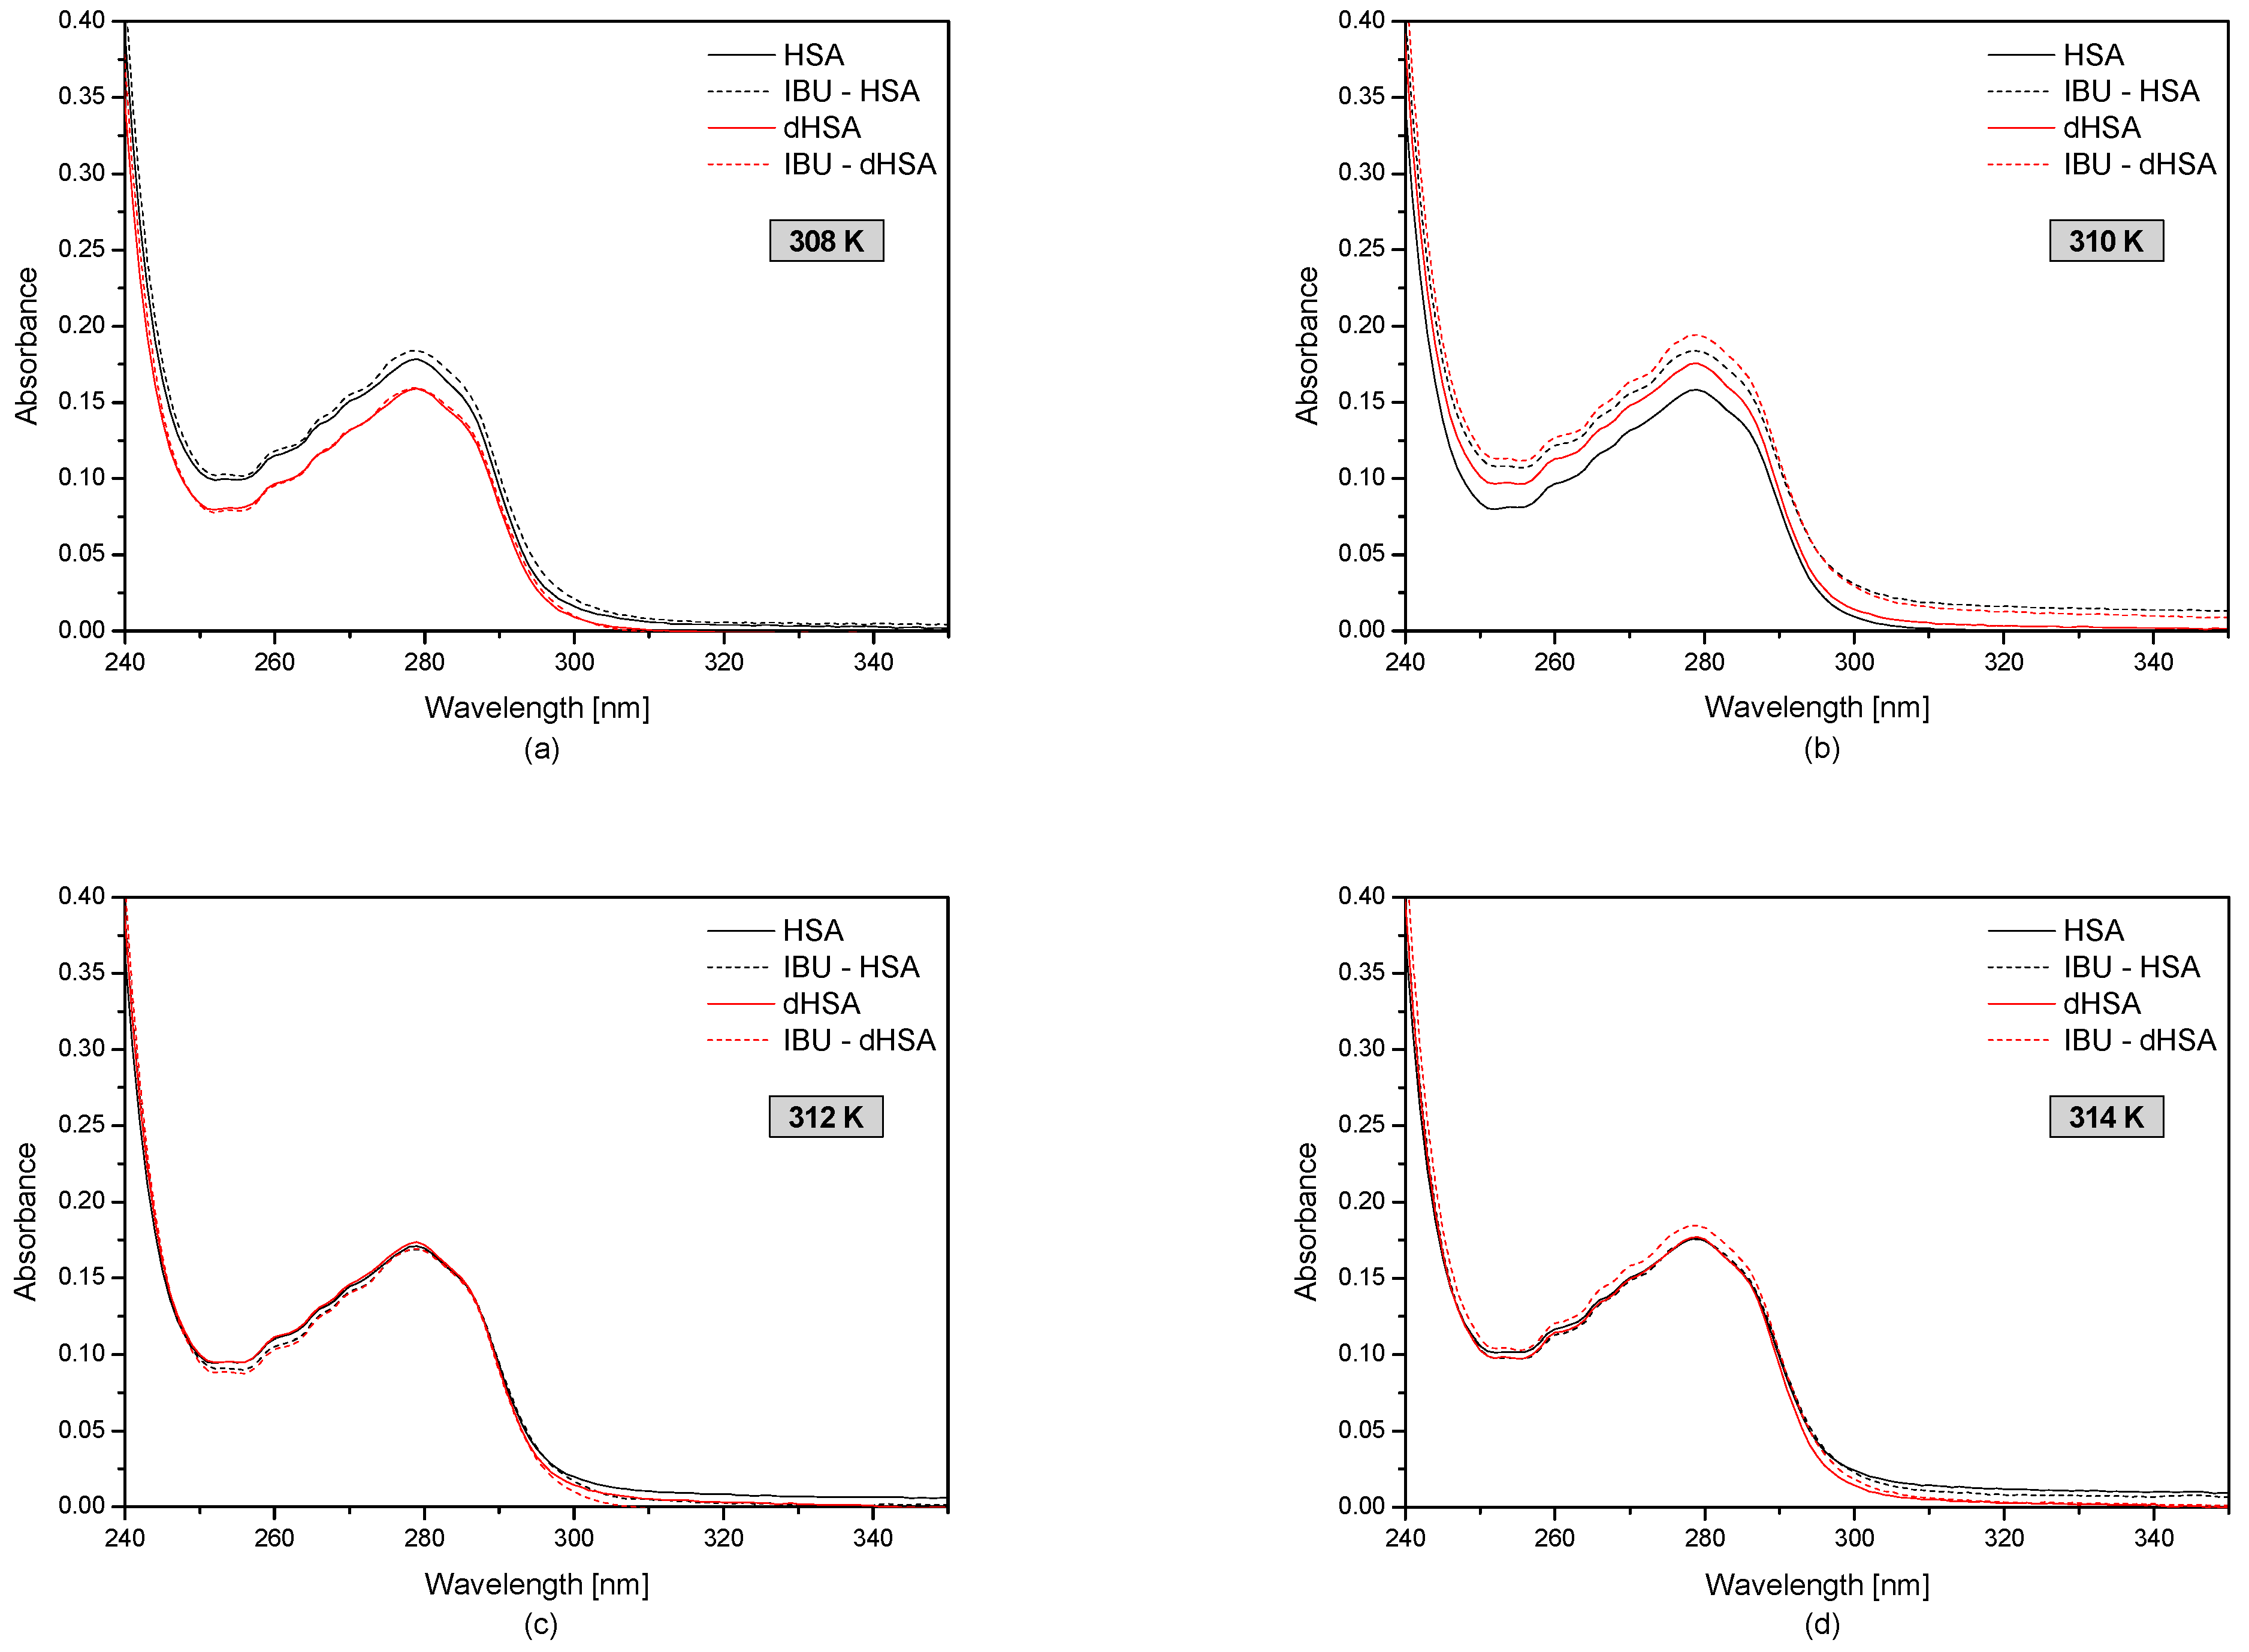
Figure 2 shows the first-order derivative of fatted and defatted human serum albumin with and without ibuprofen in the temperature range 308–314 K.
Based on the obtained human serum albumin UV-VIS spectra presented in Figure 1, at temperatures of 308 K, the absorbance of HSA is higher than dHSA; however, at temperatures of 310 K, the opposite situation occurred, AbsHSA < AbsdHSA. Moreover, the spectrophotometric analysis showed that the absorbance value of the fatted and defatted albumin at 312 K and 314 K was the same.
By analyzing the ibuprofen-human serum albumin complex at the temperature range of 308–314 K, it was found that the drug after binding HSA and dHSA (at 308 K, 312 K, and 314 K) did not significantly affect the tertiary structure of blood serum albumin from the spectrophotometric point of view. On the other hand, at the temperature of 310 K, the absorbance of fatted and defatted albumin after binding with ibuprofen increased significantly. This proves that the presence of fatty acids has no influence on the interaction between the protein and the drug at the temperature corresponding to physiological conditions.
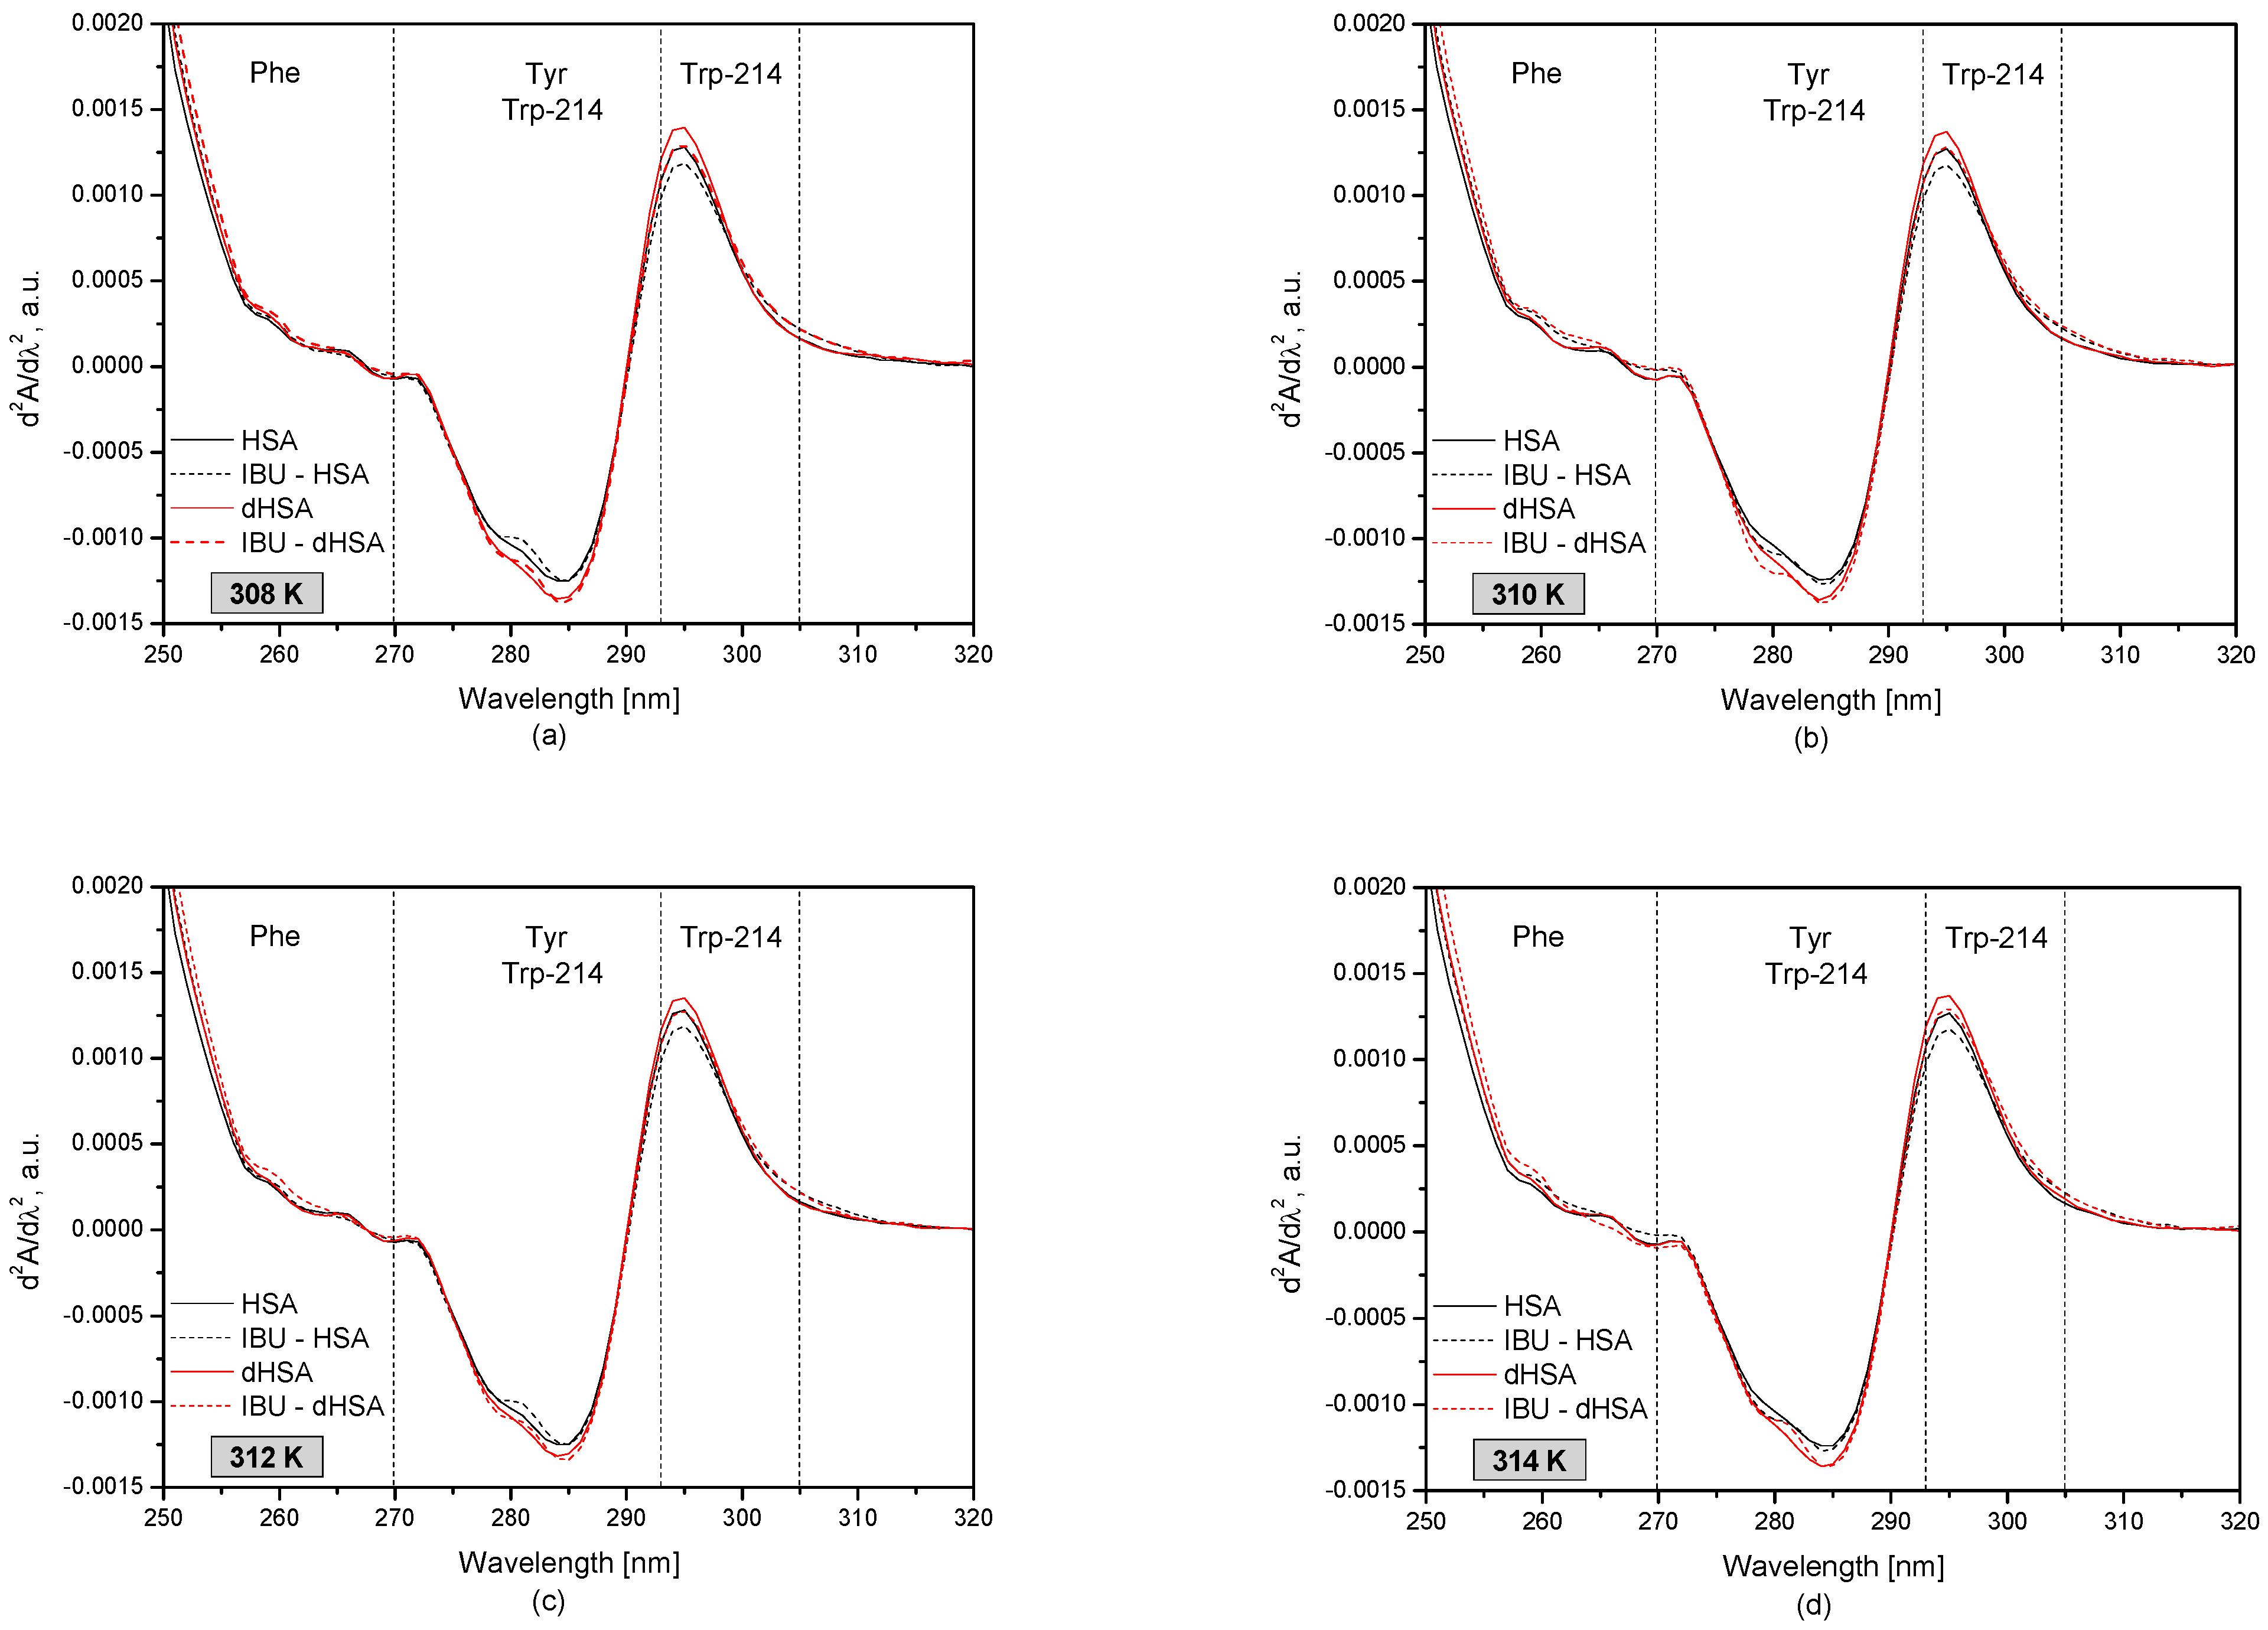
Figure 3 shows the second derivatives of the human serum albumin (HSA and dHSA) spectrum with and without ibuprofen at different albumin temperatures.
The second derivative of the UV-VIS spectrum, expressed as the wavelength dependence of d2A/dλ2, provides detailed information on changes in the tertiary structure of human serum albumin that may be invisible or faintly visible first-order absorption spectrum [38,39,40]. The spectral range of 250–270 nm describes changes within phenylalanine residues (Phe) in the protein structure. The wavelength range 270–293 nm is characteristic of the tyrosyl residues (Tyr) and tryptophanyl residue (Trp-214) in HSA, while the range of 293–305 nm describes only the tryptophanyl residue (Trp-214) of the protein.
Based on the obtained results, it was observed that in the analyzed temperature range, the most significant differences between the fatted and defatted human serum albumin occur in the wavelength range corresponding to the tyrosyl and tryptophanyl residues of albumin (285 nm and 295 nm). Comparing the spectra of pure protein and the drug-protein complex, it was found that the presence of ibuprofen influences the tertiary structure of albumin around the tryptophanyl residues (295 nm). The presence of ibuprofen lowers the d2A/dλ2 value in the wavelength range of 293–297 nm.
3.2. The Fluorescence Analysis of Effect of Fatty Acids and Temperature on the Binding of Human Serum Albumin to Ibuprofen
The spectrofluorometric analysis provides information on changes of the hydrophobic surrounding of the tryptophanyl and tyrosyl residues in serum albumin in the presence of drugs. The ibuprofen-human serum albumin systems were excited by radiation with wavelengths of λex 275 nm (excitation of tryptophanyl and tyrosyl residues of human serum albumin) and λex 295 nm (excitation of tryptophanyl residues of (d)HSA) [7,29,41]. Additionally, a differential spectrum was created for the protein-bound with the drug that charted serum albumin’s tyrosyl residues.
Based on the emissive fluorescent spectra of the IBU–HSA system (data not shown), when the IBU–HSA system was excited by radiation of wavelengths, λex 275 nm and λex 295 nm, the fluorescence of fatty and defatted albumin increased with increasing ibuprofen concentrations at all studied temperatures.
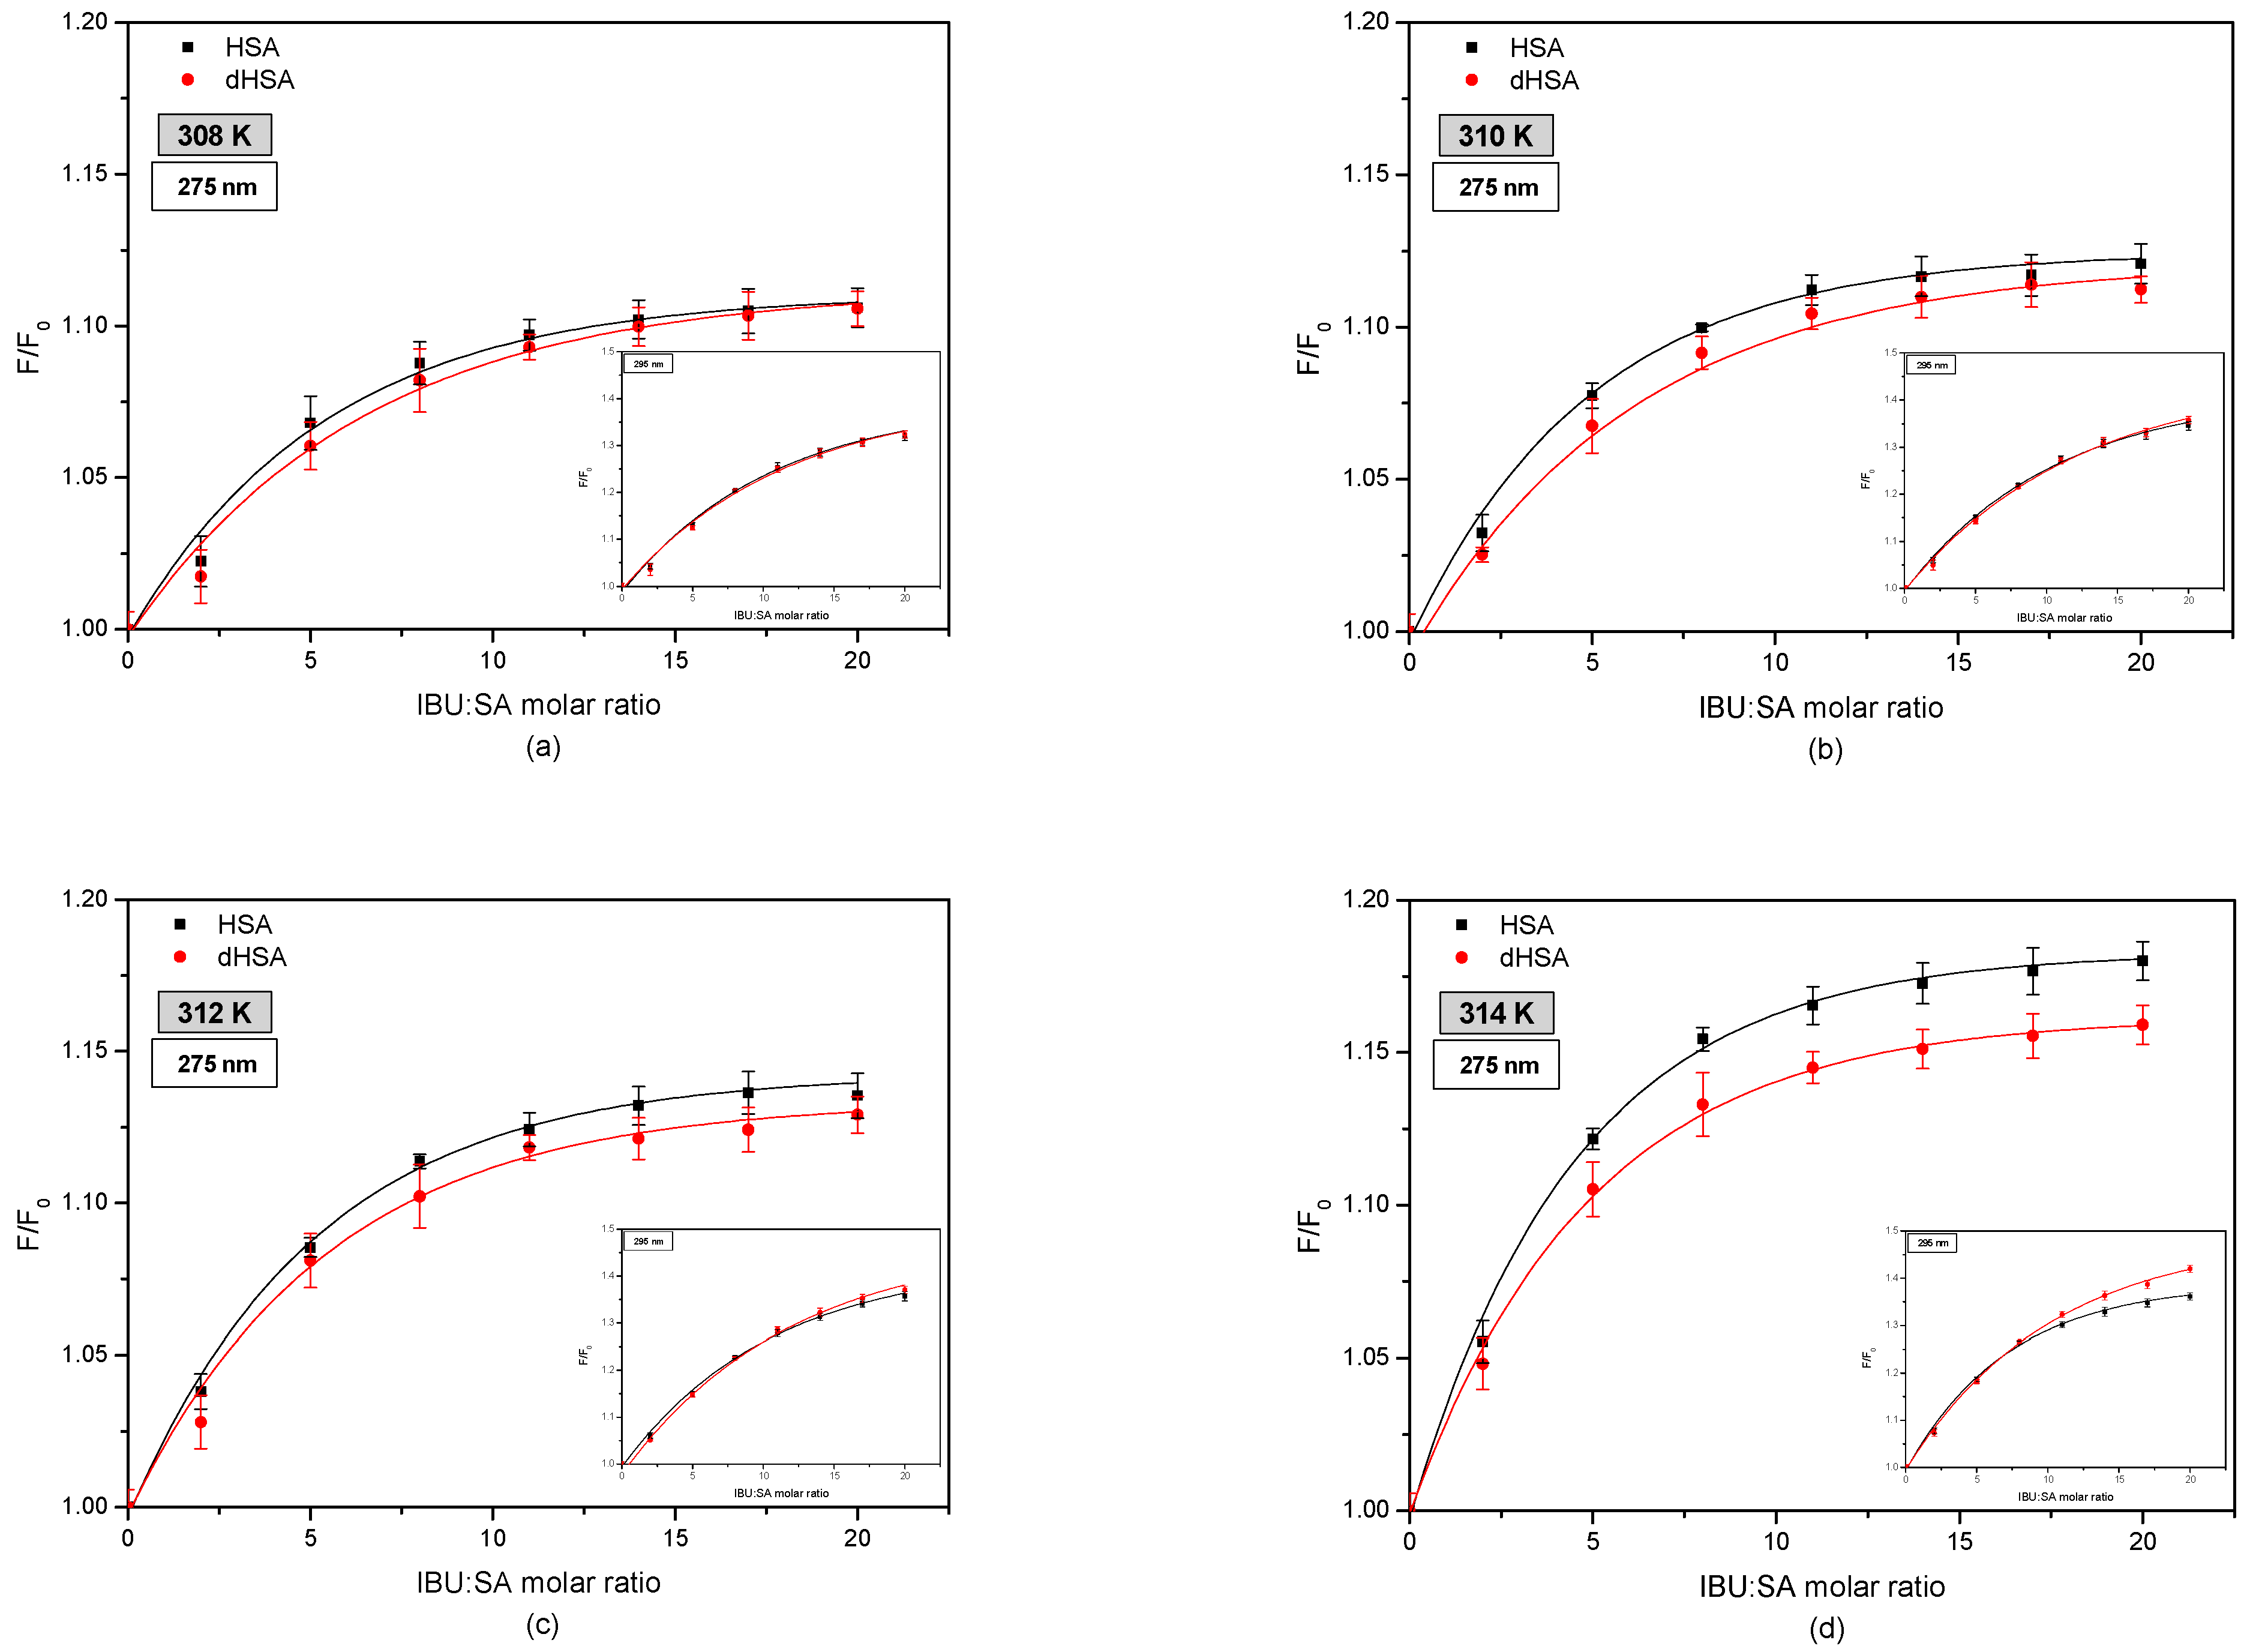
Figure 4 shows fluorophore fluorescence quenching curves of fatted human serum albumin (HSA) and defatted human serum albumin (dHSA) bound with ibuprofen (IBU) in the temperature range 308–314 K.
By comparing the fluorescence intensification curves of HSA and dHSA in the presence of IBU by exciting the system with radiation of wavelength λex 275 nm and λex 295 nm was observed differences in their course. More intense excitation of the protein fluorescence occurs when the IBU–SA complex is exposed to radiation with a wavelength of λex 295 nm. This phenomenon indicates the participation of tryptophanyl residues located in subdomain IIA (Trp-214) as well as tyrosyl group residues localized in subdomains IB (Tyr-138, Tyr-140, Tyr-148, Tyr-150, and Tyr-161), IIB (Tyr-319, Tyr-332, Tyr-334, Tyr-341, Tyr-353, and Tyr-370), IIA (Tyr-263), and IIIA (Tyr-401, Tyr-411, Tyr-452, and Tyr-497) [7,29,41]. Similar research was carried out by Amézqueta in his study evaluating the interactions between human serum albumin and non-steroidal anti-inflammatory drugs by multiwavelength molecular fluorescence, structural and computational analysis. The results showed slight changes in the spectra of human serum albumin under the influence of ibuprofen. The author reported the increase in HSA fluorescence after ibuprofen binding [42].
Moreover, when analyzing the fluorescence intensification curves of serum albumin, it was found that ibuprofen more strongly enhances the fluorophore fluorescence of fatted human serum albumin, exciting the IBU–HSA system with radiation with wavelengths of λex 275 nm, compared to defatted albumin. By exciting the IBU-SA complex with the radiation of wavelength λex 295 nm, it was observed that at the temperature of 308 K and 310 K, the course of the fluorescence intensification curves of the serum albumin fluorophores was the same. At a temperature of 312 K above the IBU, SA molar ratio of 14:1, and at a temperature of 314 K above 7:1, it was found that fatty albumin weakly enhanced the fluorescence of protein fluorophores compared to defatted albumin. Analyzing the influence of temperature on ibuprofen binding by human serum albumin, it was found that with the increase in the measurement temperature, the percentage of fluorescence fluorophores intensity of both albumins (HSA and dHSA), excited with the wavelength of λex 275 nm and λex 295 nm increases. Based on the results obtained, it could be concluded that by interacting with the human serum albumin molecule, ibuprofen breaks the tryptophan-tryptophan hydrogen bonds, which increases the number of free tryptophan molecules in the system, causing an increase in the tryptophanyl residue fluorescence [43]. To determine the contribution of tyrosyl residues in the IBU-HSA bond, a differential spectrum was created for the HSA and dHSA bound with ibuprofen, as shown in Figure 5).
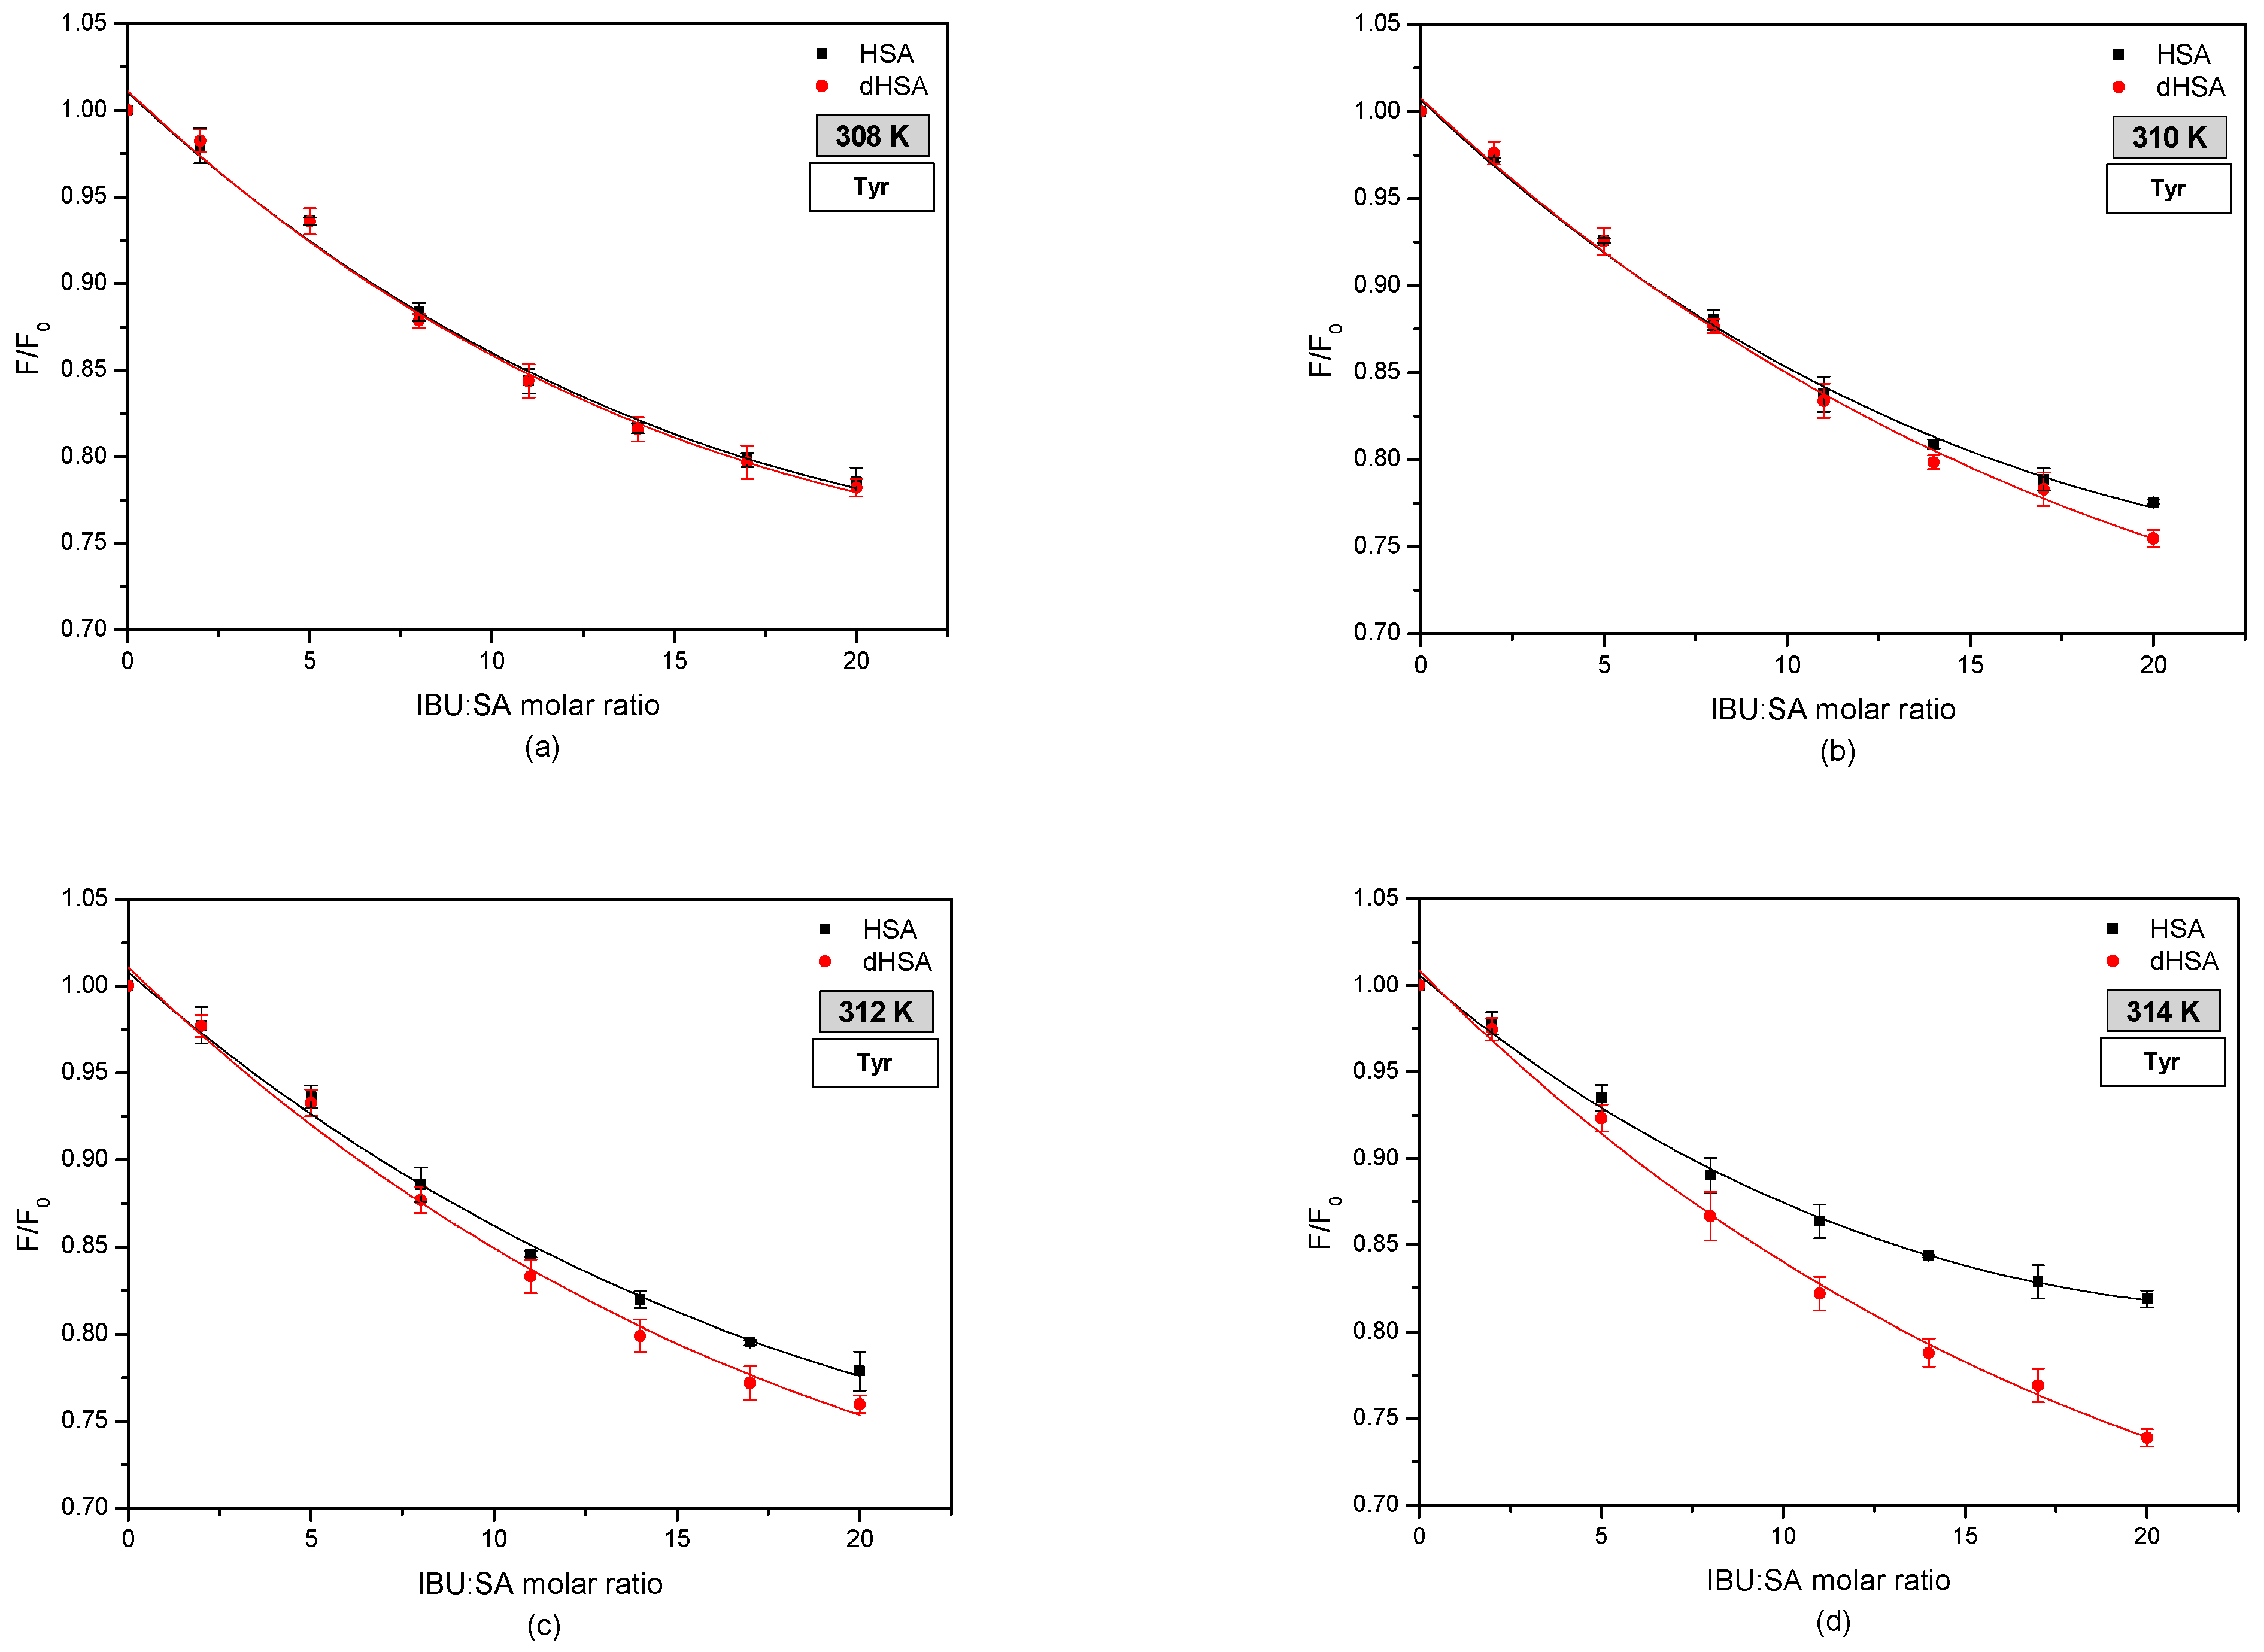
Based on the presented fluorescence quenching curves of tyrosyl residues in fatty and defatted human serum albumin under the influence of ibuprofen, it was observed that an increase in the concentration of the drug causes a more substantial quenching of the fluorescence of tyrosyl residues in the albumin molecule. In addition, at a temperature of 308 K, fluorescence quenching of tyrosyl residues in a protein is independent of the presence of fatty acids. In the temperature range of 310–314 K, it was found that defatted human serum albumin quenches the fluorescence of tyrosyl residues more strongly than fatty albumin above the molar ratio IBU: SA 7:1 at a temperature of 310 K and 2:1 at 312 K and 314 K. Additionally, a linear relationship was observed between the degree of fluorescence quenching of defatted albumin tyrosyl residues and temperature. This relationship was not observed in the case of fatty albumin [44].
On the basis of the obtained results, it was found that the formation of the IBU–SA complex mainly involved protein tyrosyl residues located in the IB subdomain (Tyr-138, Tyr-140, Tyr-148, Tyr-150, and Tyr-161), IIB (Tyr- 319, Tyr-332, Tyr-334, Tyr-341, Tyr-353, and Tyr-370), IIA (Tyr-263), and IIIA (Tyr-401, Tyr-411, Tyr-452, and Tyr-497), which was confirmed by Ghuman in his work concerning specific places of drug binding with serum albumin [21,29,41]. By analyzing the crystallography of 17 different SA complexes with various drugs, including ibuprofen, Ghuman determined the precise architecture of drug binding in the protein at two major binding sites [21]. Evoli, in their work, also showed the graphically binding of ibuprofen to serum albumin by using absolute binding free energy calculations in combination with classical molecular dynamics simulations and the molecular docking of ibuprofen for albumin. On the basis of the conducted analyzes, they found that the most favorable binding location for ibuprofen in the human serum albumin structure was the DS2 (IIIA subdomain) binding site. The second preferred binding site found in the simulation was DS1 (IIA subdomain). The binding site DS1 was characteristic of warfarin. When an excess of ibuprofen had saturated its primary site DS2, warfarin can be displaced from the DS1 site in albumin under excess of ibuprofen. On the basis of simulations, Evoli concluded that the DS1 position is little described in the literature due to the multiple ways of creating bonds between ibuprofen and albumin compared with site FA6 (IIA-IIB subdomain), although the FA6 site is found only as a secondary site. Additionally, the FA6 and FA2 sites have been described as sites with a less favorable affinity for albumin. FA1 (IB subdomain) and FA5 (IIIB subdomain) sites are low-affinity ibuprofen binding locations but can bind ibuprofen under opportune conditions but with very low affinity [45]. Although studies on the molecular dynamics of human serum albumin are available in the literature, it is difficult to observe the effect of temperature on them.
Based on the modified Stern-Volmer curves (data not shown), linear regression curves were drawn, then used to determine the Stern–Volmer constants for the IBU–SA complex in the temperature range 308–314 K (Table 1).
Based on the presented Stern-Volmer constant values, it may be stated that when exciting the IBU-HSA system with radiation with wavelengths of λex 275 and λex 295 nm, the KSV constants of dHSA are higher compared to HSA. Additionally, the Stern-Volmer constants of both HSA and dHSA increase with increasing temperature. The same is the case with the KSV values determined for the differential modified Stern–Volmer curves. The Stern–Volmer constant allows for determining the fluorophores availability for the ligand, characterizing the distance between the ligand and the excited protein fluorophore. Increasing the values of the Stern–Volmer constant KSV indicates that the ligand is closer to the protein, which contributes to the formation of the protein-ligand complex, and the stronger the complex (higher KSV value), the weaker the therapeutic effect [46]. The obtained results indicate that stronger complexes were formed with increasing temperature, which means a lower therapeutic effect. Peng made similar conclusions in the study concerning the interaction between coenzyme Q10 and human serum albumin and Hashempour in analyzing the interaction between HSA and 5-aminoimidazole-4-carboxamide ribonucleoside [3,47]. They observed that the KSV value increases with temperature. On the other hand, the presence of fatty acids in the albumin molecule increases the therapeutic effect compared to defatted albumin.
Based on data collected from emissive fluorescent spectra, Klotz plots and Hill plots (data not shown) were created to determine the Ka association constants, the number of binding sites in the IBU–SA system, and the Hill coefficient values (nH) (Table 2).
Analyzing the obtained values of the association constants determined by the Klotz and Hill method, it was found that by exciting the IBU-SA system with radiation with a wavelength of λex 275 nm and λex 295 nm and based on differential spectra, the association constant Ka for defatted albumin was higher than the Ka for fatty albumin. Moreover, by inducing both tyrosyl and tryptophanyl residues of the protein, it was observed that the constant association value of the dHSA increased with increasing temperature. This relationship was not noted for fatty albumin. In the case of excitation of only tyrosyl residues, no dependence of the association constant on temperature was observed. The obtained values of Ka (Table 2) and KSV (Table 1) allow us to suppose that the complexes of the tested IBU are more stable with the defatted human serum albumin than with the fatted protein.
The number of binding sites n describes the number of ligand molecules per protein molecule. Based on the obtained values determined from the Klotz curves, the highest affinity of ibuprofen to fatty and defatted albumin fluorophores was observed at the temperature of 308 K (λex 295 nm) and the temperature of 314 K (λex 275 nm) in the case of fatty albumin.
A similar relationship between the value of the association constants and the presence or absence of fatty acids in albumin was observed in the study of Varshney. The author observed an approximately five-fold decrease in the value of the association constant of fatty albumin in comparison with the protein without fatty acids. In addition, Varshney found that the number of n binding sites remained almost unchanged in the analyzed complex human serum albumin–hemin (probe for monitoring the effect of fatty acid on the binding properties of domain I), indicating reduced stability of the fatted HSA-hemin complex compared to the fatty acid-free HSA-hemin complex. These results suggest that the fatty acid affects I domain binding [48].
Describing the relationship between the drug and the protein Hill constants (nH) values were determined. For nH = 1, the binding of the ligand to the protein molecule was non-cooperative. For nH > 1 there is a positive, cooperative relationship. Binding the ligand in one place increases the affinity of the ligand to the rest of the macromolecule binding sites. For nH < 1 means a reduction in the relationship of the ligands to the following binding site [33]. By exciting the IBU-SA system with radiation with a wavelength of λex 275 nm, the values of Hill’s constant are comparable for fatty and defatted albumin and were in the range 0.80 ± 0.12–0.84 ± 0.08 for HSA and 0.82 ± 0.10–0.90 ±0.12 for dHSA. This proved a negative coherent bond between the protein tryptophanyl residues and ibuprofen and weakening the bonding in the second-class binding site. The same results can be seen at the temperature range of 308–314 K for HSA and 310 K, 314 K for dHSA by exciting the IBU-SA system with radiation with a wavelength of λex 295 nm. By exciting only the tyrosyl residues of HSA and dHSA in the analyzed temperature range, a positive cooperative relationship occurred; the binding of the ligand in one site increased its affinity to other protein binding sites [49].
3.3. The Circular Dichroism Analysis of Effect of Fatty Acids and Temperature on the Binding of Human Serum Albumin with Ibuprofen
Using the circular dichroism technique was possible to analyze the changes in the secondary structure of the protein under the influence of fatty acids and drugs in the temperature range of 308–314 K. CD spectra of fatty and defatted human serum albumin and complexes IBU-HSA and IBU-dHSA are presented in Figure 6.
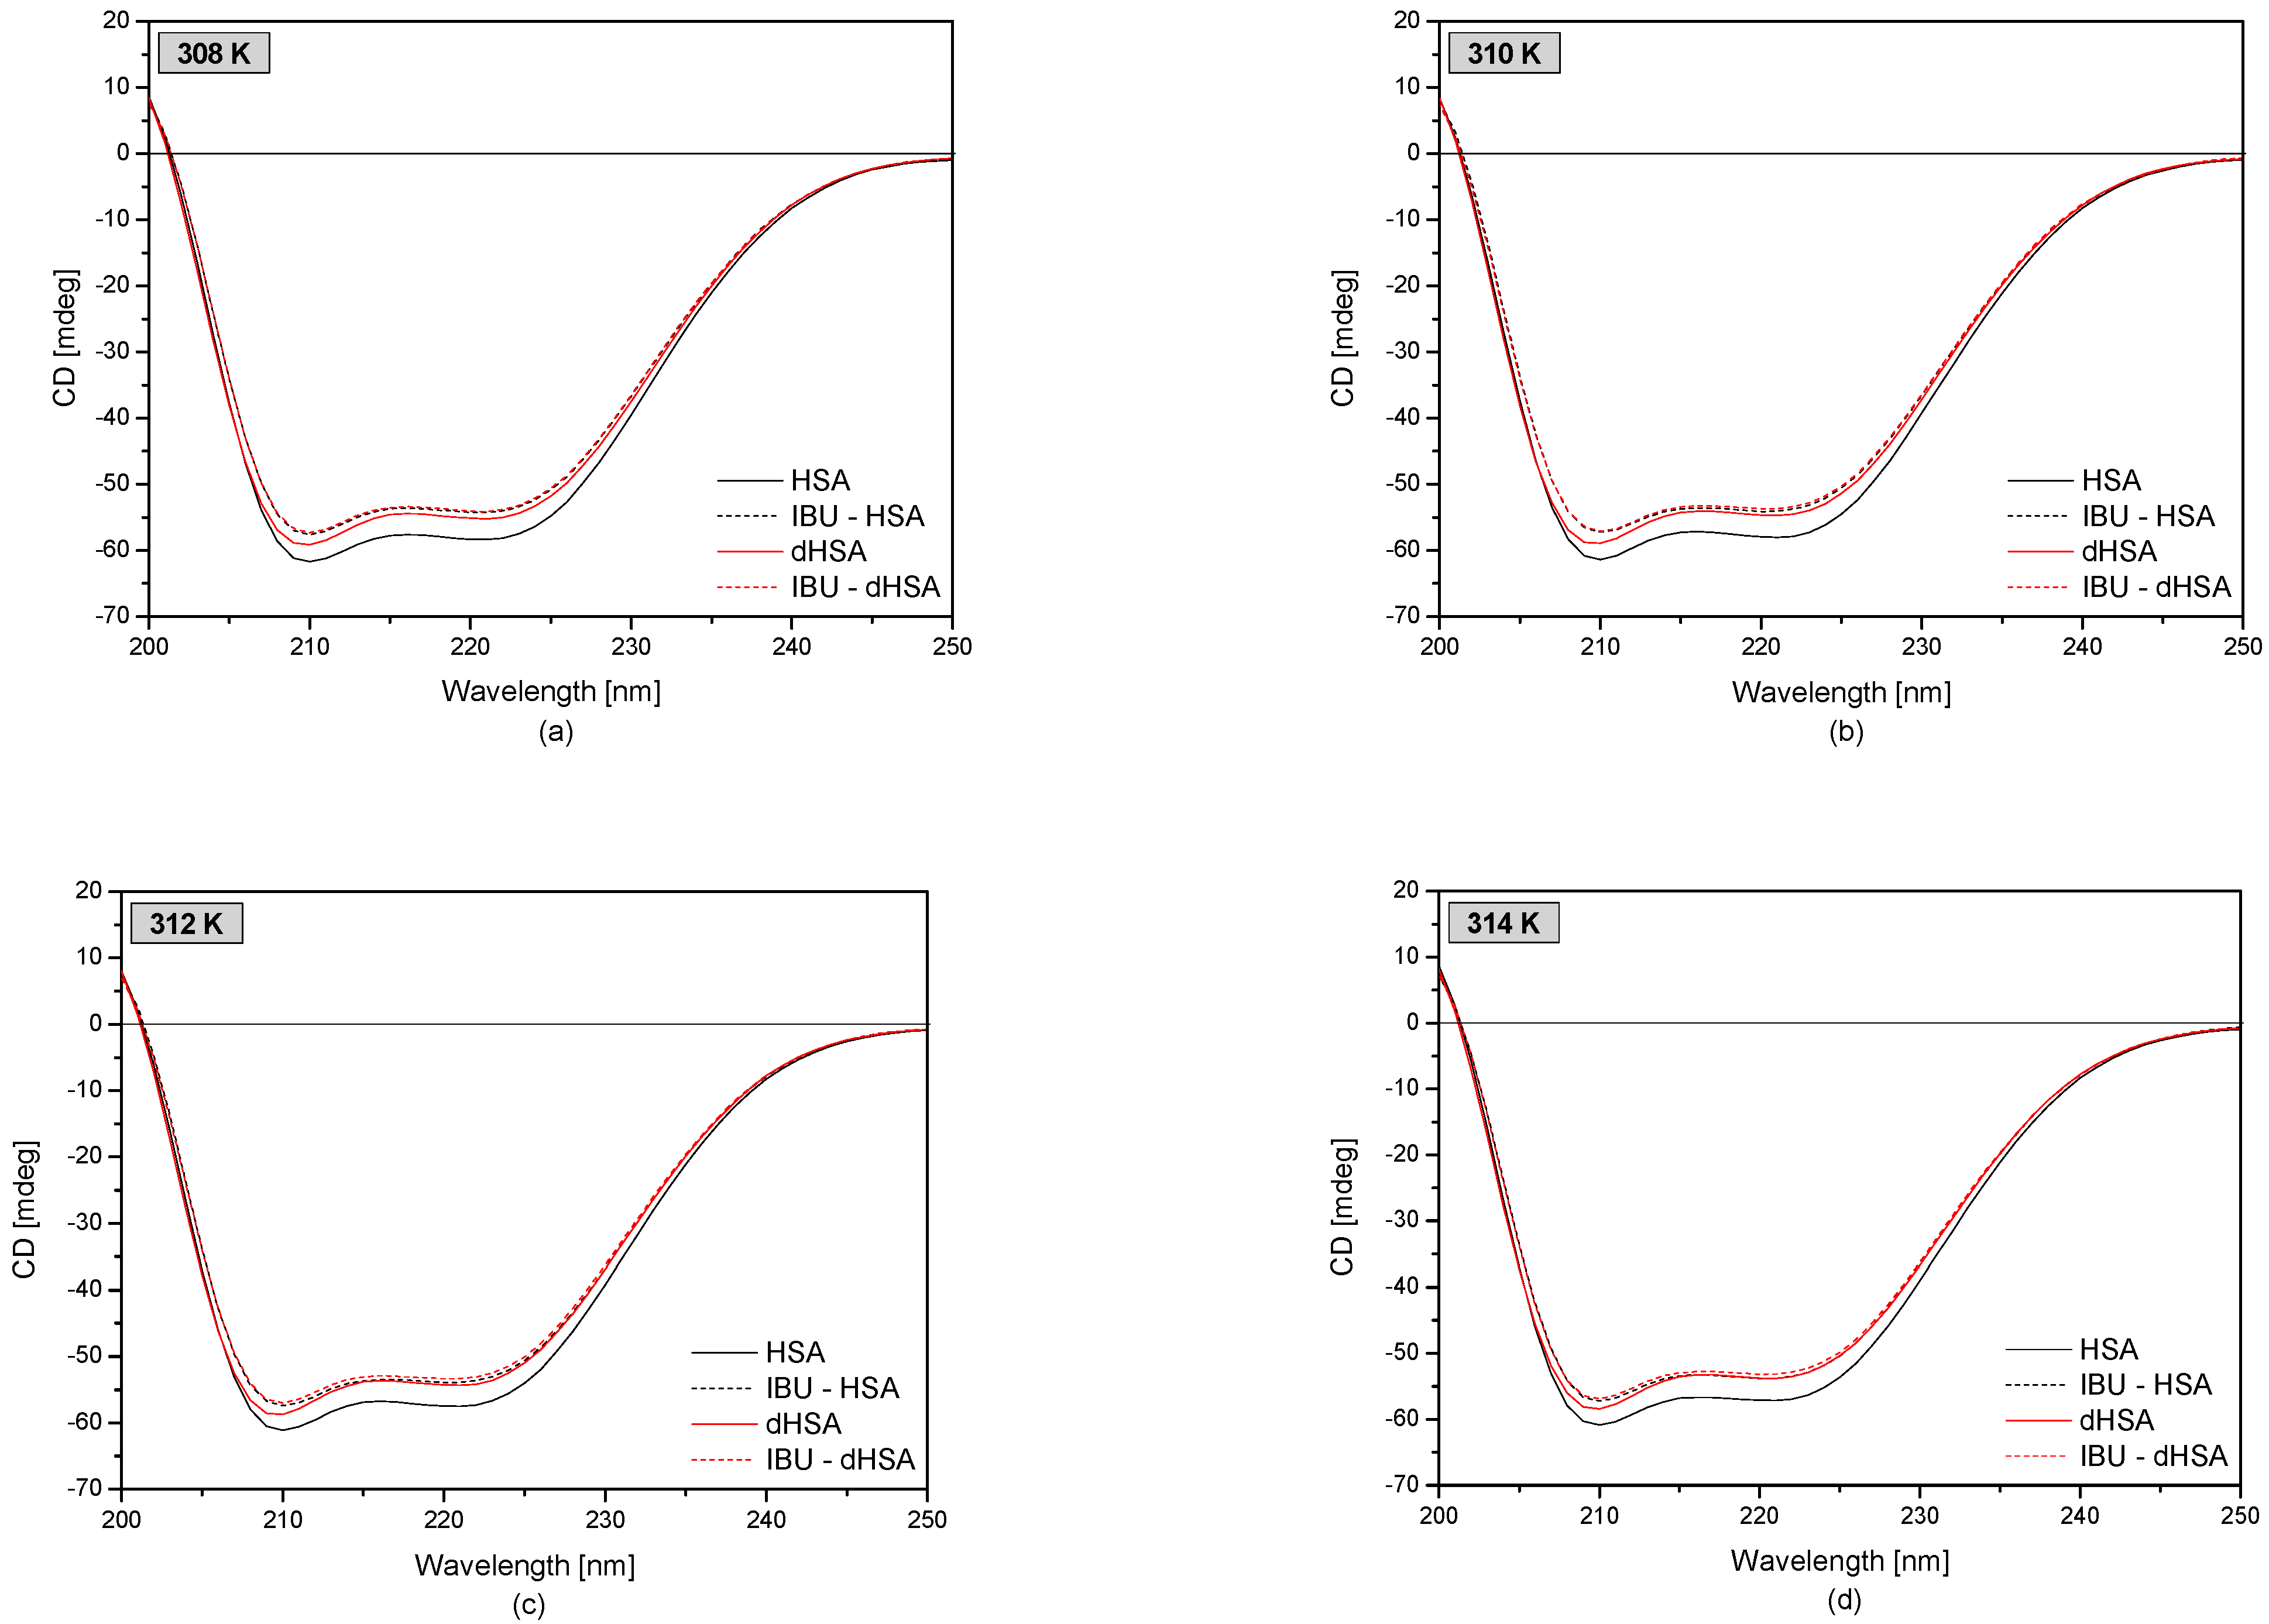
Based on the spectra obtained, it was observed that both defatted and fatted human serum albumin were α-helical proteins. There are two characteristic minima in the CD spectrum at λmin 210 nm and λmin 221 nm [50,51]. The observed ellipticity of the defatted protein was higher compared to that of the fatty protein. Moreover, under the influence of ibuprofen, the observed ellipticity increased in the analyzed temperature range, and the band shifted from λmin 221 nm to λmin 220 nm.
Based on the observed ellipticity and Equation (4) values, the value of the mean ellipticity θMRE was calculated for fatty albumin, defatted albumin, IBU–HSA, and IBU–dHSA complexes. The results are shown in Table 3.
Based on the obtained results presented in Table 3, it was observed that the value of θMRE was higher for defatted albumin compared to fatty albumin in the analyzed temperature range. At the wavelength λmin 210 nm, the value of the mean ellipticity of dHSA was 0.96 times higher than for HSA, while for λmin 221 nm, the value of θMRE dHSA was 0.94 times higher than that of HSA. The β-type proteins are characterized by the presence of only one negative band around λmin 220 nm [50,51]. This slightly weaker increase in the mean residue ellipticity for the λmin 221 nm band may indicate an increase in the content of α-helical structures and a decrease in the β-structural elements in defatted human serum albumin compared to fatty albumin.
Analyzing the influence of ibuprofen on the secondary structure of human serum albumin, it was found that in the studied temperature range, the value of θMRE was higher for human serum albumin bound to ibuprofen compared to pure albumin (HSA and dHSA). Analyzing the values at the negative band around λmin 210 nm, it was found that for the IBU-dHSA complex, the θMRE values were 0.970–0.975 times greater than for dHSA, and for IBU-HSA, 0.934–0.941 times greater than for HSA. Additionally, it was observed that there was a shift of the minimum of the second negative band under the influence of ibuprofen from λmin 221 nm to λmin 220 nm. Analyzing the values of θMRE in the second negative band, it was found that for the complex IBU–dHSA θMRE value was 0.980–0.989 times higher than for dHSA, and for IBU–HSA 0.929–0.941 times higher than for HSA in the temperature range 308–314 K. This slightly stronger increase in the mean residues ellipticity for the λmin 221 nm in albumin devoid of fatty acids may indicate a decrease in the content of α-helical structures and an increase in β-structural elements. HSA probably changes from the native state characterized by two minima to a spectrum with a visible minimum and less visible second one as a consequence of β-sheet structure, absent in unmodified protein [52]. On the other hand, when analyzing the θMRE values of fatty protein, it was found that the presence of fatty acids contributes to an increase in the content of α-helical structures and a decrease in β- structural elements.
Using the secondary structure evaluation program with the Yang reference model, the predicted changes in the protein α-helical structure confirmed a β-sheet conformation (Table 4).
Based on the data presented in Table 4, changes in the proportions between the structure of the α-helix and the β-sheet of human serum albumin under the influence of ibuprofen and fatty acids in the analyzed temperature range were observed. The process of structural modification is regulated by several factors, including temperature, protein concentration, pH, presence of drugs, electrolytes, metal ions, degree of irradiation, etc. [53]. However, in this case, the presence of ibuprofen and fatty acids played the greatest role. Temperature changes did not significantly change the percentage of secondary structural elements in the human serum albumin structure. The circular dichroism measurements carried out by Yamasaki also confirmed the influence of fatty acids on the modification of the spatial structure of albumin. Additionally, a change in the spatial orientation of the ligand at its binding site was observed [24].
4. Conclusions
The conducted research for fatted and defatted human serum albumin and their complex with ibuprofen allowed us to obtain promising conclusions about the influence of fatty acids and temperature on the binding of drugs to serum albumin. The affinity of ibuprofen to human serum albumin, as well as changes in the concentration of the free drug fraction and the protein-bound fraction, are very important from a pharmacological point of view. Only the non-protein-bound form of the drug is pharmacologically active. The remaining fraction, bound to protein, serves as a depot of the drug in the body. On the other hand, fatty acids occupy certain characteristic places in the structure of albumin, which contributes to the destabilization of the drug-protein complex. The knowledge of the ibuprofen binding site in the albumin molecule, as well as the possibility of competition between ibuprofen and fatty acids, affects the concentration of the free drug fraction in the bloodstream, and thus its therapeutic effect. In addition, the increased content of fatty acids in the body affects the pharmacokinetics of the drug. Therefore, a very important aspect of the study was to assess the effect of fatty acids on the affinity of ibuprofen for albumin at temperatures close to the extreme value of hypothermia (T = 308 K), at the temperature corresponding to physiological conditions (T = 310 K) and at temperature correspond to inflammation in the human body (T = 312 K and 314 K). Fluorescence spectroscopy is a technique that allows the monitoring of intermolecular interactions. In order to observe how the protein secondary and tertiary structure changes, far-UV CD spectroscopy and UV-VIS absorption spectroscopy were used, respectively. The results obtained using spectroscopic techniques showed that the presence of fatty acids disturbs the binding of ibuprofen to human serum albumin. Based on the spectrophotometric analysis, it was found that fatty acids and temperatures of human serum albumin affected the structural change in the area of albumin tryptophanyl and/or tyrosyl groups was observed at the analyzed temperature range, which was confirmed by the results obtained from the spectrofluorimetric analysis. On the basis of the obtained results, it was found that the formation of the IBU-SA complex mainly involves protein tyrosyl residues independent of the presence of fatty acids and temperature. The obtained results indicate that stronger complexes are formed with increasing temperature, which means a lower therapeutic effect. On the other hand, the presence of fatty acids in the albumin molecule increases the therapeutic effect compared to defatted albumin. Ibuprofen, therefore, releases from the IBU-dHSA complex more slowly, exhibiting a longer but weaker effect. Additionally, the increase in the Stern–Volmer constant with increasing temperature indicates the involved binding forces are probably mainly hydrophobic interactions [22]. Based on the CD spectra, changes in the proportions between the structure of the α-helix and the β-sheet of human serum albumin under the influence of ibuprofen and fatty acids in the analyzed temperature range were observed. In the structural modification process, the presence of ibuprofen and fatty acids played the greatest role. Temperature changes did not significantly change the percentage of secondary structural elements in the human serum albumin structure. Based on the analysis, it was observed that HSA probably changes from the native state characterized by two minima to a spectrum with a visible minimum and less visible second one as a consequence of β-sheet structure, absent in unmodified SA. Ibuprofen binds more strongly to defatted protein (dHSA) than to albumin in the presence of fatty acids (HSA), and the competitive binding of ibuprofen and fatty acids to albumin influence the concentration of free drug fraction and its therapeutic effect. The conformational changes in the structure of the human serum albumin molecule affect its ability to bind ligands.
Author Contributions
Conceptualization, A.P.-J.; methodology, A.P.-J.; formal analysis, A.P.-J.; investigation, A.P.-J.; writing—original draft preparation, A.P.-J.; writing—review and editing, D.P. and J.E.N.; supervision, D.P. All authors have read and agreed to the published version of the manuscript.
Funding
This research received no external funding.
Institutional Review Board Statement
Not applicable.
Informed Consent Statement
Not applicable.
Data Availability Statement
Not applicable.
Conflicts of Interest
The authors declare no conflict of interest.
References
- Anand, U.; Mukherjee, S. Binding, unfolding and refolding dynamics of serum albumins. Biochim. Biophys. Acta 2013, 1830, 5394–5404. [Google Scholar] [CrossRef]
- Kragh-Hansen, U.; Minchiotti, L.; Galiano, M.; Peters, T., Jr. Human serum albumin isoforms: Genetic and molecular aspects and functional consequences. Biochim. Biophys. Acta 2013, 1830, 5405–5417. [Google Scholar] [CrossRef]
- Peng, X.; Sun, Y.; Qi, W.; Su, R.; He, Z. Study of the Interaction between Coenzyme Q10 and Human Serum Albumin: Spec-troscopic Approach. J. Solut. Chem. 2014, 43, 585–607. [Google Scholar] [CrossRef]
- He, X.M.; Carter, D.C. Atomic structure and chemistry of human serum albumin. Nature 1992, 358, 209–215. [Google Scholar] [CrossRef] [PubMed] [Green Version]
- Peters, T. All about Albumin: Biochemistry, Genetics and Medical Applications; Academic Press: San Diego, CA, USA, 1995. [Google Scholar]
- Sugio, S.; Kashima, A.; Mochizuki, S.; Noda, M.; Kobayashi, K. Crystal structure of human serum albumin at 2.5 A resolution. Protein Eng. 1999, 12, 439–446. [Google Scholar] [CrossRef]
- Carter, D.C.; Ho, J.X. Structure of Serum Albumin. Adv. Protein Chem. 1994, 45, 153–203. [Google Scholar] [CrossRef]
- Kragh-Hansen, U. Molecular aspects of ligand binding to serum albumin. Pharmacol. Rev. 1981, 33, 17–53. [Google Scholar] [PubMed]
- Sudlow, G.; Birkett, D.J.; Wade, D.N. The characterization of two specific drug binding sites on human serum albumin. Mol. Pharmacol. 1975, 11, 824–832. [Google Scholar] [PubMed]
- Sudlow, G.; Birkett, D.J.; Wade, D.N. Further characterization of specific drug binding sites on human serum albumin. Mol. Pharmacol. 1976, 12, 1052–1061. [Google Scholar]
- Kragh-Hansen, U.; Chuang, V.; Otagiri, M. Practical Aspects of the Ligand-Binding and Enzymatic Properties of Human Serum Albumin. Biol. Pharm. Bull. 2002, 25, 695–704. [Google Scholar] [CrossRef] [Green Version]
- Curry, S.; Mandelkow, H.; Brick, P.; Franks, N. Crystal structure of human serum albumin complexed with fatty acid reveals an asymmetric distribution of binding sites. Nat. Struct. Biol. 1998, 5, 827–835. [Google Scholar] [CrossRef]
- Bushra, R.; Aslam, N. An Overview of Clinical Pharmacology of Ibuprofen. Oman. Med. J. 2010, 25, 155–161. [Google Scholar] [CrossRef]
- Amirimoghadam, P.; Zihayat, B.; Dabaghzadeh, F.; Kiani, K.; Ebrahimi, J.; Ghazanfari, M. Evaluation and awareness of over the counter use of non-steroidal anti-inflammatory drugs? J. Appl. Pharm. Sci. 2017, 7, 154–159. [Google Scholar]
- Varrassi, G.; Pergolizzi, J.V.; Dowling, P.; Paladini, A. Ibuprofen Safety at the Golden Anniversary: Are all NSAIDs the Same? A Narrative Review. Adv. Ther. 2020, 37, 61–82. [Google Scholar] [CrossRef] [Green Version]
- Halford, G.M.; Lordkipanidzé, M.; Watson, S.P. 50th anniversary of the discovery of ibuprofen: An interview with Dr Stewart Adams. Platelets 2012, 23, 415–422. [Google Scholar] [CrossRef]
- Ngo, V.T.H.; Bajaj, T. Ibuprofen; StatPearls: Treasure Island, FL, USA, 2021. [Google Scholar]
- Van der Vusse, G.J. Albumin as fatty acid transporter. Drug Metab. Pharmacokinet. 2009, 24, 300–307. [Google Scholar] [CrossRef]
- Huang, B.X.; Dass, C.; Kim, H.Y. Probing conformational changes of human serum albumin due to unsaturated fatty acid binding by chemical cross-linking and mass spectrometry. Biochem. J. 2005, 387, 695–702. [Google Scholar] [CrossRef]
- Høstmark, A.T. Serum albumin and prevalence of coronary heart disease: A population-based, cross-sectional study. Nor. Epidemiol. 2003, 13, 107–113. [Google Scholar] [CrossRef]
- Ghuman, J.; Zunszain, P.A.; Petitpas, I.; Bhattacharya, A.A.; Otagiri, M.; Curry, S. Structural Basis of the Drug-binding Spec-ificity of Human Serum Albumin. J. Mol. Biol. 2005, 353, 38–52. [Google Scholar] [CrossRef]
- Ashrafi-Kooshk, M.R.; Ebrahimi, F.; Ranjbar, S.; Ghobadi, S.; Moradi, N.; Khodarahmi, R. Comparative studies on drug binding to the purified and pharmaceutical grade human serum albumin. Biologicals 2015, 43, 333–343. [Google Scholar] [CrossRef]
- Salahuddin, P. Urea and Acid Induced Unfolding of Fatted and Defatted Human Serum Albumin. Protein Pept. Lett. 2008, 15, 826–833. [Google Scholar] [CrossRef]
- Yamasaki, K.; Hyodo, S.; Taguchi, K.; Nishi, K.; Yamaotsu, N.; Hirono, S.; Chuang, V.T.G.; Seo, H.; Maruyama, T.; Otagiri, M. Long chain fatty acids alter the interactive binding of ligands to the two principal drug binding sites of human serum albumin. PLoS ONE 2017, 12, e0180404. [Google Scholar] [CrossRef] [Green Version]
- Krenzel, E.S.; Chen, Z.; Hamilton, A. Correspondence of Fatty Acid and Drug Binding Sites on Human Serum Albumin: A Two-Dimensional Nuclear Magnetic Resonance Study. Biochemistry 2013, 52, 1559–1567. [Google Scholar] [CrossRef]
- Yamazaki, E.; Inagaki, M.; Kurita, O.; Inoue, T. Kinetics of fatty acid binding ability of glycated human serum albumin. J. Biosci. 2005, 30, 475–481. [Google Scholar] [CrossRef]
- Spector, A.A. Fatty acid binding to plasma albumin. J. Lipid Res. 1975, 16, 165–179. [Google Scholar] [CrossRef]
- Miyamoto, H.; Matsueda, S.; Moritsuka, A.; Shimokawa, K.; Hirata, H.; Nakashima, M.; Sasaki, H.; Fumoto, S.; Nishida, K. Evaluation of hypothermia on the in vitro metabolism and binding and in vivo disposition of midazolam in rats: Hypothermic effects on midazolam disposition in rats. Biopharm. Drug Dispos. 2015, 36, 481–489. [Google Scholar] [CrossRef] [Green Version]
- Lakowicz, J.R. Principles of Fluorescence Spectroscopy, 3rd ed.; Springer: New York, NY, USA, 2006. [Google Scholar] [CrossRef]
- Galley, W.C.; Bouvier, M.; Clas, S.D.; Brown, G.R. A simplified analysis of scatchard plots for systems with two interacting binding sites. Biopolymers 1988, 27, 79–86. [Google Scholar] [CrossRef]
- Zhao, P.; Zhu, G.; Zhang, W.; Zhang, L.; Liang, Z.; Zhang, Y. Study of multiple binding constants of dexamethasone with human serum albumin by capillary electrophoresis–frontal analysis and multivariate regression. Anal. Bioanal. Chem. 2008, 393, 257–261. [Google Scholar] [CrossRef]
- Chen, Y.; Wang, H.; Niu, Q.; Ye, D.; Liang, G. Binding between Saikosaponin C and Human Serum Albumin by Fluorescence Spectroscopy and Molecular Docking. Molecules 2016, 21, 153. [Google Scholar] [CrossRef]
- Hill, A.V. The possible effects of the aggregation of the molecules of haemoglobin on its dissociation curves. J. Physiol. 1910, 40, 4–7. [Google Scholar]
- Venyaminov, S.Y.; Yang, J.T. Circular Dichroism and the Conformational Analysis of Biomolecules; Fasman, G.D., Ed.; Plenum Press: New York, NY, USA, 1996; pp. 69–109. [Google Scholar]
- Liu, J.; Tian, J.N.; Zhang, J.; Hu, Z.; Chen, X. Interaction of magnolol with bovine serum albumin: A fluorescence quenching study. Anal. Bioanal. Chem. 2003, 376, 864–867. [Google Scholar] [CrossRef]
- Yue, Y.; Chen, X.; Qin, J.; Yao, X. Characterization of the mangiferin-human serum albumin complex by spectroscopic and molecular modeling approaches. J. Pharm. Biomed. 2009, 49, 753–759. [Google Scholar] [CrossRef]
- Oliveira, A.F.; Cunha, D.A.; Ladriere, L.; Igoillo-Esteve, M.; Bugliani, M.; Marchetti, P.; Cnop, M. In vitro use of free fatty acids bound to albumin: A comparison of protocols. Biotechniques 2015, 58, 228–233. [Google Scholar] [CrossRef] [PubMed] [Green Version]
- Kuś, S.; Marczenko, Z.; Obarski, N. Derivative UV-Vis Spectrophotometry in Analytical Chemistry. Chem. Anal. 1996, 41, 899–927. [Google Scholar]
- Balestrieri, C.; Colonna, G.; Giovane, A.; Irace, G.; Servillo, L. Second-Derivative Spectroscopy of Proteins: A Method for the Quantitiative Determination of Aromatic Amino Acids in Proteins. Eur. J. Biol. Chem. 1978, 90, 433–440. [Google Scholar] [CrossRef]
- Levine, R.L.; Federici, M.M. Quantitation of aromatic residues in proteins: Model compounds for second-derivative spectros-copy. Biochemistry 1982, 21, 2600–2606. [Google Scholar] [CrossRef]
- Chadborn, N.; Bryant, J.; Bain, A.J.; O’Shea, P. Ligand-Dependent Conformational Equilibria of Serum Albumin Revealed by Tryptophan Fluorescence Quenching. Biophys. J. 1999, 76, 2198–2207. [Google Scholar] [CrossRef] [Green Version]
- Amézqueta, S.; Beltrán, J.L.; Bolioli, A.M.; Campos-Vicens, L.; Luque, F.J.; Ràfols, C. Evaluation of the Interactions between Human Serum Albumin (HSA) and Non-Steroidal Anti-Inflammatory (NSAIDs) Drugs by Multiwavelength Molecular Fluo-rescence, Structural and Computational Analysis. Pharmaceuticals 2021, 14, 214. [Google Scholar] [CrossRef]
- Ding, F.; Buldyrev, S.V.; Dokholyan, N.V. Folding Trp-Cage to NMR Resolution Native Structure Using a Coarse-Grained Protein Model. Biophys. J. 2005, 88, 147–155. [Google Scholar] [CrossRef] [PubMed]
- Ploch-Jankowska, A.; Pentak, D. A Comprehensive Spectroscopic Analysis of the Ibuprofen Binding with Human Serum Albumin, Part I. Pharmaceuticals 2020, 13, 205. [Google Scholar] [CrossRef]
- Evoli, S.; Mobley, D.L.; Guzzi, R.; Rizzuti, B. Multiple binding modes of ibuprofen in human serum albumin identified by absolute binding free energy calculations. Phys. Chem. Chem. Phys. 2016, 18, 32358–32368. [Google Scholar] [CrossRef] [Green Version]
- Eftink, M.R.; Ghiron, C.A. Exposure of tryptophanyl residues in proteins. Quantitative determination by fluorescence quenching studies. Biochemistry 1976, 15, 672–680. [Google Scholar] [CrossRef]
- Hashempour, S.; Shahabadi, N.; Adewoye, A.; Murphy, B.; Rouse, C.; Salvatore, B.A.; Stratton, C.; Mahdavian, E. Binding Studies of AICAR and Human Serum Albumin by Spectroscopic, Theoretical, and Computational Methodologies. Molecules 2020, 25, 5410. [Google Scholar] [CrossRef]
- Varshney, A.; Ahmad, B.; Khan, R.H. Comparative studies of unfolding and binding of ligands to human serum albumin in the presence of fatty acid: Spectroscopic approach. Int. J. Biol. Macromol. 2008, 42, 483–490. [Google Scholar] [CrossRef]
- Gesztelyi, R.; Zsuga, J.; Kemeny-Beke, A.; Varga, B.; Juhasz, B.; Tosaki, A. The Hill equation and the origin of quantitative pharmacology. Arch. Hist. Exact Sci. 2012, 66, 427–438. [Google Scholar] [CrossRef]
- Greenfield, N.J. Using circular dichroism spectra to estimate protein secondary structure. Nat. Protoc. 2006, 1, 2876–2890. [Google Scholar] [CrossRef]
- Whitmore, L.; Wallace, B.A. Protein secondary structure analyses from circular dichroism spectroscopy: Methods and refer-ence databases. Biopolymers 2008, 89, 392–400. [Google Scholar] [CrossRef]
- Kosa, T.; Maruyama, T.; Sakai, N.; Yonemura, N.; Yahara, S.; Otagiri, M. Species differences of serum albumins: III. Analysis of structural characteristics and ligand binding properties during N-B transitions. Pharm. Res. 1998, 15, 592–598. [Google Scholar] [CrossRef]
- Wang, W.; Nema, S.; Teagarden, D. Protein aggregation—Pathways and influencing factors. Int. J. Pharm. 2010, 390, 89–99. [Google Scholar] [CrossRef]
Scheme 1.
The main fatty acids and ibuprofen binding sites in the human serum albumin molecule (PDB ID: 1AO6) [6,21,22].

Figure 1.
The spectrophotometric spectra of fatty (a) and defatted (b) human serum albumin (5 × 10⁻⁶ M) at 308 K, 310 K, 312 K, and 314 K.
Figure 1.
The spectrophotometric spectra of fatty (a) and defatted (b) human serum albumin (5 × 10⁻⁶ M) at 308 K, 310 K, 312 K, and 314 K.

Figure 2.
The spectrophotometric spectra of fatty (–) and defatty (–) human serum albumin (5 × 10⁻⁶ M) at concentrations of ibuprofen 1 × 10⁻⁴ M (dotted line) at the temperatures: T = 308 K (a); T = 310 K (b); T = 312 K (c); T = 314 K (d).
Figure 2.
The spectrophotometric spectra of fatty (–) and defatty (–) human serum albumin (5 × 10⁻⁶ M) at concentrations of ibuprofen 1 × 10⁻⁴ M (dotted line) at the temperatures: T = 308 K (a); T = 310 K (b); T = 312 K (c); T = 314 K (d).

Figure 3.
The second derivative absorption spectra of fatty (–) and defatty (–) human serum albumin (5 × 10⁻⁶ M) at concentrations of ibuprofen 1 × 10⁻⁴ M (dotted line) at temperatures: T = 308 K (a); T = 310 K (b); T = 312 K (c); T = 314 K (d).
Figure 3.
The second derivative absorption spectra of fatty (–) and defatty (–) human serum albumin (5 × 10⁻⁶ M) at concentrations of ibuprofen 1 × 10⁻⁴ M (dotted line) at temperatures: T = 308 K (a); T = 310 K (b); T = 312 K (c); T = 314 K (d).

Figure 4.
Fluorescence intensification curves of fatty (■) and defatted (●) human serum albumin (5 × 10⁻⁶ M) at various concentrations of ibuprofen (1 × 10⁻⁵–1 × 10⁻⁴ M) at (a) 308 K, (b) 310 K, (c) 312 K, and (d) 314 K; λex 275 nm and λex 295 nm (in insert).
Figure 4.
Fluorescence intensification curves of fatty (■) and defatted (●) human serum albumin (5 × 10⁻⁶ M) at various concentrations of ibuprofen (1 × 10⁻⁵–1 × 10⁻⁴ M) at (a) 308 K, (b) 310 K, (c) 312 K, and (d) 314 K; λex 275 nm and λex 295 nm (in insert).

Figure 5.
Fluorescence quenching curves of tyrosine in fatty (■) and defatted (●) human serum albumin (5 × 10⁻⁶ M) at various concentrations of ibuprofen (1 × 10⁻⁵–1 × 10⁻⁴ M) at (a) 308 K, (b) 310 K, (c) 312 K, and (d) 314 K.
Figure 5.
Fluorescence quenching curves of tyrosine in fatty (■) and defatted (●) human serum albumin (5 × 10⁻⁶ M) at various concentrations of ibuprofen (1 × 10⁻⁵–1 × 10⁻⁴ M) at (a) 308 K, (b) 310 K, (c) 312 K, and (d) 314 K.

Figure 6.
CD spectra of fatty (–) and defatted (–) human serum albumin (5 × 10⁻⁶ M) at concentrations of ibuprofen 1 × 10⁻⁴ M (dotted line) at temperatures: T = 308 K (a), T = 310 K (b), T = 312 K (c), and T = 314 K (d).
Figure 6.
CD spectra of fatty (–) and defatted (–) human serum albumin (5 × 10⁻⁶ M) at concentrations of ibuprofen 1 × 10⁻⁴ M (dotted line) at temperatures: T = 308 K (a), T = 310 K (b), T = 312 K (c), and T = 314 K (d).


Table 1.
Stern-Volmer constants KSV (M−1) were calculated for IBU–SA systems.
| KSV (M−1) ± SD × 10−4 (M−1) | ||||
|---|---|---|---|---|
| λex 275 nm | λex 295 nm | Tyr | ||
| 308 K | HSA | 2.83 ± 0.04 | 0.73 ± 0.11 | 0.23 ± 0.12 |
| dHSA | 4.09 ± 0.13 | 1.48 ± 0.01 | 0.83 ± 0.03 | |
| 310 K | HSA | 3.10 ± 0.08 | 0.88 ± 0.05 | 0.33 ± 0.09 |
| dHSA | 5.05 ± 0.48 | 1.24 ± 0.02 | 0.51 ± 0.07 | |
| 312 K | HSA | 3.95 ± 0.11 | 0.87 ± 0.06 | 0.38 ± 0.06 |
| dHSA | 5.02 ± 0.47 | 1.27 ± 0.02 | 0.47 ± 0.07 | |
| 314 K | HSA | 4.76 ± 0.17 | 1.26 ± 0.04 | 0.53 ± 0.12 |
| dHSA | 6.71 ± 0.17 | 1.66 ± 0.01 | 0.57 ± 0.05 | |
SD: Standard deviation.
Table 2.
Association constants Ka (M−1), mean number of IBU moles bound with one mole of SA (n), and the Hill’s coefficient (nH) in the IBU-SA system.
Table 2.
Association constants Ka (M−1), mean number of IBU moles bound with one mole of SA (n), and the Hill’s coefficient (nH) in the IBU-SA system.
| Klotz Method | Hill Method | |||
|---|---|---|---|---|
| Ka (M−1) ± SD × 10−4 (M−1) n ± SD | Ka (M−1) ± SD × 10−4 (M−1) nH ± SD | |||
| λex 275 nm | HSA | dHSA | HSA | dHSA |
| 308 K | 0.51 ± 0.14 0.99 ± 0.03 | 1.70 ± 0.05 1.19 ± 0.12 | 0.11 ± 0.05 0.80 ± 0.12 | 0.65 ± 0.12 0.90 ± 0.12 |
| 310 K | 1.14 ± 0.11 0.98 ± 0.07 | 2.01 ± 0.13 0.91 ± 0.08 | 0.87 ± 0.10 0.83 ± 0.10 | 0.87 ± 0.07 0.85 ± 0.10 |
| 312 K | 1.02 ± 0.09 1.02 ± 0.05 | 2.35 ± 0.07 0.85 ± 0.13 | 0.79 ± 0.12 0.81 ± 0.11 | 0.89 ± 0.12 0.82 ± 0.10 |
| 314 K | 2.59 ± 0.10 2.59 ± 0.08 | 2.89 ± 0.10 0.96 ± 0.08 | 2.57 ± 0.01 0.84 ± 0.08 | 2.53 ± 0.12 0.86 ± 0.08 |
| λex 295 nm | HSA | dHSA | HSA | dHSA |
| 308 K | 0.83 ± 0.09 2.02 ± 0.21 | 0.82 ± 0.11 2.04 ± 0.43 | 0.63 ± 0.04 0.84 ± 0.02 | 0.86 ± 0.06 1.25 ± 0.23 |
| 310 K | 0.12 ± 0.03 1.01 ± 0.15 | 0.89 ± 0.05 1.01 ± 0. 10 | 0.08 ± 0.02 0.89 ± 0.07 | 1.08 ± 0.05 0.89 ± 0.07 |
| 312 K | 0.10 ± 0.05 1.01 ± 0.09 | 0.98 ± 0.06 0.95 ± 0.12 | 0.06 ± 0.02 0.81 ± 0.07 | 1.32 ± 0.18 1.23 ± 0.13 |
| 314 K | 1.02 ± 0.14 0.98 ± 0.17 | 1.33 ± 0.03 0.97 ± 0.04 | 0.63 ± 0.04 0.92 ± 0.05 | 1.29 ± 0.02 0.92 ± 0.05 |
| Tyr | HSA | dHSA | HSA | dHSA |
| 308 K | 0.09 ± 0.01 1.03 ± 0.03 | 0.74 ± 0.03 0.96 ± 0.05 | 0.10 ± 0.02 1.07 ± 0.05 | 0.68 ± 0.02 1.01 ± 0.03 |
| 310 K | 0.34 ± 0.05 1.02 ± 0.05 | 0.49 ± 0.06 1.06 ± 0.11 | 0.34 ± 0.08 1.03 ± 0.05 | 0.53 ± 0.03 1.03 ± 0.06 |
| 312 K | 0.06 ± 0.01 1.02 ± 0.03 | 0.45 ± 0.07 1.02 ± 0.09 | 0.07 ± 0.03 1.03 ± 0.05 | 0.59 ± 0.03 1.06 ± 0.07 |
| 314 K | 0.51 ± 0.09 1.02 ± 0.02 | 0.55 ± 0.05 0.98 ± 0.13 | 0.57 ± 0.03 1.08 ± 0.07 | 0.53 ± 0.03 1.02 ± 0.05 |
SD: Standard deviation.
Table 3.
θMRE at λmin for 5 × 10⁻⁶ M serum albumin in the temperature range 308–314 K.
| λmin (nm) | θMRE (deg·cm2·dmol−1) | λmin (nm) | θMRE (deg·cm2·dmol−1) | ||
|---|---|---|---|---|---|
| 308 K | HSA | 210 | −21,051.35 | 221 | −19,917.10 |
| IBU–HSA | 210 | −19,653.67 | 220 | −18,504.21 | |
| dHSA | 210 | −20,173.29 | 221 | −18,834.88 | |
| IBU-dHSA | 210 | −19,559.85 | 221 | −18,466.50 | |
| 310 K | HSA | 210 | −20,928.94 | 221 | −19,795.50 |
| IBU-HSA | 210 | −19,541.80 | 220 | −18,457.74 | |
| dHSA | 210 | −20,101.37 | 221 | −18,665.48 | |
| IBU-dHSA | 210 | −19,478.44 | 220 | −18,318.40 | |
| 312 K | HSA | 210 | −20,852.21 | 221 | −19,626.00 |
| IBU-HSA | 210 | −19,580.87 | 220 | −19,397.07 | |
| dHSA | 210 | −20,031.33 | 221 | −18,544.05 | |
| IBU-dHSA | 210 | −19,448.25 | 220 | −18,203.90 | |
| 314 K | HSA | 210 | −20,765.85 | 221 | −19,494.31 |
| IBU-HSA | 210 | −19,535.56 | 220 | −18,361.93 | |
| dHSA | 210 | −19,921.64 | 221 | −18,349.67 | |
| IBU-dHSA | 210 | −19,415.43 | 220 | −18,142.76 | |
Table 4.
The percentage (%) content of the secondary structure elements of 5 × 10⁻⁶ M serum albumin in the temperature range 308–314 K. Yang’s reference model.
Table 4.
The percentage (%) content of the secondary structure elements of 5 × 10⁻⁶ M serum albumin in the temperature range 308–314 K. Yang’s reference model.
| % α—Helix | % β—Sheet | % Other | ||
|---|---|---|---|---|
| 308 K | HSA | 55.6 | 9.2 | 35.1 |
| IBU-HSA | 59.0 | 1.2 | 39.9 | |
| dHSA | 58.7 | 1.8 | 39.5 | |
| IBU-dHSA | 56.1 | 8.5 | 35.4 | |
| 310 K | HSA | 55.8 | 8.7 | 35.4 |
| IBU-HSA | 59.0 | 1.7 | 39.3 | |
| dHSA | 58.8 | 1.8 | 39.4 | |
| IBU-dHSA | 56.5 | 8.0 | 35.6 | |
| 312 K | HSA | 55.9 | 8.3 | 35.8 |
| IBU-HSA | 58.9 | 1.4 | 39.7 | |
| dHSA | 59.1 | 1.3 | 39.5 | |
| IBU-dHSA | 56.6 | 8.1 | 35.3 | |
| 314 K | HSA | 56.1 | 8.0 | 35.9 |
| IBU-HSA | 58.9 | 1.1 | 40.0 | |
| dHSA | 59.1 | 1.2 | 39.8 | |
| IBU-dHSA | 56.7 | 7.0 | 36.3 | |
Publisher’s Note: MDPI stays neutral with regard to jurisdictional claims in published maps and institutional affiliations. |
© 2021 by the authors. Licensee MDPI, Basel, Switzerland. This article is an open access article distributed under the terms and conditions of the Creative Commons Attribution (CC BY) license (https://creativecommons.org/licenses/by/4.0/).
Share and Cite
MDPI and ACS Style
Ploch-Jankowska, A.; Pentak, D.; Nycz, J.E. A Comprehensive Spectroscopic Analysis of the Ibuprofen Binding with Human Serum Albumin, Part II. Sci. Pharm. 2021, 89, 30. https://0-doi-org.brum.beds.ac.uk/10.3390/scipharm89030030
AMA Style
Ploch-Jankowska A, Pentak D, Nycz JE. A Comprehensive Spectroscopic Analysis of the Ibuprofen Binding with Human Serum Albumin, Part II. Scientia Pharmaceutica. 2021; 89(3):30. https://0-doi-org.brum.beds.ac.uk/10.3390/scipharm89030030
Chicago/Turabian StylePloch-Jankowska, Anna, Danuta Pentak, and Jacek E. Nycz. 2021. "A Comprehensive Spectroscopic Analysis of the Ibuprofen Binding with Human Serum Albumin, Part II" Scientia Pharmaceutica 89, no. 3: 30. https://0-doi-org.brum.beds.ac.uk/10.3390/scipharm89030030