Article

The Optimization of a Dimenhydrinate Transdermal Patch Formulation Based on the Quantitative Analysis of In Vitro Release Data by DDSolver through Skin Penetration Studies

by
Bazigha K. Abdul Rasool
*,
Amira A. Mohammed
and
Yasmein Y. Salem
Pharmaceutics Department, Dubai Pharmacy College for Girls, P.O. Box 19099-Dubai, Muhaisnah-1, Dubai, United Arab Emirates
*
Author to whom correspondence should be addressed.
Submission received: 5 June 2021 / Revised: 28 June 2021 / Accepted: 12 July 2021 / Published: 16 July 2021

Abstract

:
Dimenhydrinate is an over-the-counter medication that is used to relieve nausea, vomiting, and vertigo caused by motion sickness. It has a short elimination half-life, possibly due to its first-pass metabolism. The current study aimed to prepare and evaluate new transdermal formulations of dimenhydrinate to prolong the drug’s release and improve its cutaneous permeation. First, the patches were fabricated and evaluated to determine their properties. The results were statistically investigated and considered significant at the p < 0.05 level. Additionally, the quantitative analysis of the drug-release data and kinetic modeling was performed by using the DDSolver software to decide the candidate formula dependably. The effect of the penetration enhancers on the permeability of dimenhydrinate from the selected patch was then studied ex vivo compared to the control sample, and the patch’s safety was evaluated in rabbits, using the skin-irritation test.

1. Introduction

The application of Transdermal Drug Delivery (TDD) technology in the formulation of pharmaceutical products has become increasingly important in the past few decades, as it has many merits [1]. The transdermal patch can deliver drugs steadily over a long period of time, with minimal adverse effects or treatment failure. This drug-administration route can avoid the first-pass metabolism and significantly improve the drug bioavailability and therapeutic outcomes [2]. TDD systems such as patches, gels, and films are non-invasive, painless dosage forms and require a simple application. Therefore, TDD excels compared to other drug-administration methods and has already achieved a high patient compliance. Fortunately, many drugs are candidates for transdermal delivery, such as drugs with a very short half-life, narrow therapeutic window, or poor oral availability [3].
However, these advantages cannot be fully achieved without incorporating appropriate polymers into the dosage form. The polymers used in the formulation should be inert, biologically safe, and chemically compatible with both the system’s excipients and the active pharmaceutical ingredient [4]. Additionally, they should provide a consistent and effective plasma profile of the drug during the period of application and sufficient shelf stability to achieve the desired therapeutic action. The literature has suggested the use of different polymers, such as ethylcellulose, Eudragit S100, chitosan, alginates, and hydroxypropyl methylcellulose as promising in the formulation of TDD systems [5]. The introduction of synthesized bioadhesive polymers with modified properties is an exciting approach in this area. The number of studies conducted on bioadhesive transdermal patches and their applications have explicitly increased with the launch of novel technologies, such as 3D printing and synthetic chemistry [6].
Furthermore, drug skin diffusivity and follicular targeting were achieved by incorporating numerous enhancers into the formulation, such as alcohols, polyalcohols, amines, amides, terpenes, and fatty acids [7].
Additionally, the evaluation of drug skin permeation in vitro is a supportive tool for pharmaceutical research scientists during the early stage of product development [8]. Diffusion cells, skin-PAMPA, strip stripping, confocal laser microscopy, and scanning microscopy are good examples of techniques available for assessing transcutaneous absorption [9]. Nowadays, advanced technologies for drug-delivery systems have been established to improve transdermal absorption and targeting. Nanoemulsions [10], nanoparticles [11], and vesicular lipid carriers [12] are some examples of these modern delivery systems. In addition, TDD systems have been developed to incorporate various kinds of medications, such as hydrophilic and lipophilic chemical moieties [13], natural products [14], and even vaccines [15].
Dimenhydrinate (DMH) is an over-the-counter antihistaminic drug that is often used as an antiemetic to prevent and treat nausea, vomiting, dizziness, and vertigo associated with motion sickness [16]. DMH is a white crystalline powder with a pKa of 8.87, and its water solubility equals 0.1 mg/mL. Its oral bioavailability ranges from 43% to 72%, perhaps due to the first-pass metabolism, with a peak plasma concentration of 64 ng/mL after approximately 2.5 h. The biological half-life of DMH is short, around 1 to 4 h; thus, it requires repeated administration [17]. Nevertheless, DMH is currently available in the pharma market as parenteral solutions; rectal suppositories; and oral tablets, coated tablets, suspensions, and solutions [17].
Based on the previous information, formulating a drug as a transdermal dosage form is rational and would increase the DMH bioavailability, decrease the required dosing frequency, and enhance patient compliance. Hence, the present study aimed to elucidate the applicability of incorporating DMH into transdermal patches, using different polymers. Various formulations were prepared and characterized in vitro. The software program DDSolver® was used to aid in the candidate formula selection based on the quantitative analysis of the in vitro release results. Data were fitted to various kinetic models. A further in vivo evaluation was also performed for the optimized formula.

2. Materials and Methods

2.1. Materials

DMH was a kind gift from JULPHAR Pharmaceuticals, Ras Al Khaimah, UAE. Hydroxypropyl methylcellulose K100M (HPMC K100M), ethylcellulose (EC), polyvinyl pyrrolidone (PVP), and eudragit S100 (ES100) were purchased from Sigma-Aldrich, St. Louis, MO, USA. Oleic acid (OA), propylene glycol (PG), glycerol, eucalyptus oil (Euc), and sodium hydroxide were obtained from Alpha Chemika, Mumbai, India. All other chemicals and solvents were of analytical grade.

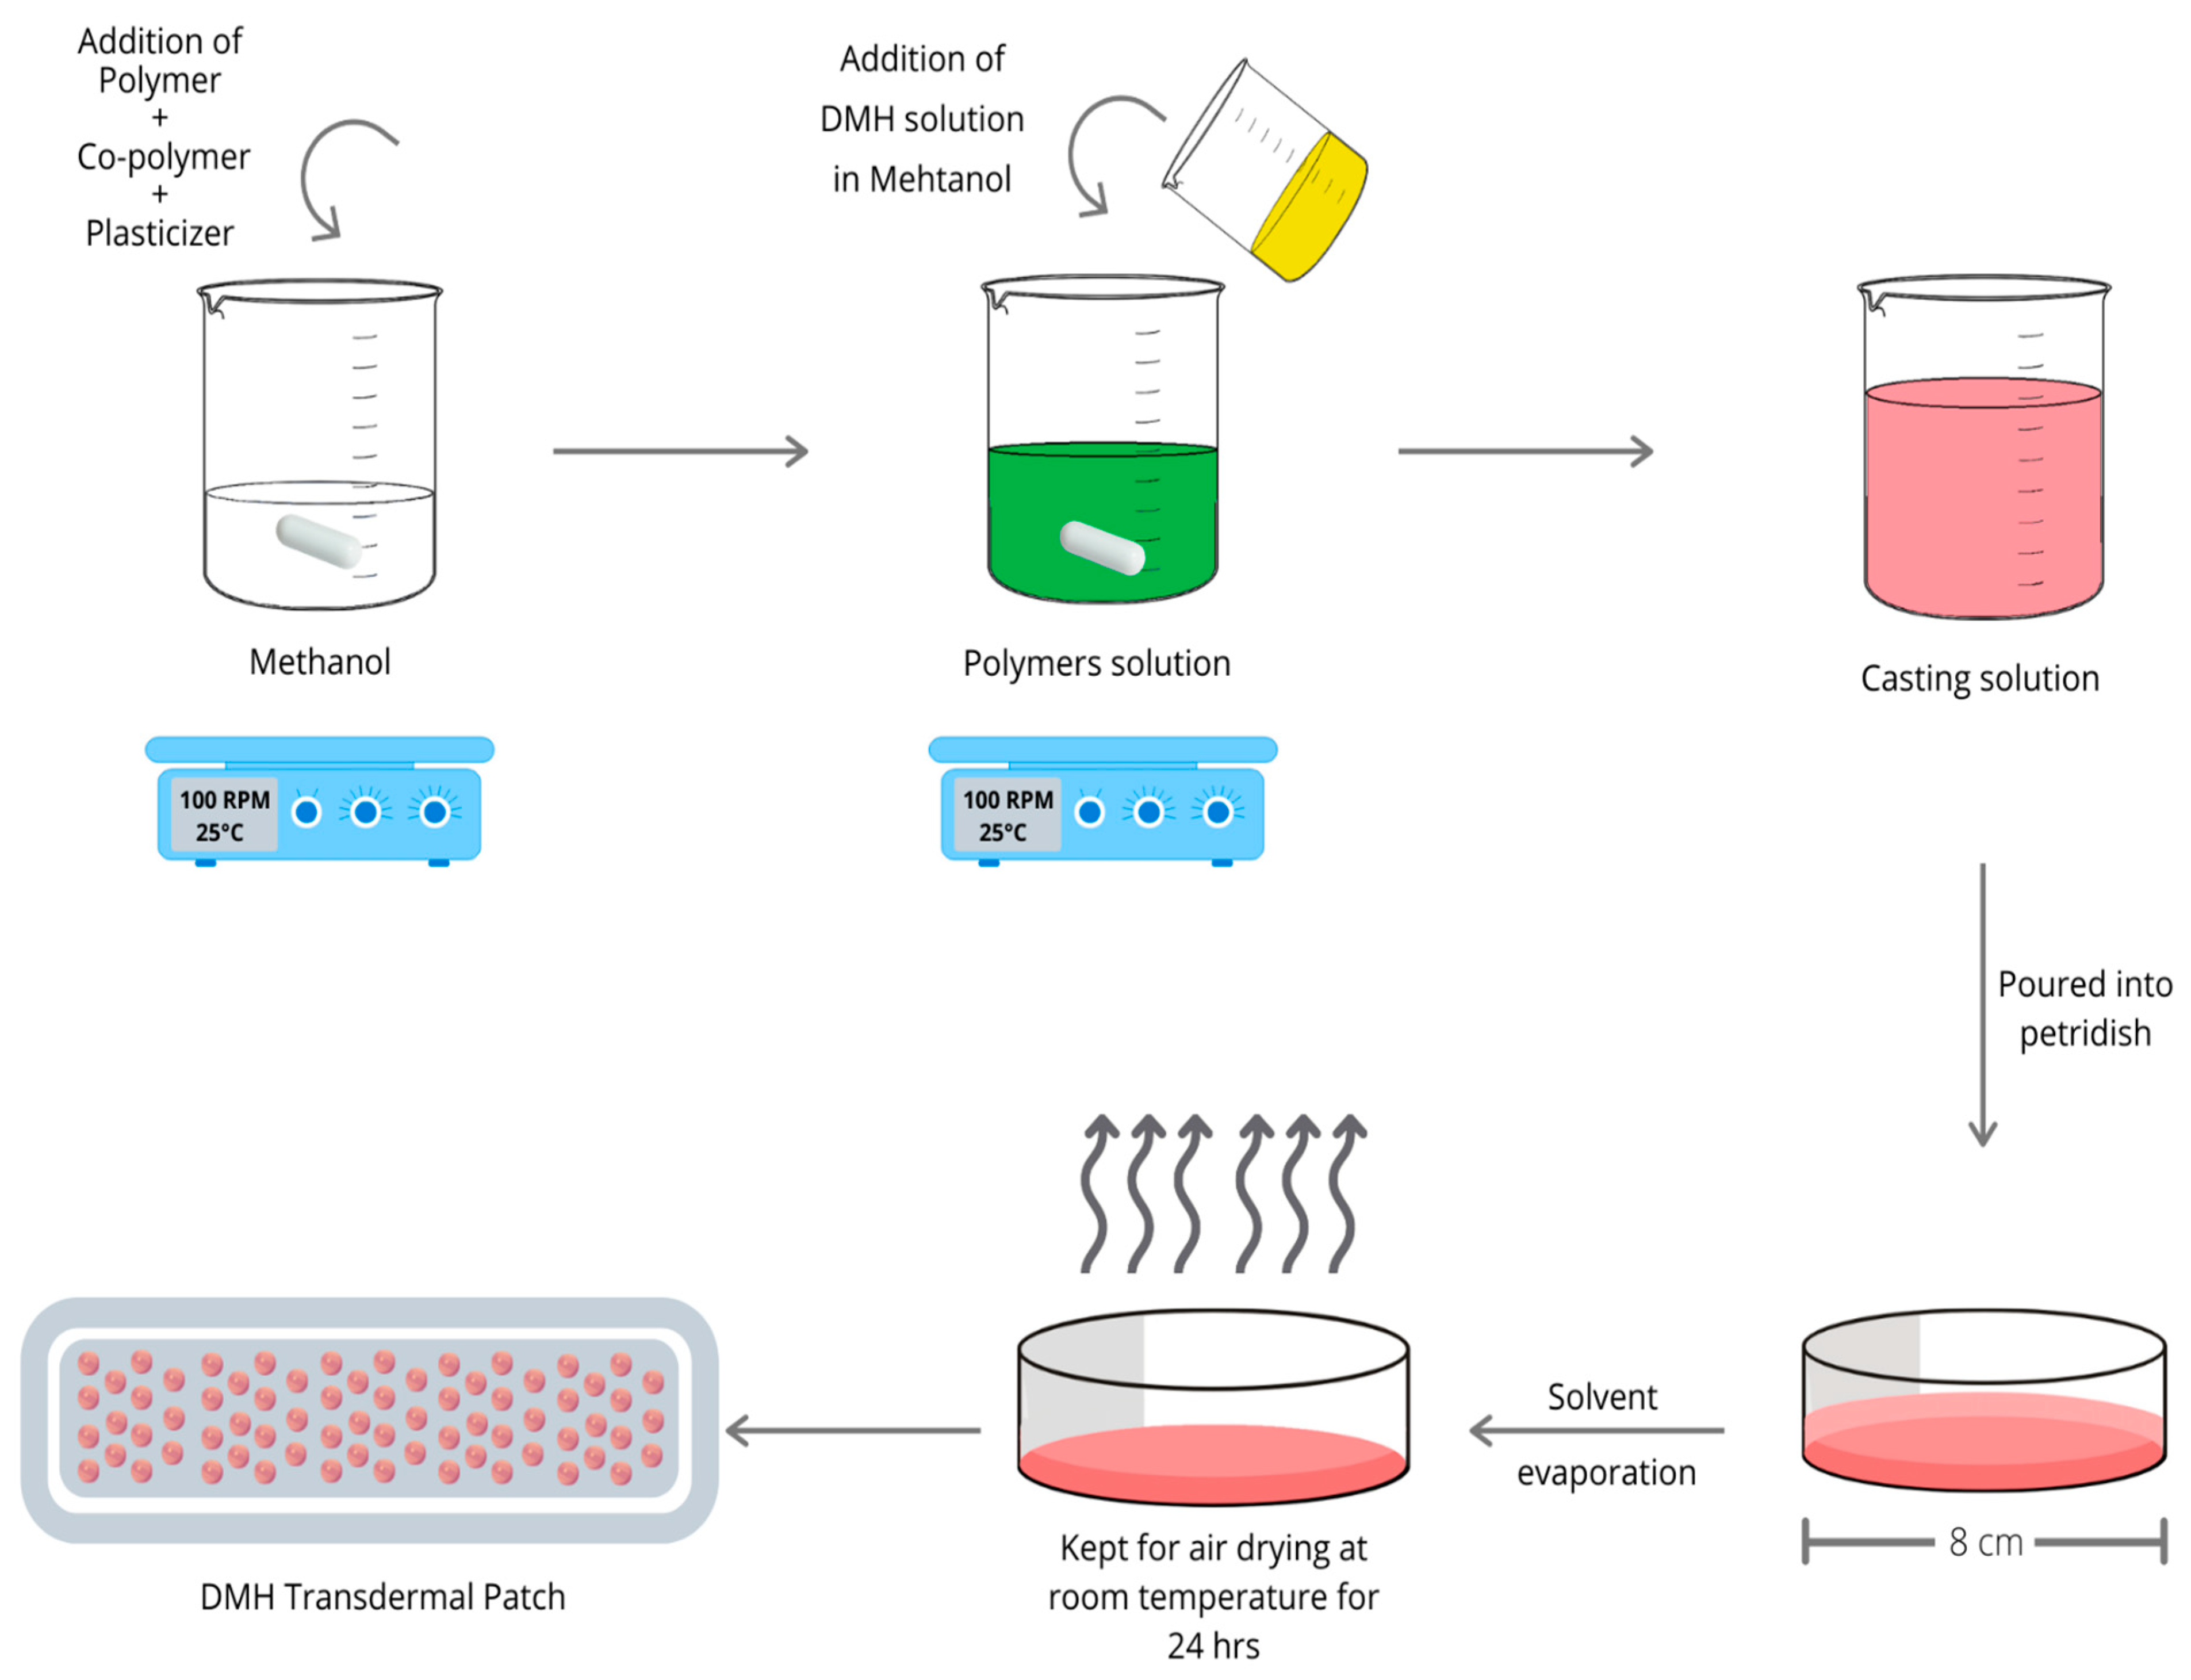
2.2. Preparation of DMH Transdermal Patches

DMH transdermal patches were fabricated by the solvent evaporation-patch casting technique (Figure 1). Different weight ratios of the polymers EC/ES100 with the copolymer PVP/HPMC were incorporated in the formulations. Ten milliliters of the casting solutions were prepared by dissolving a specific weight of the polymers, DMH 25 mg, and glycerol 15% w/w as a plasticizer into a suitable solvent, methanol. The casting solution was then poured into glass Petri dishes of 8 cm in diameter and dried at room temperature for 24 h. The patches were removed by peeling and cut into squares of 2 cm2. The patches were kept in desiccators containing sodium sulfate for 48 h for further drying, wrapped in aluminum foil, and packed in self-sealing covers [18].
DMH patch formulations with penetration enhancers were prepared by following the same procedure explained previously with various types and concentrations of the penetration enhances (PG, OA, and Euc).

2.3. Preliminary Screening

A preliminary study was conducted to assess the effect of using various polymer/copolymer combinations on the characteristics of the transdermal patch formulations. The constituents of the prepared DMH transdermal patches are shown in Table 1 and Table 2.

2.4. DMH Transdermal Patch Characterization

2.4.1. Patch Thickness and Surface pH

The patch’s thickness was measured at different places, using a screw gauge micrometer (Licencia, Sophia, Bulgaria), and the mean values ± SDs (n = 3) were calculated.
The patch’s surface pH was determined by the HANNA pH-meter (HI 8424, Woonsocket, RI, USA). The patches were kept in 5 mL of D.W. and allowed to swell for one hour at room temperature. The glass electrode was kept near the patch’s surface. Readings were allowed to equilibrate for a minute and then recorded [18].

2.4.2. Weight Uniformity

The patches’ weight uniformity was assessed by using a random selection of ten patches. Then each patch was weighed individually, and the mean weight ± SD was calculated [18].

2.4.3. Folding Endurance

Folding endurance was conducted by folding the patches until they broke. Thus, the number of times the patch could be folded at the same place without breaking/cracking was taken as the value of folding endurance [18].

2.4.4. Drug Content

A patch with a 2 cm2 area was dissolved in 100 mL of methanol, stirred for 24 h while using a magnetic stirrer, and then filtered to obtain a clear solution. Each formula’s drug content was determined by a UV–visible spectrophotometer (UV-1700, Shimadzu Corporation, Kyoto, Japan) at 278 nm after suitable dilution and against the blank, which was a solution of a drug-free patch.

2.4.5. Moisture Content

The sample patch was weighed accurately before the drying process began and then mounted over the moisture analyzer’s pan (Sartorius MA35, Göttingen, Germany). Results were obtained directly at the end of the analysis period by weighing the patch after drying. According to Equation (1), the mass difference represents the patch’s moisture content [19].
M o i s t u r e   C o n t e n t   % = I n i t i a l   W e i g h t     F i n a l   w e i g h t   I n i t i a l   W e i g h t × 100

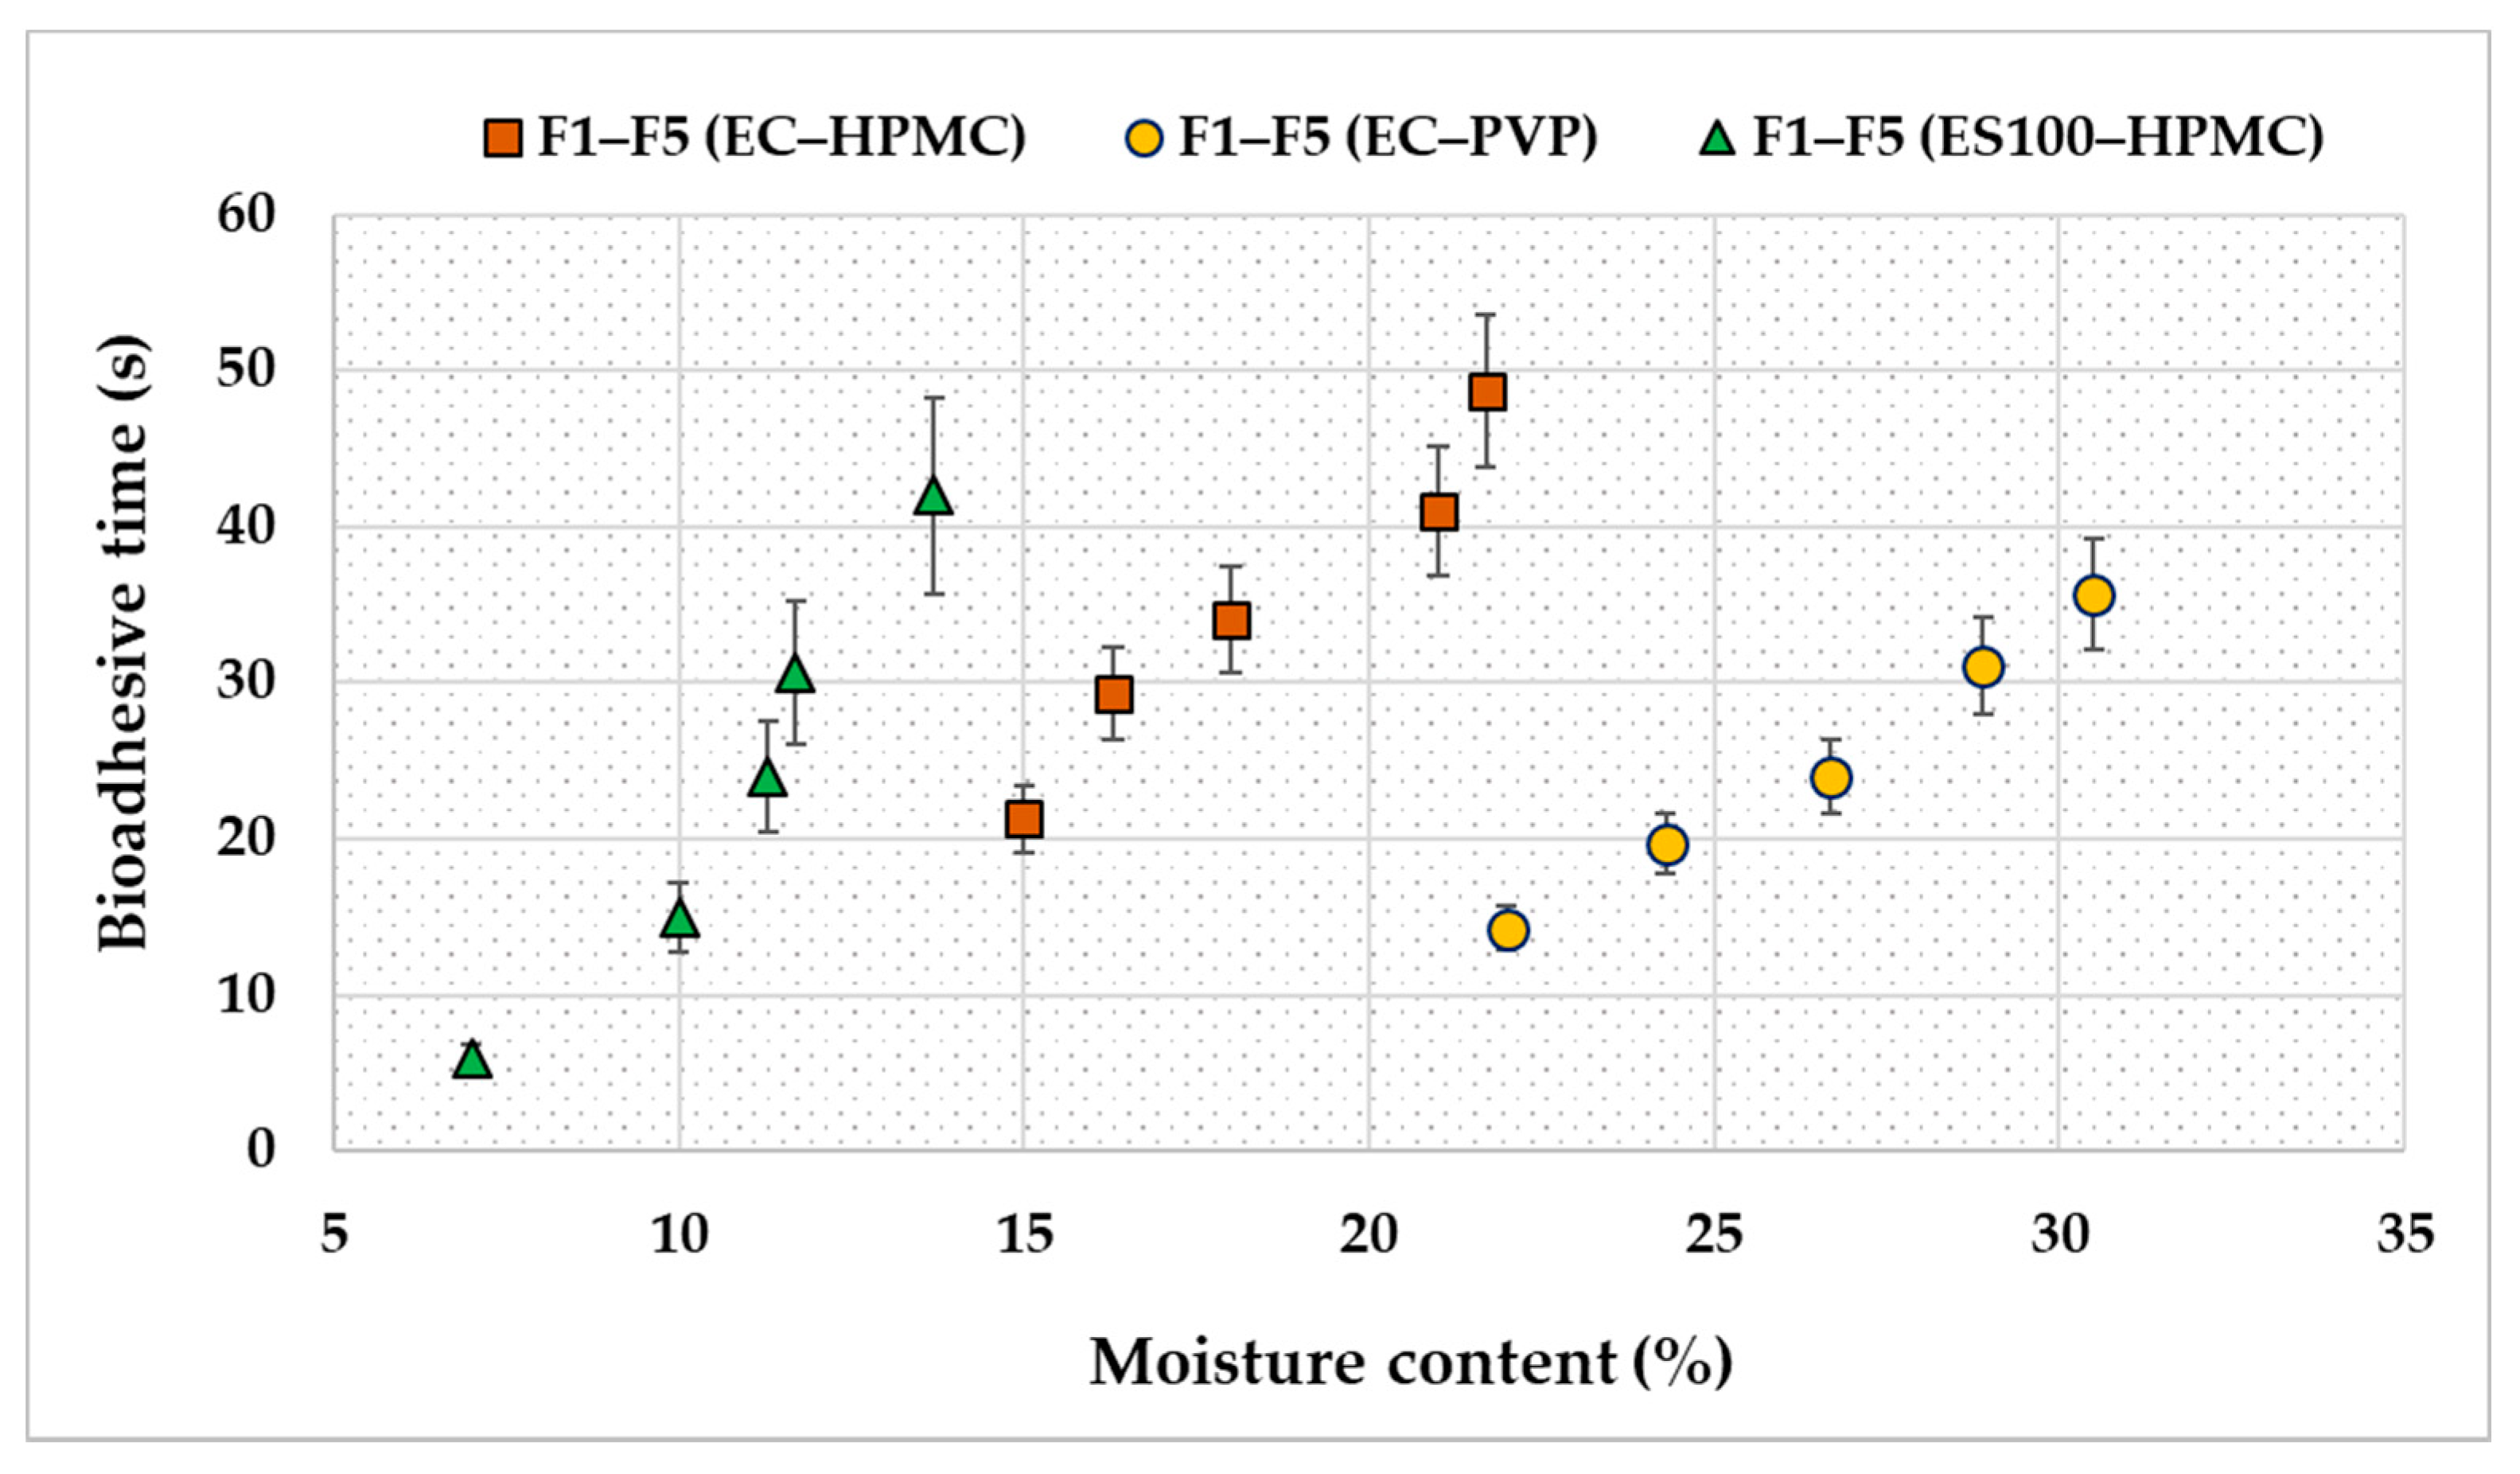
2.4.6. Adhesive Properties

The prepared patches’ adhesive properties were measured based on the time they remained adhesive to a sample skin. The test was carried out by using a paddle-type II UPS dissolution apparatus (Copley Scientific, Nottingham, UK). The patch was placed on a glass slide over a piece of hairless clean abdominal rat skin. The slide was then stuck to the paddle and immersed in a phosphate buffer at pH 7.4 (Figure 2). The time till the patch detached from the skin sample was recorded and considered as the adhesive time. Results were given as means ± SDs (n = 3) [20]. This study was approved by the Animal Ethical Committee (Reference# AR/PG/2016/02RE), Research Unit, Dubai Pharmacy College for Girls, Dubai, UAE.

2.5. In Vitro Drug Release

A cellulose acetate synthetic membrane (with a pore size of 0.45 μm) was used to determine the DMH release from the prepared matrix patches through the skin. The membrane was placed between the donor compartment and the recipient of the vertical diffusion cell (Copley® Scientific, Nottingham, UK). The receiver chamber of the diffusion cell was filled with phosphate buffer at pH 7.4 and thermostated at 32 ± 0.5 °C, which is the same as the average human skin temperature. The prepared patch formulation was placed on the membrane and covered with aluminum foil. The entire set was placed on a hot-plate magnetic stirrer, and the dissolution medium was stirred continuously with magnetic beads at 100 rpm. Samples were drawn at predetermined time intervals and analyzed to determine their drug content by a UV spectrophotometer (UV-1700 Shimadzu Corporation, Kyoto, Japan) at 278 nm. The receptor compartment was replaced with an equal amount of phosphate buffer in each sample withdrawal. The concentration of DMH was calculated by using the linear regression equation (y = 28.714x + 0.0177; R2 = 0.9994) of the DMH calibration curve, which was previously generated in phosphate buffer at pH 7.4, using a Microsoft® Excel sheet 2016.

2.6. Mathematical Analysis of DMH Release Data

Drug-release data were analyzed by using DDSolver® software, a menu-driven add-in program for Microsoft® Excel written in visual basic applications.
The data for the DMH release from the prepared patch formulations were evaluated kinetically, using the software DD Solver®, which was applied to derive different mathematical models, including zero-order, first-order, Higuchi, Korsmeyer Peppas, Hixon–Crowell, Hopfenberg, Baker–Lonsdale, and Makoid–Banakar [21]. The rate constant (K) and correlation coefficient (R2) values for each model were determined. Additionally, the release exponent “n” in the Korsmeyer–Peppas model was found to predict the mechanism of the DMH release mechanism from the patches.
Further mathematical analysis was conducted by generating the adjusted R2, Akaike Information Criterion (AIC), and Model Selection Criterion (MSC) for the drug-release data with the corresponding modeling. The correlation of residuals (Qo-Qc) versus time, the simulated area under the curve (AUC), and the mean dissolution time (MDT) were also generated.

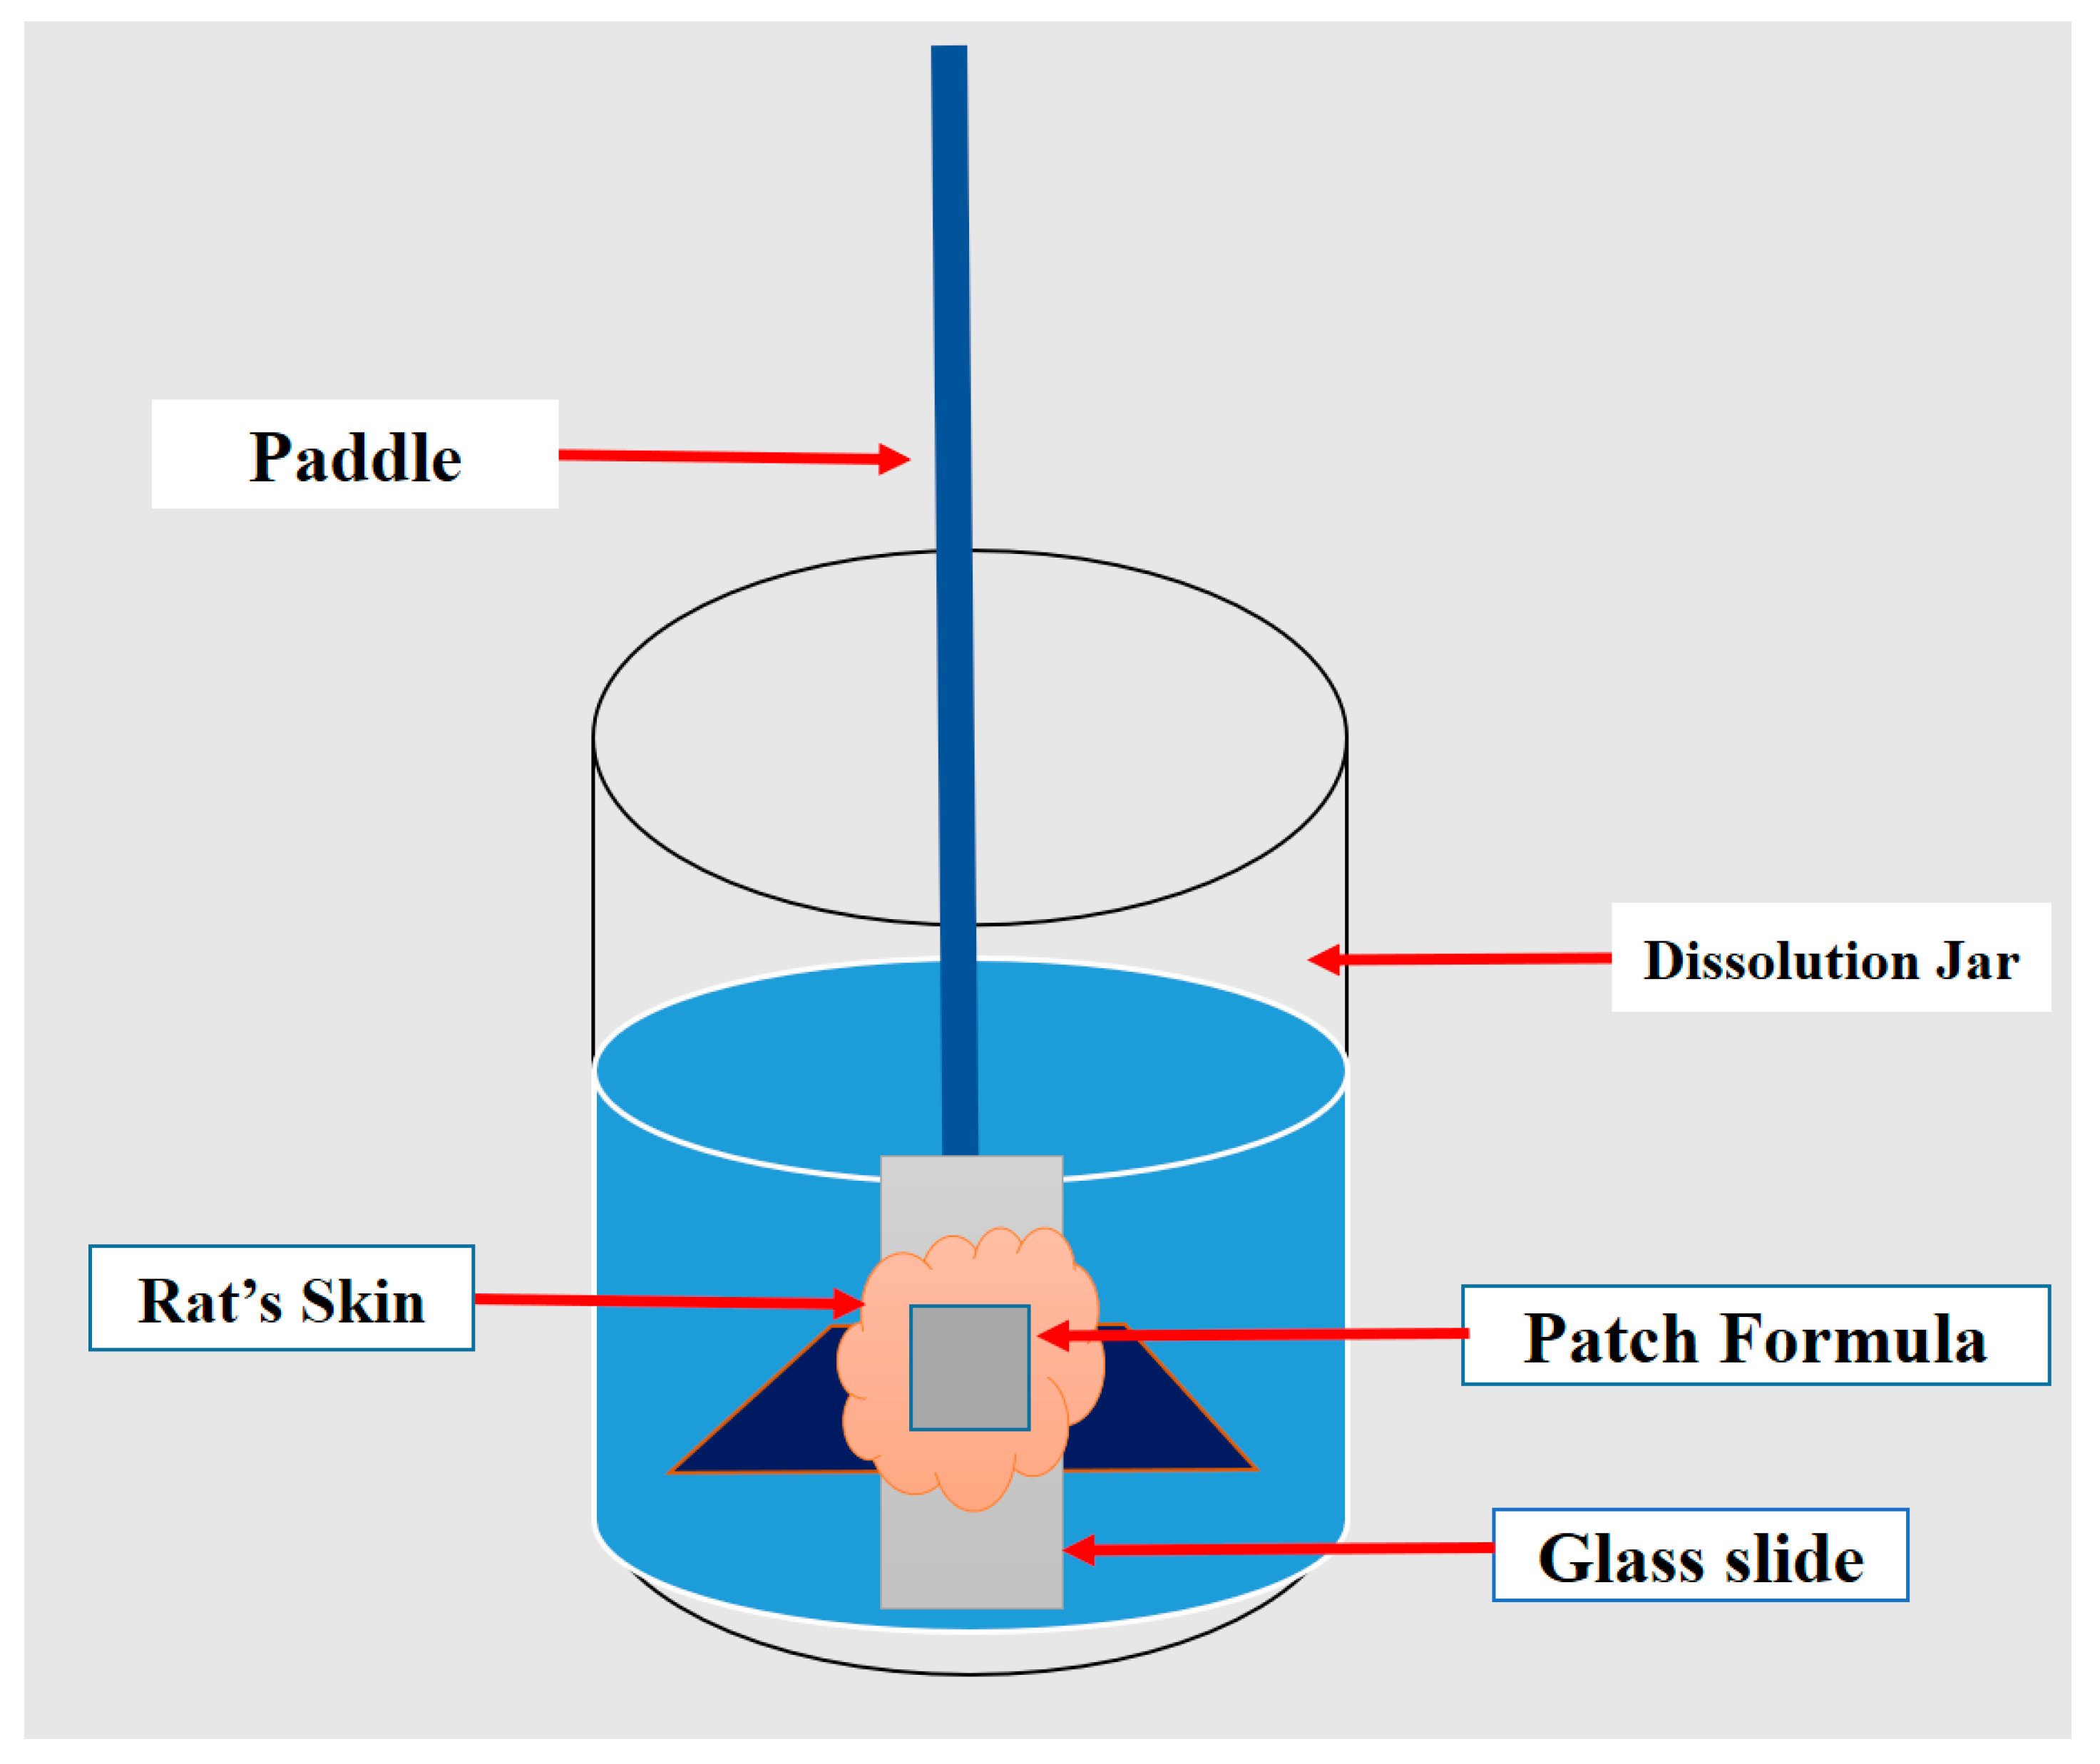
2.7. Ex Vivo Skin Permeation Study

2.7.1. Skin Preparation

Male albino rats weighing between 156 and 240 g were sacrificed by excessive chloroform inhalation. The rats’ abdominal skin was selected to conduct the permeation study. A hair removal cream was applied to remove the hair and cautiously separated without damaging the epidermis layer. The skin was defatted with diethyl ether, cut into small square pieces, washed several times with isotonic phosphate buffer, and stored at 20 °C. At the time of use, the skin was thrown and warmed to room temperature. This study was approved by the Animal Ethical Committee (Reference# AR/PG/2016/02RE), Research Unit, Dubai Pharmacy College for Girls, Dubai, UAE.

2.7.2. Experimental Design

DMH permeation through the excised rat’s skin was evaluated for the candidate formula F5(EC-HPMC) with various chemical permeation enhancers (Table 2), using a vertical Franz diffusion cell (Copley® Scientific, Nottingham, UK) with a section area of 6.15 cm2 and a receptor chamber with a 22.5 mL volume. The skin’s dermal side was placed in contact with the receptor’s fluid, while the patch was fixed above the stratum corneum layer. The receptor compartment was filled with 22 mL of phosphate buffer at pH 7.4, thermostated at 32 ± 0.5 °C, and stirred at a constant rate of 100 rpm. Samples were withdrawn from the receptor compartment at different time intervals and replaced with an equal volume of buffer to maintain sink conditions. The samples were diluted and analyzed by a UV spectrophotometer (UV-1700, Shimadzu Corporation, Kyoto, Japan) at 278 nm.

2.7.3. Data Analysis

The cumulative amount of DMH that penetrated through the skin per surface area was plotted against time to determine the slope and the intercept from the linear regression equation of the curve, which equal the lag time and steady-state flux (Jss), respectively. The enhancement ratio of each patch formulation compared to the control was computed by using Equation (2). The control sample was prepared as aqueous DMH dispersion containing an equivalent drug amount in the following formula [22]:
E n h a n c e m e n t   r a t i o   E r   = J s s   o f   p a t c h   f o r m u l a J s s   o f   c o n t r o l  

2.8. Skin-Irritation Study

A skin-irritation test was performed to identify possible skin reactions as erythema and oedema upon the patch application. The study was conducted according to international guidelines [23] and approved by the Animal Ethical Committee (Reference# AR/PG/2016/02), Research Unit, Dubai Pharmacy College For Girls. Healthy male Wistar rats (weight, 250–350 g) were obtained from the college’s animal house and used for this test. The rats were kept in cages under standard environmental conditions of light and temperature and were allowed free access to drinking water and a standard diet. The rats were divided into three groups of six rats each. A 2 cm2 area of the skin’s dorsal surface was cleaned well, wiped with surgical spirit, and shaved. The shaved skin was left overnight for any untoward reactions to the shaving. The test patch formulation was fixed over the respective test sites. The test sites were observed for erythema, oedema, or any toxic side effects 1, 24, 48, and 72 h after application compared to a histamine solution if 1 mg/mL (control) and a drug-free blank patch. Scores were assigned according to the Draize scoring method [24].

2.9. FTIR Spectroscopy Analysis

A FTIR study was carried out to determine the compatibility of the drug with the formulation excipients. The spectra were obtained for the pure drug, polymers (HPMC K100M and EC), and the selected formula F5(EC-HPMC) by using a FTIR spectrophotometer (Shimadzu Corporation, Kyoto, Japan). Solid-state samples were examined by the attenuated total reflection (ATR) technique, and the scanning wavelength was from 400 to 4000 cm−1.

2.10. Statistical Analysis

Statistical evaluation was performed by the one-way analysis of variance (ANOVA) test at a significance level of (p < 0.05), using IBM SPSS statistics software version 27, NY, USA. Data were expressed as means ± SDs.

3. Results and Discussion

3.1. Preliminary Studies

Patches formulations containing EC-HPMC, EC-PVP, and ES100-HPMC were transparent and of a homogenous texture (Figure 3), indicating that the technique “solvent evaporation-casting” was an efficient method for their preparation. However, patches containing ES100-PVP were brittle, rigid, and inflexible and could not be cast out of the petri dish. Therefore, formulations F1(ES-PVP) to F5(ES-PVP) were eliminated from the study.

3.2. Evaluation of the Transdermal Patches

The United States Food and Drug Administration recently introduced a new regulatory approach, Quality by Design (QbD), to enhance the desired quality of end products. The product design aspect defines a list of quality requirements known as a Quality Target Product Profile (QTPP) to improve and develop the final product in manufacturing [25]. Although QTPP for oral dosage forms is well defined, QTPP for topical dosage forms has not yet been established. In our study, several QTPP elements and parameterized quality requirements had been used to develop the DMH patch formulations, including surface pH, homogeneity and uniformity, folding endurance, drug content, moisture content, film bioadhesiveness, and in vitro release studies.
The results showed that the mean thickness ± SD of the prepared patches was in the range of 0.08 ± 0.0096 to 0.27 ± 0.0141 µm, as presented in Table 3. The low standard deviation (SD) value in the measurements ensured the patches’ thickness consistency. These results are promising, since the patch’s thickness is an essential factor influencing the drug’s uniformity, release pattern, and eventually controlled drug diffusion via the skin [26].
The folding endurance value of most of the patches was found to be satisfactory (Table 3), indicating that the use of glycerol as a plasticizer at a concentration of 15% w/w was adequate to optimize the patches’ flexibility and elasticity. The type and weight ratio of the polymer/copolymer in the patches affected the patches’ flexibility. Increasing the copolymer content significantly (p < 0.05) increased the patches’ flexibility. F5(EC-HPMC) and F5(EC-PVP) achieved maximum folding endurance (Table 3). Additionally, the folding endurance and elasticity of EC patches were higher than those with ES100. These results predicted the EC polymer matrix and high copolymer content for the patch formulation.
The surface pH of the prepared patches needed to be approximately the same as that of the skin to avoid irritation upon applying the patch. The skin pH approximately equals 5.5 [27]. The surface pH of the fabricated DMH patches ranged between 7.31 and 6.12, signifying their safety and skin compatibility (Table 3). A further in vivo irritation test was performed to confirm their safety.
The physicochemical properties of the prepared patches, including drug content, moisture content, and adhesive time, are shown in (Table 3). The percentage drug content for all formulations was in the range of 95 ± 1.01 to 99 ± 2.08, proving that the method used to prepare patches in this study could give patches with a uniform distribution of the drug.
Furthermore, a patch moisture content study was conducted because the patch moisture content needs to be within a certain range to ensure the formulation’s stability and protect the material from bacterial contamination [28]. However, it is necessary to have a small percentage of moisture in the formulation to maintain the patches’ elasticity, density, and bioadhesive properties. Generally, the moisture content percentage increased with the PVP and HPMC concentrations; hence, both are hydrophilic polymers. Nevertheless, the increment in PVP-containing patches was more than that with HPMC copolymer. The maximum moisture content (28.5 ± 0.62%) was found with F5(ES-PVP). Our findings agreed with those previously obtained by Prajapati et al. [28]; they fabricated repaglinide-loaded transdermal patches from different grades of HPMC and found that the moisture content in the prepared patches was increased by the increase in the concentrations of PVP K30 and HPMC.
The value of adhesion time was mainly affected by the amount and nature of the polymer and copolymer in the formulations. Evidently, increasing the concentration of the hydrophilic polymer in the formulations prolonged the adhesion time. The highest mean adhesion time (48.7 ± 1.5) was achieved by F5(EC-HPMC) (Table 3). This result can be explained by the fact that hydrophilic polymers can interact more efficiently with the water present in the stratum corneum and increase the bioadhesive properties. Similar results were obtained by Junior et al., who reported that the cutaneous ureasil–polyether hybrid films formed by more hydrophilic PEO chains were more bio-adherent. Moreover, HPMC-containing patches showed favorable bioadhesive properties compared to those with PVP, which can be attributed to the presence of hydrogen-bonds-generating functional groups (OH-) in the HPMC molecule, necessary for the interaction with biological surfaces [29,30].
Moreover, it was noticed that the moisture content directly affected the adhesiveness of the patches for all the polymer and copolymer combinations. Hence, an increase in the patches’ moisture content resulted in a longer adhesion time (Figure 4). Indeed, hydration is one of the essential factors affecting the bioadhesion of polymers. As reported previously, polymer hydration is required to induce the mobility of the polymer’s chains and improve the interpenetration process between the bioadhesive polymer and the mucous tissue [31]. Additionally, the polymer’s swelling and expansion encourages hydrogen bonding or electrostatic interaction between the polymer chains and the biological surfaces [32].

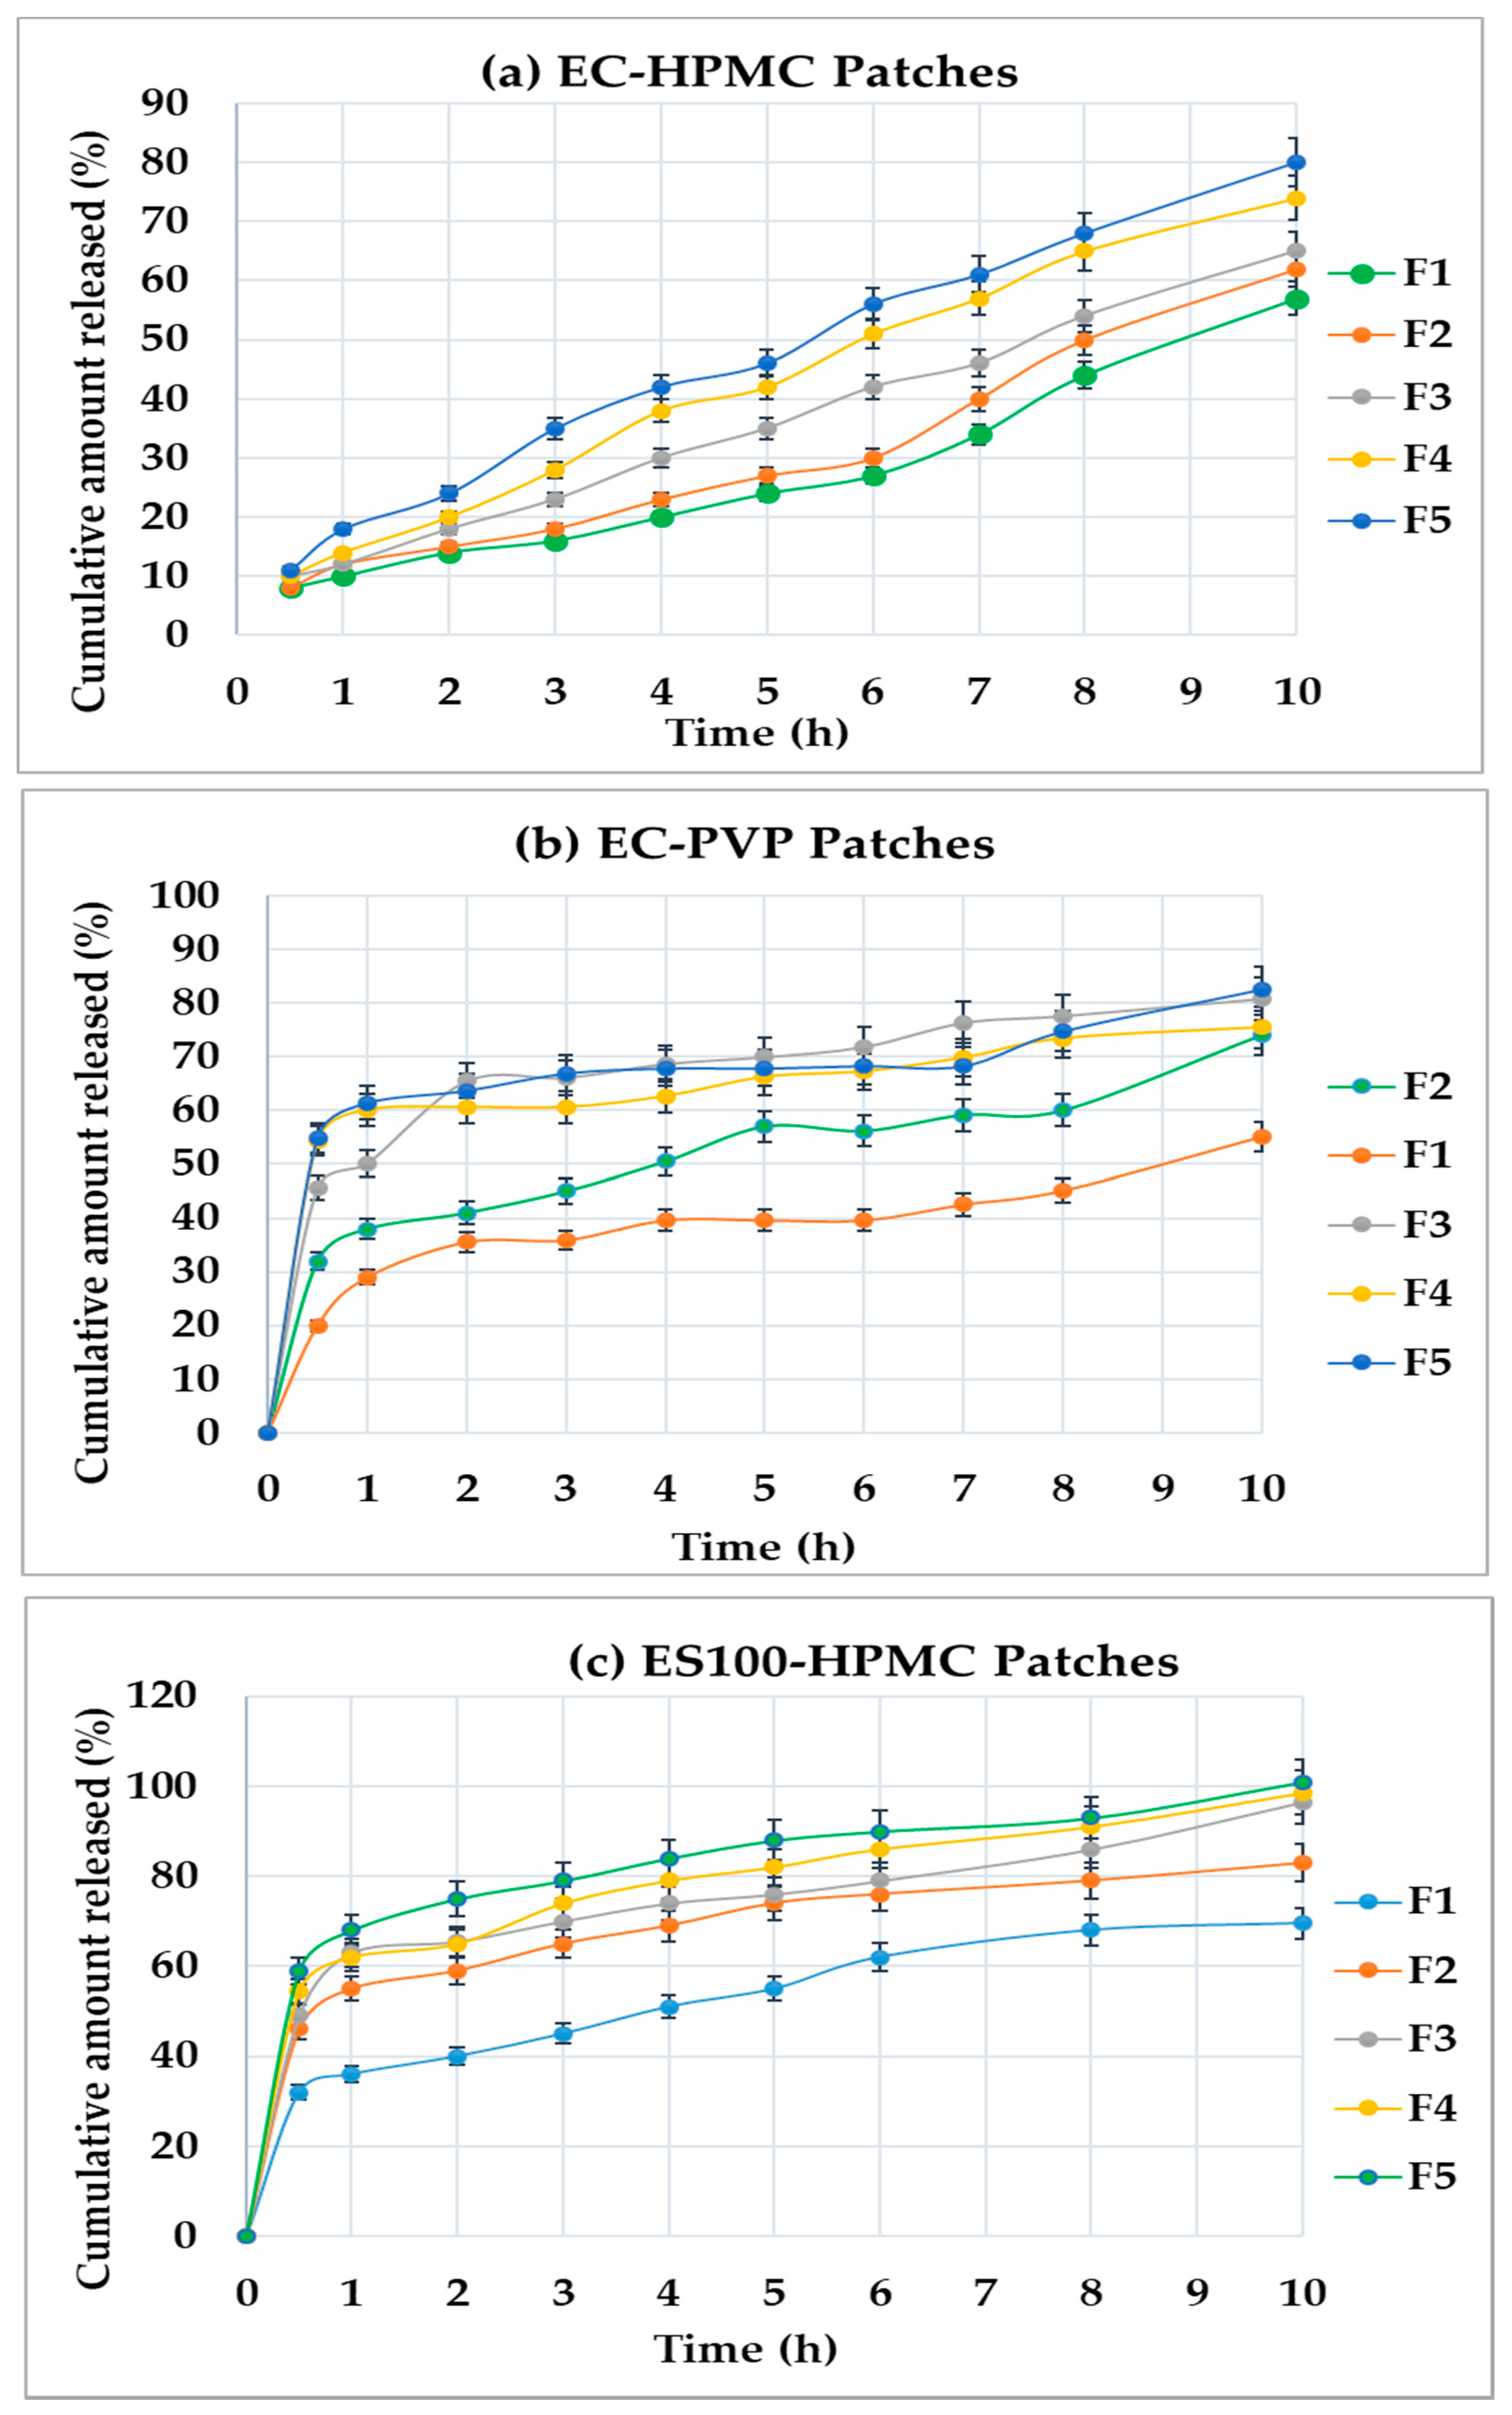
3.3. In Vitro Drug Release

The drug-release profiles of the formulated transdermal patches containing different compositions and polymers’ ratios are shown in Figure 5a–c.
The cumulative percentage of DMH released versus the time profiles of Set-1 of the formulations (composed of EC and HPMC) showed no burst drug release with a regular and continuous prolonged pattern during the 10 h of the run. The drug release (Q10) was approximately 57%, 62%, 65%, 69%, and 80% from F1 to F5, respectively (Figure 5a). Since EC is insoluble in water and aqueous fluids, it was mixed with water-soluble additives (HPMC) to solubilize the drug and maintain a constant prolonged release in the dissolution medium. The amount of the drug released was significantly (p < 0.05) more from F5, indicating the noticeable effect of the HPMC content in the formulation.
Patches containing EC and PVP (Set-2) released about 74%, 55%, 81%, 75%, and 83% of DMH from formulations F1–F5, respectively (Figure 5b). Increasing the amount of PVP resulted in a corresponding increase in DMH release. PVP is a hydrophilic water-soluble polymer that can improve a drug’s solubility and consequently dissolution rate [33]. The patches displayed the burst drug release during the first hour. followed by a sustained release up to 10 h through the run, specifically at high weight ratios (1:1, 2:3, and 3:7) of the polymer:copolymer.
The DMH release from patches containing ES100 plus HPMC (Set-3) also exhibited a burst drug release during the first hour, followed by a gradual sustained release, up to 10 h, through the run. Additionally, increasing the polymer to copolymer weight ratio showed a relevant increase in the cumulative percentage (Q10) of DMH released. The formulations F1–F5 showed releases of about 69.5%, 83.2%, 97.1%, 98.9%, and 101% at 10 h, respectively (Figure 5c). The burst effect could be due to the drug solubilization by the hydrophilic polymer ES100, which is soluble in an alkaline phosphate medium. Later on, the swelling of the polymer in the dissolution medium, forming a gel-like layer, resulted in controlling the drug release in a sustained pattern [34].
The following facts were concluded after performing a statistical analysis of the drug-release data for the formulations, using a one-way ANOVA test, considering the release profiles:
  • The amount released of DMH was significantly (p < 0.05) highest from the patches prepared from ES100-HPMC compared to other formulae with EC-HPMC and EC-PVP.
  • There were insignificant (p > 0.05) differences (Q10) between Set-1 and Set-2 patches.
  • Patches containing the EC-HPMC displayed desirable sustained drug-release profiles from their matrices. In contrast, the Set-1 and Set-2 patches showed an unwanted initial burst drug release, followed by a sustained pattern.
Based on the bioadhesive properties and the results of the release study, EC-HPMC-containing patches were selected and considered for further investigation. Later, a quantitative analysis of the drug-release data was performed by using the DDSolver software to determine the drug-release mechanism and decide the optimized formulation to proceed with the ex vivo and in vivo studies.

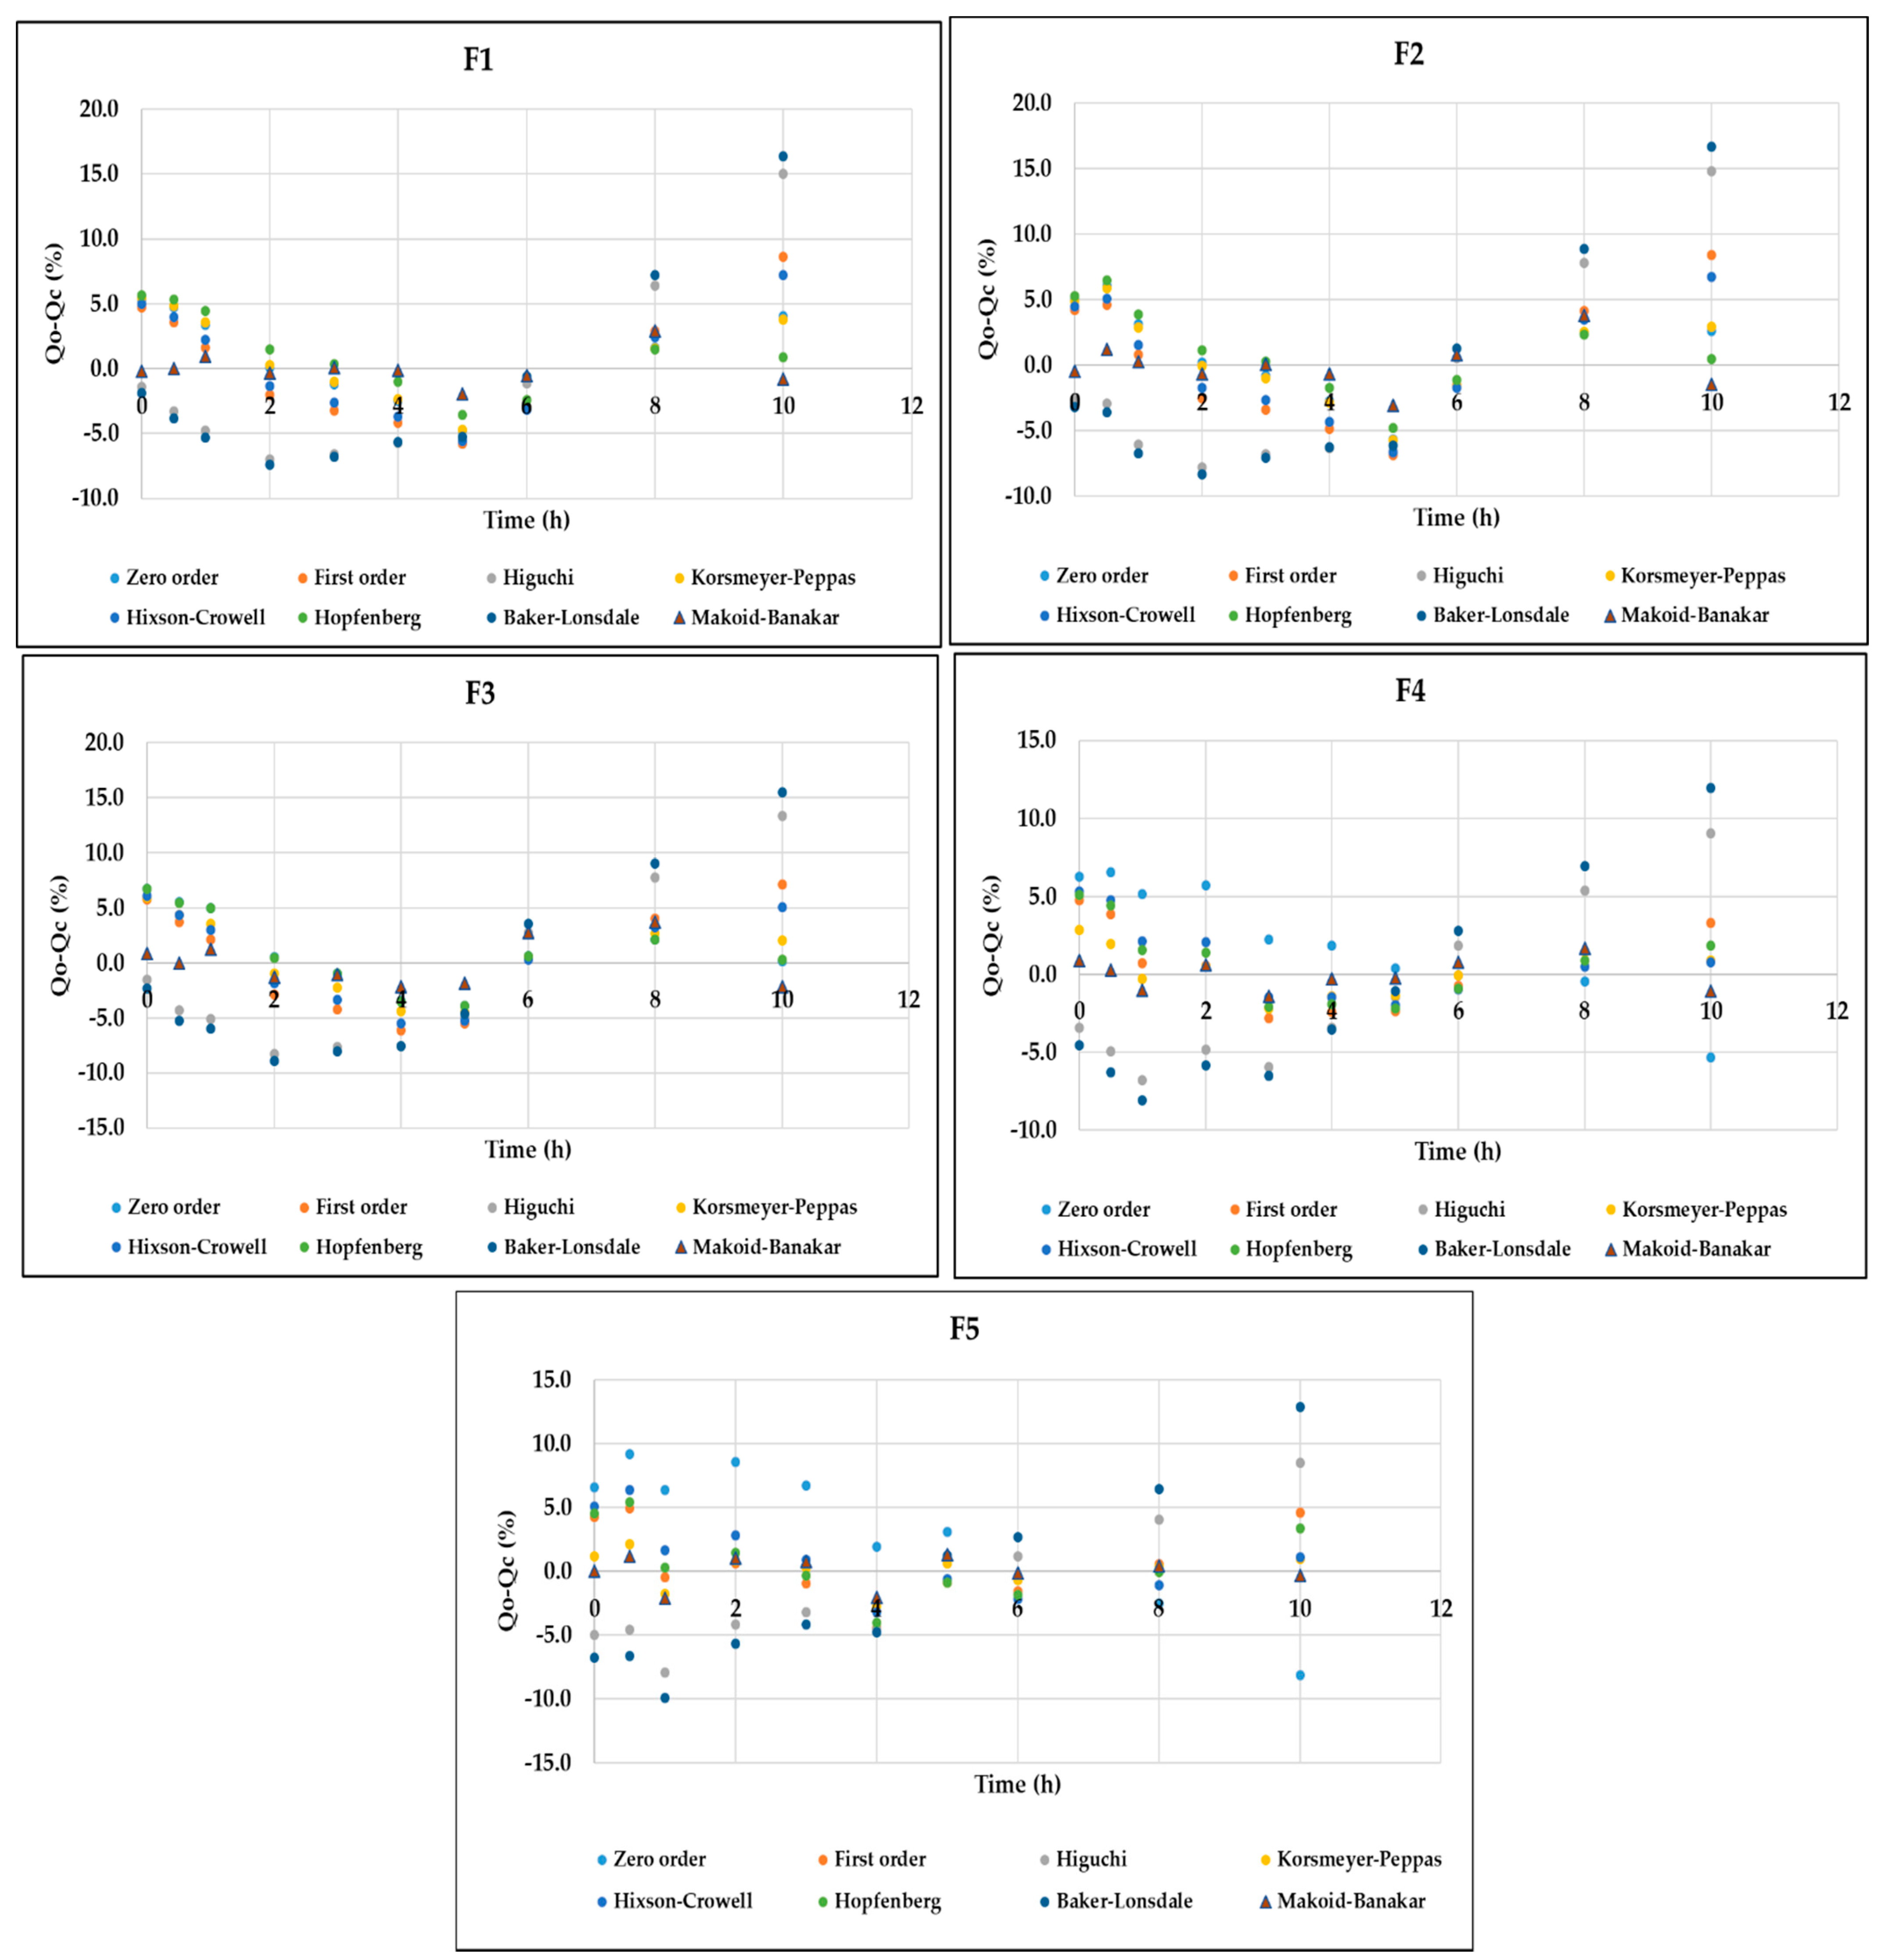
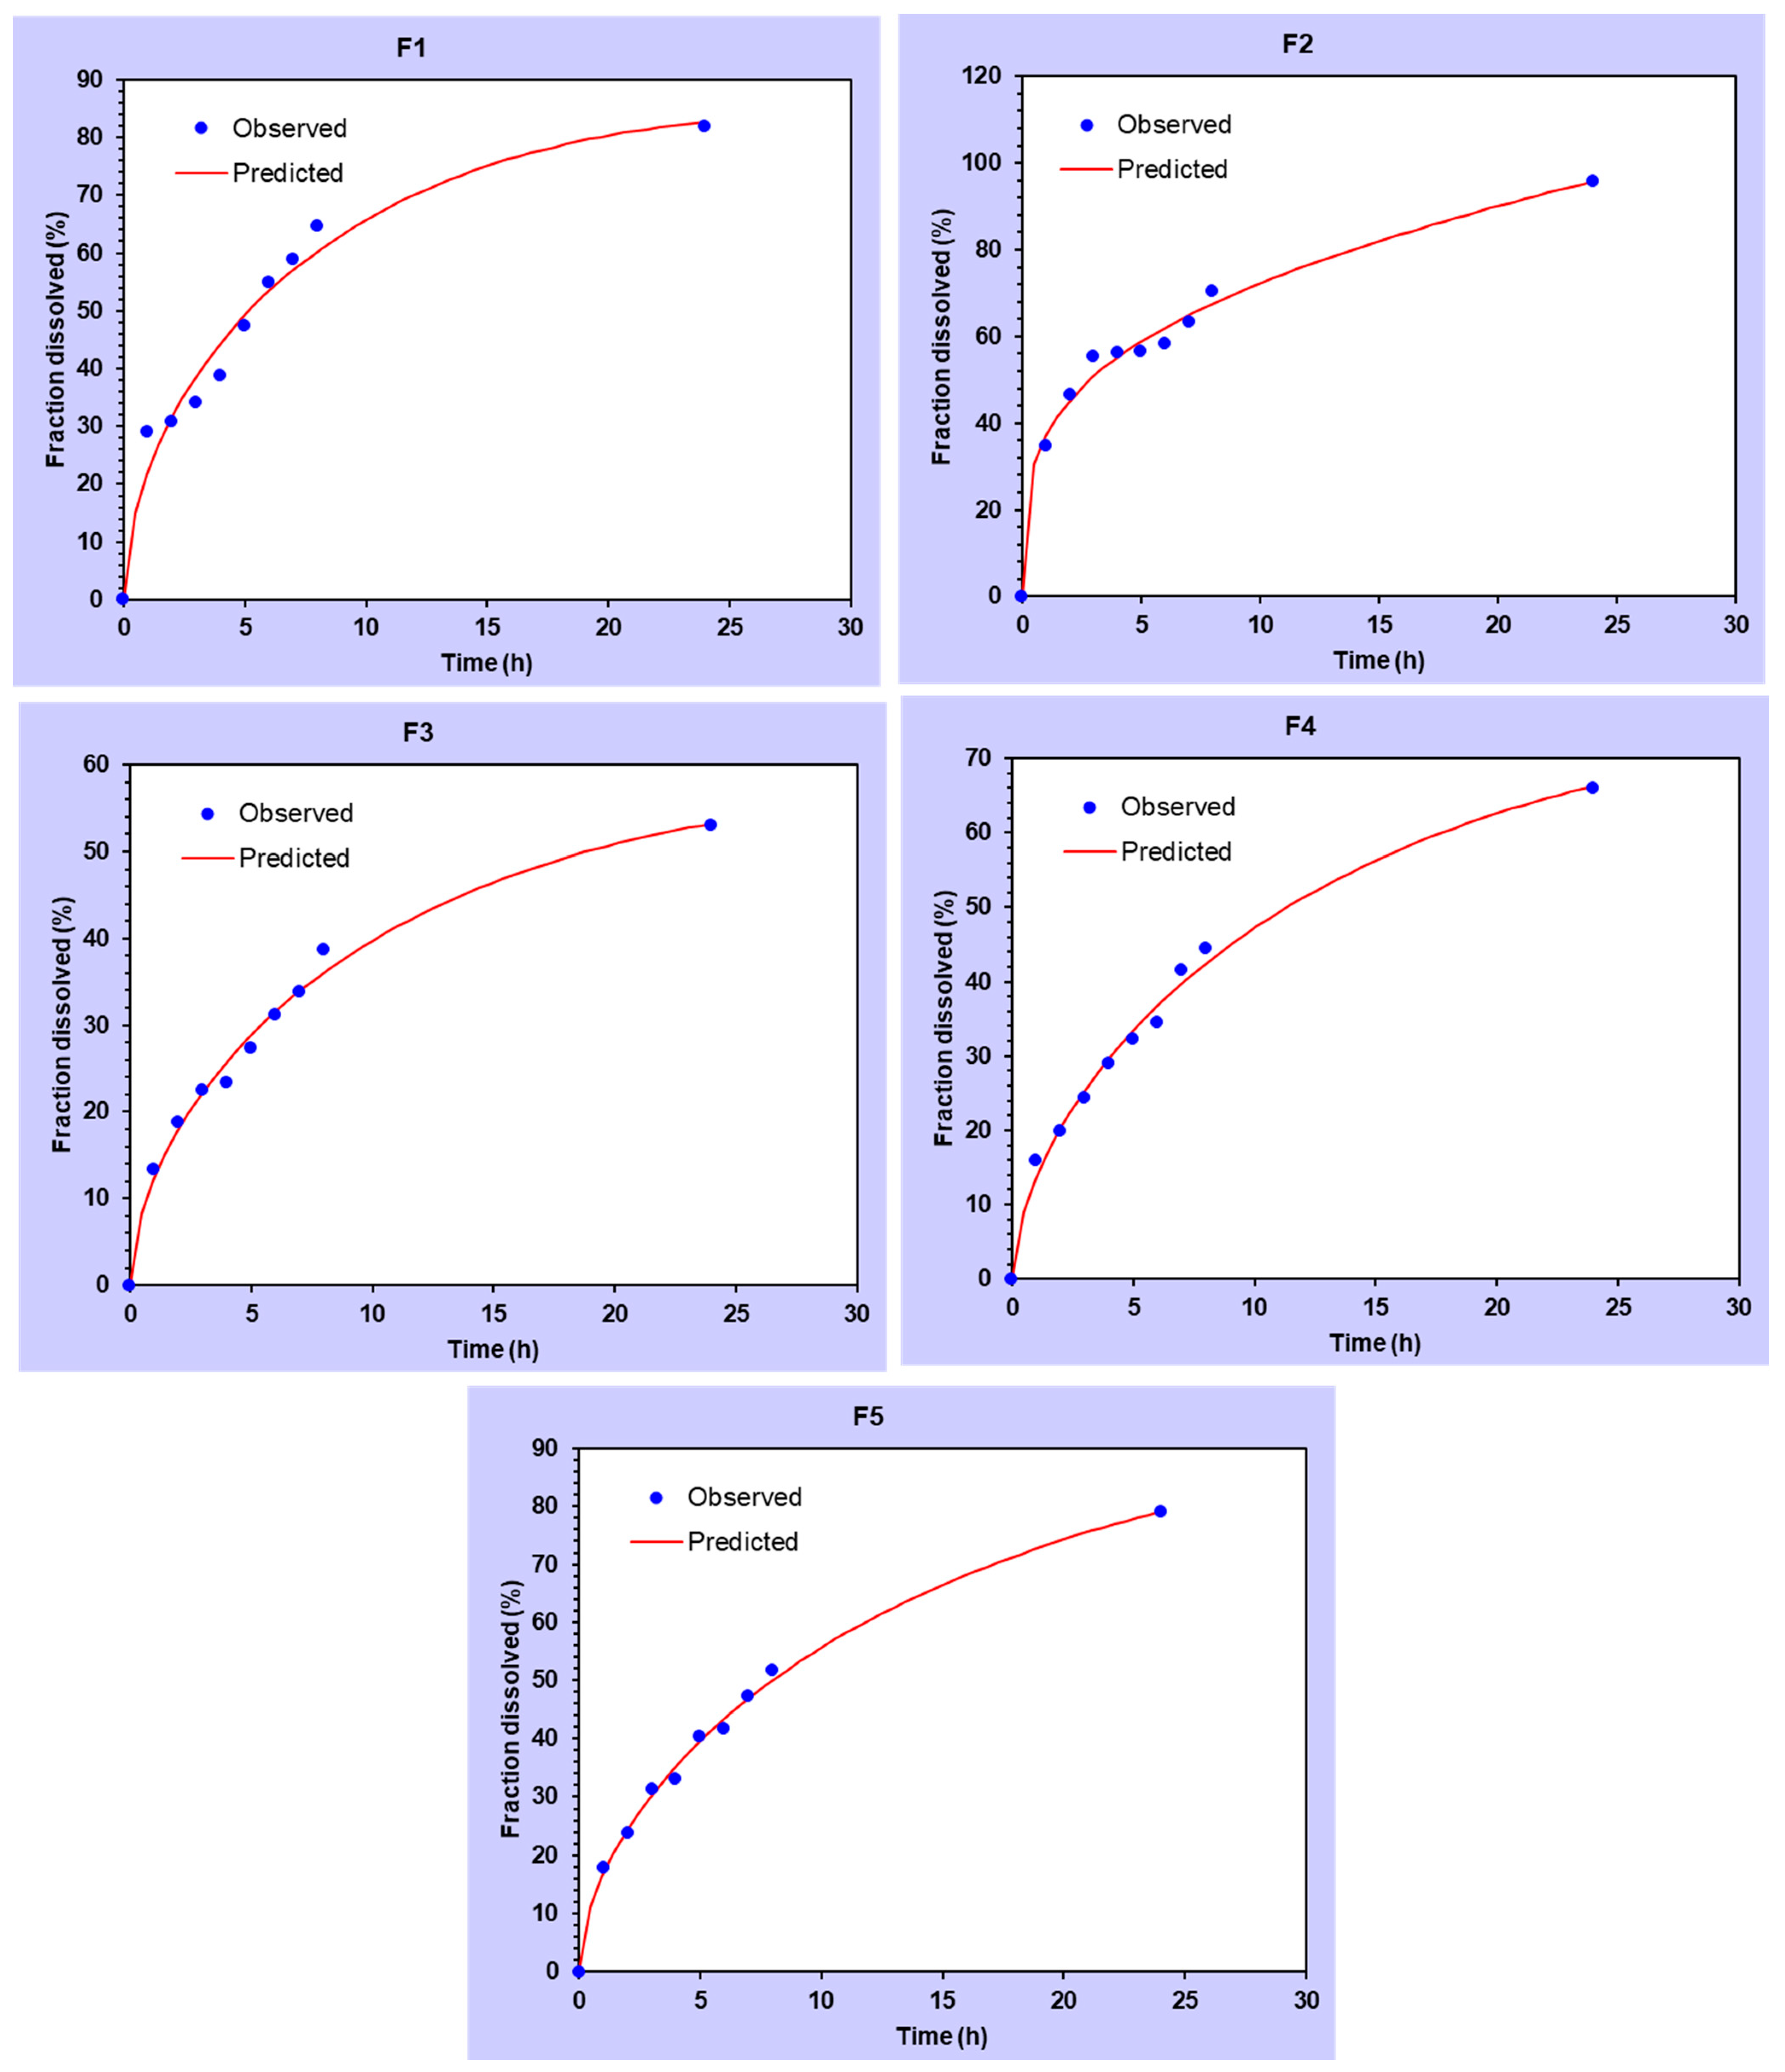
3.4. In Vitro Release Analysis of DMH from F1–F5 (EC-HPMC)

DMH in vitro release data from the patch formulations were fitted to different kinetic models, including zero-order, first-order, Higuchi, Korsmeyer–Peppas, Hixon–Crowell, Hopfenberg, Baker–Lonsdale, and Makoid–Banakar, using the DDSolver software program for dissolution analysis [35].
Table 4 demonstrates the kinetic models that were applied to the F1–F5 release data. The R2 adjusted value was used as the Model Selection Criterion. The best model would be the highest and closest to the 1.0 adjusted correlation coefficient (R2). The same mathematical analysis was also performed for other formulations (EC-HPMC and EC-PVP) and is shown as Supplementary Materials for this article (Supplementary 1a,b).
The results revealed that the prepared DMH patches F1–F5 (EC-HPMC) exhibited the tendencies of the Makoid–Banakar model, in which the R2 adjusted values were (0.9819, 0.9862, 0.9833, 0.9967, and 0.9961), respectively, suggesting the diffusion-controlled release of DMH from the patch matrix. However, when the c value of the Makoid–Banakar model approaches zero, the model becomes identical to the Korsmeyer–Peppas model [36]. The release exponent “n” indicates the type of drug-release mechanism, followed by the formulation. In the current study, the “n” values of formulations F2, F3, F4, and F5 were found to be between 0.5 and 1 (0.983, 0.914, 0.752, and 0.697, respectively), indicating anomalous non-Fickian transport, which was controlled by diffusion and a polymer erosion release mechanism [37]. Meanwhile, the F1 “n” value was more than 1 (n = 1.014), indicating the non-Fickian super case-II mechanism of release, where the drug-release rate corresponds to zero-order release kinetics and is controlled by the polymer’s swelling or the relaxation of polymeric chains’ in a planner thin-film geometry [38].
As is known, the term “diffusion” refers to the movement of molecules with the concentration gradient after exposure to stimuli that affect their external environment. This occurs when the swelling rate of the cross-linked matrix of the patch is significantly faster than the rates of degradation or dissolution caused by the erosion mechanism. The permeation of the dissolution medium into the matrix leads to swelling systems. In contrast, the erosion mechanism is associated with changes in the physicochemical properties of the polymeric material, such as matrix swelling, deformation, or disintegration. Dissolution is the rate-limiting stage of the erosion-controlled release systems [24].
In addition, it was previously reported that the mechanism of the drug-release principally is diffusion for high-solubility drugs and erosion for low-solubility drugs or a combination of both. At the same time, the polymer’s viscosity controls the rate of erosion [39]. Hypromellose (HPMC) is a multipurpose controlled-release polymer with broad applications in sustained release dosage forms. Generally, higher molecular weight and viscosity grades such as HPMC K100M (viscosity is 100,000 mPa·s) can control the drug release through drug diffusion via the swollen gel layer [40].
The R2 adjusted was considered the most suitable parameter to compare the dissolution models; nevertheless, the results showed a high similarity between F1 and F5. Therefore, other statistical criteria were applied by using the DDSolver, including the Akaike Information Criterion (AIC) and the Model Selection Criterion (MSC).
The model with the smallest AIC value is the most precise, while the model with the highest value of the MSC is the best one [41]. Thus, the AIC and MSC for all the kinetic models of F1–F5 (EC-HPMC) were compared. The results confirmed the data fitting to the Makoid–Banakar model. F4 exhibited the least AIC (27.9183) and the highest MSC (5.3553). However, F5 also showed a high MSC value (5.2087) that was very close to F4. The least fitting to the Makoid–Banakar model was displayed by F3 (R2 = 0.9833; AIC = 42.8041; MSC = 3.7446).
As further confirmation for the selected model, the residual correlation analysis (Qo-Qc) versus time for all the models was also generated for DMH dissolution data from F1–F5 (EC-HPMC). It can be seen that the Makoid–Banakar model showed the minimum deviation from the line (Figure 6), indicating that it is the most suitable model for explaining the phenomenon of DMH dissolution from the prepared patches. This analysis was reinforced by other goodness of fit (GOF) evaluations based on another correlation analysis of Qo versus Qc in (Figure 7). Makoid–Banakar model provided the lowest deviation between Qo and Qc, and the observed dissolution data (Qo) distribution surrounded the curve of the predicted dissolution data (Qc). The results confirmed the previous findings that F4 and F5 showed the best fitting to the Makoid–Banakar model.
An extra analysis was performed for the residual correlation analysis (Qo-Qc) versus time of other formulations; F1–F5 (EC-HPMC and EC-PVP) were also obtained from the DDSolver and are shown in (Supplementary 2a,b).
DDSolver provides other criteria or analysis modes to decide the selected formula. Therefore, further analysis by generating the simulated pharmacokinetics, including area under the curve (AUC) and mean dissolution time (MDT), was performed. Referring to the MDT, a significant difference (p < 0.05) was recognized among the patches (F1–F5), and the lowest value was shown by F5, indicating its sustained release pattern. The MDT of the value was 5.271, 5.112, 4.876, 4.362, and 4.187 h for F1–F5, correspondingly. Moreover, the AUC was increased significantly (p < 0.05) in all the prepared patches for Set-1 (F1–F5) compared to the observed AUC of DMH after oral administration (218 ng·h/mL) and intravenous administration (145 ng·h/mL) from the literature [42]. The AUC of F5 was significantly (p< 0.05) higher than that of F4 and other formulae. The simulated AUC (ng·h/mL) generated by the software was equal to 269.5, 303, 333, 389, and 465 for F1, F2, F3, F4, and F5, respectively.
Eventually, based on the bioadhesion properties, the cumulative percentage of drug released (Q10), and the quantitative kinetic analysis by DDSolver, F5(EC-HPMC) was considered the most promising candidate formula. We later tested by using different types and concentrations of the penetration enhancers and proceeded on to further in vitro and in vivo evaluation.

3.5. Ex Vivo Skin Permeation Study

An ex vivo permeation study was performed by using the Copley® Franz diffusion cell to evaluate the effect of the type and concentration of three chemical penetration enhancers—namely PG, OA, and Euc—on the DMH permeation from the candidate patch F5(EC-HPMC) through the excised rat skin. The results are depicted in Table 5.
The percentage of drug that permeated through the rat’s skin from F5(EC-HPMC) was 33% w/w over the 12 h of the test. However, the percentage of drug permeated from the selected formula with the penetration enhancers significantly (p < 0.05) increased compared to the original formula. The flux enhancement was found to be in the following order: Euc oil (5% w/w) > OA (5% w/w) > OA (3% w/w) > Euc oil (3% w/w) > PG (10% w/w) > PG (5% w/w) > F5(EC-HPMC).
The drug permeation increased directly with an increase in concentration for all the used penetration chemical enhancers. However, the results were significant (p < 0.05) for the Euc oil and PG but not for the OA (p > 0.05). Eucalyptus (5% w/w) was found to be the best out of all the penetration enhancers, since it showed the highest (p < 0.05) permeability coefficient and absorption enhancement ratio compared to the formulation, as well as being better than the control (an aqueous suspension containing an equivalent amount of DMH to the formulation was used as a control). The higher enhancement capacity of Euc oil could be due to its ability to change the solvent nature of the stratum corneum and improve the drug partitioning into the skin. The main constituent of Euc is 1, 8-cineole, and a series of 17-monoterpene and terpenoids that have proven penetration enhancement effects [43].
The mechanism of drug permeation through the skin is passive diffusion-based transport. The process of percutaneous absorption is conditioned by the drug’s lipophilicity, which its partition coefficient lipid/water can express. DMH has a Log P of 3.65 [17], so it was not endowed with a lipophilic character. Therefore, a booster is needed in order to penetrate the skin.
Eucalyptus oil has been used in several previous studies as a penetration enhancer and has significantly enhanced transdermal drug absorption to the systemic circulation and deeper layers of the skin. For example, Abd, E. et al. [7] investigated the permeation of minoxidil through full-thickness excised human skin from transdermal nanoemulsion formulations containing eucalyptol and oleic acid as chemical enhancers. Their results revealed that the eucalyptol containing formulations increased minoxidil retention in the deeper skin layers more than the oleic acid formulations did.

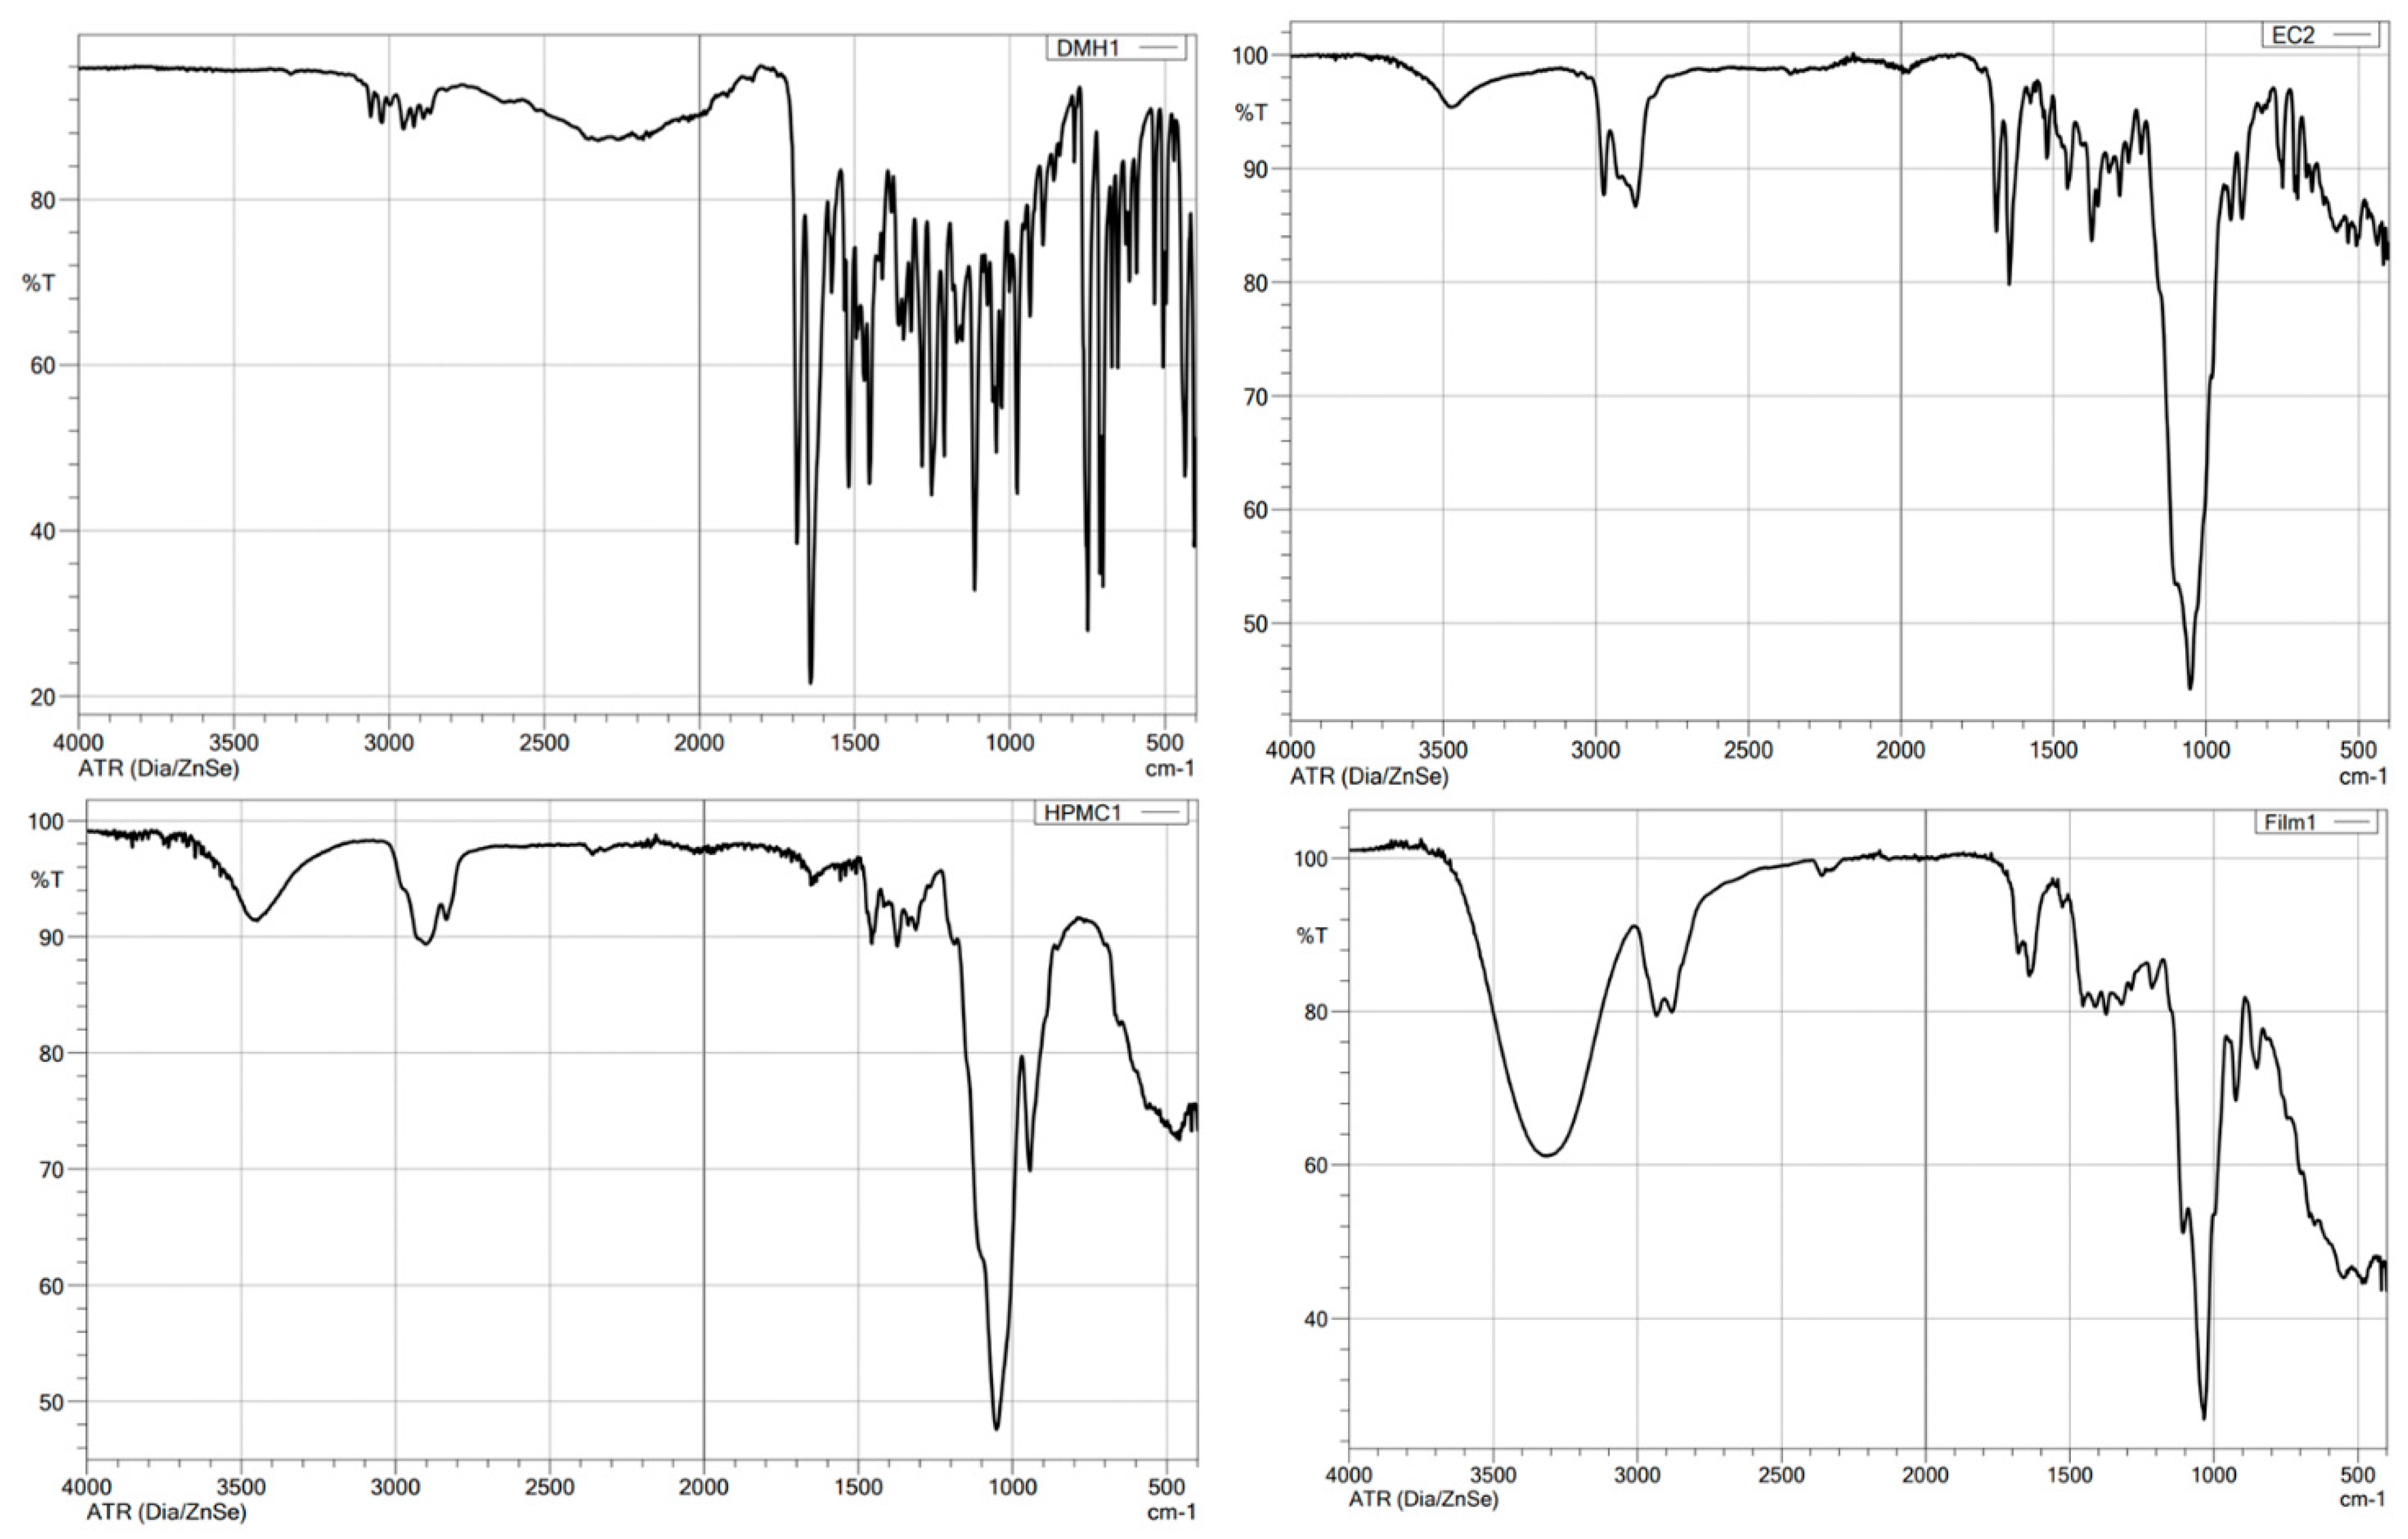
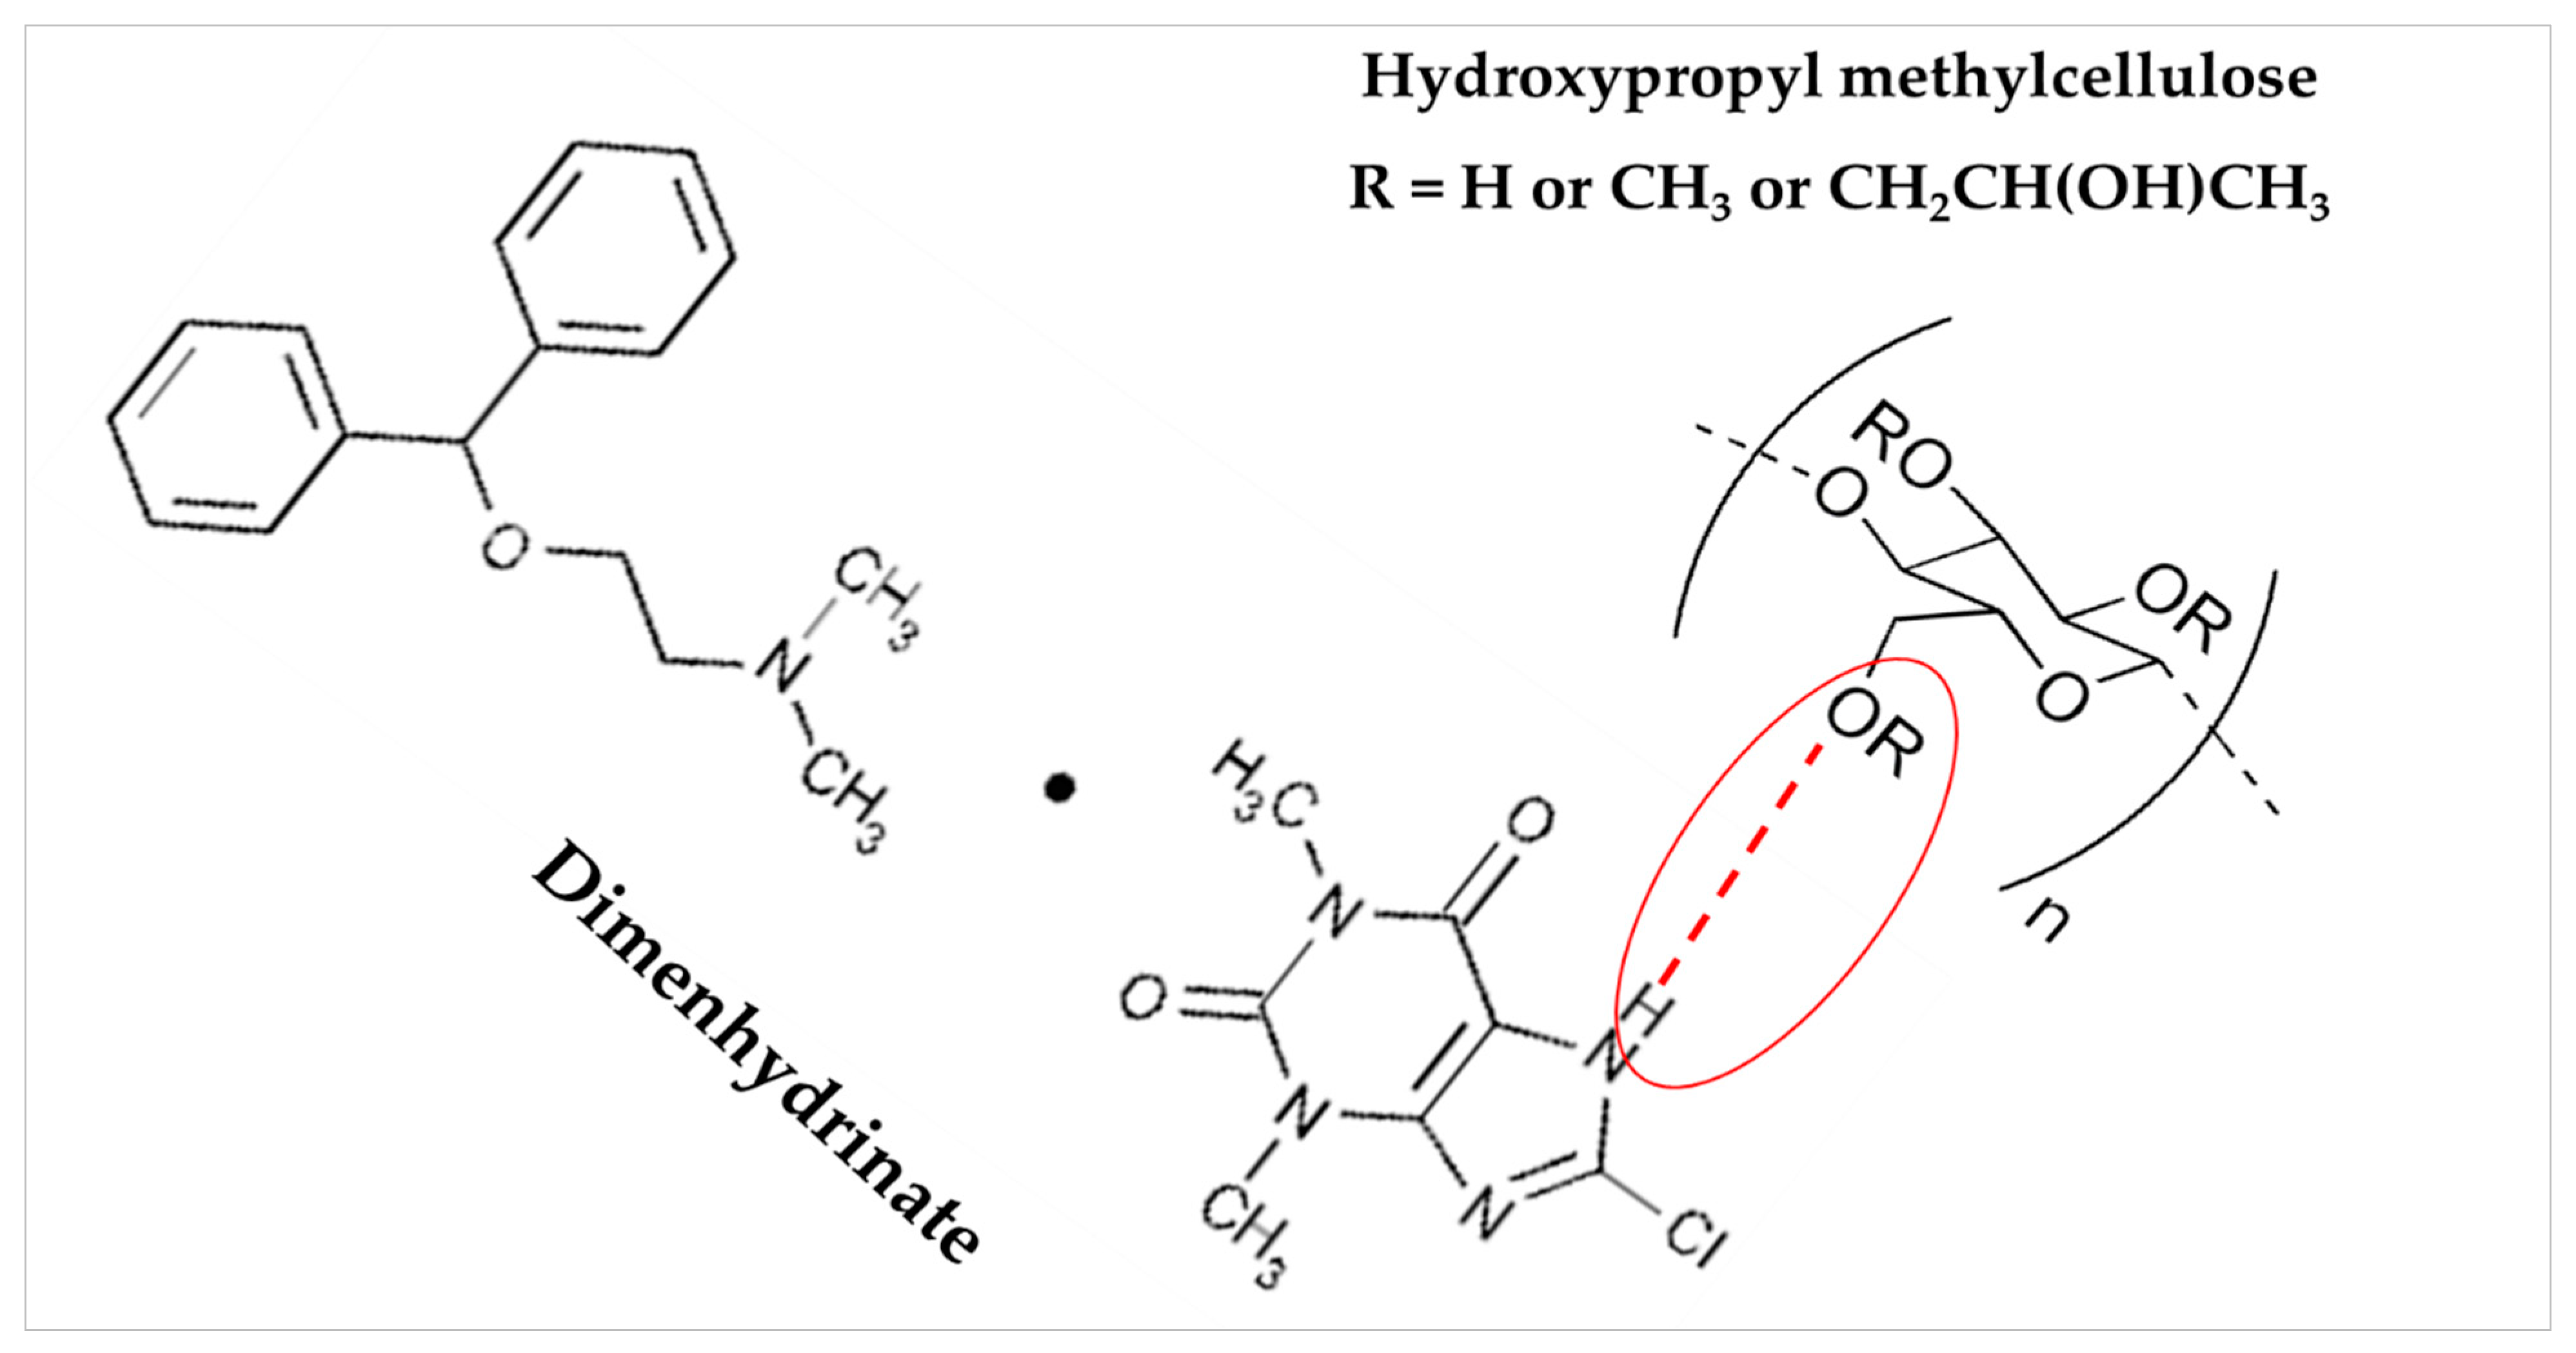
3.6. FTIR Spectroscopy Analysis

An FTIR spectroscopy analysis was conducted to investigate the drug’s compatibility with polymers and detect any possible interaction between them in the candidate patch formulation F5(EC-HPMC). The characteristic absorption peaks of the drug and the polymers (EC and HPMC K100M), along with their chemical structure, are shown in Table 6. By examining the FTIR spectrum of the F5(EC-HPMC) patch compared to the pure drug and polymers, the characteristic peaks of DMH disappeared and was superimposed upon that of the polymers (Figure 8). Additionally, a broad peak appeared at 3300 cm−1, indicating drug–polymer interaction by –H bond formation, most probably between the –OH group of the polymer (HPMC) and the amine group of the drug molecule (Figure 9). The drug–polymer interaction was essential for the controlled prolonged release pattern of DMH in the dissolution medium [44,45].

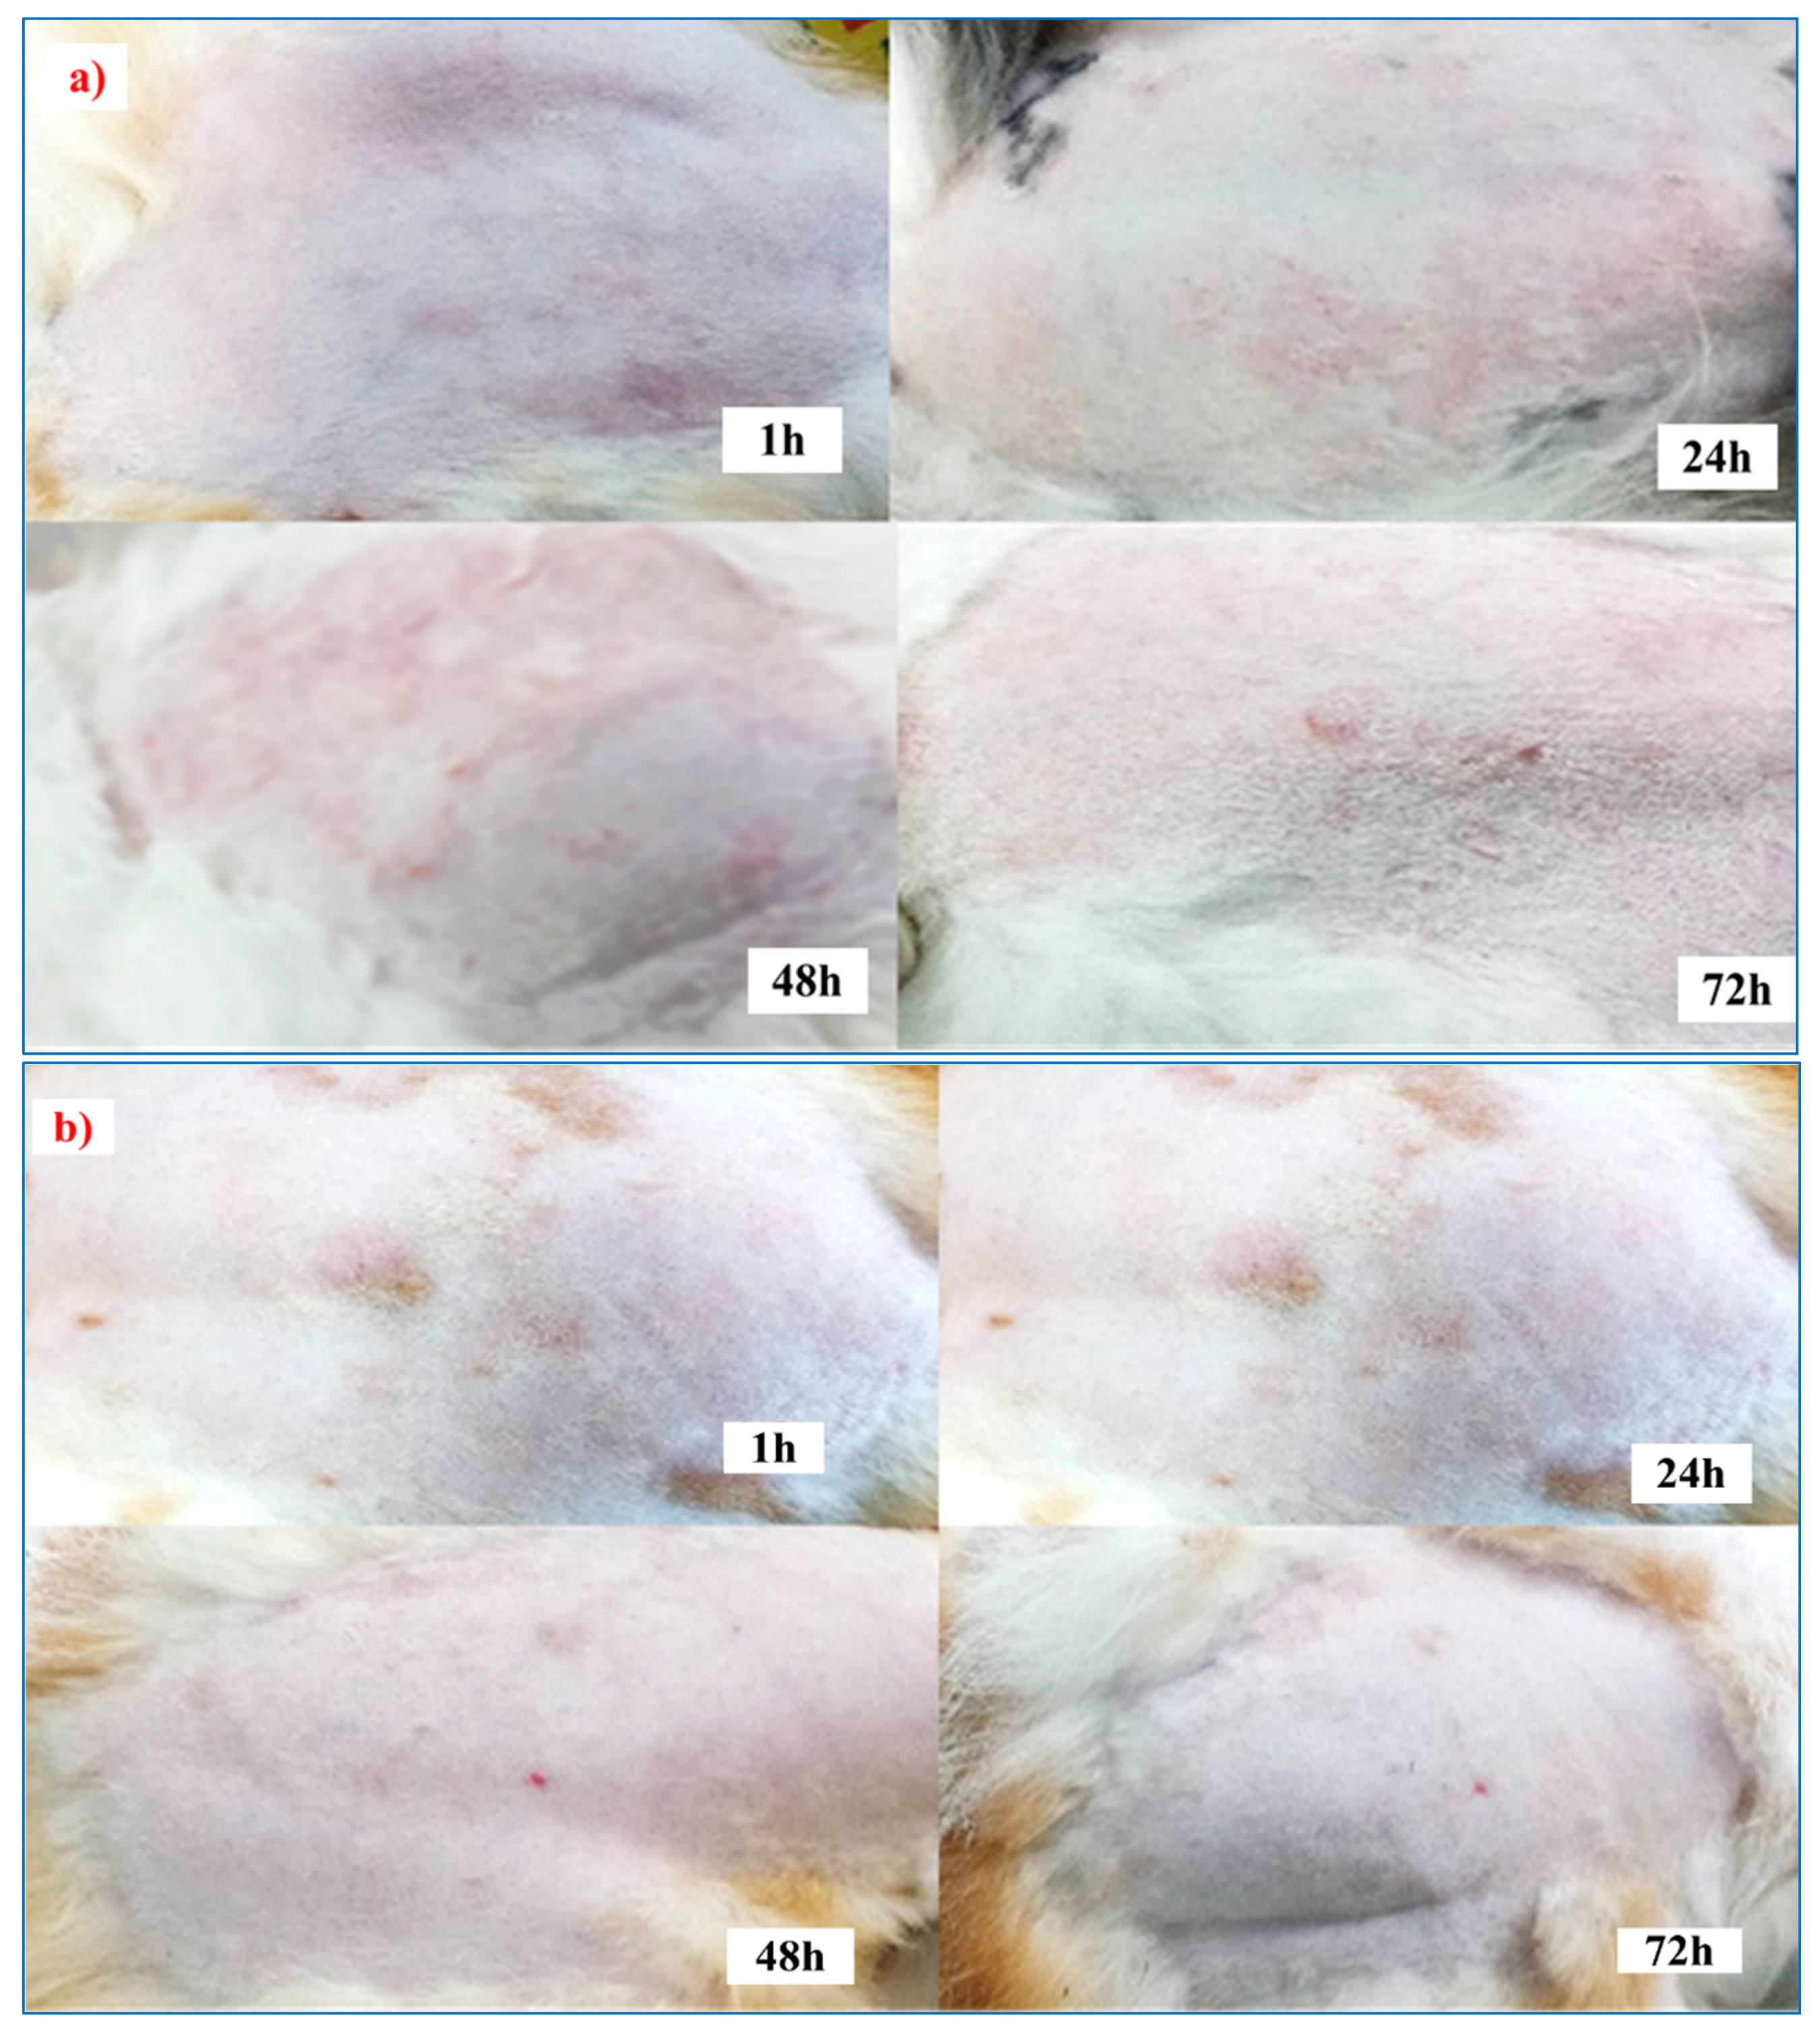
3.7. Skin-Irritation Study

The results revealed that no signs of skin irritation, such as erythema or oedema, were observed 72 h after applying the patches, the blank, and the F5 (Euc 5%) patch to the tested animals compared to the positive control (histamine aqueous solution 1 mg/mL). Therefore, according to Draize scoring, the F5 (Euc 5%) patch formulation was considered non-irritant and suitable for transdermal application. The skin-irritation scores following the transdermal patch administration are shown in Table 7. In addition, pictures of the applications of the sample (control and F5Euc 5%) on the animals’ dorsal areas at different time intervals were captured and are displayed in Figure 10a,b.

4. Conclusions

DMH is an antiemetic medication with a short elimination half-life and a low oral bioavailability due to the first-pass metabolism. Therefore, the present study aimed to demonstrate the applicability of incorporating DMH into transdermal patches, using different polymer–copolymer weight ratios. The patches were prepared by the solvent evaporation–casting technique and evaluated in vitro and in vivo. F5 (EC-HPMC) containing a (7:3 w/w) polymer:copolymer ratio was chosen as the candidate formula. F5(EC-HPMC) exhibited a homogenous texture, uniform thickness, high folding endurance, acceptable moisture content, acceptable pH surface, and prolonged adhesion time. Initially, the formula exhibited a burst in vitro drug release of DMH, which could be due to the drug’s solubilization in the hydrophilic polymer, followed by a gradual sustained-release profile of DMH in phosphate buffer at pH 7.4 during ten hours of the run. The quantitative analysis generated by the DDSolver software for the dissolution data confirmed that the Makoid–Banakar modeling was the most suitable kinetic equation for describing the phenomena of DMH release from the patch. The drug’s release mechanism was Fickian diffusion, and the simulated pharmacokinetic parameters of F5 (EC-HPMC)—AUC, MDT, and DE—were significantly (p < 0.05) greater than those of the reference product. The highest skin permeation of DMH was obtained upon incorporating Euc 5% into the patch as a chemical enhancer with a permeability coefficient of 112 ± 1.5 × 10⁻³ (cm2/h) and an enhancement ratio equal to 2.96 compared to the control. Furthermore, an in vivo irritation test was performed to ensure that F5 (EC-HPMC-Eucalyptus 5%) was not an irritant and was compatible with the skin, which would thus help to improve patient compliance.

Supplementary Materials

The following are available online at https://0-www-mdpi-com.brum.beds.ac.uk/article/10.3390/scipharm89030033/s1. Supplementary 1 (a and b): Mathematical modeling of DMH Transdermal Patches F1–F5 (EC-PVP) and F1–F5 (ES-HPMC), respectively. Supplementary 2 (a and b): Goodness of fit (GOF) evaluations based on correlation of residual versus time, indicating that the Makoid–Banakar model is the most suitable model for explaining the DMH dissolution data from EC-PVP- and ES-HPMC-containing patches, respectively.

Author Contributions

Study design, conceptualization, supervision, and review and editing, B.K.A.R.; investigation, lab work, and writing the draft manuscript, A.A.M.; data analysis and resources, Y.Y.S. All authors have read and agreed to the published version of the manuscript.

Funding

The authors would like to acknowledge Dubai Pharmacy College for Girls for the financial support for the article publication (grant number AR/PG/2016/02).

Institutional Review Board Statement

Not applicable.

Informed Consent Statement

Not applicable.

Data Availability Statement

All the data presented or analyzed during this study are included in the article.

Conflicts of Interest

The authors declare no conflict of interest.

References

  1. Marwah, H.; Garg, T.; Goyal, A.K.; Rath, G. Permeation enhancer strategies in transdermal drug delivery. Drug Deliv. 2016, 23, 564–578. [Google Scholar] [CrossRef] [PubMed]
  2. Waghule, T.; Singhvi, G.; Dubey, S.K.; Pandey, M.M.; Gupta, G.; Singh, M.; Dua, K. Microneedles: A smart approach and increasing potential for transdermal drug delivery system. Biomed. Pharmacother. 2019, 109, 1249–1258. [Google Scholar] [CrossRef] [PubMed]
  3. Wen, H.; Jung, H.; Li, X. Drug delivery approaches in addressing clinical pharmacology-related issues: Opportunities and challenges. AAPS J. 2015, 17, 1327–1340. [Google Scholar] [CrossRef]
  4. Eberhart, L.H.; Seeling, W.; Bopp, T.I.; Morin, A.M.; Georgieff, M. Dimenhydrinate for prevention of post-operative nausea and vomiting in female in-patients. Eur. J. Anaesthesiol. 1999, 16, 284–289. [Google Scholar] [CrossRef] [PubMed]
  5. Akhtar, N.; Singh, V.; Yusuf, M.; Khan, R.A. Non-invasive drug delivery technology: Development and current status of transdermal drug delivery devices, techniques and biomedical applications. Biomed. Eng. Biomed. Tech. 2020, 65, 243–272. [Google Scholar] [CrossRef] [Green Version]
  6. Singh, I.; Dastidar, D.G.; Ghosh, D.; Sengupta, A.; Ajala, T.O.; Odeku, O.A.; Singh, B.P.; Sharma, M. Bioadhesive films as drug delivery systems. Drug Deliv. Lett. 2021, 11, 2–15. [Google Scholar] [CrossRef]
  7. Abd, E.; Benson, H.A.E.; Roberts, M.S.; Grice, J.E. Minoxidil skin delivery from nanoemulsion formulations containing eucalyptol or oleic acid: Enhanced diffusivity and follicular targeting. Pharmaceutics 2018, 10, 19. [Google Scholar] [CrossRef] [Green Version]
  8. Wiedersberg, S.; Guy, R.H. Transdermal drug delivery: 30+ years of war and still fighting! J. Control. Release 2014, 190, 150–156. [Google Scholar] [CrossRef] [PubMed] [Green Version]
  9. Zsikó, S.; Csányi, E.; Kovács, A.; Budai-Szűcs, M.; Gácsi, A.; Berkó, S. Methods to evaluate skin penetration in vitro. Sci. Pharm. 2019, 87, 19. [Google Scholar] [CrossRef] [Green Version]
  10. Naz, Z.; Ahmad, F.J. Curcumin-loaded colloidal carrier system: Formulation optimization, mechanistic insight, ex vivo and in vivo evaluation. Int. J. Nanomed. 2015, 10, 4293. [Google Scholar] [CrossRef] [Green Version]
  11. Yu, Y.Q.; Yang, X.; Wu, X.F.; Fan, Y.B. Enhancing permeation of drug molecules across the skin via delivery in nanocarriers: Novel strategies for effective transdermal applications. Front. Bioeng. Biotechnol. 2021, 9, 646554. [Google Scholar] [CrossRef]
  12. Opatha, S.A.T.; Titapiwatanakun, V.; Chutoprapat, R. Transfersomes: A promising nanoencapsulation technique for transdermal drug delivery. Pharmaceutics 2020, 12, 855. [Google Scholar] [CrossRef]
  13. Shaker, D.S.; Ishak, R.A.H.; Ghoneim, A.; Elhuoni, M.A. Nanoemulsion: A review on mechanisms for the transdermal delivery of hydrophobic and hydrophilic drugs. Sci. Pharm. 2019, 87, 17. [Google Scholar] [CrossRef] [Green Version]
  14. Sae Yoon, A.; Sakdiset, P. Development of microemulsions containing Glochidion wallichianum leaf extract and potential for transdermal and topical skin delivery of gallic acid. Sci. Pharm. 2020, 88, 53. [Google Scholar] [CrossRef]
  15. Jahan, N.; Archie, S.R.; Shoyaib, A.A.; Kabir, N.; Cheung, K. Recent approaches for solid dose vaccine delivery. Sci. Pharm. 2019, 87, 27. [Google Scholar] [CrossRef] [Green Version]
  16. Dimenhydrinate, Drugs.Com. Available online: https://www.drugs.com/mtm/dimenhydrinate.html (accessed on 25 June 2021).
  17. Dimenhydrinate, DrugBank Online. Available online: https://go.drugbank.com/drugs/DB00985 (accessed on 25 June 2021).
  18. Akram, M.R.; Ahmad, M.; Abrar, A.; Sarfraz, R.M.; Mahmood, A. Formulation design and development of matrix diffusion controlled transdermal drug delivery of glimepiride. Drug Des. Dev. Ther. 2018, 12, 349–364. [Google Scholar] [CrossRef] [Green Version]
  19. Al Hanbali, O.A.; Khan, H.M.S.; Sarfraz, M.; Arafat, M.; Ijaz, S.; Hameed, A. Transdermal patches: Design and current approaches to painless drug delivery. Acta Pharm. 2019, 69, 197–215. [Google Scholar] [CrossRef] [PubMed] [Green Version]
  20. Telange, D.R.; Nirgulkar, S.B.; Umekar, M.J.; Patil, A.T.; Pethe, A.M.; Bali, N.R. Enhanced transdermal permeation and anti-inflammatory potential of phospholipids complex-loaded matrix film of umbelliferone: Formulation development, physico-chemical and functional characterization. Eur. J. Pharm. Sci. 2019, 131, 23–38. [Google Scholar] [CrossRef]
  21. Zhang, Y.; Huo, M.; Zhou, J.; Zou, A.; Li, W.; Yao, C.; Xie, S. DDSolver: An add-in program for modeling and comparison of drug dissolution profiles. AAPS J. 2010, 12, 263–271. [Google Scholar] [CrossRef] [PubMed] [Green Version]
  22. Saoji, S.D.; Atram, S.C.; Dhore, P.W.; Deole, P.S.; Raut, N.A.; Dave, V.S. Influence of the component excipients on the quality and functionality of a transdermal film formulation. AAPS Pharm. Sci. Tech. 2015, 16, 1344–1356. [Google Scholar] [CrossRef] [Green Version]
  23. Organisation for Economic Cooperation and Development. Guidance document on integrated approaches to testing and assessment for skin irritation/corrosion. In OECD Series on Testing and Assessment. No. 203; Environment, Health and Safety Publications: Paris, France, 2014. [Google Scholar]
  24. Almazan, E.A.; Castañeda, P.S.; Torres, R.D.; Escobar-Chavez, J.J. Design and evaluation of losartan transdermal patch by using solid microneedles as a physical permeation enhancer. Iran. J. Pharm. Res. 2020, 19, 138–152. [Google Scholar] [CrossRef]
  25. Namjoshi, S.; Dabbaghi, M.; Roberts, M.S.; Grice, J.E.; Mohammed, Y. Quality by design: Development of the quality target product profile (QTPP) for semisolid topical products. Pharmaceutics 2020, 12, 287. [Google Scholar] [CrossRef] [Green Version]
  26. Cherukuri, S.; Batchu, U.R.; Mandava, K.; Cherukuri, V.; Ganapuram, K.R. Formulation and evaluation of transdermal drug delivery of topiramate. Int. J. Pharm. Investig. 2017, 7, 10–17. [Google Scholar] [CrossRef] [Green Version]
  27. Ali, S.M.; Yosipovitch, G. Skin pH: From basic science to basic skin care. Acta Derm. Venereol. 2013, 93, 261–267. [Google Scholar] [CrossRef] [PubMed] [Green Version]
  28. Prajapati, S.T.; Patel, C.G.; Patel, C.N. Formulation and Evaluation of Transdermal Patch of Repaglinide. ISRN Pharm. 2011, 2011, 651909. [Google Scholar] [CrossRef] [PubMed] [Green Version]
  29. Oshiro Junior, J.A.; Carvalho, F.C.; Soares, C.P.; Chorilli, M.; Chiavacci, L.A. Development of cutaneous bioadhesive ureasil-polyether hybrid films. Int. J. Polym. Sci. 2015, 2015, 1–7. [Google Scholar] [CrossRef] [Green Version]
  30. Cho, C.W.; Kim, D.B.; Shin, S.C. Development of bioadhesive transdermal bupivacaine gels for enhanced local anaesthetic action. Iran. J. Pharm. Res. 2012, 11, 423–431. [Google Scholar] [PubMed]
  31. Oh, C.M.; Heng, P.W.; Chan, L.W. Influence of hydroxypropyl methylcellulose on metronidazole crystallinity in spray-congealed polyethylene glycol microparticles and its impact with various additives on metronidazole release. AAPS Pharm. Sci. Tech. 2015, 16, 1357–1367. [Google Scholar] [CrossRef] [PubMed] [Green Version]
  32. Mohd, F.; Bontha, L.S.; Bontha, V.K.; Vemula, S.K. Formulation and evaluation of transdermal films of ondansetron hydrochloride. MOJ Bioequiv. Bioavailab. 2017, 3, 86–92. [Google Scholar] [CrossRef] [Green Version]
  33. Papadimitriou, S.; Bikiaris, D. Dissolution rate enhancement of the poorly water-soluble drug tibolone using PVP, SiO2, and their nanocomposites as appropriate drug carriers. Drug Dev. Ind. Pharm. 2009, 35, 1128–1138. [Google Scholar] [CrossRef]
  34. Abdul Rasool, B.K.; Khalifa, A.; Abu-Gharbieh, E.; Khan, R. Employment of alginate floating in situ gel for controlled delivery of celecoxib: Solubilization and formulation studies. BioMed Res. Int. 2020, 2020, 1879125. [Google Scholar] [CrossRef]
  35. Gambhire, M.N.; Ambade, K.W.; Kurmi, S.D.; Kadam, V.J.; Jadhav, K.R. Development and in vitro evaluation of an oral floating matrix tablet formulation of diltiazem hydrochloride. AAPS Pharm. Sci. Tech. 2007, 8, E166–E174. [Google Scholar] [CrossRef] [PubMed]
  36. Papadopoulou, V.; Kosmidis, K.; Vlachou, M.; Macheras, P. On the use of the weibull function for the discernment of drug release mechanisms. Int. J. Pharm. 2006, 309, 44–50. [Google Scholar] [CrossRef]
  37. Costa, P.; Sousa Lobo, J.M. Modeling and comparison of dissolution profiles. Eur. J. Pharm. Sci. 2001, 13, 123–133. [Google Scholar] [CrossRef]
  38. Kosmidis, K.; Argyrakis, P.; Macheras, P. Fractal kinetics in drug release from finite fractal matrices. J. Chem. Phys. 2003, 119, 6373–6377. [Google Scholar] [CrossRef] [Green Version]
  39. Simancas-Herbad, R.; Fernández-Carballido, A.; Aparicio-Blanco, J.; Slowing, K.; Rubio-Retama, J.; López-Cabarcos, E.; Torres-Suárez, A.I. Controlled release of highly hydrophilic drugs from novel poly(magnesium acrylate) matrix tablets. Pharmaceutics 2020, 12, 174. [Google Scholar] [CrossRef] [Green Version]
  40. Tewari, D.; Zong, Y.; Harcum, W.W.; Hood, C.; Dürig, T. Impact of Molecular Weight and Molecular Weight Distribution of Hypromellose in Reducing Drug Release Variability from Erosion Dependent Matrix Systems. 2012. Available online: https://www.ashland.com/file_source/Ashland/links/PTR-082-CR_Benecel_HPMC-Impact_of_MW_and_MW_Distribution_of_HPMC_Custom_Grades-K250,K750,K1500.pdf (accessed on 27 May 2021).
  41. Siswanto, A.; Fudholi, A.; Nugroho, A.K.; Martono, S. In vitro release modeling of aspirin floating tablets using DDsolver. Indones. J. Pharm. 2015, 26, 94. [Google Scholar] [CrossRef]
  42. Blyden, G.T.; Greenblatt, D.J.; Scavone, J.M.; Shader, R.I. Pharmacokinetics of diphenhydramine and a demethylated metabolite following intravenous and oral administration. J. Clin. Pharmacol. 1986, 26, 529–533. [Google Scholar] [CrossRef] [PubMed]
  43. Williams, A.C.; Barry, B.W. Penetration enhancers. Adv. Drug Deliv. Rev. 2004, 56, 603–618. [Google Scholar] [CrossRef]
  44. Sarode, A.L.; Sandhu, H.; Shah, N.; Malick, W.; Zia, H. Hot melt extrusion (HME) for amorphous solid dispersions: Predictive tools for processing and impact of drug-polymer interactions on supersaturation. Eur. J. Pharm. Sci. 2013, 48, 371–384. [Google Scholar] [CrossRef]
  45. Zhang, J.; Yang, W.; Vo, A.Q.; Feng, X.; Ye, X.; Kim, D.W.; Repka, M.A. Hydroxypropyl methylcellulose-based controlled release dosage by melt extrusion and 3D printing: Structure and drug release correlation. Carbohydr. Polym. 2017, 177, 49–57. [Google Scholar] [CrossRef] [PubMed]
Figure 1. A schematic diagram displays the preparation steps of the DMH transdermal patches.
Scipharm 89 00033 g001
Figure 2. A schematic diagram explains the evaluation test used to assess the patches’ adhesive properties.
Scipharm 89 00033 g002
Figure 3. The visual appearance of the DMH transdermal patch, F5 (EC-HPMC).
Scipharm 89 00033 g003
Figure 4. A Scatter chart correlates the effect of moisture content on the transdermal patches’ bioadhesive properties. Results are given as means with percentage error bars (n = 3).
Scipharm 89 00033 g004
Figure 5. The cumulative amount of DMH released from the transdermal patches against time: (a) F1–F5 (EC-HPMC), (b) F1–F5 (EC-PVP), and (c) F1–F5 (ES100-HPMC). Results are given as means ± SDs (n = 3).
Scipharm 89 00033 g005
Figure 6. The goodness of fit (GOF) evaluations based on the correlation of residual versus time, indicating that the Makoid–Banakar model is the most suitable to explain the DMH dissolution data from EC-HPMC-containing patches.
Scipharm 89 00033 g006
Figure 7. The correlation of the amount of DMH released (Qo) versus the amount of DMH predicted to be released (Qc) by the Makoid–Banakar model for the transdermal patches in Set-1 (F1–F5).
Scipharm 89 00033 g007
Figure 8. FTIR spectra of DMH, EC, HPMC K100M, and F5 (EC–HPMC) transdermal patches.
Scipharm 89 00033 g008
Figure 9. The proposed interaction chemistry between dimenhydrinate and patch composite HPMC polymer.
Scipharm 89 00033 g009
Figure 10. Draize skin-irritation studies carried out after the application of (a) a control sample (histamine injection) and (b) (F5Euc 5% w/w) a patch.
Scipharm 89 00033 g010
Table 1. Composition of DMH transdermal patch formulations.
Formula CodePolymers (mg)Copolymers (mg)Polymer: Copolymer
w/w Ratio
ECES100PVPHPMC K100
F0 (EC)100 01:0
F1(EC-HPMC)70 307:3
F2(EC-HPMC)60 403:2
F3(EC-HPMC)50 501:1
F4(EC-HPMC)40 602:3
F5(EC-HPMC)30 703:7
F1(EC-PVP)70 30 7:3
F2(EC-PVP)60 40 3:2
F3(EC-PVP)50 50 1:1
F4(EC-PVP)40 60 2:3
F5(EC-PVP)30 70 3:7
F0 (ES) 100 01:0
F1(ES-HPMC) 70 307:3
F2(ES-HPMC) 60 403:2
F3(ES-HPMC) 50 501:1
F4(ES-HPMC) 40 602:3
F5(ES-HPMC) 30 703:7
F1(ES-PVP) 7030 7:3
F2(ES-PVP) 6040 3:2
F3(ES-PVP) 5050 1:1
F4(ES-PVP) 4060 2:3
F5(ES-PVP) 3070 3:7
Each batch contains 25 mg of DMH in a 2 cm2 area. Plasticizer: glycerol 15% w/w; solvent: methanol.
Table 2. Composition of the transdermal patch F5(EC-HPMC) with chemical penetration enhancers.
Formula CodePenetration Enhancers (% w/w)
OAPGEuc
F5(OA-3)3
F5(OA-5)5
F5(PG-5) 5
F5(PG-10) 10
F5(Euc-3) 3
F5(Euc-5) 5
Table 3. Characteristics of the DMH transdermal patch formulations.
Formulas
Codes
Thickness
(µm)
Folding EnduranceSurface pHDrug Content
% (SD)
Moisture Content
(%)
Adhesion Time
(s)
F0 (EC)0.09 ± 0.0157.31 ± 0.0596 (2.08)7.7 ± 2.55.7 ± 1.5
F1 (EC-HPMC)0.10 ± 0.00126.75 ± 0.0596 (2.08)10.0 ± 1.021.3 ± 0.5
F2 (EC-HPMC)0.13 ± 0.01306.35 ± 0.0597 (1.53)11.3 ± 1.529.3 ± 0.6
F3 (EC-HPMC)0.11 ± 0.01416.12 ± 0.2198 (1.73)13.7 ± 1.534.0 ± 1.0
F4 (EC-HPMC)0.13 ± 0.01646.19 ± 0.0399 (2.08)17.7 ± 1.541.0 ± 1.0
F5 (EC-HPMC)0.11 ± 0.01>100 *6.71 ± 0.2598 (1.01)22.0 ± 1.048.7 ± 1.5 *
F1 (EC-PVP)0.12 ± 0.01106.71 ± 0.0695 (1.02)21.7 ± 1.514.3 ± 2.1
F2 (EC-PVP)0.11 ± 0.01426.77 ± 0.0796 (0.58)24.3 ± 1.519.7 ± 1.5
F3 (EC-PVP)0.08 ± 0.01476.55 ± 0.0697 (0.58)26.7 ± 1.524.0 ± 1.0
F4 (EC-PVP)0.09 ± 0.01896.39 ± 0.0398 (1.01)26.9 ± 0.431.0 ± 1.0
F5 (EC-PVP)0.09 ± 0.01>100 *6.59 ± 0.0595 (1.03)28.5 ± 0.62 *35.7 ± 2.1
F0 (ES)0.07 ± 0.0136.70 ± 0.0295 (1.04)7.0 ± 1.016.0 ± 1.0
F1 (ES-HPMC)0.09 ± 0.01106.70 ± 0.1099 (2.08)15.0 ± 1.815.0 ± 1.0
F2 (ES-HPMC)0.11 ± 0.01116.39 ± 0.0398 (1.73)16.3 ± 0.624.0 ± 1.0
F3 (ES-HPMC)0.09 ± 0.01236.32 ± 0.0297 (1.53)21.3 ± 1.530.7 ± 1.5
F4 (ES-HPMC)0.11 ± 0.00386.39 ± 0.0595 (2.31)21.0 ± 1.738.3 ± 2.5
F5 (ES-HPMC)0.09 ± 0.01506.21 ± 0.0196 (2.08)22.0 ± 1.042.0 ± 1.0
Results are given as a mean ± SD. * Significant results (p < 0.05) compared to other formulas.
Table 4. Mathematical modeling for DMH transdermal patches F1–F5 (EC-HPMC).
ModelingCorresponding EquationFormulaeParametersR2 AdjustedAICMSC
Zero-Orderf = k0 t
f = amount of the drug release
k0 = reaction rate coefficient
t = time
F1k0 = 5.2980.945249.97292.7036
F2k0 = 5.9390.953650.43202.8712
F3k0 = 6.4820.956051.01262.9237
F4k0 = 7.4350.948253.86072.7611
F5k0 = 8.8130.918061.23362.3015
First-Orderf = 100 [1 − e −k1t]
f = amount of the drug release
k1 = rate constant
t = time
F1k1 = 0.0660.911854.73262.2277
F2k1 = 0.0770.919755.92752.3217
F3k1 = 0.0870.930555.58872.4661
F4k1 = 0.1070.979244.73243.6739
F5k1 = 0.1400.980846.72113.7527
Higuchif = kH t0.5
f = amount of the drug release
kH = dissolution constant
t = time
F1kH = 13.2820.792663.27961.3730
F2kH = 14.9080.808364.62561.4519
F3kH = 16.3380.835464.20981.6040
F4kH = 18.9660.922257.93722.3535
F5kH = 22.6040.945557.15952.7089
Hixson–CrowellWo1/3 − Wt1/3 = KHC t
Wo= amount of drug remaining at time 0
Wt = remaining amount of drug in the dosage form
KHC = Hixson–Crowell constant
F1kHC = 0.0210.924553.17312.3836
F2kHC = 0.0240.933554.03602.5108
F3kHC = 0.0260.943253.56112.6689
F4kHC = 0.0320.979844.44663.7025
F5kHC = 0.0400.979147.55703.6691
Korsmeyer–Peppasf = kKP tn
kKP = constant depicting the experimental parameters based on geometry and dosage forms
f = amount of the drug release
n = release exponent
F1KKP = 5.154
n = 1.014
0.938451.95842.5051
F2KKP = 6.143
n = 0.983
0.948052.40532.6739
F3KKP = 7.673
n = 0.914
0.954652.14782.8102
F4KKP = 12.040
n = 0.752
0.992335.67814.5794
F5KKP = 15.887
n = 0.697
0.995333.56595.0682
HopfenbergMt/M∞ = 1 − [1 − (ko t)/(C0 a0)]n
Mt = the amount of drug dissolved in time t
M∞ = the amount of drug dissolved in time ∞
Ko = erosion rate constant
F1KHB = 0.072
n = 0.641
0.946650.53062.6479
F2kHB = 0.071
n = 0.771
0.951151.79202.7352
F3kHB = 0.064
n = 1.017
0.950553.01022.7240
F4kHB = 0.020
n = 5.046
0.978046.11063.5361
F5kHB = 0.017
n = 8.061
0.979248.34113.5907
Baker–LonsdalekBL t = 3/2 [1 − (1 − f/100)2/3)] − f/100
kBL = release constant
t = time
f = amount of the drug release
F1kBL = 0.0030.761064.69711.2312
F2kBL = 0.0040.772066.35831.2786
F3kBL = 0.0050.795466.38471.3865
F4kBL = 0.0080.879862.28321.9189
F5kBL = 0.0110.895363.67872.0570
Makoid–Banakarf = kMB tn e(−ct)
f = amount of the drug release
kMB = dissolution constant
t = time
n and c = empirical parameters
F1kMB = 8.569
n = 0.174
k = −0.151
0.991932.36334.4646
F2kMB = 9.471
n = 0.263
k = −0.130
0.986239.76413.9380
F3kMB = 10.800
n = 0.320
k = −0.109
0.983342.80413.7446
F4kMB = 13.200
n = 0.560
k = −0.038
0.996727.91835.3553
F5kMB = 16.533
n = 0.604
k = −0.019
0.996132.16165.2087
R2, correlation coefficient; k, rate constant; AIC, Akaike Information Criterion; and MSC, Model Selection Criterion.
Table 5. Flux, permeability coefficient, and enhancement ratio of DMH patches with different enhancers of permeation through rat skin.
Patch CodeSteady-State Flux Jss
(μg·cm−2·h−1)
Permeability Coefficient × 10−3
(cm2/h)
Enhancement Ratio (ER)
F5EC-HPMC–oleic acid 3%136 ± 1.668 ± 1.11.81
F5EC-HPMC–oleic acid 5%130 ± 1.265 ± 0.91.73
F5EC-HPMC–PG 5%81 ± 3.841 ± 2.41.08
F5EC-HPMC–PG10%97 ± 3.549 ± 3.11.29
F5EC-HPMC–Euc3%112 ± 1.956 ± 2.71.49
F5EC-HPMC–Euc5%* 222 ± 2.7* 112 ± 1.5* 2.96
F5EC-HPMC024 ± 2.755 ± 2.40.32
Control75 ± 1.438 ± 1.3.....
Results are given as means ± SDs (n = 3); * significant (p < 0.05) increase in drug’s skin permeation compared to the control and other formulae.
Table 6. The characteristic FTIR absorption peaks and chemical structures of DMH, EC, and HPMC K100M.
CompoundChemical Functional
Group
Peak Frequency
(cm−1)
Chemical Structure
DMHCH stretch
-N (CH3)2
C=O stretching
Aromatic rings skeletal vibrations
3035
2400–2700
1650–1675
1592, 1407
Scipharm 89 00033 i001
Ethylcellulose–C–O–C– stretching
C–H stretching
C–H bending
1052
2850, 2950
1375
Scipharm 89 00033 i002
HPMC K100MC–H stretching
O–H stretching
C–O stretching
C–O–C
2900
2898
1373
1053
Scipharm 89 00033 i003
Table 7. Skin-irritation Draize scoring following transdermal patch administration.
AnimalsThe Score Obtained at Various Periods
1 h24 h48 h72 h
EOEOEOEO
Control¾2/04/32/34/33/20/22/0
F5 (EC-HPMC)0/00/00/00/00/00/00/00/0
F5 (Euc 5%)
Treated-1
0/00/00/00/00/00/00/00/0
F5 (Euc 5%)
Treated-2
0/00/01/00/00/00/00/00/0
E, Erythema; O, Oedema; F5(EC-HPMC) without penetration enhancer.
Publisher’s Note: MDPI stays neutral with regard to jurisdictional claims in published maps and institutional affiliations.

