1. Introduction
Monoclonal antibodies (mAbs) are Y-shaped proteins produced by a single clone of B cells and have a specific binding affinity to a unique target epitope [
1]. The success of mAbs originates from their therapeutic efficiency and target specificity in a wide range of diseases, including cancer, asthma, infectious diseases, central nervous system disorders, and cardiovascular diseases [
2]. mAbs are leading the pharmaceutical industry with an expected market value of USD 200 billion by 2025 [
3,
4].
The therapeutic efficacy of an mAb is affected by the process in which they are exposed to different stress conditions, including light, freeze-thaw, increased or decreased temperature, pH, and ionic strength. These stress factors may lead to a minor change in the protein structure and cause instabilities by affecting the quality, efficacy, and safety of the mAb [
3,
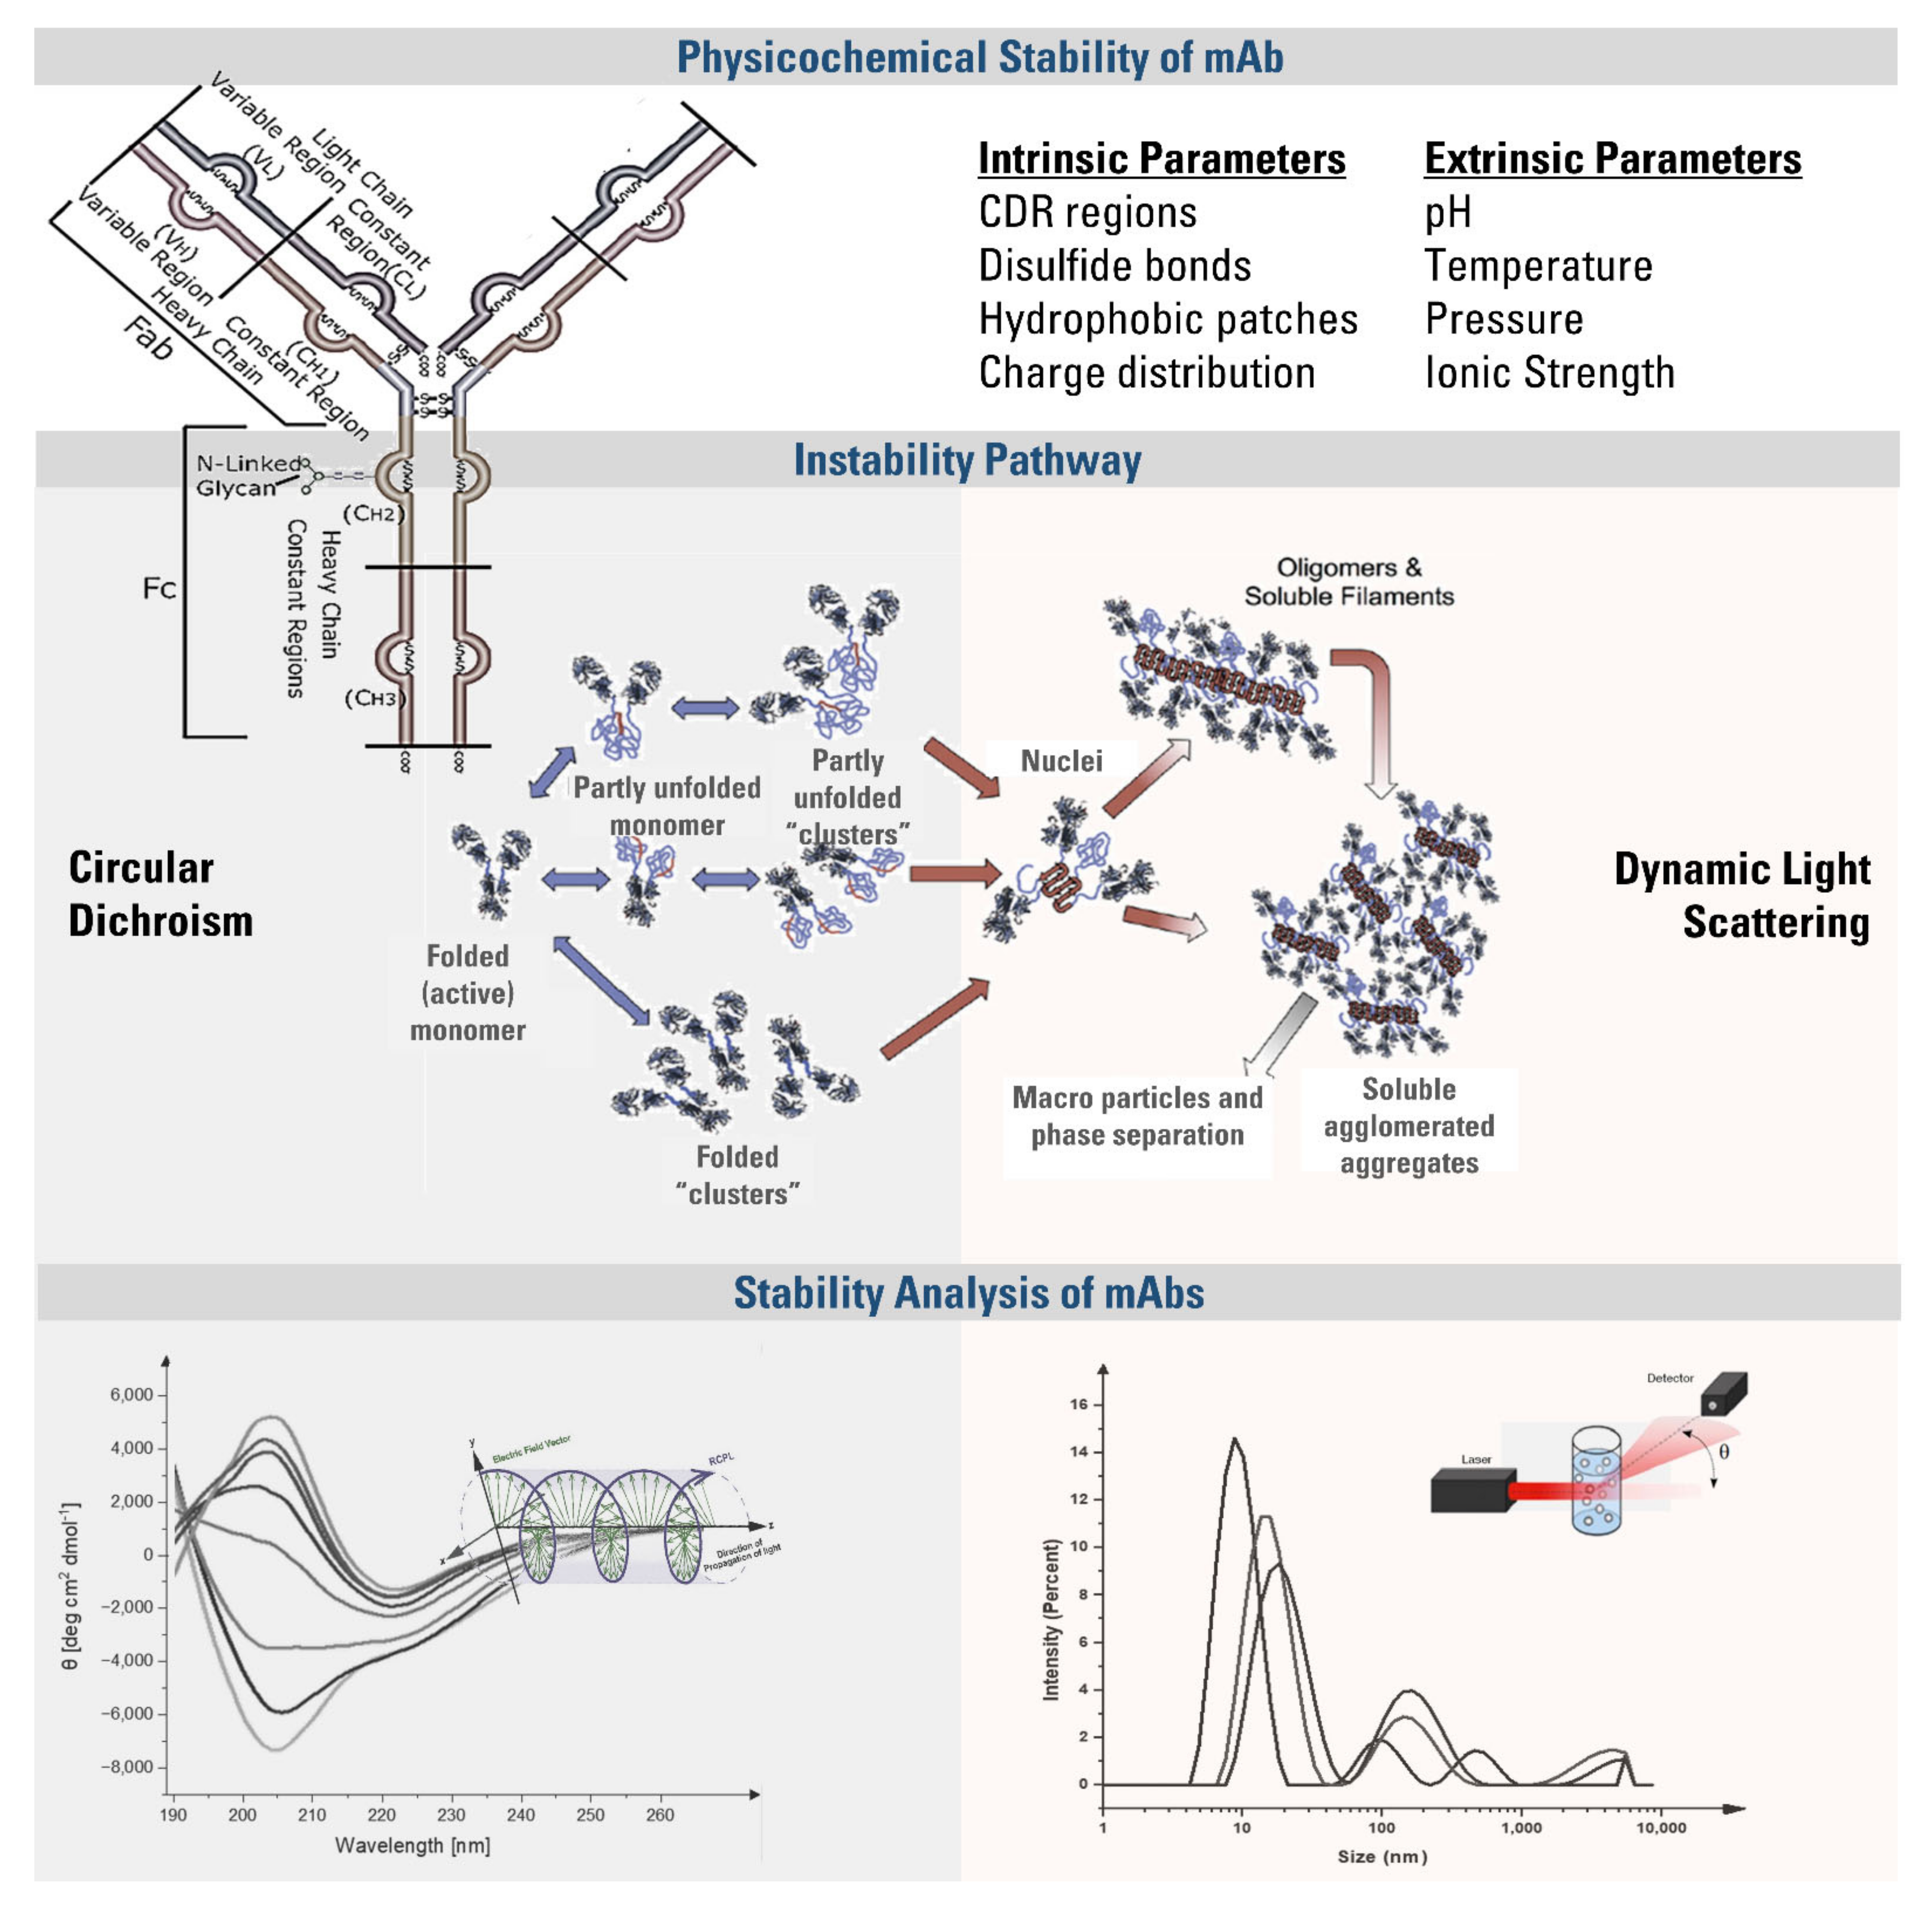
5]. The stability of an mAb is governed by (a) the disulfide bonds between two arms, (b) non-covalent interactions between CH
2 and CH
3 domains, (c) protein-protein interactions, and (d) the interactions between glycans attached to the CH
2 domain of each heavy chain (
Scheme 1). The instabilities are classified into two groups: chemical instabilities, which are disruptions of covalent structure, and physical instabilities, which can be colloidal or conformational. Physical instabilities might result from changes in environmental conditions or intrinsic properties and cause structural unfolding [
3,
6]. Implementing robust and accurate analytical tools for assessing colloidal and conformational stability is crucial to avoid unwanted immunogenic effects, decreased efficacy, and reduced production yield.
The secondary structure is defined by the spatial arrangement of the atoms of amino acid residues found in the polypeptide backbone. Regular secondary structures such as α-helix and β-sheet occur when the angle between the polypeptide backbones remains stable throughout a segment [
7]. The secondary structure of an mAb is disrupted when the hydrophobic regions and aggregation-prone residues (APRs) are exposed to solvent. As represented in
Scheme 1, this reduces the solubility and makes the molecules available for strong inter-protein contacts, leading to the formation of reversibly folded oligomers, clusters, or irreversible aggregates [
3]. As a result of aggregate formation, Fab regions may lose antigen-binding activity, resulting in immunogenic reactions that reduce the efficacy by neutralizing the mAb, and hypersensitivity due to the cross-reactions with an endogenous counterpart.
Since the overall stability of mAbs depends on many factors, it requires implementing complementary techniques for an in-depth analysis, including DLS, SLS, SDS-PAGE, SEC-HPLC, NTA, FIM, and turbidity measurements [
3]. Among them, spectroscopic methods are frequently preferred due to availability in many labs, simplicity, and less labor and time requirement. However, they only give an insight into the overall high-order structure and molecular interactions. The minor structural changes either affecting the efficacy or stability can be overwhelmed by the tool’s noise level and inadequate sensitivity. Therefore, high-order structural and colloidal analysis of mAbs under different stress factors can exaggerate the overwhelmed signal and better reveal the stability and structure. Even though understanding the link between stress factors with degradation and aggregation points could help minimize conformational and colloidal instabilities [
8], change in the activity of an mAb might be observed much earlier under different environmental conditions. Therefore, indirect assessment of mAb stability stands as a challenge in terms of its activity.
CD spectroscopy can be used to analyze proteins’ secondary and tertiary structures and monitor conformational changes caused by temperature, mutations, heat, or binding interactions [
9]. Although CD spectroscopy has some intrinsic limitations in determining the structure of mixed and most β-proteins [
10], it is reported that BeStSel software provides improved data about protein structure by using CD measurements [
11,
12,
13]. Therefore, BeStSel software was used in this study to improve data reliability.
This study aimed to provide an in-depth analysis of mAb stability by complementarily using CD and DLS methods under various conditions via an accessible robust experimental setup to investigate aggregation kinetics of trastuzumab as a function of solvent conditions and temperature. Temperature-ramped CD measurements were conducted on trastuzumab to observe its secondary structure disruption and thermal stability, which is the propensity of an mAb to unfold or aggregate with temperature changes. It is reflected by the melting temperature ™ at which half of the mAb is unfolded [
9]. Besides estimating thermal stability by determining T
m, temperature-ramped CD measurement also simultaneously gives structural insight, which is not possible with DSC. The aggregation onset temperatures of trastuzumab were also assessed with temperature-ramped DLS measurements at different pH values. Accordingly, more insights into the aggregation mechanisms, instability pathways, and structural changes than the sole spectral measurements were revealed.
2. Materials and Methods
2.1. Reagents and Solutions
Trastuzumab (Roche, Basel, Switzerland) was obtained from a local pharmacy. A vial contains a 150 mg molecule as the therapeutic reagent, and it was dissolved in 7.2 mL of pure water to obtain end-solution for injection. L-histidine hydrochloride monohydrate, L-histidine, α,α-trehalose dihydrate, and polysorbate 20 were supplied from Merck, Germany. Milli-Q® Reference Water Purification System (Millipore, Burlington, MA, USA) with 18.2 MΩ∙cm resistivity was used as a Type 1 water source. Amicon® Ultra-0.5 mL 50 K centrifugal filter units (PR04190, Millipore, Burlington, MA, USA) were used for buffer exchange. Non-pyrogenic, sterile 0.2 μm PTFE filtration units were obtained from Sarstedt (Numbrecht, Germany). A pH controller was used to adjust the desired pH values.
2.2. Buffer Exchange Protocol
The pH of pure water was adjusted with 0.2 M HCl and 0.2 M NaOH to pH values of 4, 5, 6, 7, 8, and 9. Trastuzumab of 21 mg·mL−1 was used as the main stock, diluted to 1 mg·mL−1 with pure filtered water, and the buffer exchange was performed with Amicon 50 K filters by centrifugation at 14,000 rpm for 10 min with two repeats. Trastuzumab was collected by centrifugation at 1000 rpm for 2 min after turning the filter upside down, and the sample was resuspended via freshly prepared pure water with adjusted pH. The final trastuzumab solution was filtered with a 0.2 μm sterile filter and used for measurements.
2.3. DLS Measurements
The DLS technique utilizes the Brownian motion of the molecules dissolved in a solution in which scattering light events are converted into size values by the Stokes–Einstein equation [
11]. A Malvern Zetasizer Nano ZS DLS photon correlation spectroscopy instrument (Malvern Instruments Ltd., Malvern, UK) was used to determine the hydrodynamic size distribution and aggregation profiles of the mAb samples. The measurements were performed in a glass cuvette (PCS8501, Suprasil
® 300, Hellma Analytics, Mullheim, Germany).
Two independent temperature-ramped measurements were performed by increasing the temperature from 20 to 90 °C with 5 °C intervals and between 60–90 °C with a 1 °C interval to determine the aggregation onset temperature and aggregation profile. Each temperature measurement of 10 scans was collected, and an equilibration time of 180 s was used. Buffer exchanged samples were used for pH-dependent thermal stability measurements. The temperature-ramped pH-dependent measurement was performed by increasing the temperature from 20 to 90 °C with 5 °C intervals with an equilibration time of 30 s for aggregation analysis, with 2 scans for each temperature. This measurement was replicated for pH values of 4–9.
2.4. CD Measurements
The higher-order structure of trastuzumab was analyzed with CD spectroscopy. The far UV-CD wavelength spectrum was collected for trastuzumab (0.2 mg·mL−1) with a Jasco J-810 Spectro-polarimeter (Jasco Corporation, Tokyo, Japan) equipped with a Jasco PTC-510 Peltier temperature controller and water circulation bath to observe the conformational changes and analyze the secondary structure of trastuzumab, referring to structural elements such as α-helices, β-strands, and β-sheets. The system was purged with nitrogen for 20 min before each measurement. In all measurements, quartz cuvettes (Hellma Analytical, 110-1-46) with a path length of 0.1 cm were used.
The thermal denaturation study used directly diluted 0.2 mg·mL−1 trastuzumab within the pure water. The far-UV CD spectra were obtained in the range of 190–260 nm with 0.5 nm intervals, scanning speed of 50 nm·min−1, a response time of 2 s, a bandwidth of 1 nm with 3 accumulations, and standard sensitivity at 20 °C. The baseline was corrected in these experiments using double-filtered Milli-Q water. These parameters were also applied for temperature-wavelength measurements for directly diluted trastuzumab. Variable temperature Far-UV measurement of 0.2 mg·mL−1 trastuzumab in buffer solutions between the temperature of 20–90 °C was conducted at 218 nm to determine the course temperature range for conformational change by using standard sensitivity, a response time of 1 s, a scanning speed of 50 mm·min−1, a bandwidth of 1 nm with 3 accumulations and with 5 °C intervals. The temperature-ramped far UV CD spectra (190–260 nm) of buffer exchanged trastuzumab samples (pH 4, 5, 6, 7, 8, 9) were collected between 20–90 °C with 5 °C intervals. The temperature gradient of 5 °C min−1, a delay time of 10 s, data pitch of 1 nm, scanning mode of 50 nm min−1, a data integration time (DIT) of 2 s, and a bandwidth of 1 were used, and the average of 2 accumulations was calculated.
The concentration of trastuzumab was optimized as 0.2 mg·mL
−1 for measurements with a 1 mm path length cuvette based on Beer-Lambert Law. The CD spectrums were presented as mean molar ellipticity by residue [
]
λ versus wavelength in the graphs. CD ellipticity readings (mdeg) were transformed into mean molar ellipticity by residue [
]
λ using the equation presented below:
where
λ is the ellipticity (mdeg);
, the number of amino acid residues;
, protein concentration (mmol·L
−1) and
, the optical step (cm). The unit of [
]
λ was expressed in deg cm
2 dmol
−1. The ellipticity values (mdeg) with increasing temperature were recorded for 218 and 202 nm wavelengths. The measured ellipticity values were converted to mean residue ellipticity (MRE) (deg cm
2 dmol
−1) and smoothed by using 10-point Savitzky–Golay algorithm [
12,
13,
14]. The graphs of 202 and 218 nm yielded the picture of the temperature-induced decrease in MRE, which was fitted with a sigmoidal Boltzmann fit. The secondary structure content of the proteins was estimated with BeStSel [
15] using the far-UV CD spectral data. The number of amino acids in trastuzumab is 1337, which was used in BeStSel for unit conversion. The concentration values were also converted into µM.
3. Results
3.1. CD Results Reveal the Conformational Stability Profile of Trastuzumab through the Midpoint of the Thermal Unfolding Curve
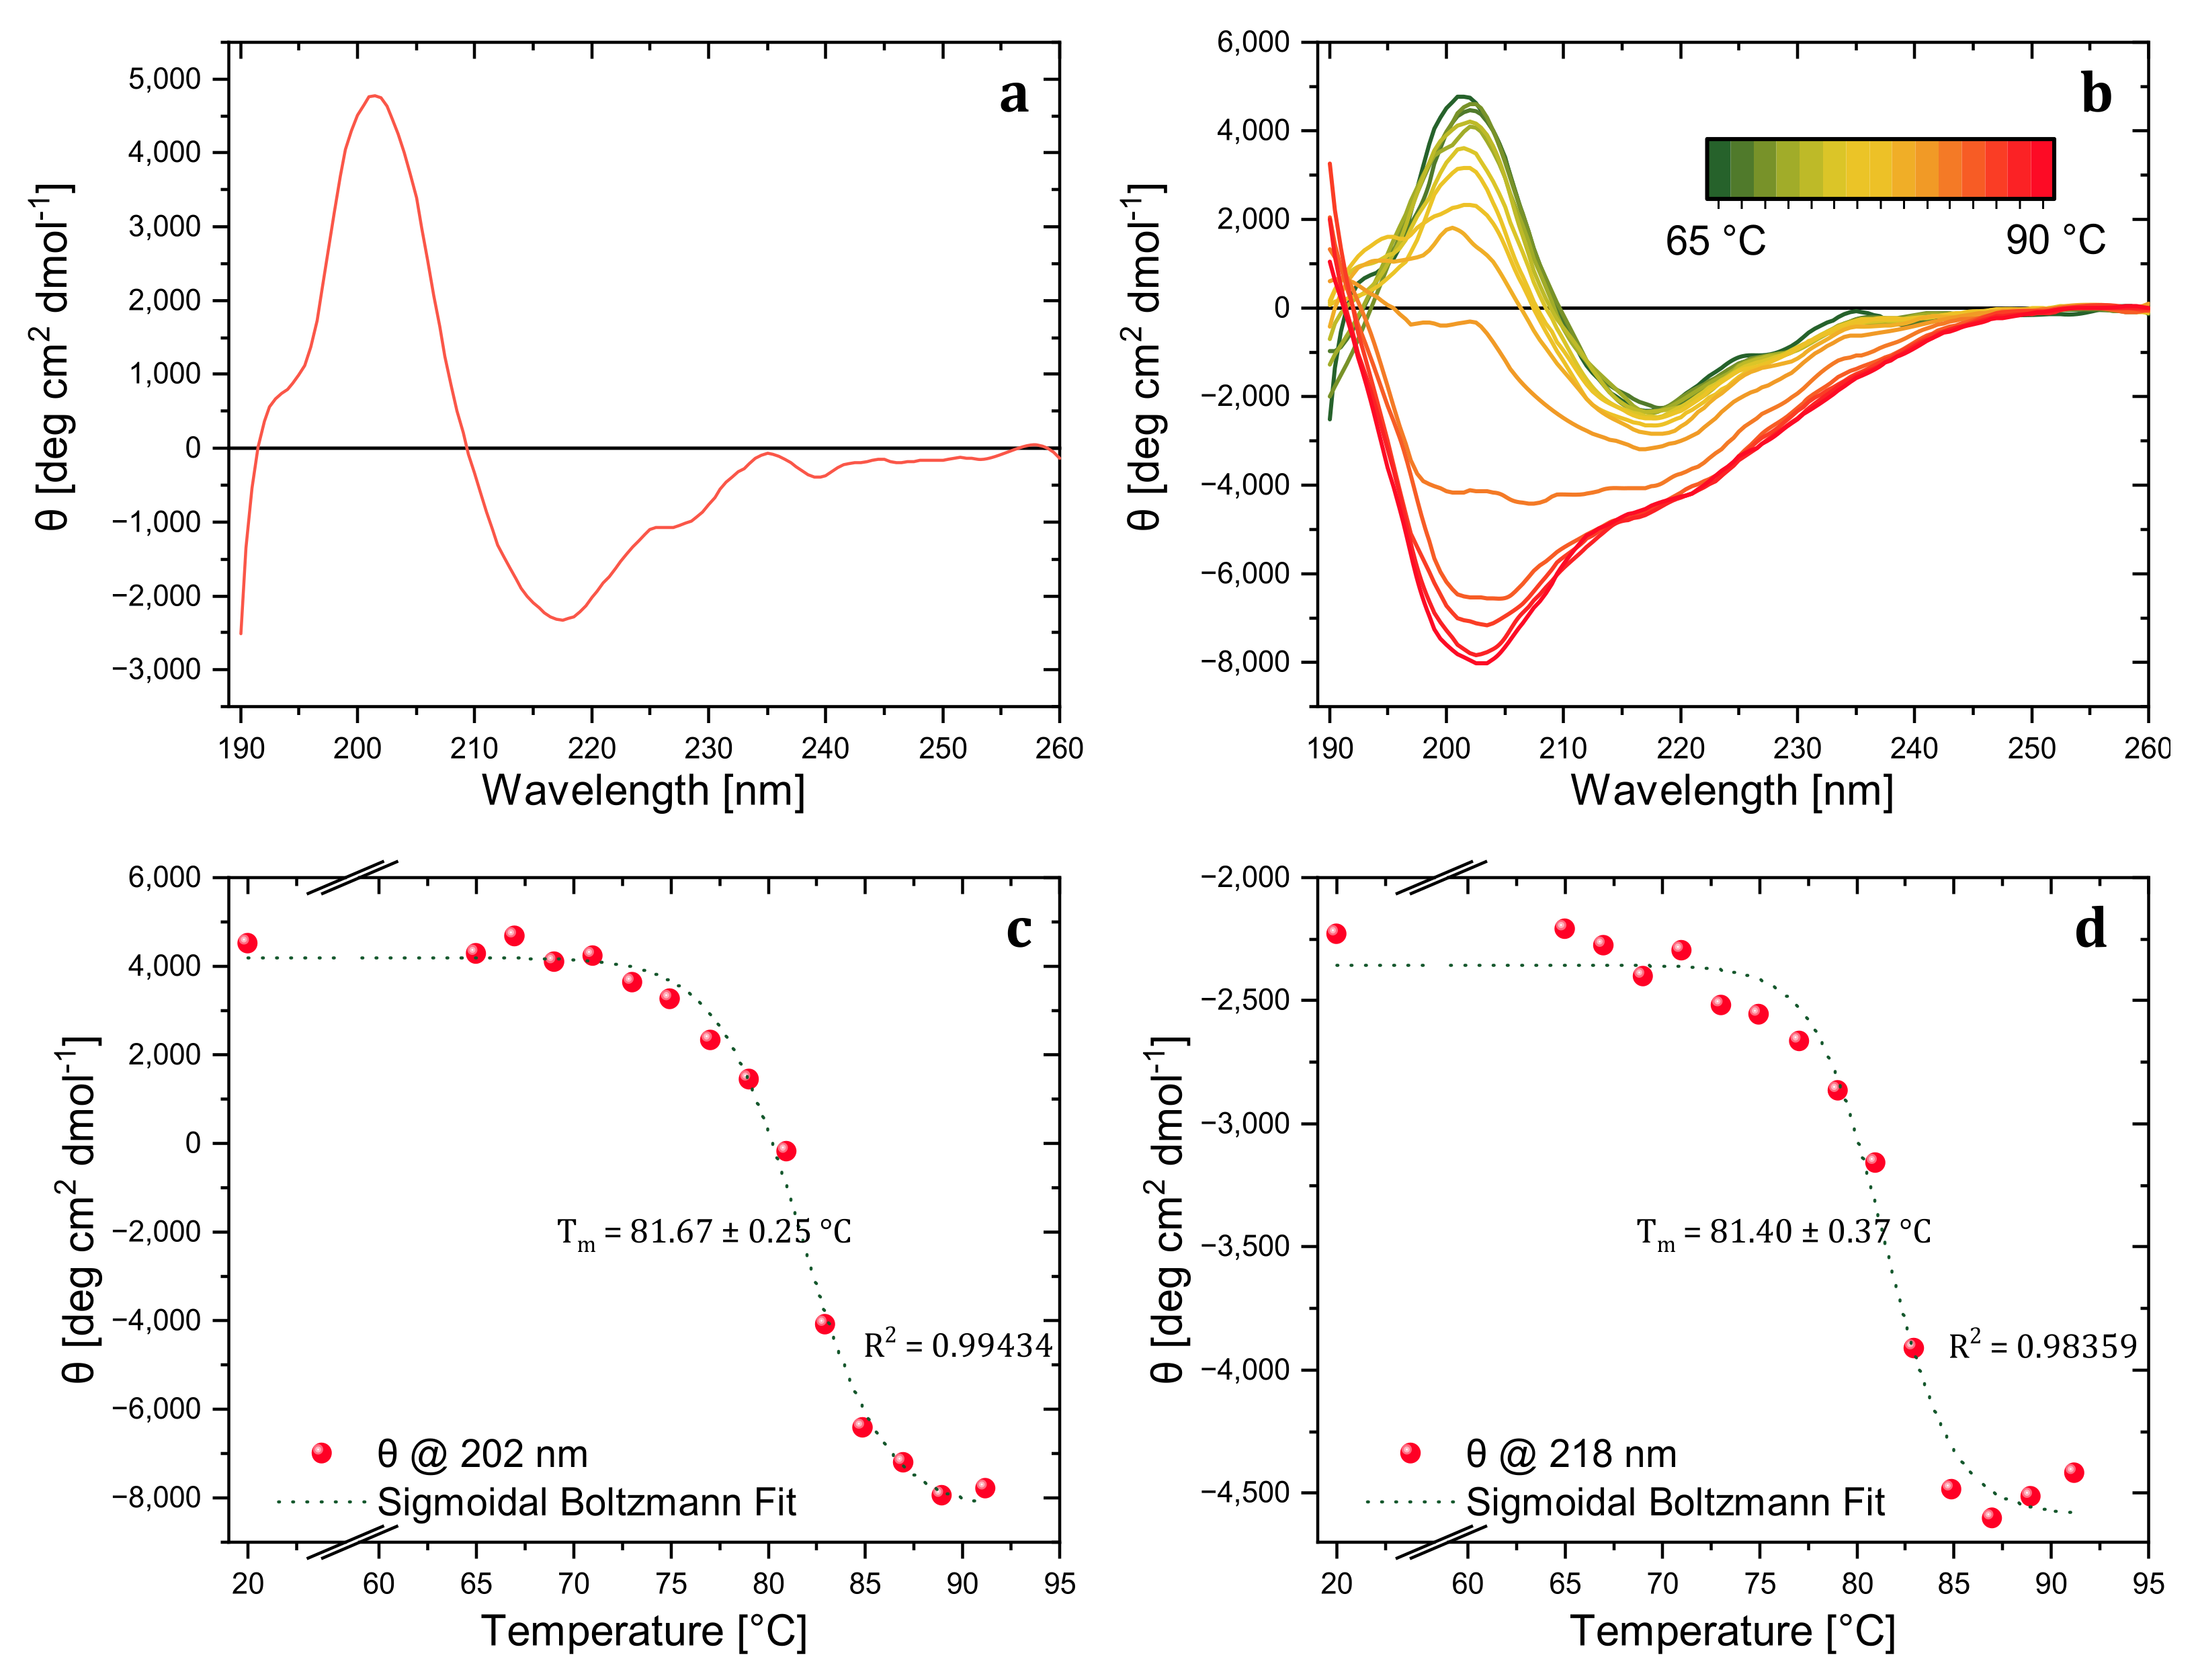
The thermal stability of trastuzumab was investigated in detail with CD to reveal the aggregation kinetics and the thermal melting point of the model mAb. In the far-UV region, the CD spectra were collected at 20 °C to obtain a reference spectrum of the native trastuzumab sample and determine the wavelength attributed to the characteristic secondary structure peaks. The spectrum of native trastuzumab showed characteristic positive peaks of β-sheets at around 202 nm and a negative peak around 218 nm (
Figure 1a). As revealed in the previous work of Joshi et al. [
16], spectral change at the characteristic secondary structure absorption wavelength is correlated with aggregate level (
Figure 1b). Differently, the aggregates were analyzed with DLS rather than SEC in this study.
A temperature-wavelength CD measurement was carried out between 65–90 °C with 2 °C interval steps to investigate the stepwise change in trastuzumab’s secondary structure and determine the melting temperature. As presented in
Figure 1b, the maxima of the peak at 202 nm decreased with temperature, became broader, and finally turned into a single negative peak corresponding to the characteristic of random coil structures [
17]. The decrease only in the characteristic β-sheet peaks at 202 nm and 218 nm corresponded to increased β-sheet content and aggregation level. However, in addition to MRE decrease, spectra also broadened and shifted towards the 230 nm corresponding to the increased random coil and disrupted conformation [
18]. The advantage of collecting full spectra with temperature-wavelength measurement rather than single wavelength spectra with variable temperature measurement was helpful for further structural investigation by BeStSel software. Additionally, the irreversible conformational change of trastuzumab was revealed by the variable temperature CD spectra at 202 nm via the cooling process (data is not shown here).
Among the ellipticity (mdeg) values obtained from temperature-wavelength measurements, the data for characteristic secondary structure peaks (202 and 218 nm) were extracted and graphed, and the less-noisy temperature-ellipticity graph was obtained for the data acquired at 202 nm. Thus, the ellipticity values for increasing temperatures at 202 nm were converted to MRE (deg cm2 dmol−1) and normalized, assuming the ellipticity values at 25 °C belonged to folded trastuzumab and the values at 91 °C belonged to completely unfolded trastuzumab.
The thermal denaturation of trastuzumab was first monitored with dominant MRE spectral features at a wavelength of 202 nm. The MRE values were plotted against temperature and fitted with a sigmoidal Boltzmann function. The denaturation temperature was determined as 81.67 ± 0.25 °C with an R
2 value of 0.99434, as shown in
Figure 1c. Additionally, we tracked the second MRE spectral feature at the wavelength of 218 nm. Sigmoidal Boltzmann fit revealed the denaturation temperature as 81.40 ± 0.37 °C with an R
2 value of 0.98359 (
Figure 1d), which is again in good agreement with the second thermal denaturation peak of trastuzumab found by DSC (which gave a double peak at 71 and 81 °C, respectively [
19]). Although the thermal melting point of the whole mAb was precisely determined, the method did not reveal information about each primary domain (Fab and Fc). Nevertheless, thermal analysis with enzymatically treated mAbs can be conducted with this CD method without a nano DSC instrument for the same purpose.
3.2. CD Results Reveal the Relationship between Thermal Stability of Trastuzumab and Various pH Values
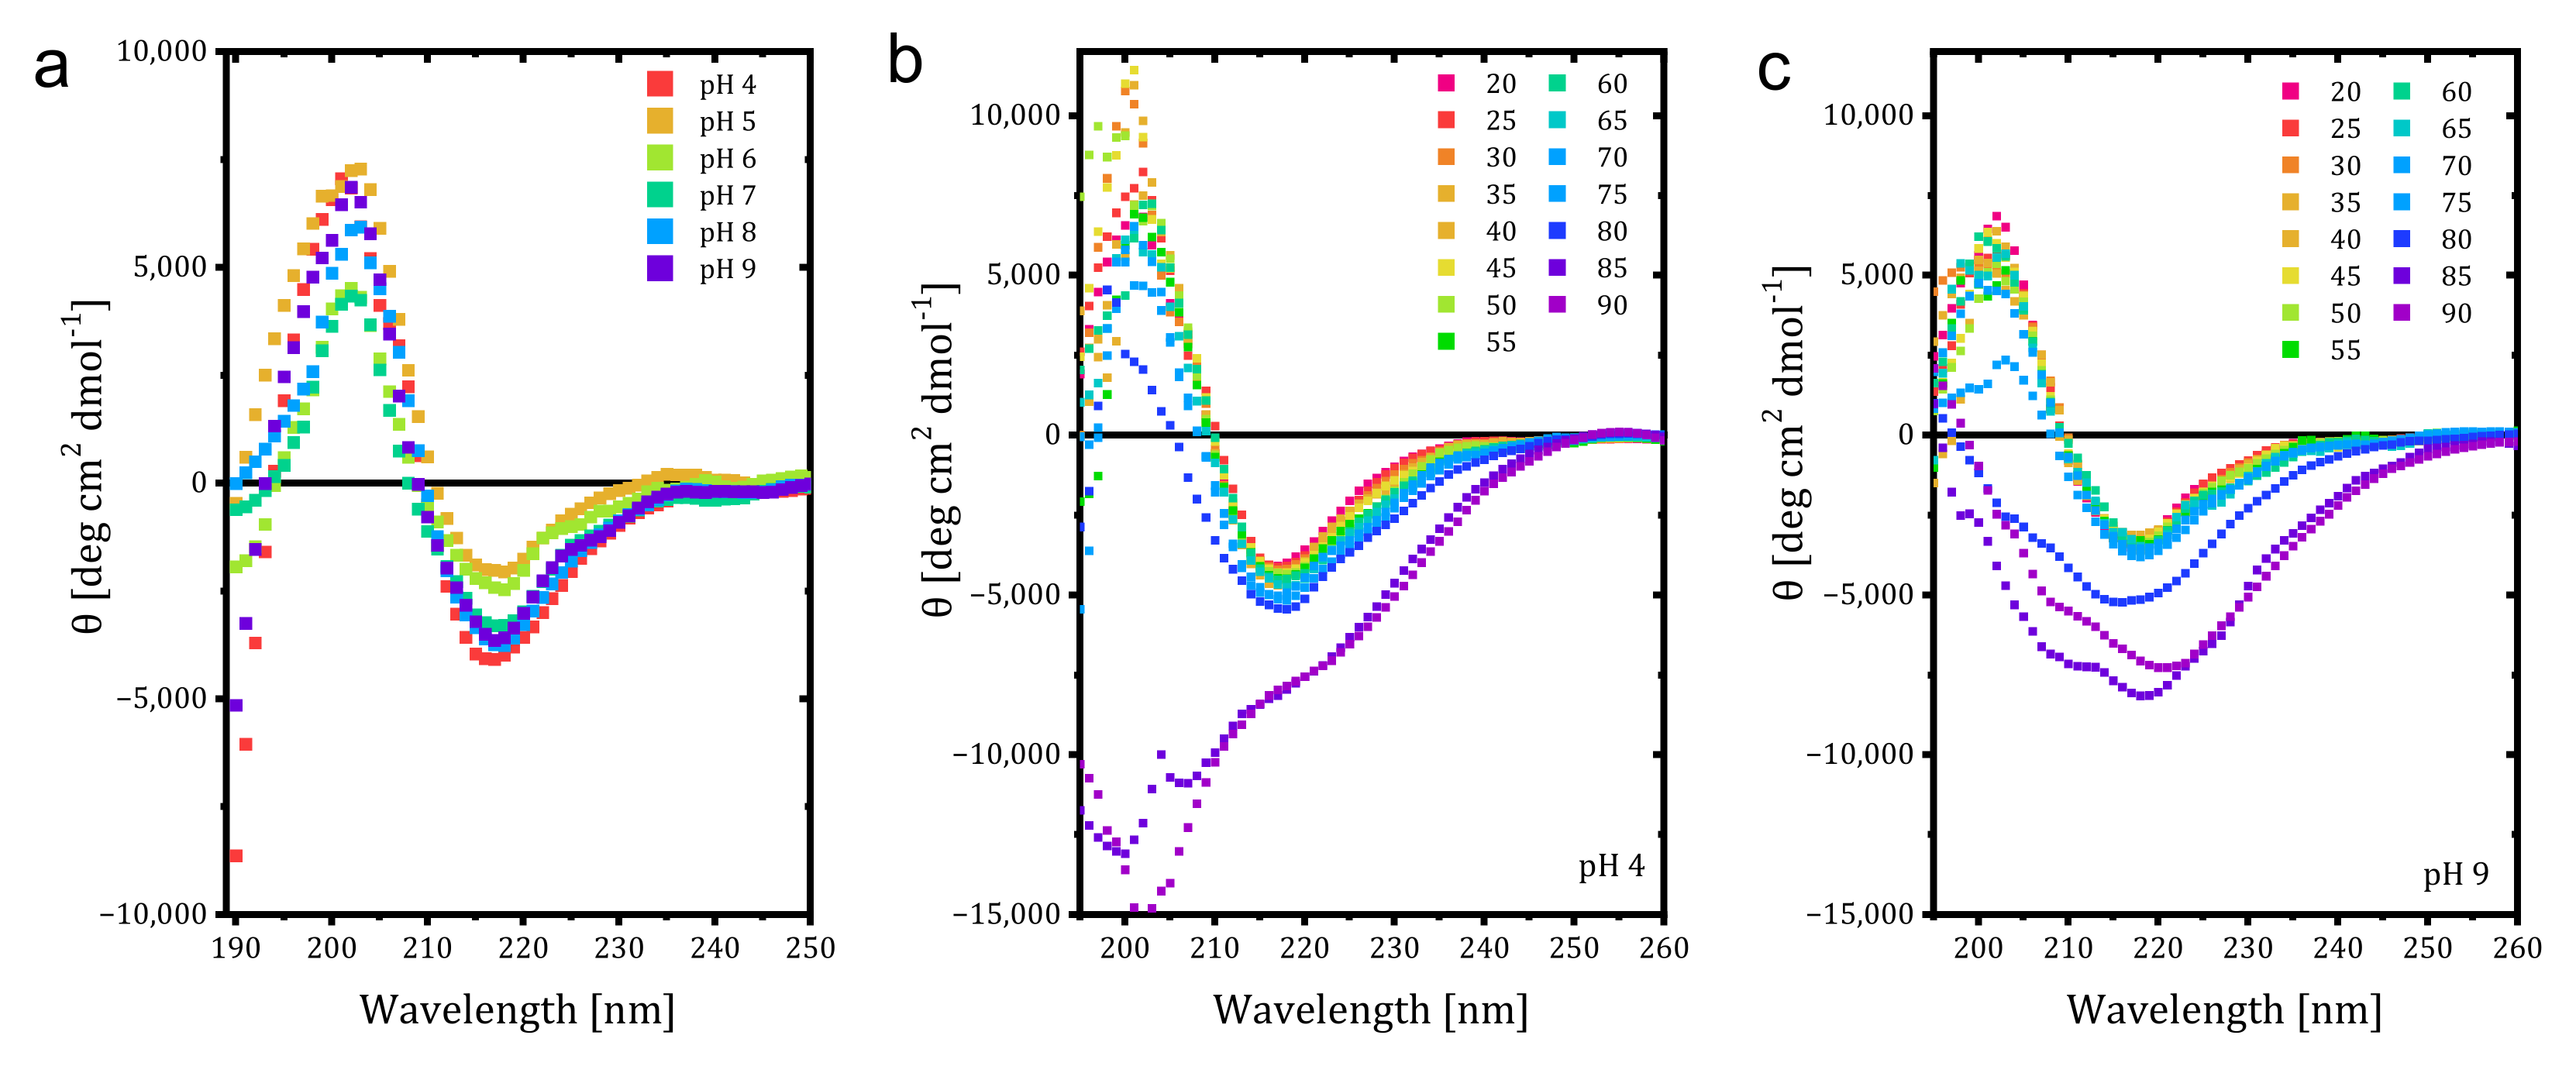
Additional studies with CD were conducted, and the effect of pH on the Far UV CD spectrum of trastuzumab at 20 °C is given in
Figure 2a. A decrease in the positive peak CD signal was observed at pH 6 and 7, whereas the magnitudes of the negative peak signals decreased for pH 5 and 6, corresponding to less β-sheet content than at higher pH values. Low pH destabilized the mAb structure with decreased T
m, even though it retained native structure [
20]. Due to higher positive charge density at lower pH, charge repulsion prevents aggregation and can be indistinguishable from native mAb in secondary structure but become thermally less stable. In our study, higher content of β-sheet was observed at higher pH values without any shift, which could be related to increased aggregation to avoid more exposure to the hydrophobic region. It is also known that the increased β-sheet causes further aggregation. Next, temperature-wavelength measurements were conducted for each pH value, and the results for pH 4 and 9 are given in
Figure 2a,b. While the irregular structural elements started to be seen at 85 °C for pH 4 and 5, the value decreased to 80 °C for pH 7 and 9. This shows that disruption of the secondary structure started earlier for pH values 7 and higher, and the acidic solvents provided better resistance against thermal unfolding. Our results differ from reports in the literature that lower pH decreases thermal stability but is consistent with the low aggregation and counterbalanced hydrophobic attraction with electrostatic repulsion [
18]. The CD findings also match the volume and number-based hydrodynamic size measurements by DLS in stability comparison (Figure 5).
As a next step, the thermal denaturation curve for each pH was plotted to find the melting temperature and observe the unfolding onset temperatures (data is not shown). Gradual thermal unfolding of trastuzumab at pH 4 and 5 was observed to start at around 50 °C, and the corresponding T
m values were calculated as 81.10 °C and 82.61 °C by Boltzmann fit. On the other hand, the sudden drop in CD values after 75 °C was observed for pH 6, 7, 8, and 9, and their T
m values were found as 80.81 °C, 79.64 °C, 81.61 °C, and 80.08 °C, respectively. The smallest T
m was observed for pH 7, and the highest was for pH 5. Although T
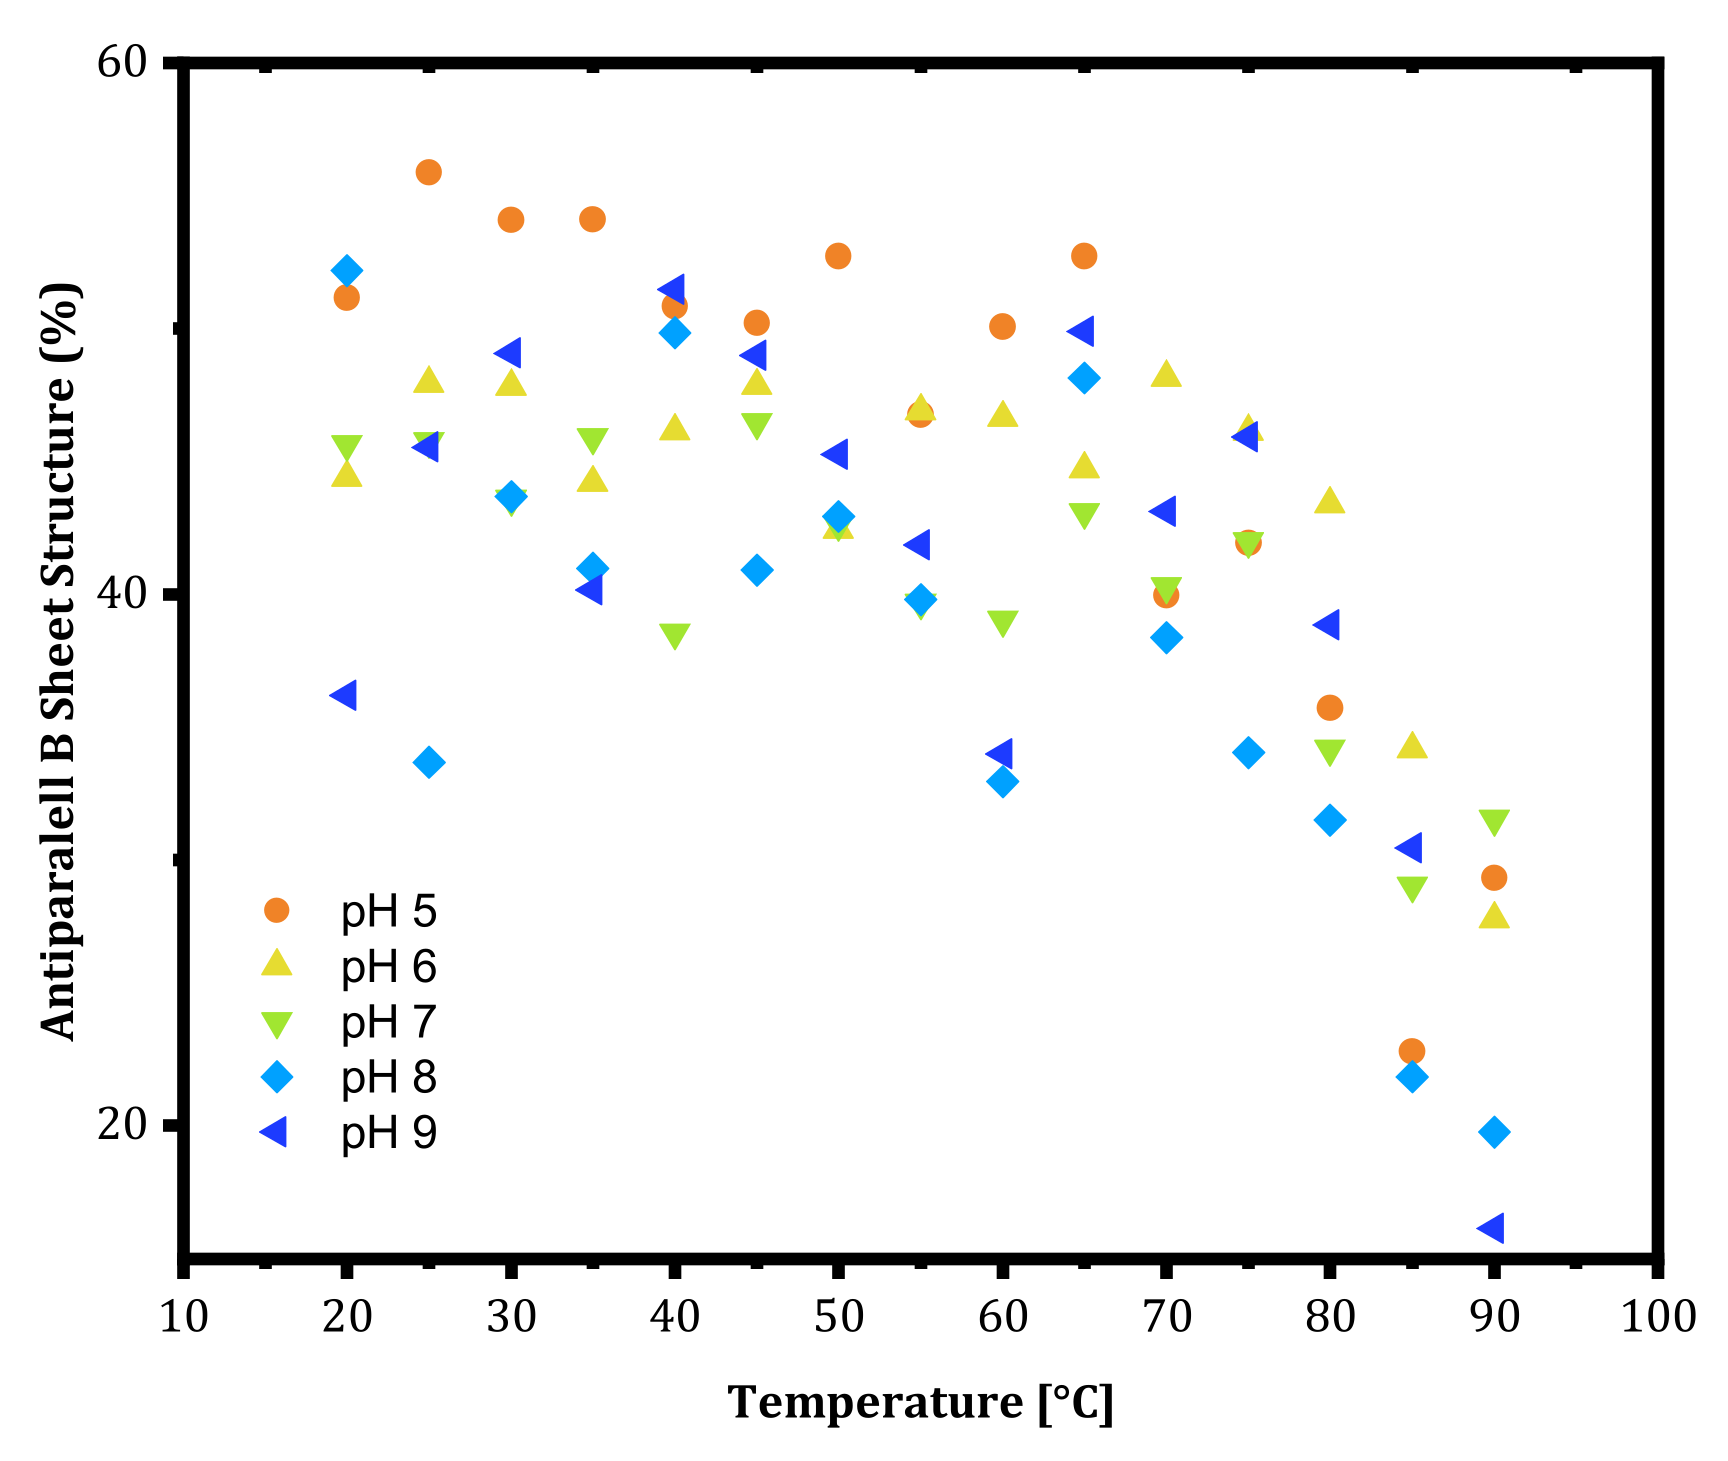
m values at lower pH values were high, the onset temperature where the structural change started to occur appeared at a lower temperature. This shows that mAbs rearrange their structures earlier at lower pH and show resistance to aggregation. Lastly, the antiparallel β-sheet content of trastuzumab is shown in
Figure 3 as a function of pH. At thermal unfolding temperatures, a decrease in the antiparallel β-sheet structure was observed (
Figure 3) as an indication of the leading cause of aggregation as secondary structure disruption.
3.3. BeStSel Further Revealed the Details of the Secondary Structure and Stability Relationship
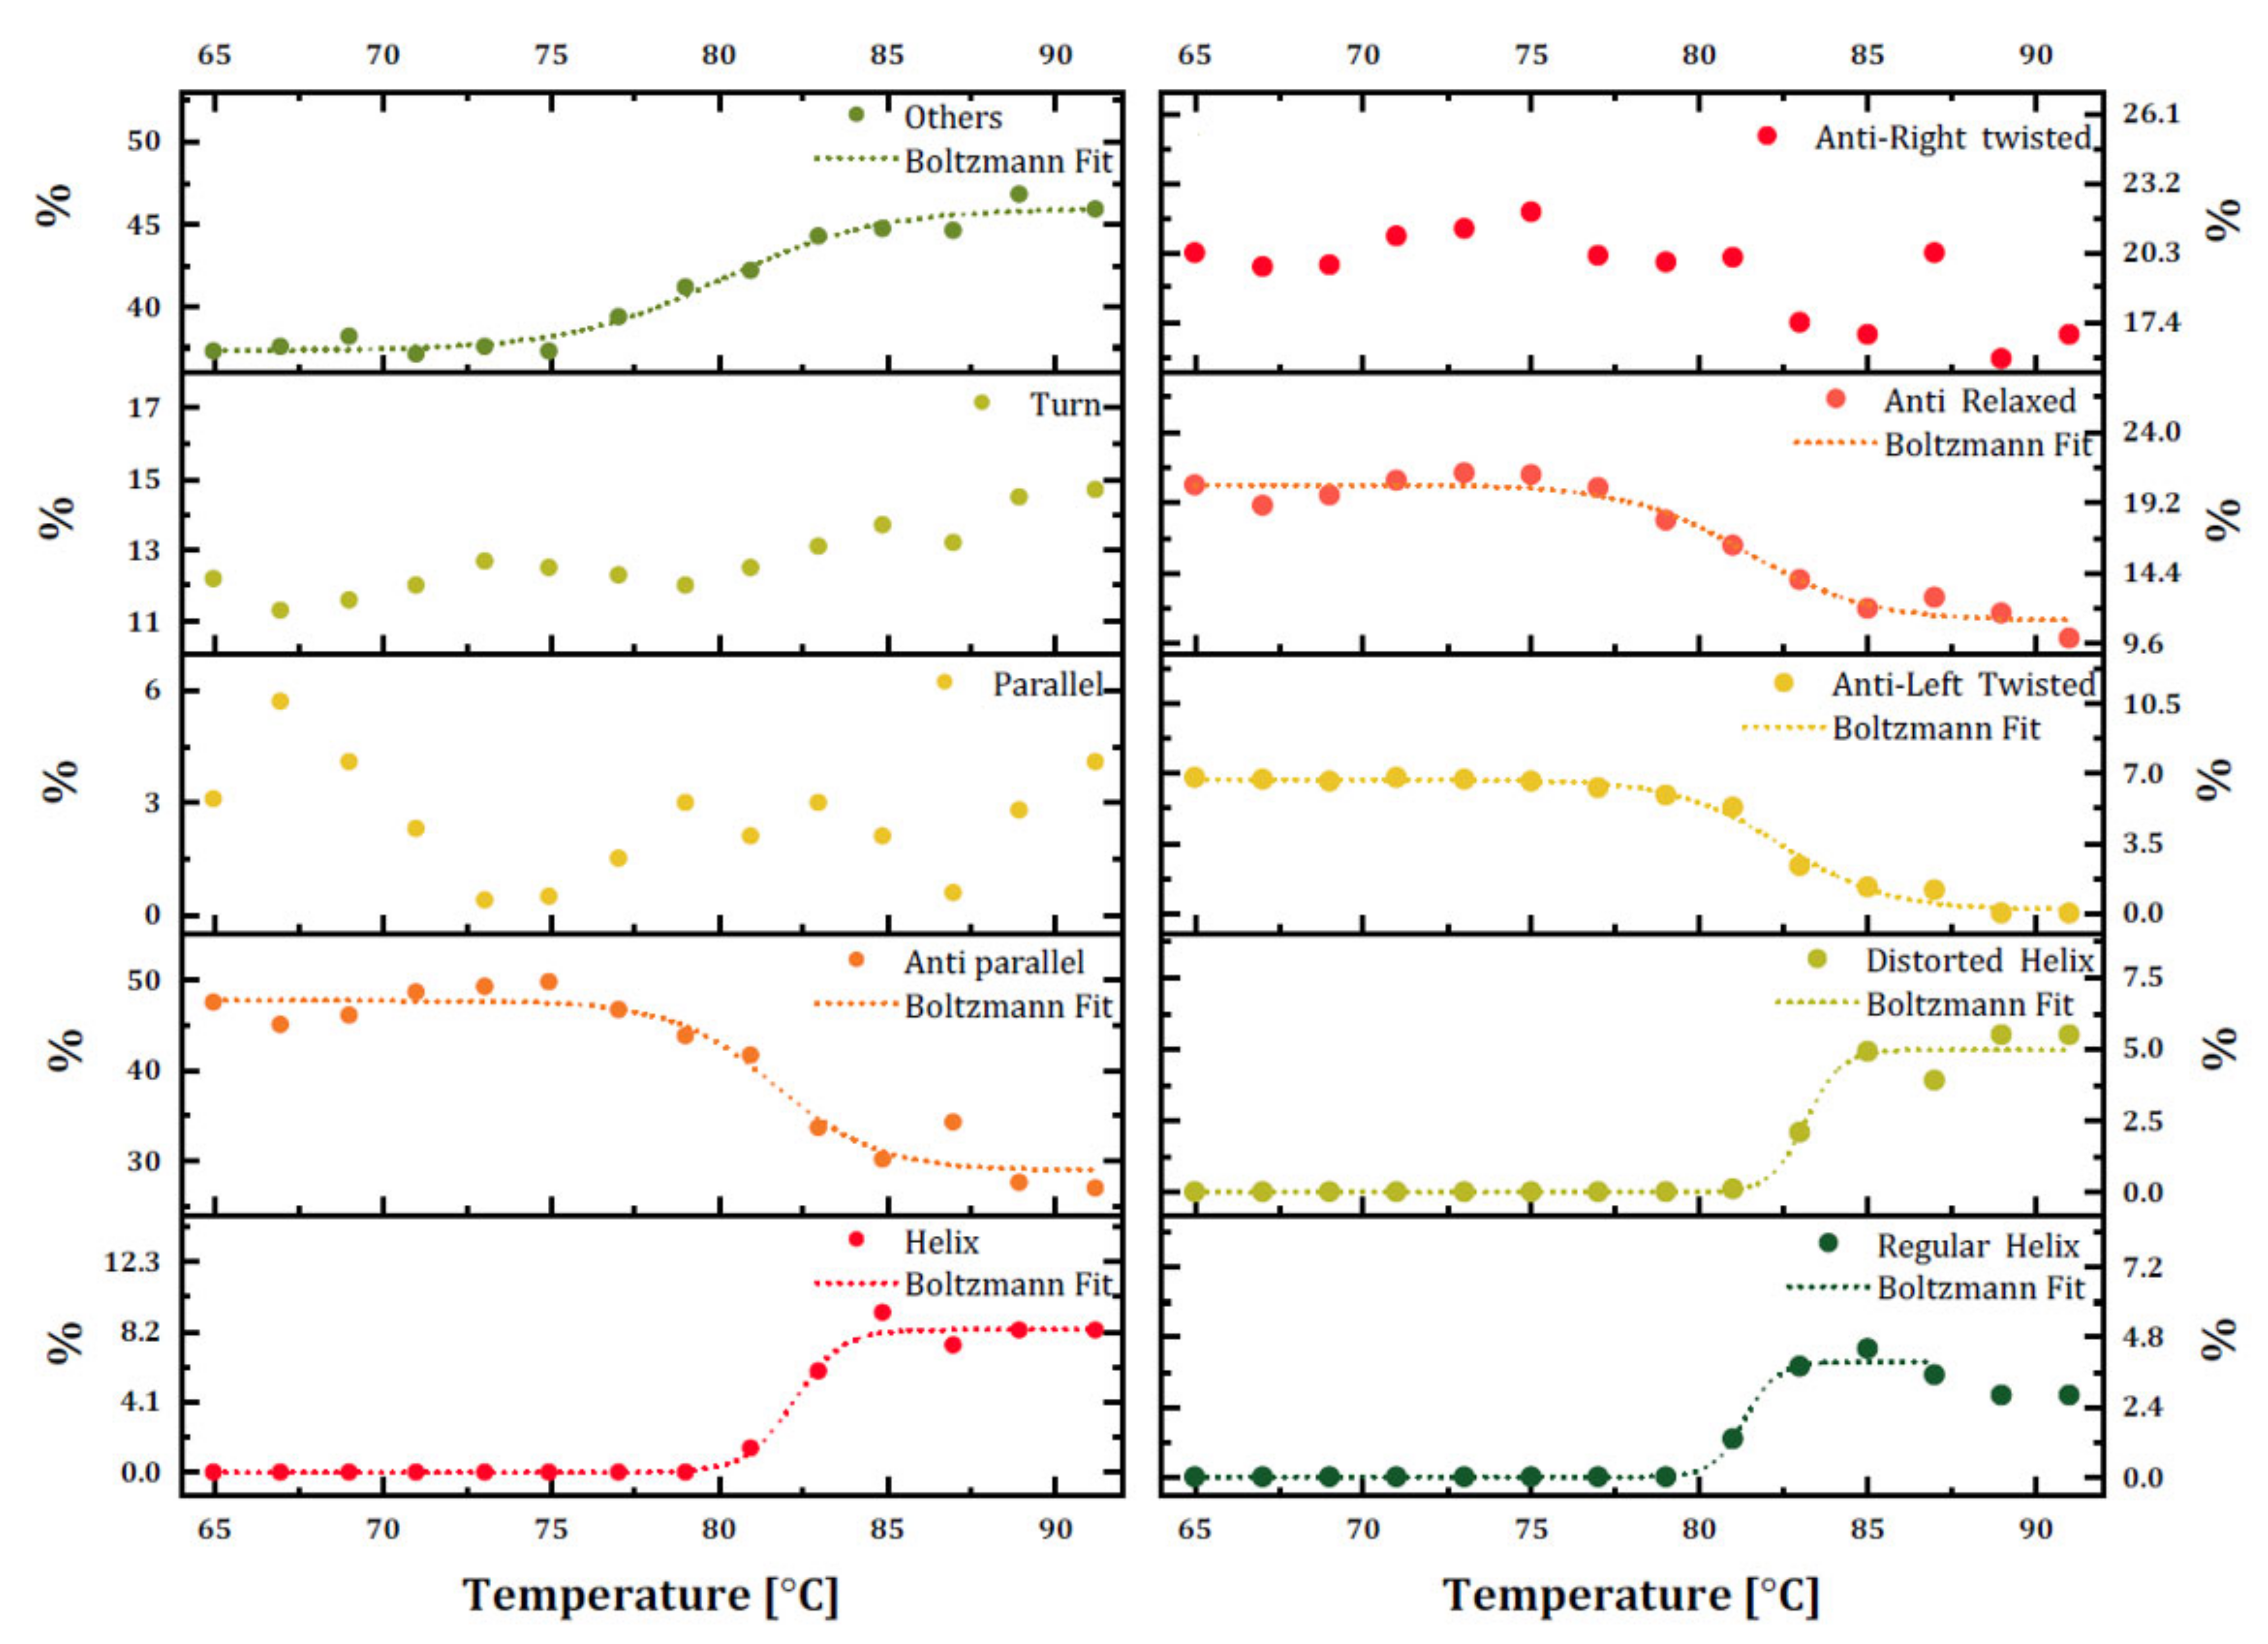
The secondary structure content of trastuzumab was monitored using BeStSel with raw ellipticity (mdeg) data for each temperature ramp (
Figure 4) to overcome intrinsic limitations of CD and observe the temperature-dependent change of each structural unit rather than an overall implication of secondary structure change. The dominant β-sheet structures are found in mAbs and were confirmed as the dominant structure with 47.5% content in trastuzumab. The percentages of secondary structure units at 20 °C (0% helix, 50.4% β-sheets, and 37.7% others) were similar to the secondary structure of trastuzumab in PBS, determined by the same method (6.1% helix, 55.7% β-sheets, and 38.3% others) [
21]. However, our results did not contain any helix structure with weaker hydrogen bonds on their backbone than that of β-sheets, and these secondary structures mainly were adopted at a more hydrophobic medium. The secondary structure assessment of the temperature-based CD measurement of trastuzumab proved that while the temperature increased, antiparallel β-sheet content decreased to 31.1%, and other structures, including random coils, increased to 45.9%, which is an indicator of mAb denaturation.
Disruption in the secondary structure of trastuzumab also increased the helix content up to 8.3%, which was not expected for the denaturation process. These data may need further investigation by other methods. Additionally, there was a decrease in the content of antiparallel β-sheets and an increase in random coil structure starting at 75 °C. The percentage of other structures was crossed with decreasing antiparallel β-sheet structures at around 80 °C, which was quite close to the determined Tm of trastuzumab in this study. As a result, trastuzumab in its formulation started to unfold at 75 °C, and thermal melting occurred around 80–83 °C. When secondary structure subunits were investigated, it was also observed that both distorted and regular helix content started to increase and become relaxed, and antiparallel β-sheet content started decreasing at 80 °C. The formation of the regular helix started earlier than the distorted helix.
3.4. DLS Study Reveals Colloidal Stability Profile of Trastuzumab through Aggregation Onset Temperature
DLS measurements require optimization of sample concentration for analysis. Low concentrations result in low signal-to-noise ratios (weak count rates), whereas higher concentrations can lead to aggregation [
22]. Additionally, DLS undervalues hydrodynamic diameter at high concentration measurements because of multiple scattering, which results in decreased intensity [
23] and nonideal Brownian motion [
24]. Thus, the antibody concentrations between 0.25–16 mg∙mL
−1 were tested, as shown in
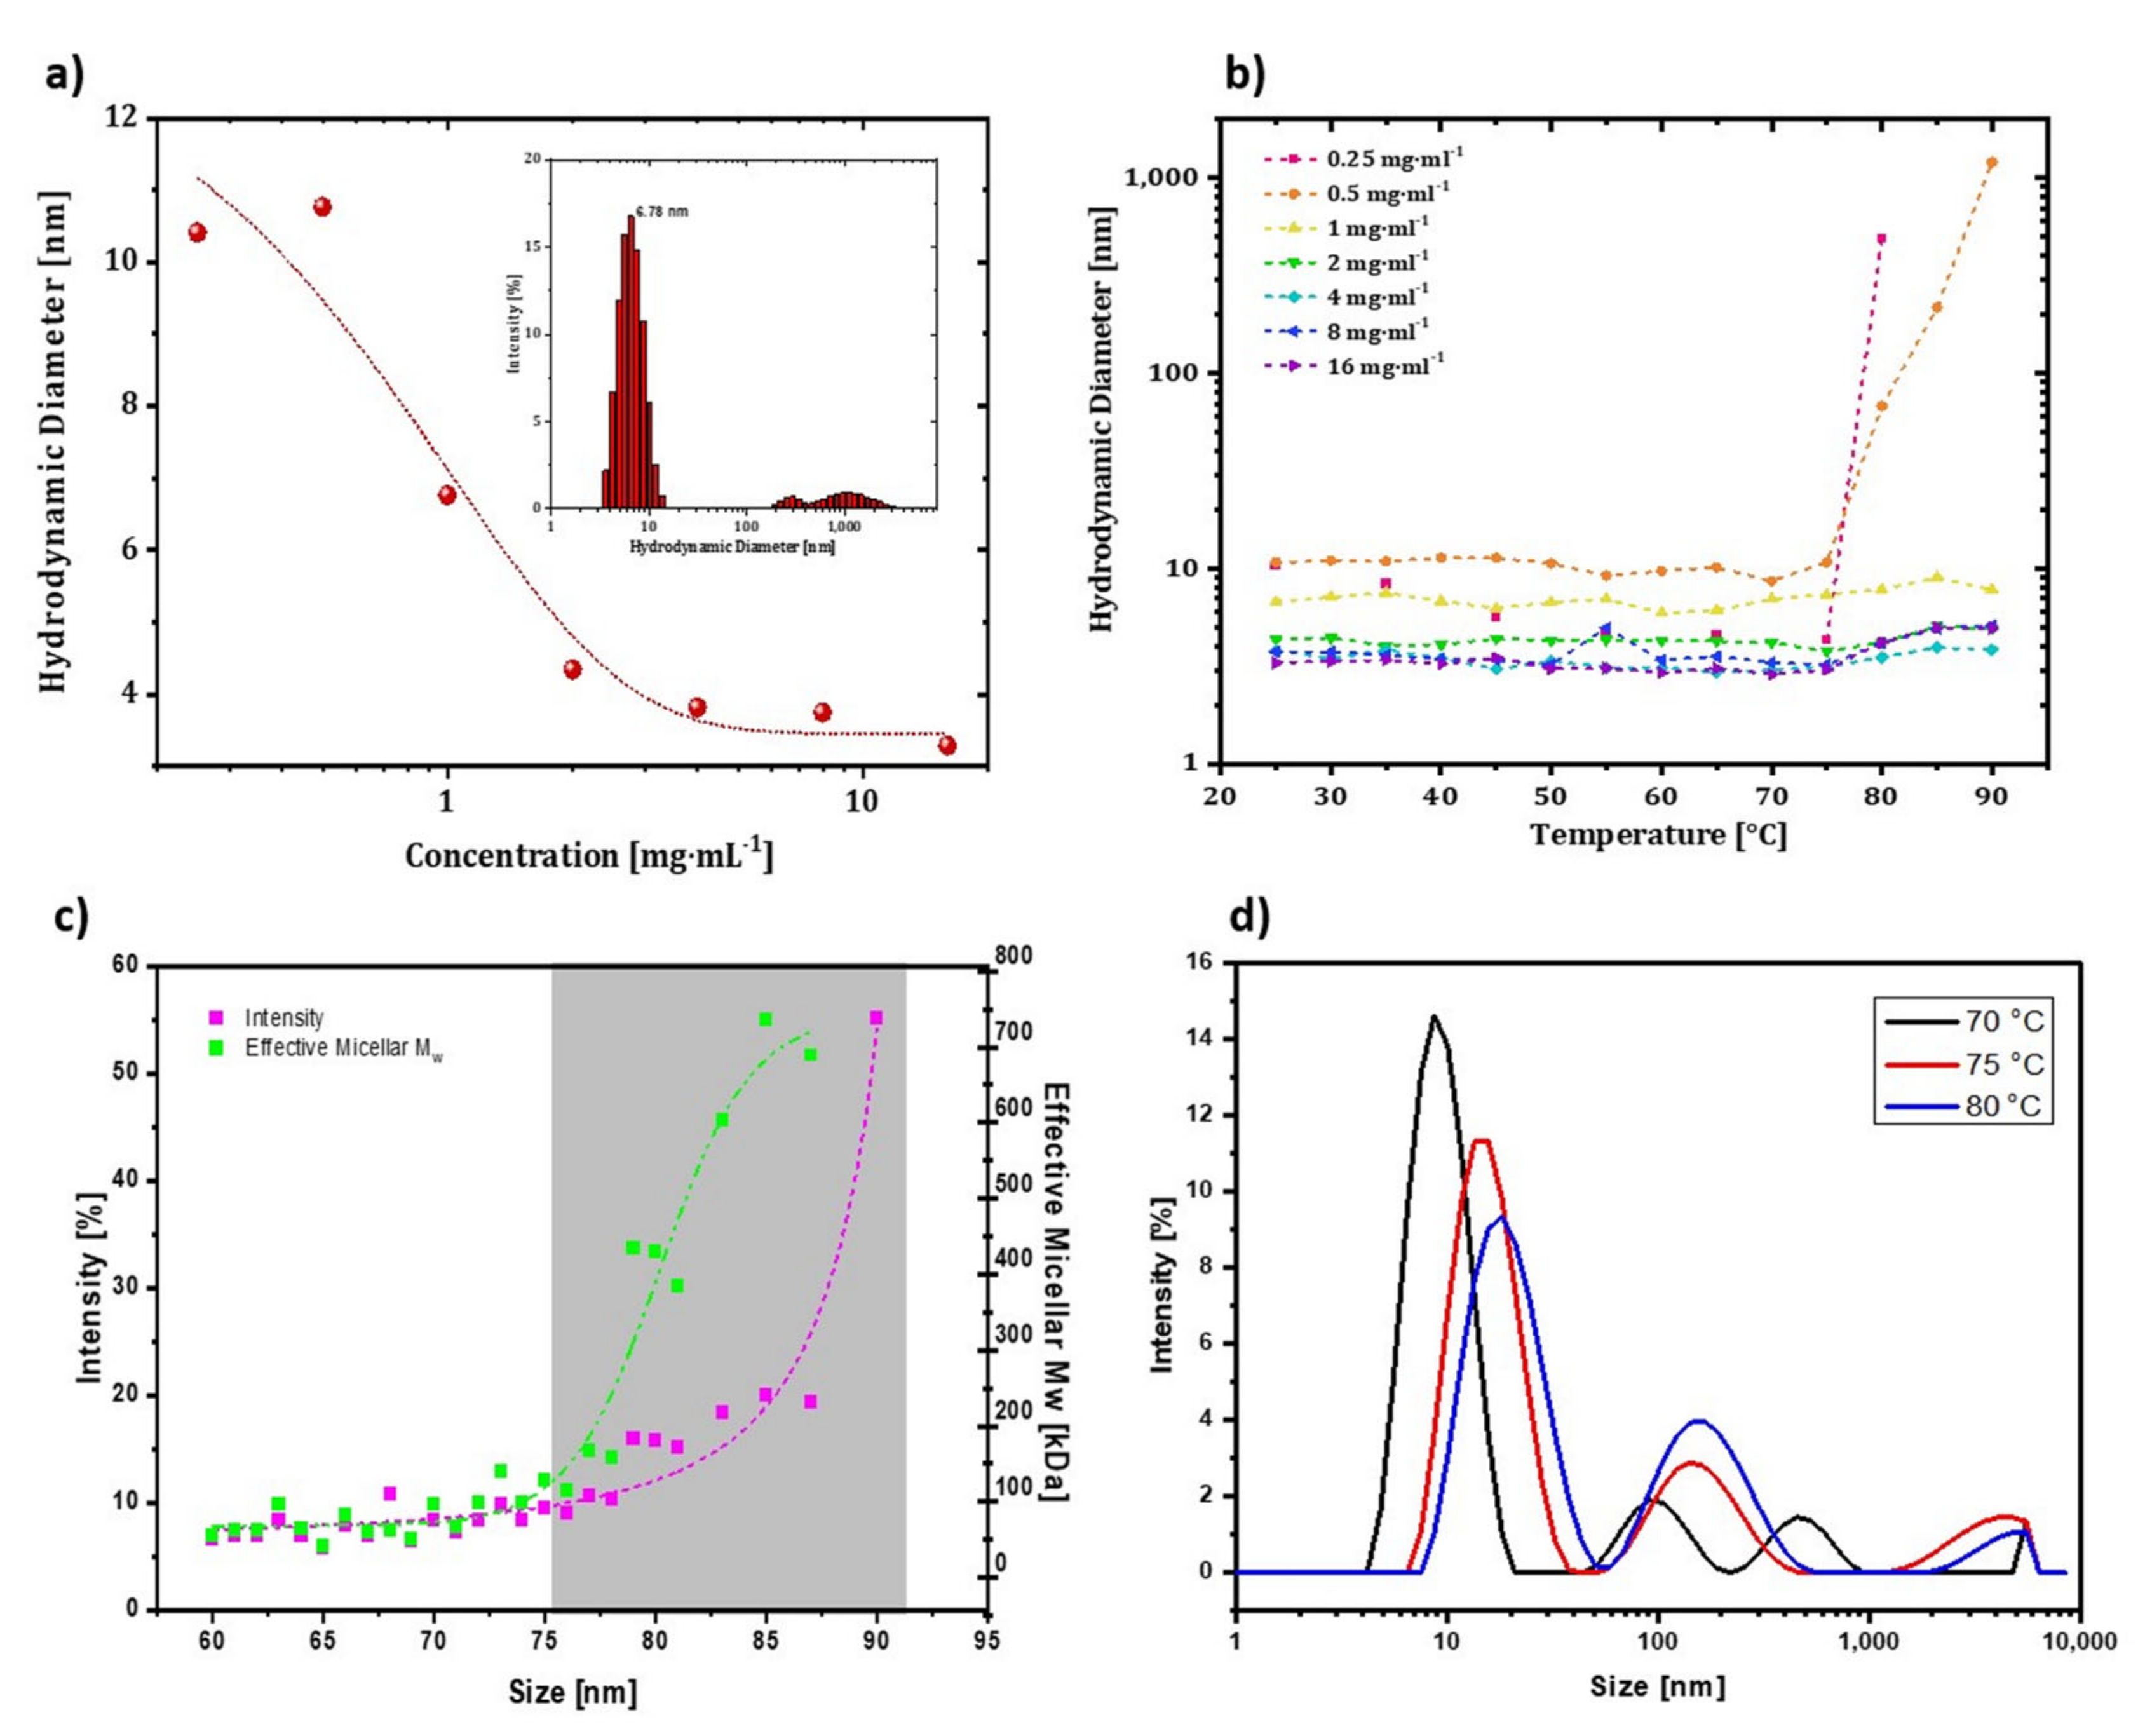
Figure 5a. When the concentrations were 0.25, 0.5, and 1 mg∙mL
−1, the hydrodynamic radius of trastuzumab was around 9–10 nm. The amount of aggregation of particles was less at these concentrations than at higher concentrations. As the concentration increased from 2 to 16 mg∙mL
−1, the hydrodynamic size of trastuzumab decreased to 5–6 nm on average. Additionally, the high concentration would hinder particle movement because the particles would prefer to interact more with each other than with the media. Therefore, an optimized concentration of 0.2 mg∙mL
−1 was used for DLS measurements of trastuzumab in the remainder of the study. Reference measurements at room temperature with 0.2 mg∙mL
−1 trastuzumab were conducted, and the hydrodynamic diameter of trastuzumab was found as 6.78 ± 0.4 nm (inset of
Figure 5a).
Next, a temperature-ramped hydrodynamic size measurement was conducted to define the effect of concentration on the onset aggregation point of resuspended trastuzumab in its formulation. With temperature-based size increments in the measurements, the hydrodynamic diameters of mAbs were expected to increase dramatically at some point due to the association of mAbs with thermal denaturation events and further interactions via hydrophobic regions. This excessive rise in aggregation at a specific temperature is defined as aggregation onset temperature (T
agg onset), which reveals the colloidal stability of an mAb solution [
25]. The aggregates introduced by sample preparation and contaminants were removed by filtering with 0.22 µm syringe filters before the DLS measurement to monitor the aggregation caused by protein-protein and protein–solvent interactions. Thus, intensity-based size measurements were investigated to detect T
agg, onset, and the results are presented in
Figure 5b. T
agg,onset value was determined as 75 °C for 0.25 and 0.5 mg·mL
−1 samples. However, there was no excessive rise in hydrodynamic diameters for higher concentrations, and hydrodynamic diameters at lower temperatures were smaller (3–6 nm), which could be due to underestimating particle size. Thus, lower concentrations of mAbs were required to observe T
agg, onset and obtain reliable size data. It should be noted that using low concentrations of therapeutic mAbs to measure the T
agg, onset may limit direct T
agg, onset determination of highly concentrated therapeutic mAbs used for administration.
T
agg, the onset of trastuzumab was investigated between 20–90 °C by 5 °C interval steps. The changes in molecular weight and intensity-based hydrodynamic diameter following temperature increment are given in
Figure 5c. These parameters dramatically increased effective micellar molecular weight and diameter, starting at 75 °C. The diameter did not change dramatically before since the solvent–protein interaction forces were superior to those of the protein-protein interactions. After aggregation started at 75 °C, the hydrodynamic diameter increased gradually because more mAb molecules lost their colloidal stability and were associated with each other, forming aggregates.
Figure 5d shows the intensity-based hydrodynamic diameter change of trastuzumab at 70–75–80 °C. When the temperature rose from 70 to 80 °C, the intensity corresponding to the mAb monomer decreased, and a shift was observed at slightly higher diameters. The unfolding of different parts of an mAb can accelerate the aggregation events due to the exposure of the hydrophobic residues to the solvent. T
agg, onset was 75 °C, which agreed with the melting temperature range (73–76 °C) determined previously by CD measurements [
21]. It is worth mentioning that even though the T
agg, onset corresponded to the melting temperature of trastuzumab, it may take place after or just before the unfolding of the structure. Thus, DLS can be used for a rough but practical estimation of the melting temperature. As a result, a clear understanding can be developed by using CD as a complementary method to DLS for thermal stability studies.
3.5. Effect of pH on the Thermal Stability of Trastuzumab Revealed by DLS
The thermal stability of buffer exchanged 0.2 mg∙mL
−1 trastuzumab at different pH values was also investigated with DLS. Unlike the previous DLS measurements in formulation buffer, the repeat number and equilibration time were decreased to 1 and 30 s, respectively, and data were collected between 20–90 °C by 5 °C ramps. Results are shown in
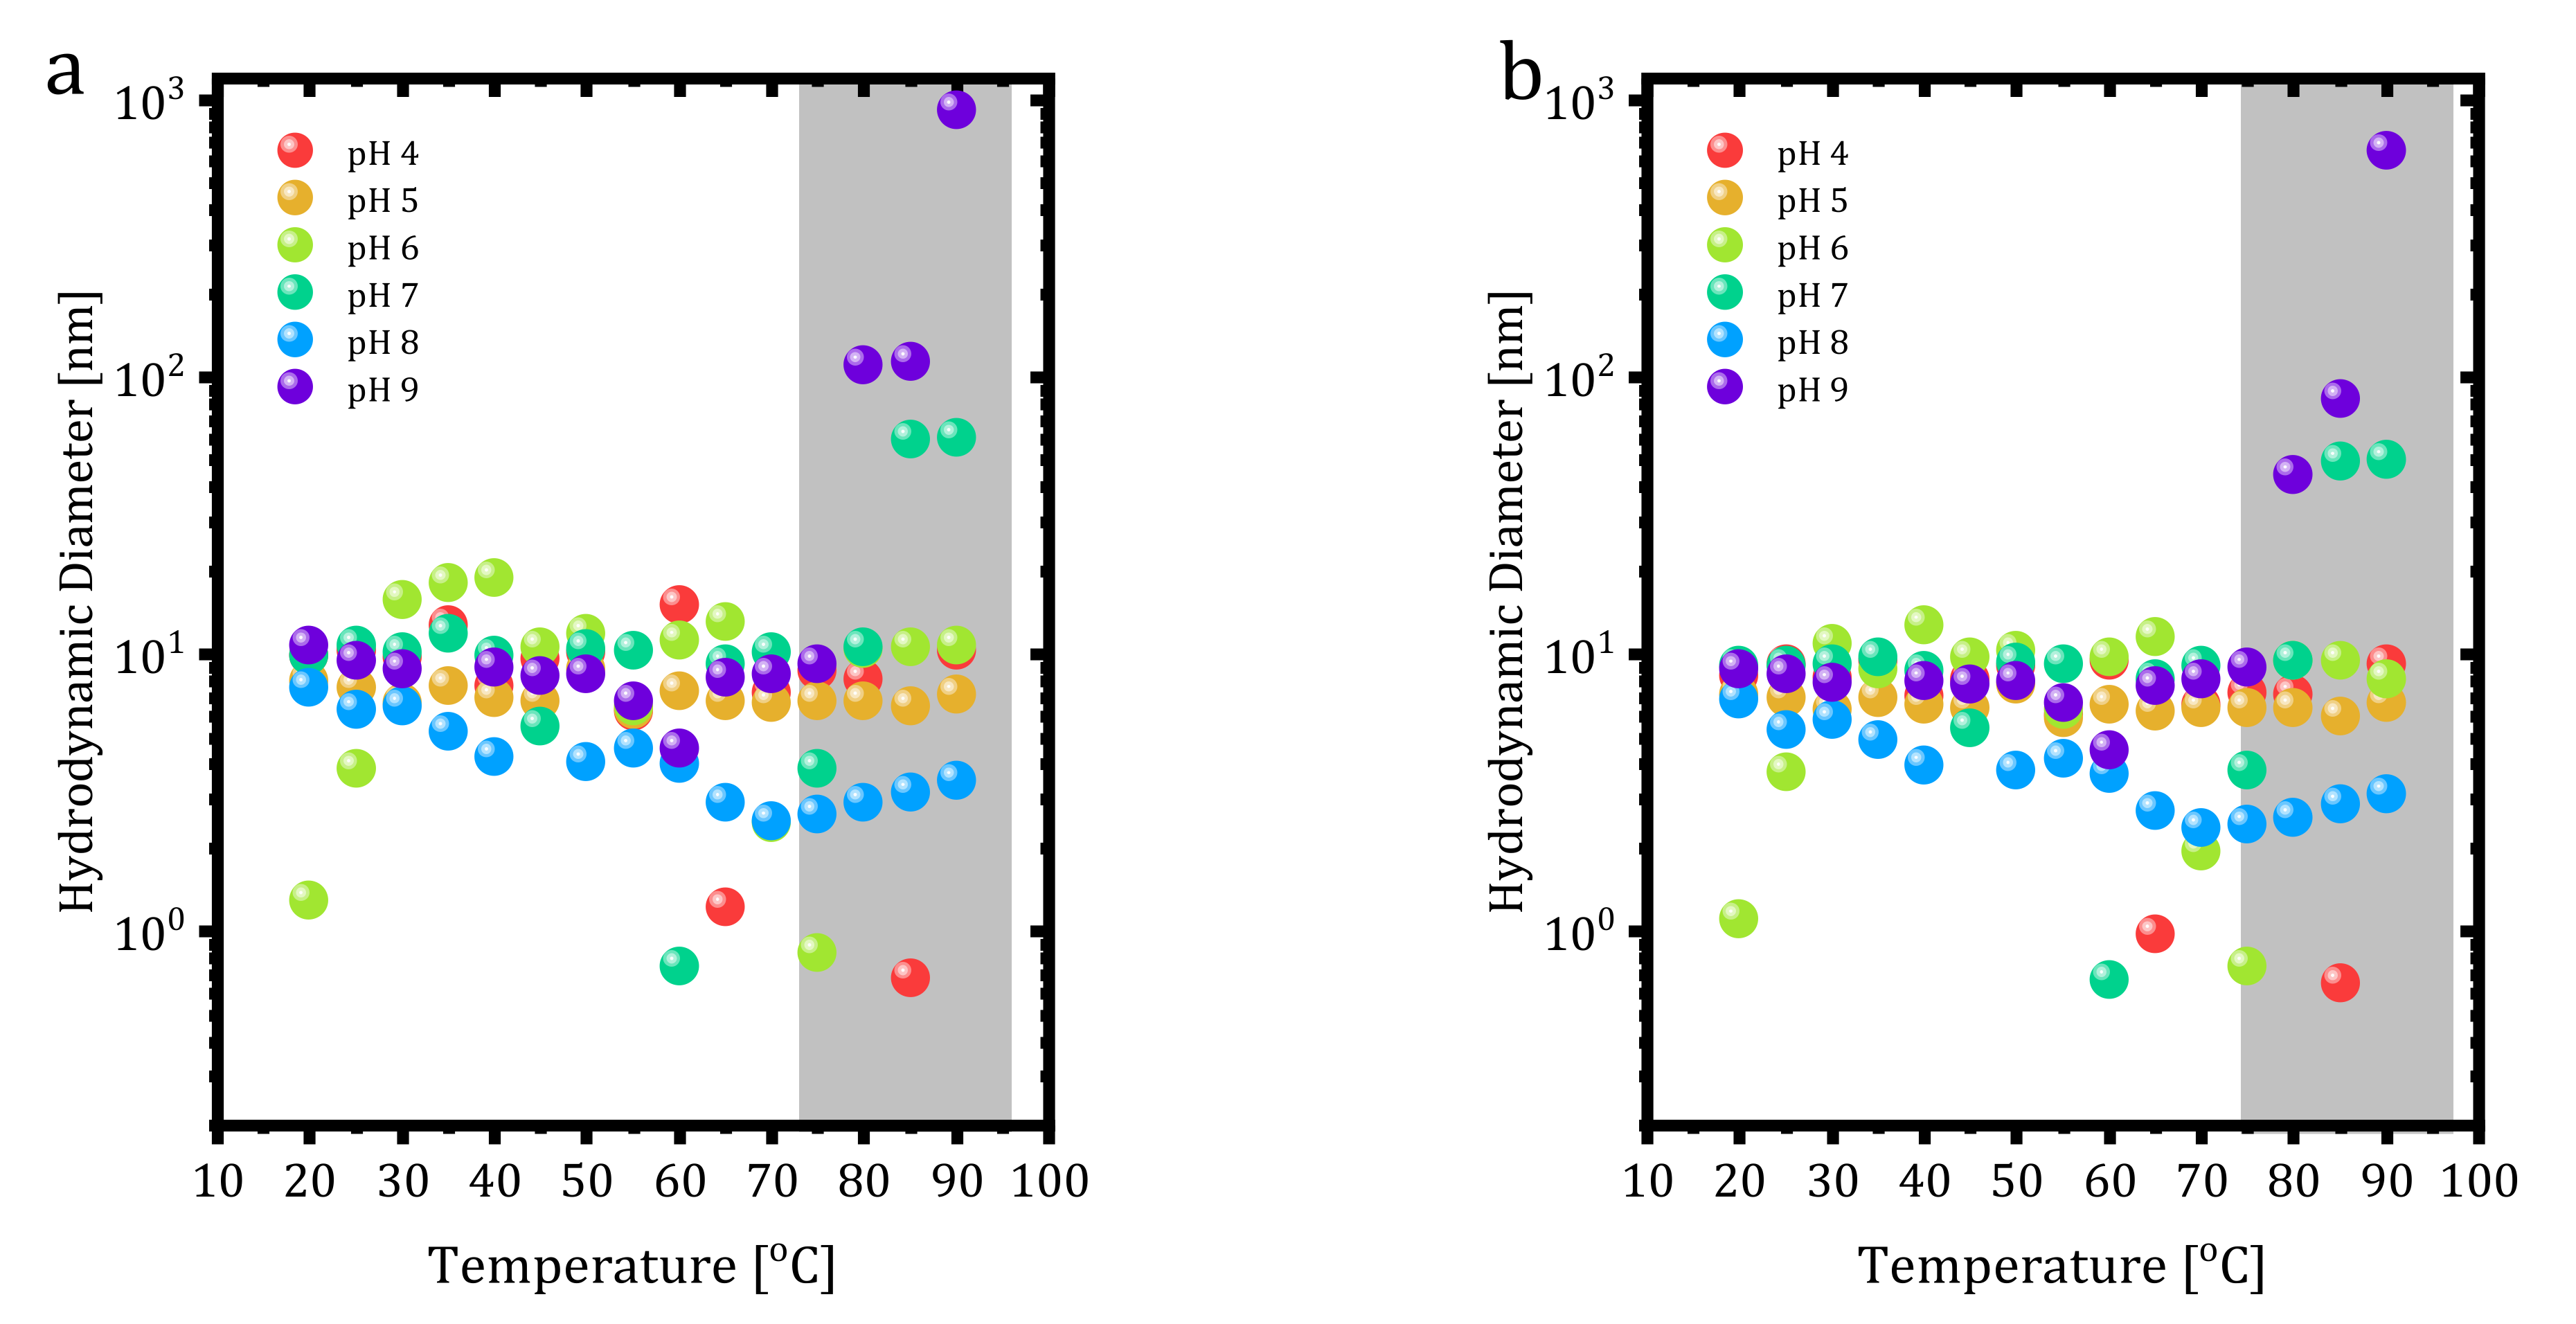
Figure 6 regarding the volume and number-based distribution of size versus pH values. Trastuzumab showed a thermally stable structure depending on volume and number-based distributions for each pH value.
The volume and number-based size measurements yielded aggregation points as 80 °C at pH 9 and 85 °C at pH 7. However, pH 5 did not show any aggregation, indicating the stability of trastuzumab at this pH. Additionally, at pH 8, hydrodynamic size dropped below 10 nm starting from 30 °C and slightly increased towards 10 nm after 70 °C. Interestingly, trastuzumab at some pH values showed 1 nm size at specific temperatures (60 °C for pH 7, 75 °C for pH 6, 65 °C, and 85 °C for pH 4) that could have resulted from the dissociation of some parts of the protein due to degradation.
As stated earlier, trastuzumab unfolding temperature was found as 75 °C, and from
Figure 6a,b, neither temperature nor pH showed any difference until 75 °C. After that point, the pattern of the measurement changed. All protein structures’ stability depends on their environment, including pH conditions. DLS measurement data in acidic solutions showed trastuzumab dissociation into smaller parts. In acidic solutions at pH 4, 6, and 7, protonation of trastuzumab occurred in the carboxyl groups. Protonation led to disruption of the stability profile of the whole trastuzumab molecule within the tertiary structure, meaning disulfide bonds since the breakage of bonds led to the dissociation of trastuzumab into smaller parts. From the volume and number-based measurements presented in
Figure 6, pH 4, 6, and 7 show the dissociation at different temperature values.


 ,
, 


