Article

Quality and In Vivo Assessment of a Fulvic Acid Complex: A Validation Study

1
Department of Pharmaceutics, School of Pharmaceutical Education & Research (SPER), Jamia Hamdard, New Delhi 110062, India
2
Department of Pharmaceutics, School of Pharmaceutical Sciences, Delhi Pharmaceutical Sciences and Research University, New Delhi 110017, India
3
Department of Pharmaceutics and Industrial Pharmacy, College of Pharmacy, Taif University, Taif 21944, Saudi Arabia
*
Authors to whom correspondence should be addressed.
Submission received: 9 April 2022 / Revised: 6 May 2022 / Accepted: 11 May 2022 / Published: 19 May 2022

Abstract

:
The present work aimed to re-assess the bioavailability enhancement potential of fulvic acid (FA). Carbamazepine (CBZ) and peat were used as a model drug and FA source, respectively. Our group has already evaluated the bioavailability enhancement potential of a less commercially viable source of FA, i.e., shilajit. In the present work, the phase solubility of CBZ was analyzed with varying concentrations of peat-sourced FA (2–12% w/v). The prepared complex (CBZ-FA) was characterized by X-ray diffraction (XRD), Fourier transform infrared spectroscopy (FTIR), and differential scanning calorimetry (DSC). Dissolution, pharmacokinetic, and pharmacodynamic studies were also carried out. The results showed the presence of an interaction between the drug and FA within the complex, which led to 98.99 ± 2.0% enhancement in drug solubility. The results also showed 79.23 ± 2.1% dissolution of the complexed drug over 60 min and 69.32 ± 2.2% permeation from the intestinal gut sac over 90 min, which led to a significant enhancement of bioavailability and a reduction in the duration of epileptic seizures. Thus, this study re-authenticates our earlier results and suggests switching the FA source (shilajit to peat) for commercial product development.

1. Introduction

The solubility of drugs plays an important role in designing a suitable drug delivery system. It is a known fact that the low solubility of a drug leads to low bioavailability, leading to poor performance of the drug delivery system. Carbamazepine (CBZ), an anti-epileptic drug, has variable bioavailability [1]. The drug is marred with poor aqueous solubility, leading to limited bioavailability and poor therapeutic outcomes [2]. Thus, unnecessarily high drug loading might be a significant reason for side effects that add to the patient’s noncompliance issues.
The complexation of drugs with hydrophilic molecules is a widely accepted method of solubility enhancement (e.g., Sporanox® capsule by Janssen Pharmaceutica) [3]. Additionally, there is a continuous dearth of suitable excipients for accentuating the formulation attributes. Synthetic excipients are highly acceptable but are sometimes not feasible to use owing to their high prices and other limitations [4]. Emerging natural substances such as humic acid (HA) and fulvic acid (FA) have been widely explored by researchers as pharmaceutical excipients [5]. FA is a low-molecular-weight compound that shows high permeability to cell membranes, and in conjunction with water, it becomes 100% absorbable to living cells [6]. These attributes not only serve to accentuate the aqueous solubility of poorly soluble drugs but also aid their permeability as well [7]. In most of the reported studies, FA was obtained from a shilajit source, which is a herbo-mineral rock source available in mountainous terrains, such as in the Himalayas [8]. It is one of the oldest known sources of FA in the Indian indigenous system of medicines and in folk systems. The percentage yield of FA from shilajit is very low, which is considered a hurdle to commercial product development since a continuous and cost-effective supply of raw materials is a major requirement [9]. Hence, relying on only shilajit as a source for FA-based pharmaceutical products is a wise choice [10]. As an alternative natural source of FA, peat appears to be the most suitable, as it is abundantly available. Peat is a naturally occurring organic soil formed by a process of incomplete fragmentation and humification of marsh plants [11]. Peat consists of 40% organic matter, namely, polysaccharides, pectins, cellulose, and humic substances [12].
Peat has also been exploited as a prominent source of FA for uses other than pharmaceutical excipients. In peat, FA is abundantly present and formed by the natural decaying process of plant materials [13]. The current work revolves around the exploration of peat-sourced FA as a cheaper raw material and the re-authentication of existing results obtained with shilajit-sourced FA [14]. Hence, this work is an attempt to explore a cheaper raw material in the form of FA to pave the way for its application in the pharmaceutical industry [15]. The newly sourced FA is of comparable quality with better purity and is expected to yield better complexing properties with suitable formulation outcomes. A previous study was carried out by our group to evaluate the use of peat-sourced FA using Ketoconazole as a model drug and showed promising results [16]. In this study, CBZ was used as another model of a drug. Peat-sourced FA was complexed with CBZ, and the complex was evaluated.

2. Materials and Methods

Peat-sourced FA and CBZ were obtained ex gratis from NZ Fulvic Ltd. (Mount Maunganui, New Zealand) and Jubilant life sciences (Noida, India), respectively. Methanol and acetonitrile were purchased from Merck (Kenilworth, NJ, USA). All other chemicals and reagents used in the study were AR grade.

2.1. Phase Solubility Study

The procedure was carried out according to a reported method [17]. Phase solubility studies were carried out by placing an excess amount of CBZ in FA solutions of varying strengths ranging from 2–12% w/v, kept in stoppered glass vials. The suspensions were maintained at room temperature (25 ± 2 °C) and kept on a biological shaker. After 48 h, the suspensions were then passed through a 0.45 µm membrane filter, and the filtrates were suitably diluted and analyzed for CBZ content using UV/Vis spectroscopy at 286 nm [18].

2.2. Preparation of Complex

Phase solubility is a preliminary step in determining the concentration of FA that is most suitable for preparing the complex. The optimum ratio was selected, and the CBZ-FA complex was prepared in a ratio of 1:2. First, the FA solution was prepared by dissolving FA in water using a magnetic stirrer at a speed of 200 rpm. The required quantity of CBZ was then added to prepared FA solution and left for 48 h. The sample was then frozen overnight and lyophilized using 2% w/v sucrose as a cryoprotectant. The obtained mass was powdered using a glass mortar–pestle and passed through 100-mesh sieve [14,19,20].

2.3. High-Performance Liquid Chromatography (HPLC) Analysis of CBZ

The analysis was carried out according to a reported method [21] using RP-HPLC C-18 silica column (Waters, 5-micron, 250 × 4.0 mm).
Aqueous media: A mixture of methanol and water (50:50) was used as the mobile phase. The injection volume, run time, and retention time were 20 µL, 10 min, and 5.96 min, respectively. The wavelength was set at 285.5 nm. The linearity was found in the range of 0.39–50 µg/mL with an R2 value of 0.998.
Plasma: The first step in plasma analysis is the extraction of CBZ from plasma using the liquid–liquid extraction method [22]. The plasma samples were collected and spiked with drug solutions of different concentrations, 0.5–15 µg. The sample was then vortexed for 15 min, followed by the addition of ethyl acetate in a ratio of 1:4, and vortexed again for 10 min. Next, the sample was centrifuged, and the organic layer in the Eppendorf tube was collected and evaporated to dryness under nitrogen gas. The obtained dry residue was dissolved in acetonitrile and analyzed using HPLC. The mobile phase used was a mixture of methanol and water in a ratio of 70:30 with a flow rate of 1 mL/min. The wavelength and run time were 285.5 nm and 10 min, respectively. The retention time was 3.34 min, and the linearity was in the range of 0.1–15 µg/mL with R2 = 0.993.

2.4. Determination of Aqueous Solubility of Solid Complex

The aqueous solubility was determined by placing an excess amount of CBZ-FA complex in 10 mL of distilled water and stirring the solution for 3 d at 150 rpm and 25 ± 2 °C in a mechanical shaker (Grower enterprises, New Delhi, India). The suspensions were then filtered through a 0.22 µ filter, diluted, and analyzed by HPLC.
The solid complex was characterized using the following approaches.

2.5. Differential Scanning Calorimetry (DSC)

CBZ, FA, and complex samples (about 5 mg) were placed and sealed in the DSC pan. A differential scanning calorimeter was used to scan the samples between 20 and 350 °C at a heating rate of 10 °C/min in a nitrogen atmosphere (PerkinElmer Pyris 6 DSC, Waltham, MA, USA).

2.6. Fourier Transform Infrared Spectroscopy (FTIR)

FTIR spectroscopy of the drug, FA, and complex was investigated using the potassium bromide (KBr) pellet process. A properly weighed amount of the sample (5 mg) was mixed with KBr (1:1) and then compressed into a pellet using a hydraulic press. The characteristic spectra were recorded by scanning the pellet between 4500 and 500 cm1.

2.7. X-ray Diffraction (XRD)

The X-ray diffraction of CBZ, FA, and complex was investigated using an X-ray diffractometer (PW 1830, Phillips, Tokyo, Japan). To reduce orientation effects, the samples (1000 mg) were rotated during data collection. At 35 kV and 30 mA, an XRD pattern was recorded in the range from 2θ = 10 to 70.

2.8. Drug Release Study

For the drug release study, pure CBZ suspension and drug complex equivalent to 5 mg were put in a dialysis bag with a cut-off of 12,000–14,000 Da (Spectra-Por dialysis bag, Sigma Aldrich, St. Louis, MI, USA( Michigan mild western united states) [23]. The bag was then immersed in a dissolution apparatus (USP type II, Hanson Research SRS, Princeton, NJ, USA) containing 900 mL of simulated gastric fluid of pH 1.2 and set at 75 rpm for 60 min at a temperature of 37 ± 2 °C. Aliquots of samples were removed from the dissolution chamber at pre-determined time intervals and analyzed by HPLC. The release kinetics for both complex and pure drugs were calculated for various models [24].

2.9. Animals

Healthy male albino Wistar rats weighing 180–200 g were selected for the study. Approval for the study was obtained from Animal Ethics Committee, Jamia Hamdard vide protocol no. 1426. The animals were caged in plastic animal cages at 25 ± 2 °C and exposed to a 12 h light/dark cycle. The rats were provided water ad libitum and fed a standard rat chow diet.

2.9.1. Ex Vivo Everted Intestinal Sac Permeation Study

For the intestinal sac permeation study, the first step was the isolation of excised gut sac. The rats were anesthetized using CO2 gas. Their abdomen was then incised at the midline, and a segment of the small intestine was cut and removed. It was then inverted, washed with saline solution, and filled with modified Tyrode solution. The intestinal sac was then placed in a bath containing 100 mL of dissolution medium (modified Tyrode solution) and bubbled with 95% O2 and 5% CO2 at 37 ± 2 °C to maintain simulated conditions. After 2 h, 2 mL of complex solution and pure drug suspension were added to separate intestinal sacs, and the assembly was placed on a magnetic stirrer at 60 rpm. A 1 mL sample was withdrawn from the dissolution medium at different time intervals: 0, 15, 30, 45, 60, 75, and 90 min. The solution was filtered through a 0.45 µm membrane filter and analyzed by HPLC. The cumulative drug permeated vs. time was plotted, and the flux and apparent permeability coefficient values were calculated [25].

2.9.2. Pharmacokinetic Study

The animals fasted overnight before the study. The rats were divided into three groups and dosed accordingly for 7 days:
  • Group I received pure CBZ at a dose of 80 mg/kg p.o.
  • Group II received CBZ-FA complex at a dose equivalent to 80 mg/kg p.o.
  • Group III received normal saline, p.o.
A blood sample was collected from the retro-orbital sinus in EDTA tubes at 0, 1, 2, 3, 4, 6, and 8 h after the last dosing. The plasma was obtained by centrifuging the samples at 2500 rpm for 10 min, and the supernatant was collected [6]. The drug was extracted from plasma as previously explained and analyzed by HPLC for CBZ content.

2.9.3. Pharmacodynamic Study/MES (Maximal Electroshock)-Induced Convulsion

After the pharmacokinetic study, the same set of animals was used for the pharmacodynamic study. The animals were dosed similarly to the pharmacokinetic protocol, 30 min before the induction of MES. A strain was applied using an electro-convulsiometer (Techno India, Lucknow, India) using the following conditions: 150 mA, 0.2 s, and average voltage 200–250 V. The incidence and duration of seizures (tonic-clonic convulsions) were recorded [19].

3. Results

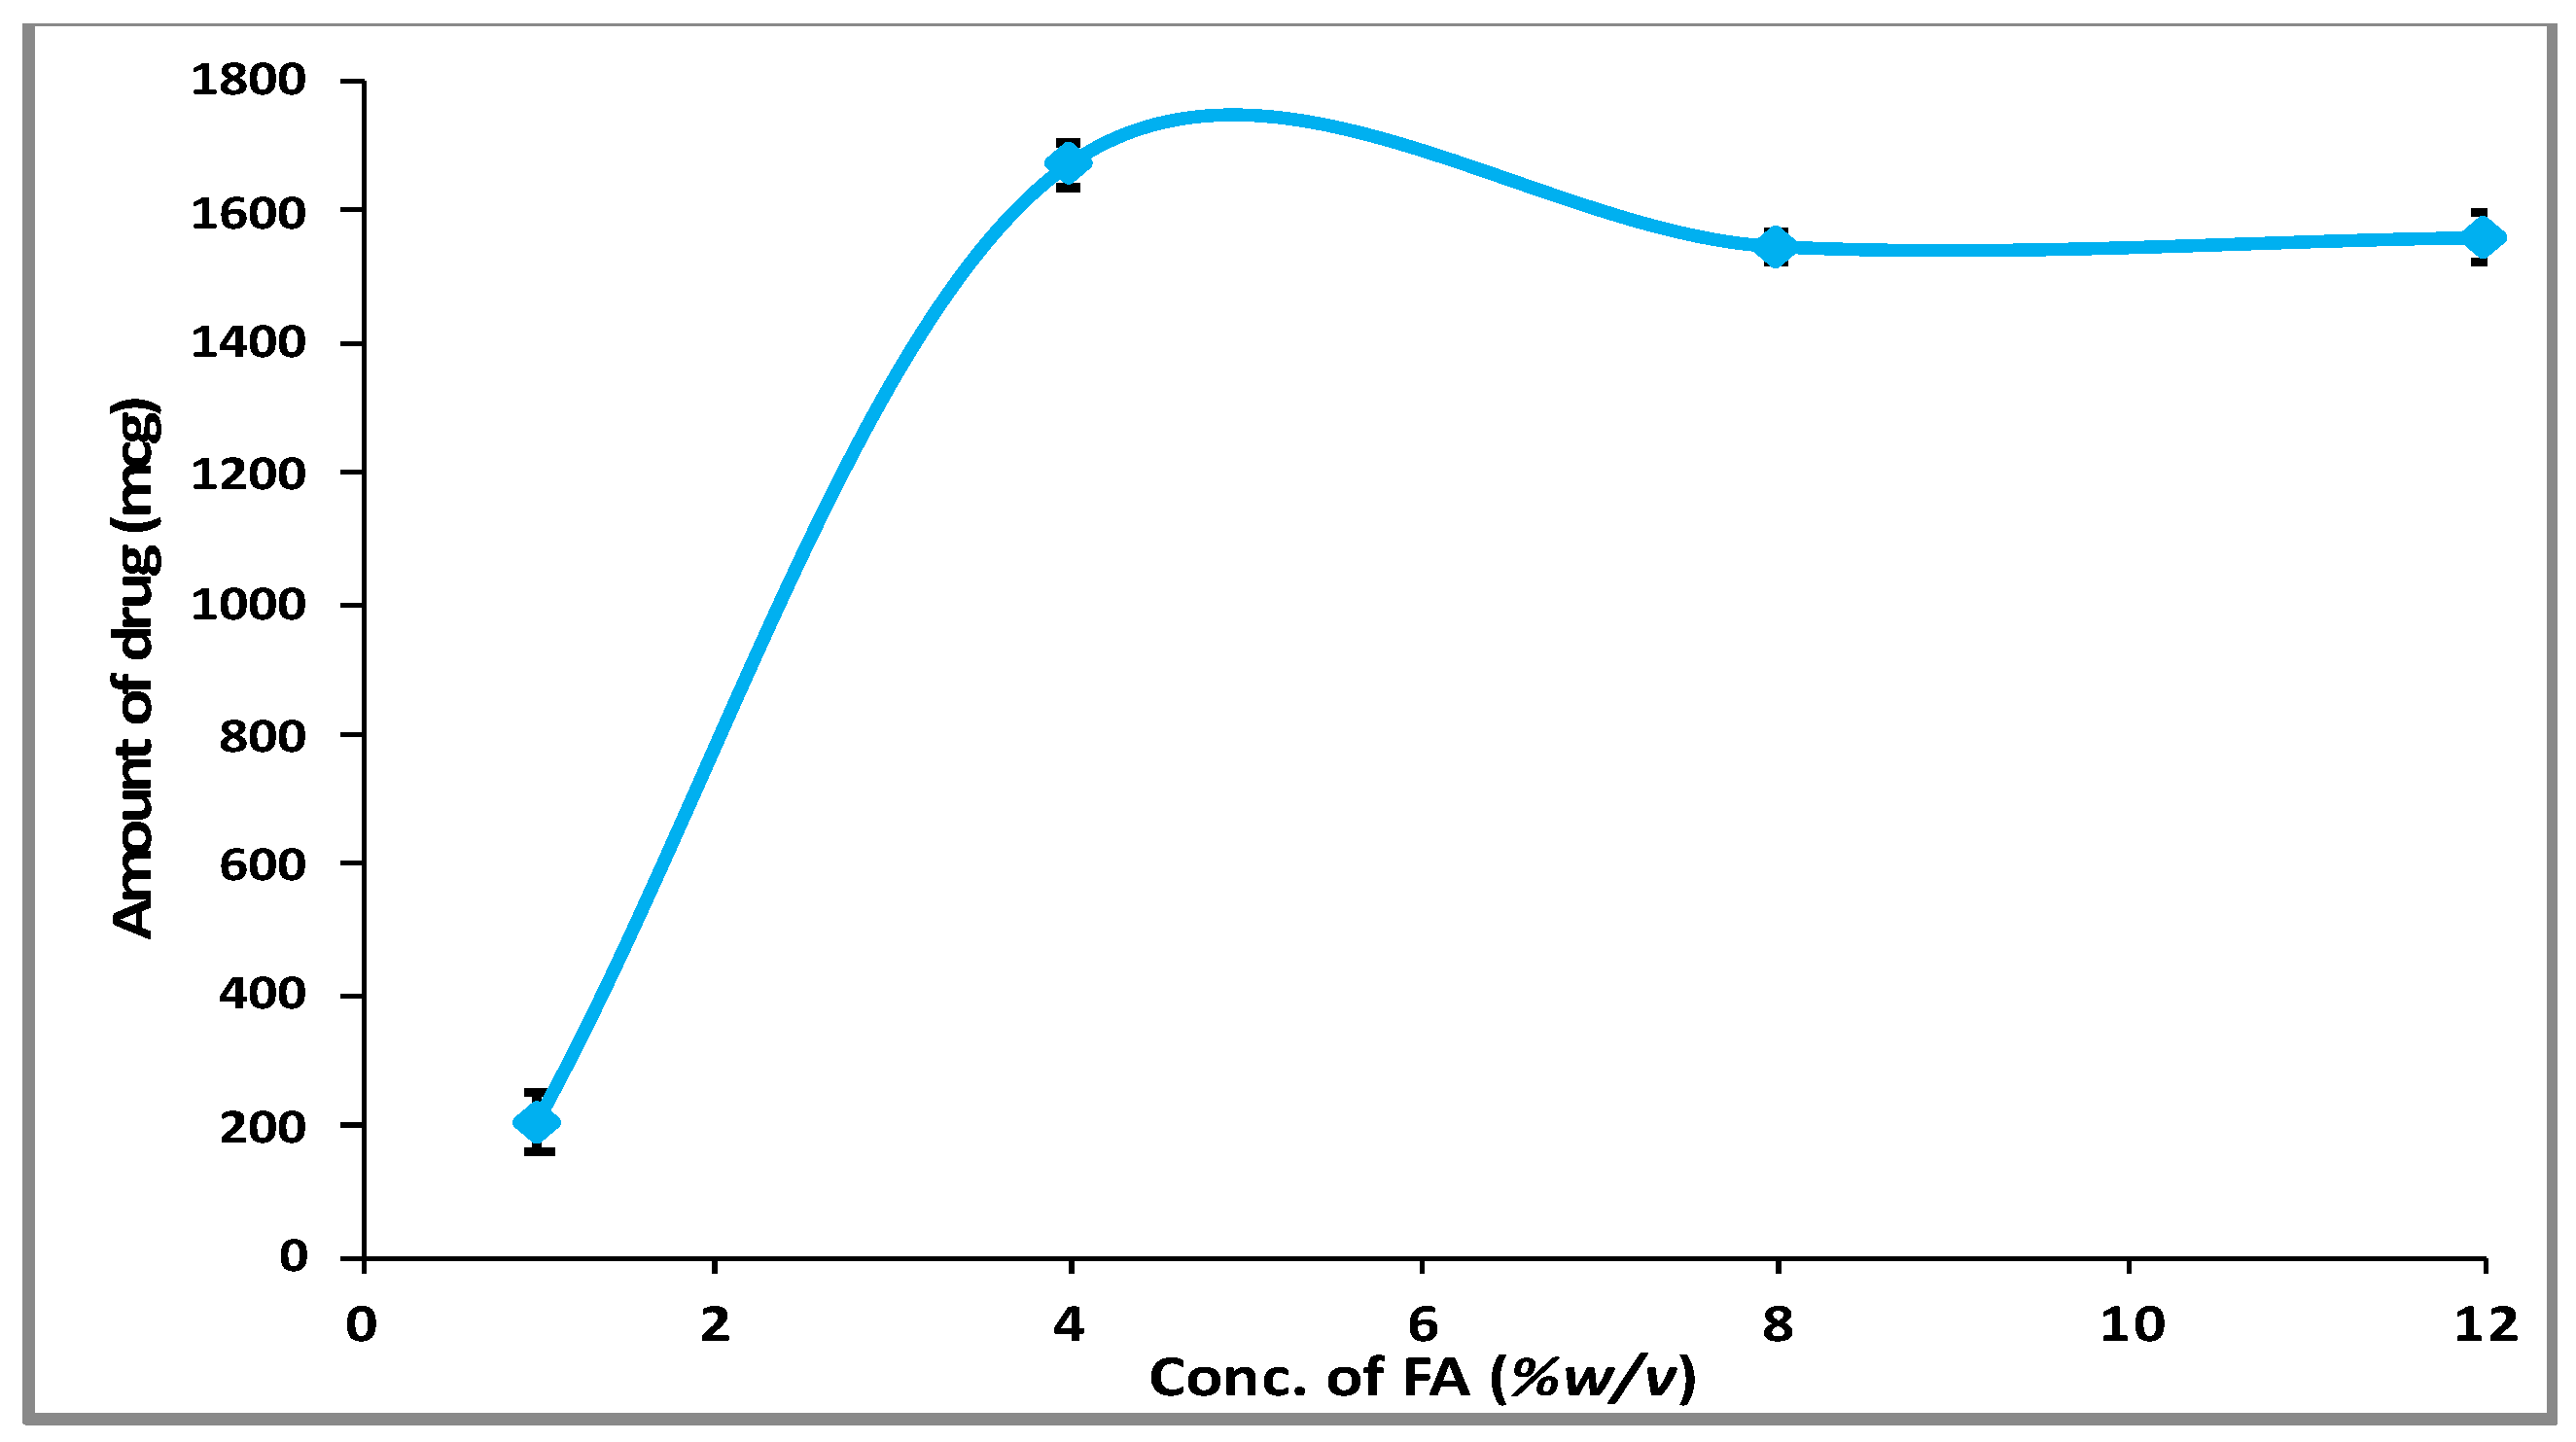
3.1. Phase Solubility Behavior

The results of phase solubility studies are shown in Figure 1. It can be clearly seen that the solubility increased with an increase (up to 4%) in the concentration of FA. Beyond 4%, an insignificant increase in solubility was observed. A plateau can be seen in the graph up to the highest tested FA concentration (12%). Since the maximum solubility was observed using 4% FA, this concentration was selected to prepare the complex for the following studies.

3.2. Characterization of the Complex

The CBZ-FA complex was characterized by the following techniques:

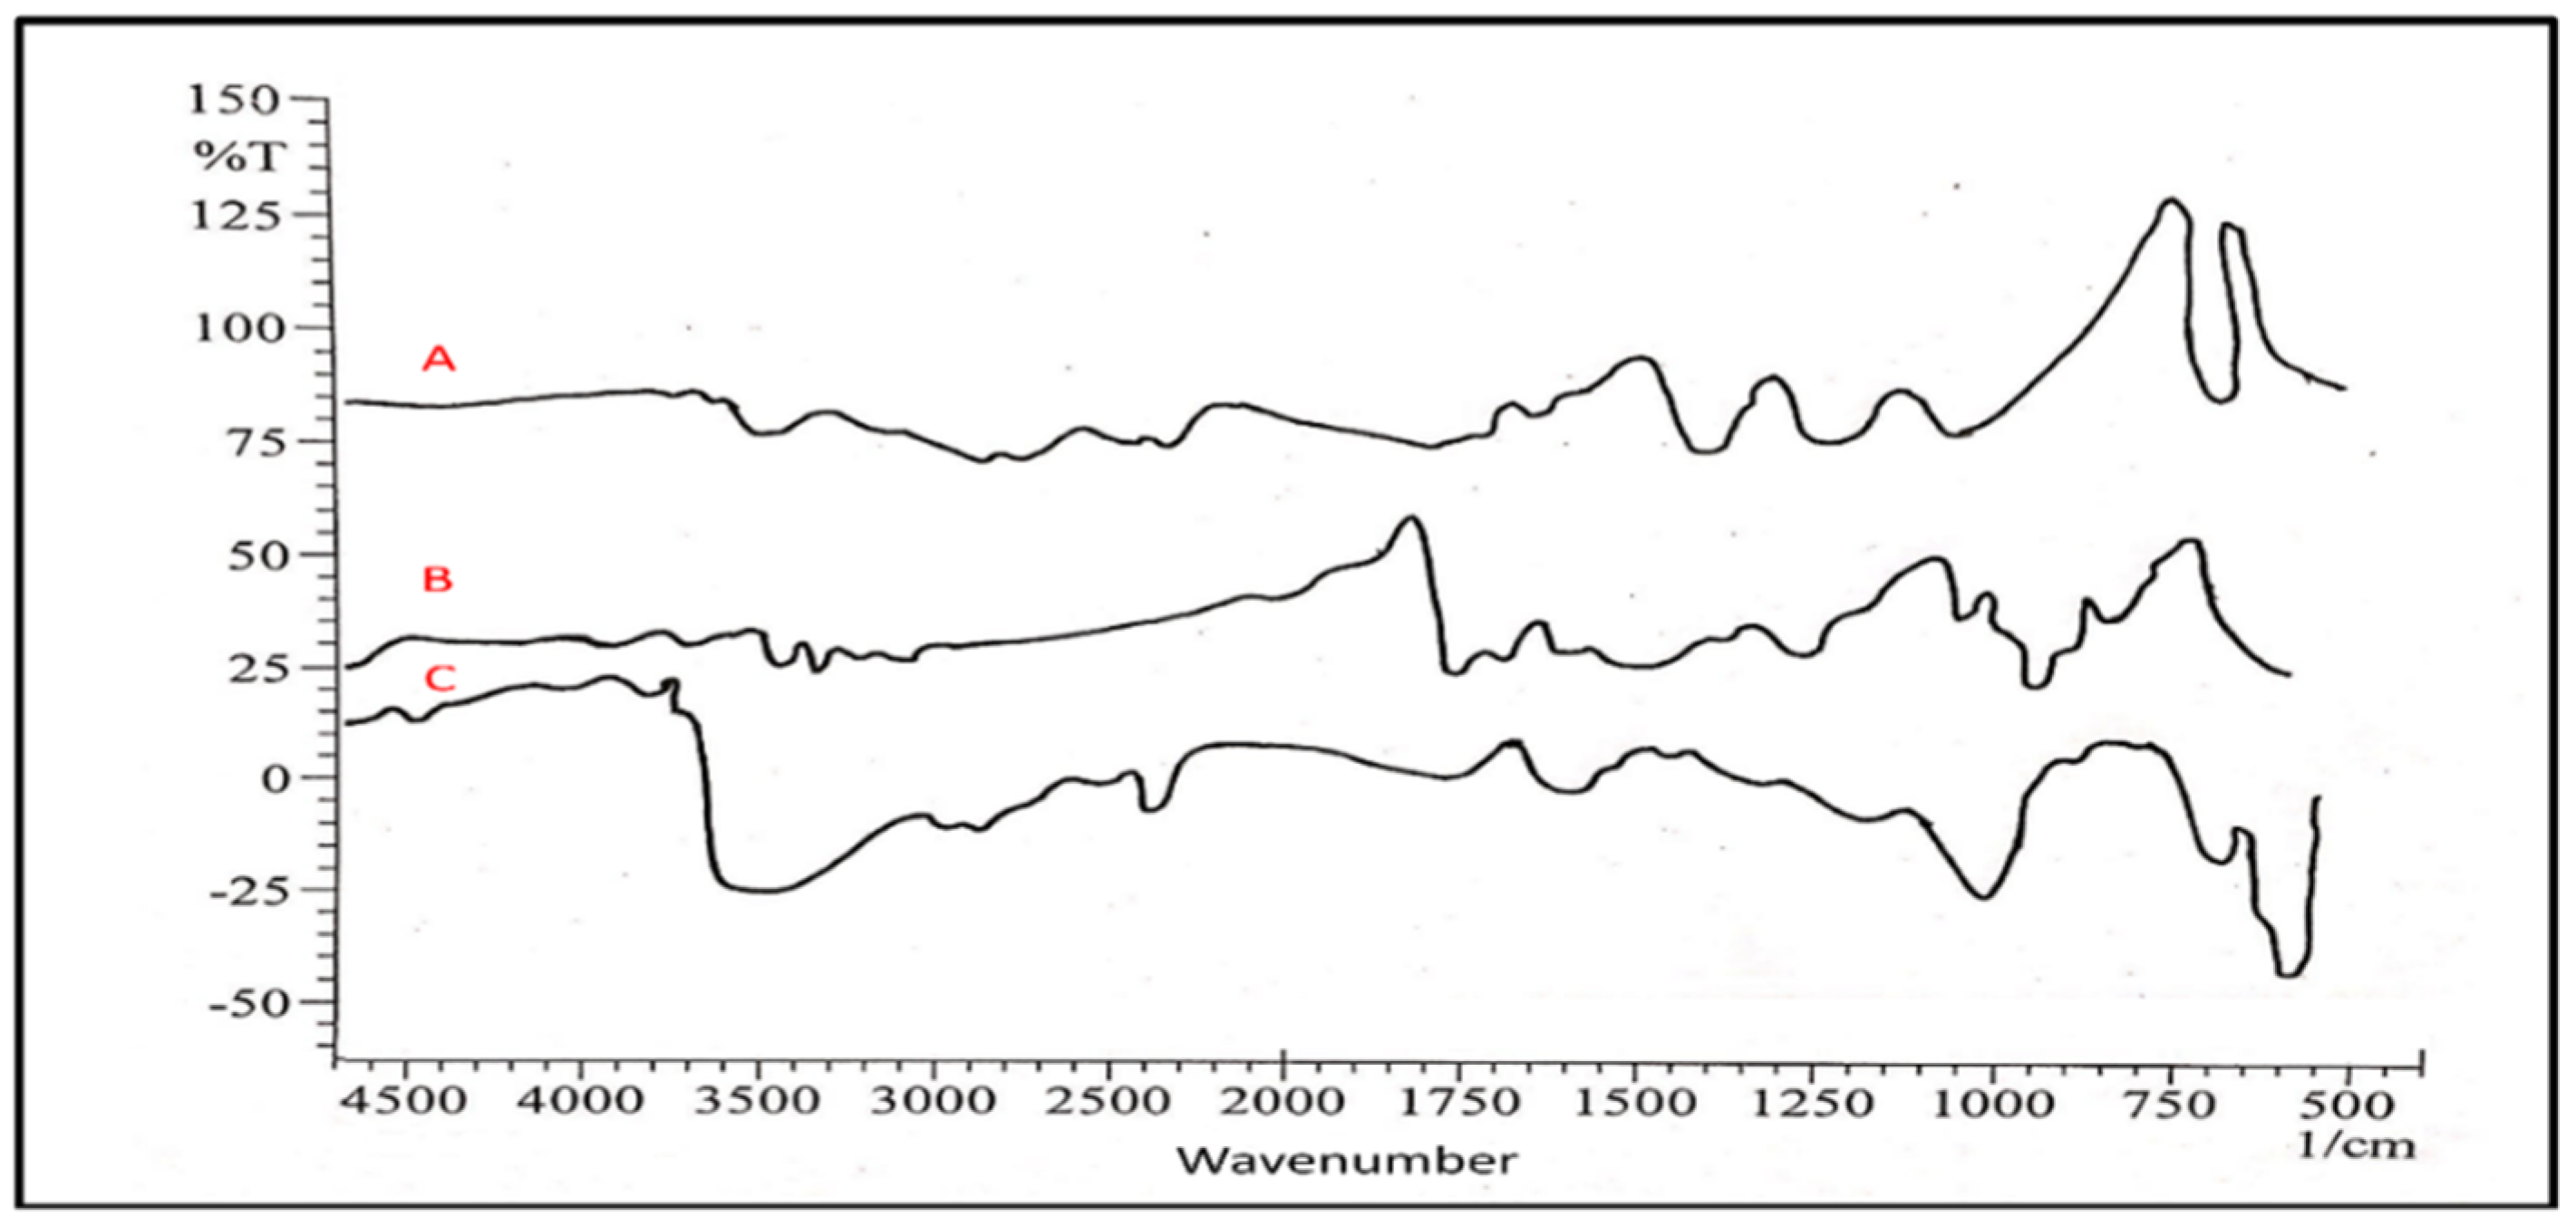
3.2.1. Fourier Transform Infrared Spectroscopy (FTIR)

The FTIR spectra of pure CBZ are shown in Figure 2, which display characteristic peaks at 1593 cm−1 (C=C, C=O aromatic stretching), 1681 cm−1 (0=C-NH2), and 3456 cm−1 (NH stretching). Pure FA displayed major absorption bands in the regions of 1708 cm−1 (C=O stretching, carboxylic acid), 2854 cm−1, 2972 cm−1 (CH- stretching, aliphatic), 3612 cm−1 (aromatic OH stretching), 1303 cm−1 (C–O stretching), and 1099 cm−1 (C–O stretching of polysaccharide). The FTIR spectra exhibited by the complex showed a downward shift in most of the peaks, with O-H stretching at 3417 cm−1, C-H at 2866.22 cm−1, COOH at 1687.71 cm−1, C=C stretching at 1510.26 cm−1, and C-O stretching at 1066–1354 cm−1. Bands for aromatic stretching and –NH stretching were observed at 1687 cm−1 and 3462 cm−1, respectively.

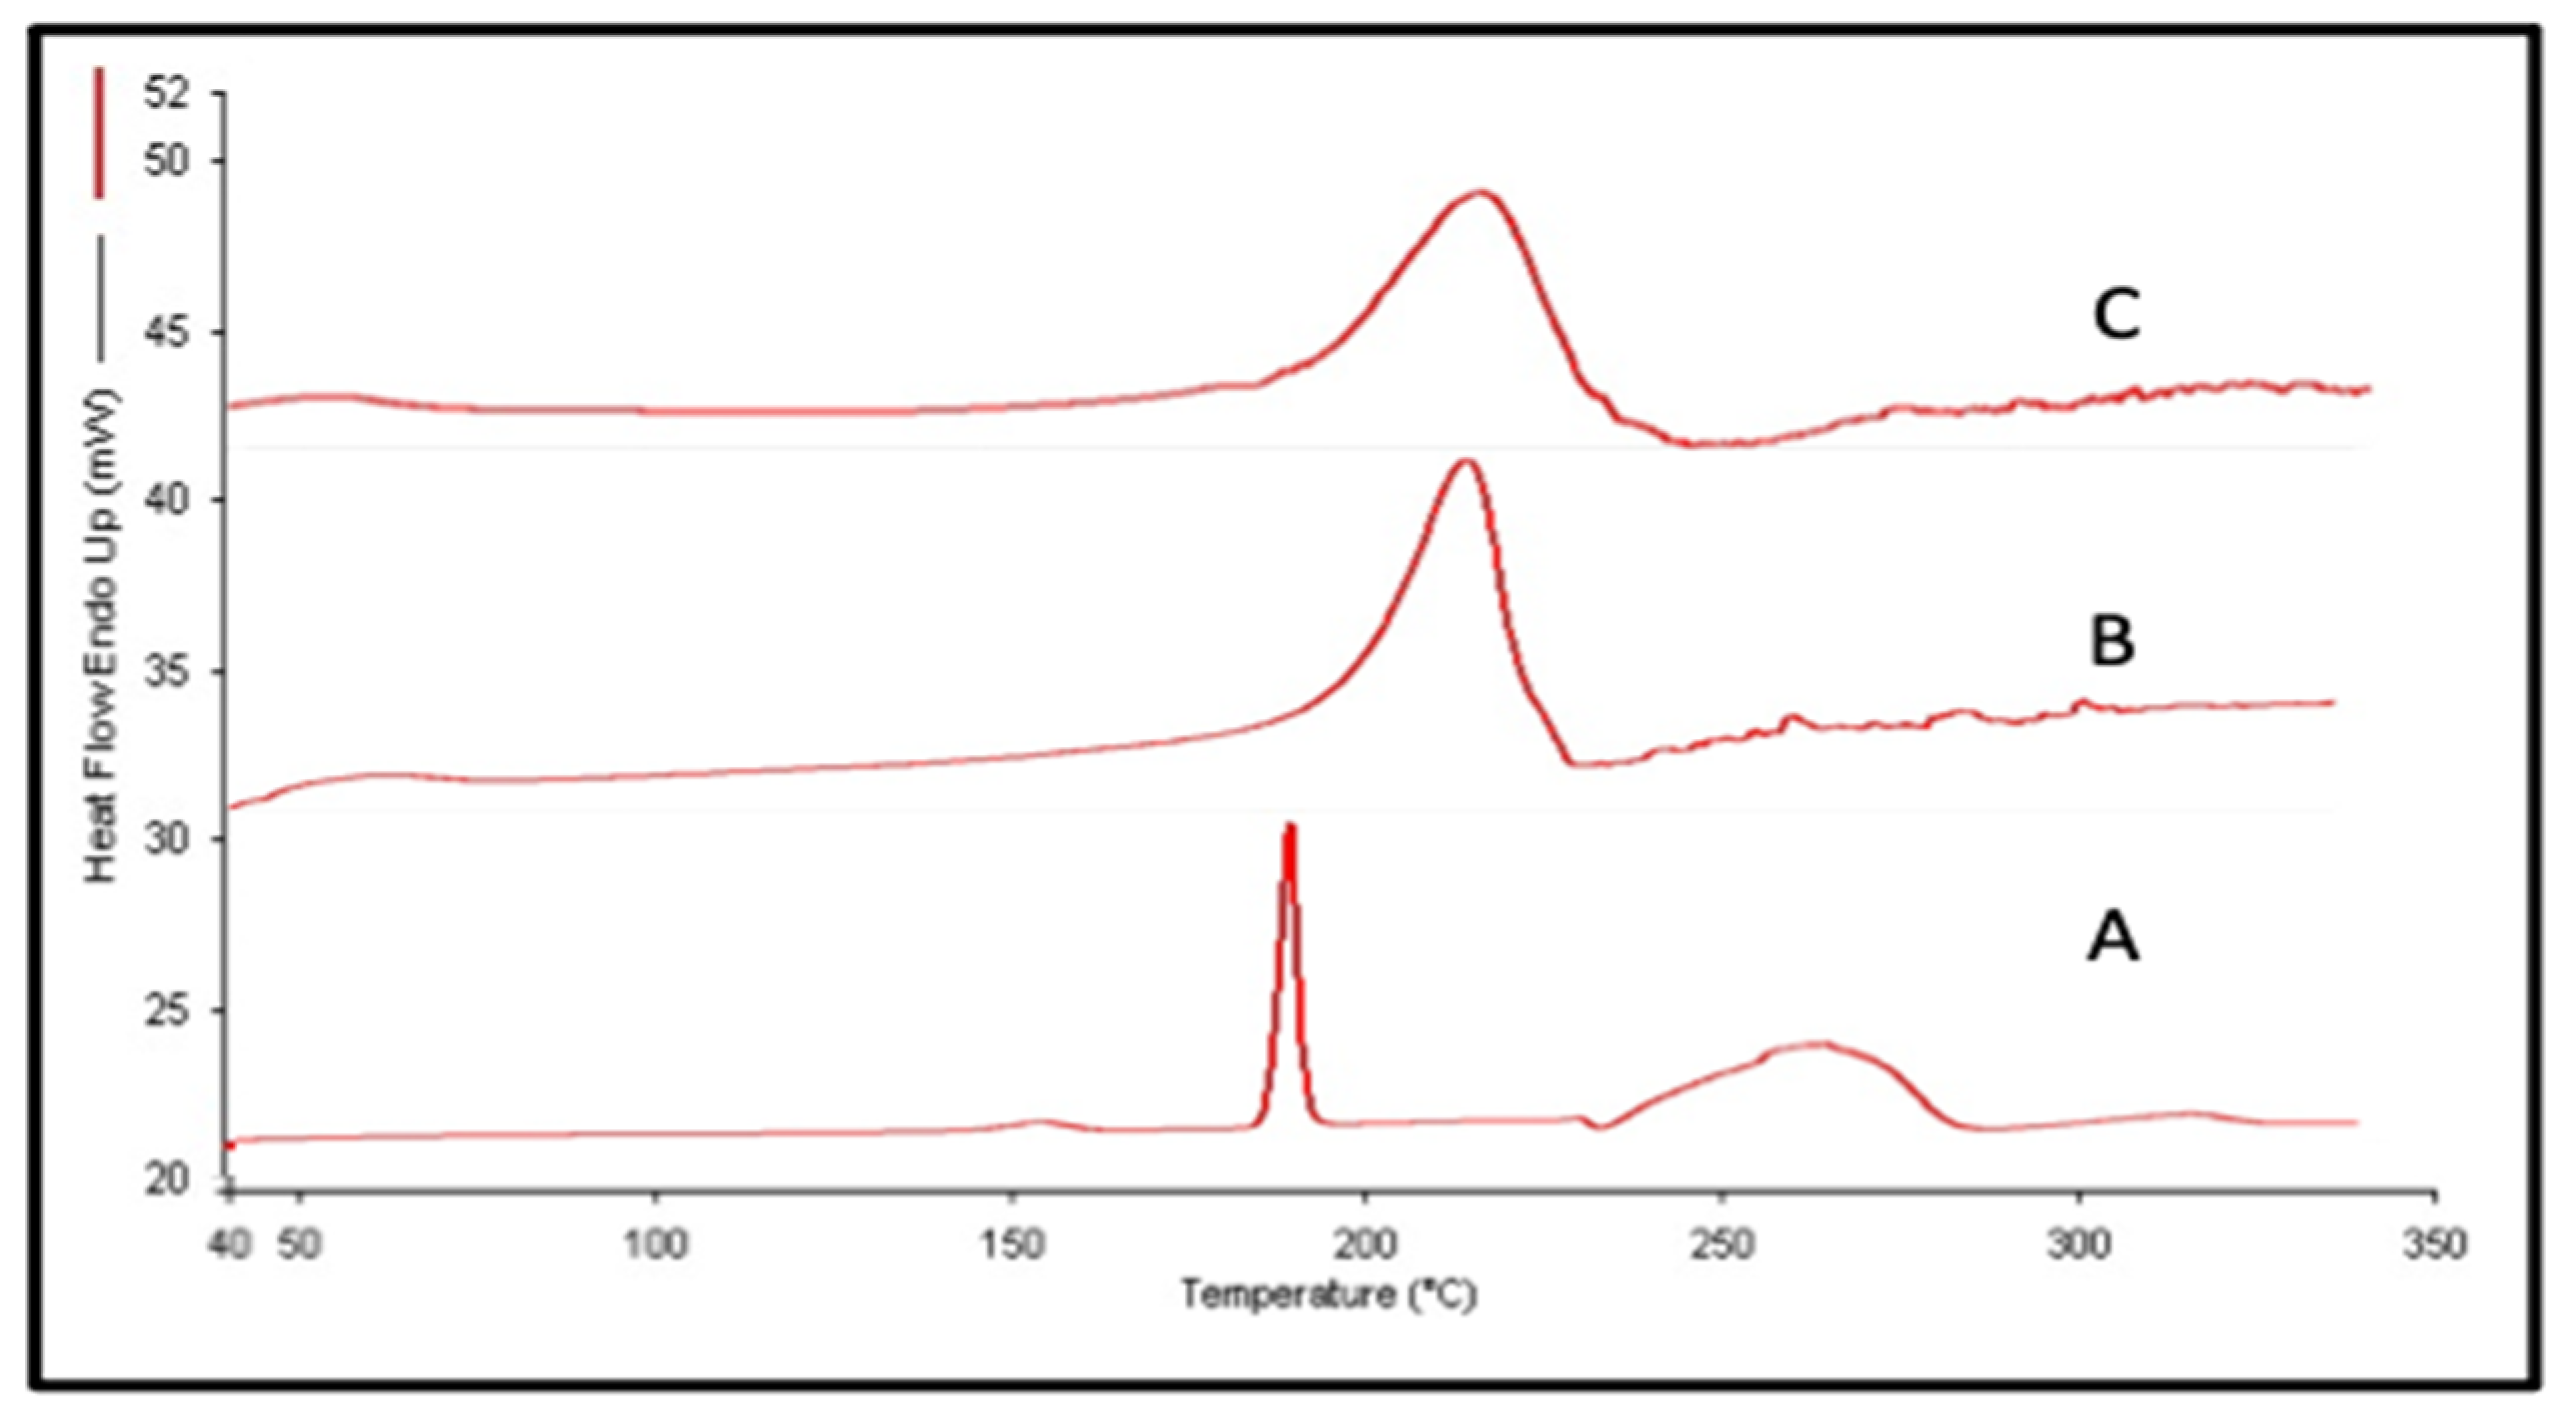
3.2.2. Differential Scanning Colorimetry (DSC)

A single sharp exothermic peak at 193.221 °C was prominent in the DSC spectra of CBZ, which suggests extreme crystallinity of the samples (Figure 3). The peak of FA was also exothermic and observed at 223.257 °C. When the peaks of both components were compared with those of the CBZ-FA complex, it was found that only a single small broad peak at 222.326 °C was present, almost corresponding to the peak of FA [26]. Additionally, the CBZ peak was absent in the thermogram, which may indicate a loss of crystallinity due to the physical interaction between the two components. A substantial increase in the melting point of CBZ in the complex can be correlated to the less ordered structure. The enthalpy value of the developed complex was found to be 2554.73 j/g, which lay between the values of FA and CBZ, 3567.080 j/g and 570.843 j/g, respectively.

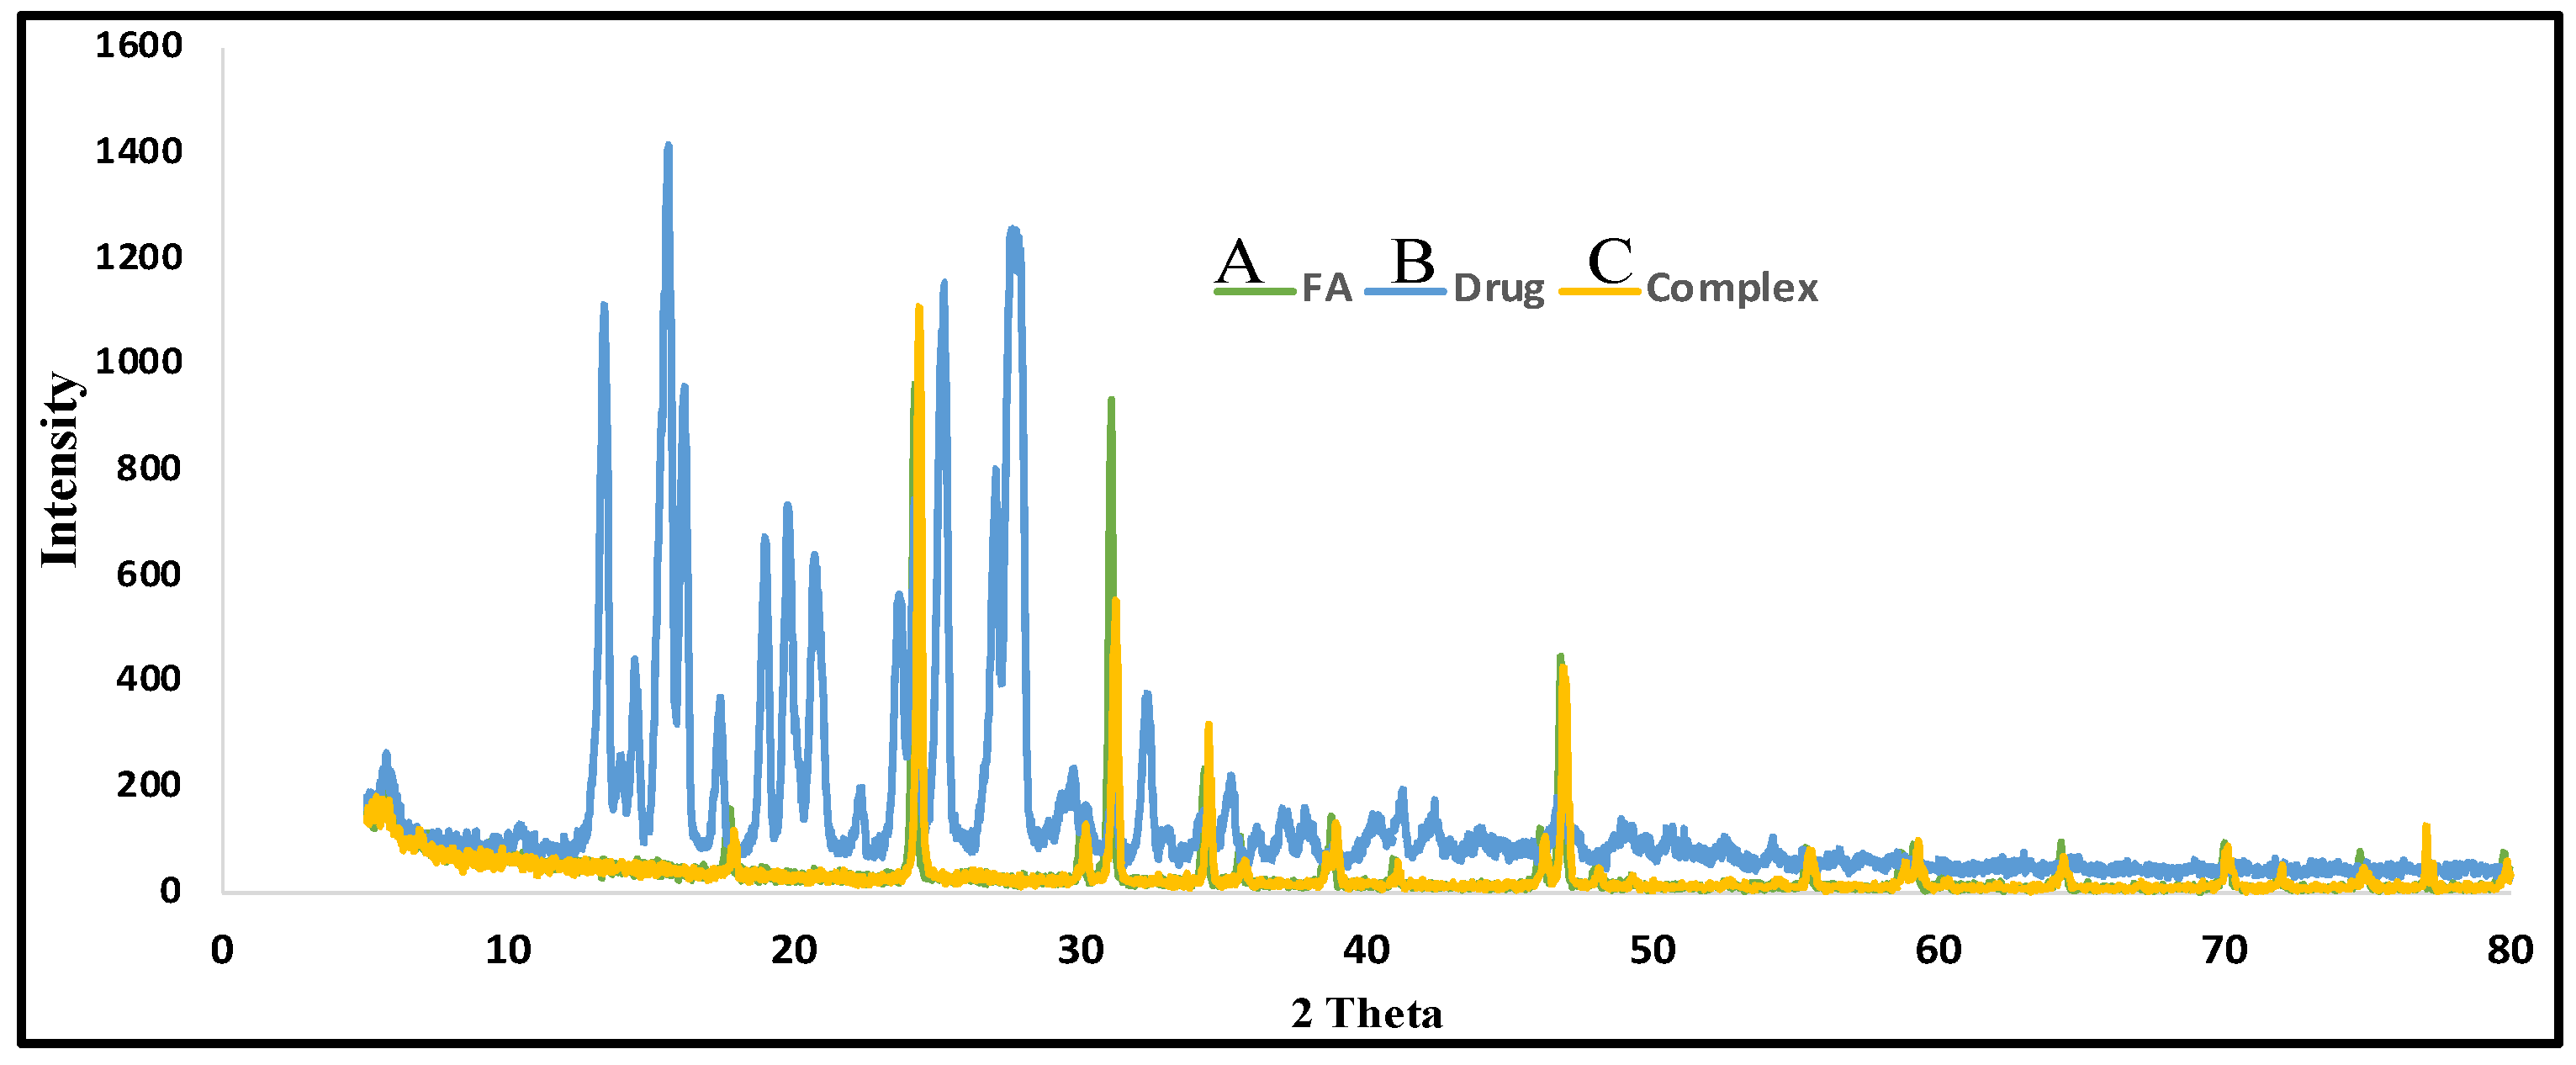
3.2.3. X-ray Diffraction (XRD)

The XRD spectra of the pure CBZ exhibited numerous closely packed sharp peaks in a 2ϴ range of 14°–35°; more specifically, peaks with high intensity were at 13°, 15°, 19°, 24°, and 27°, which indicates a crystalline nature (Figure 4). The spectra of the complex, when compared to CBZ, revealed only a few peaks of lower intensity [27]. Sharp peaks that were obvious in the pure CBZ thermogram were almost absent in the complex, which may indicate the loss of crystallinity after interaction with FA. An interesting observation was the presence of sharp and high-intensity peaks in FA spectra. These peaks were also prominent in the CBZ complex thermogram. The XRD spectra of shilajit-derived FA from earlier reports did not show any crystalline pattern. The most probable explanation is the presence of minerals, as seen in the certificate of analysis (CoA).

3.2.4. Determination of Saturation Aqueous Solubility of Solid Complex

The saturation solubility of CBZ at 25 ± 2 °C was found to be 148.08 µg/mL, which increased to 294.65 µg/mL upon complexation with FA, demonstrating a 98.99 ± 2.0% increase.

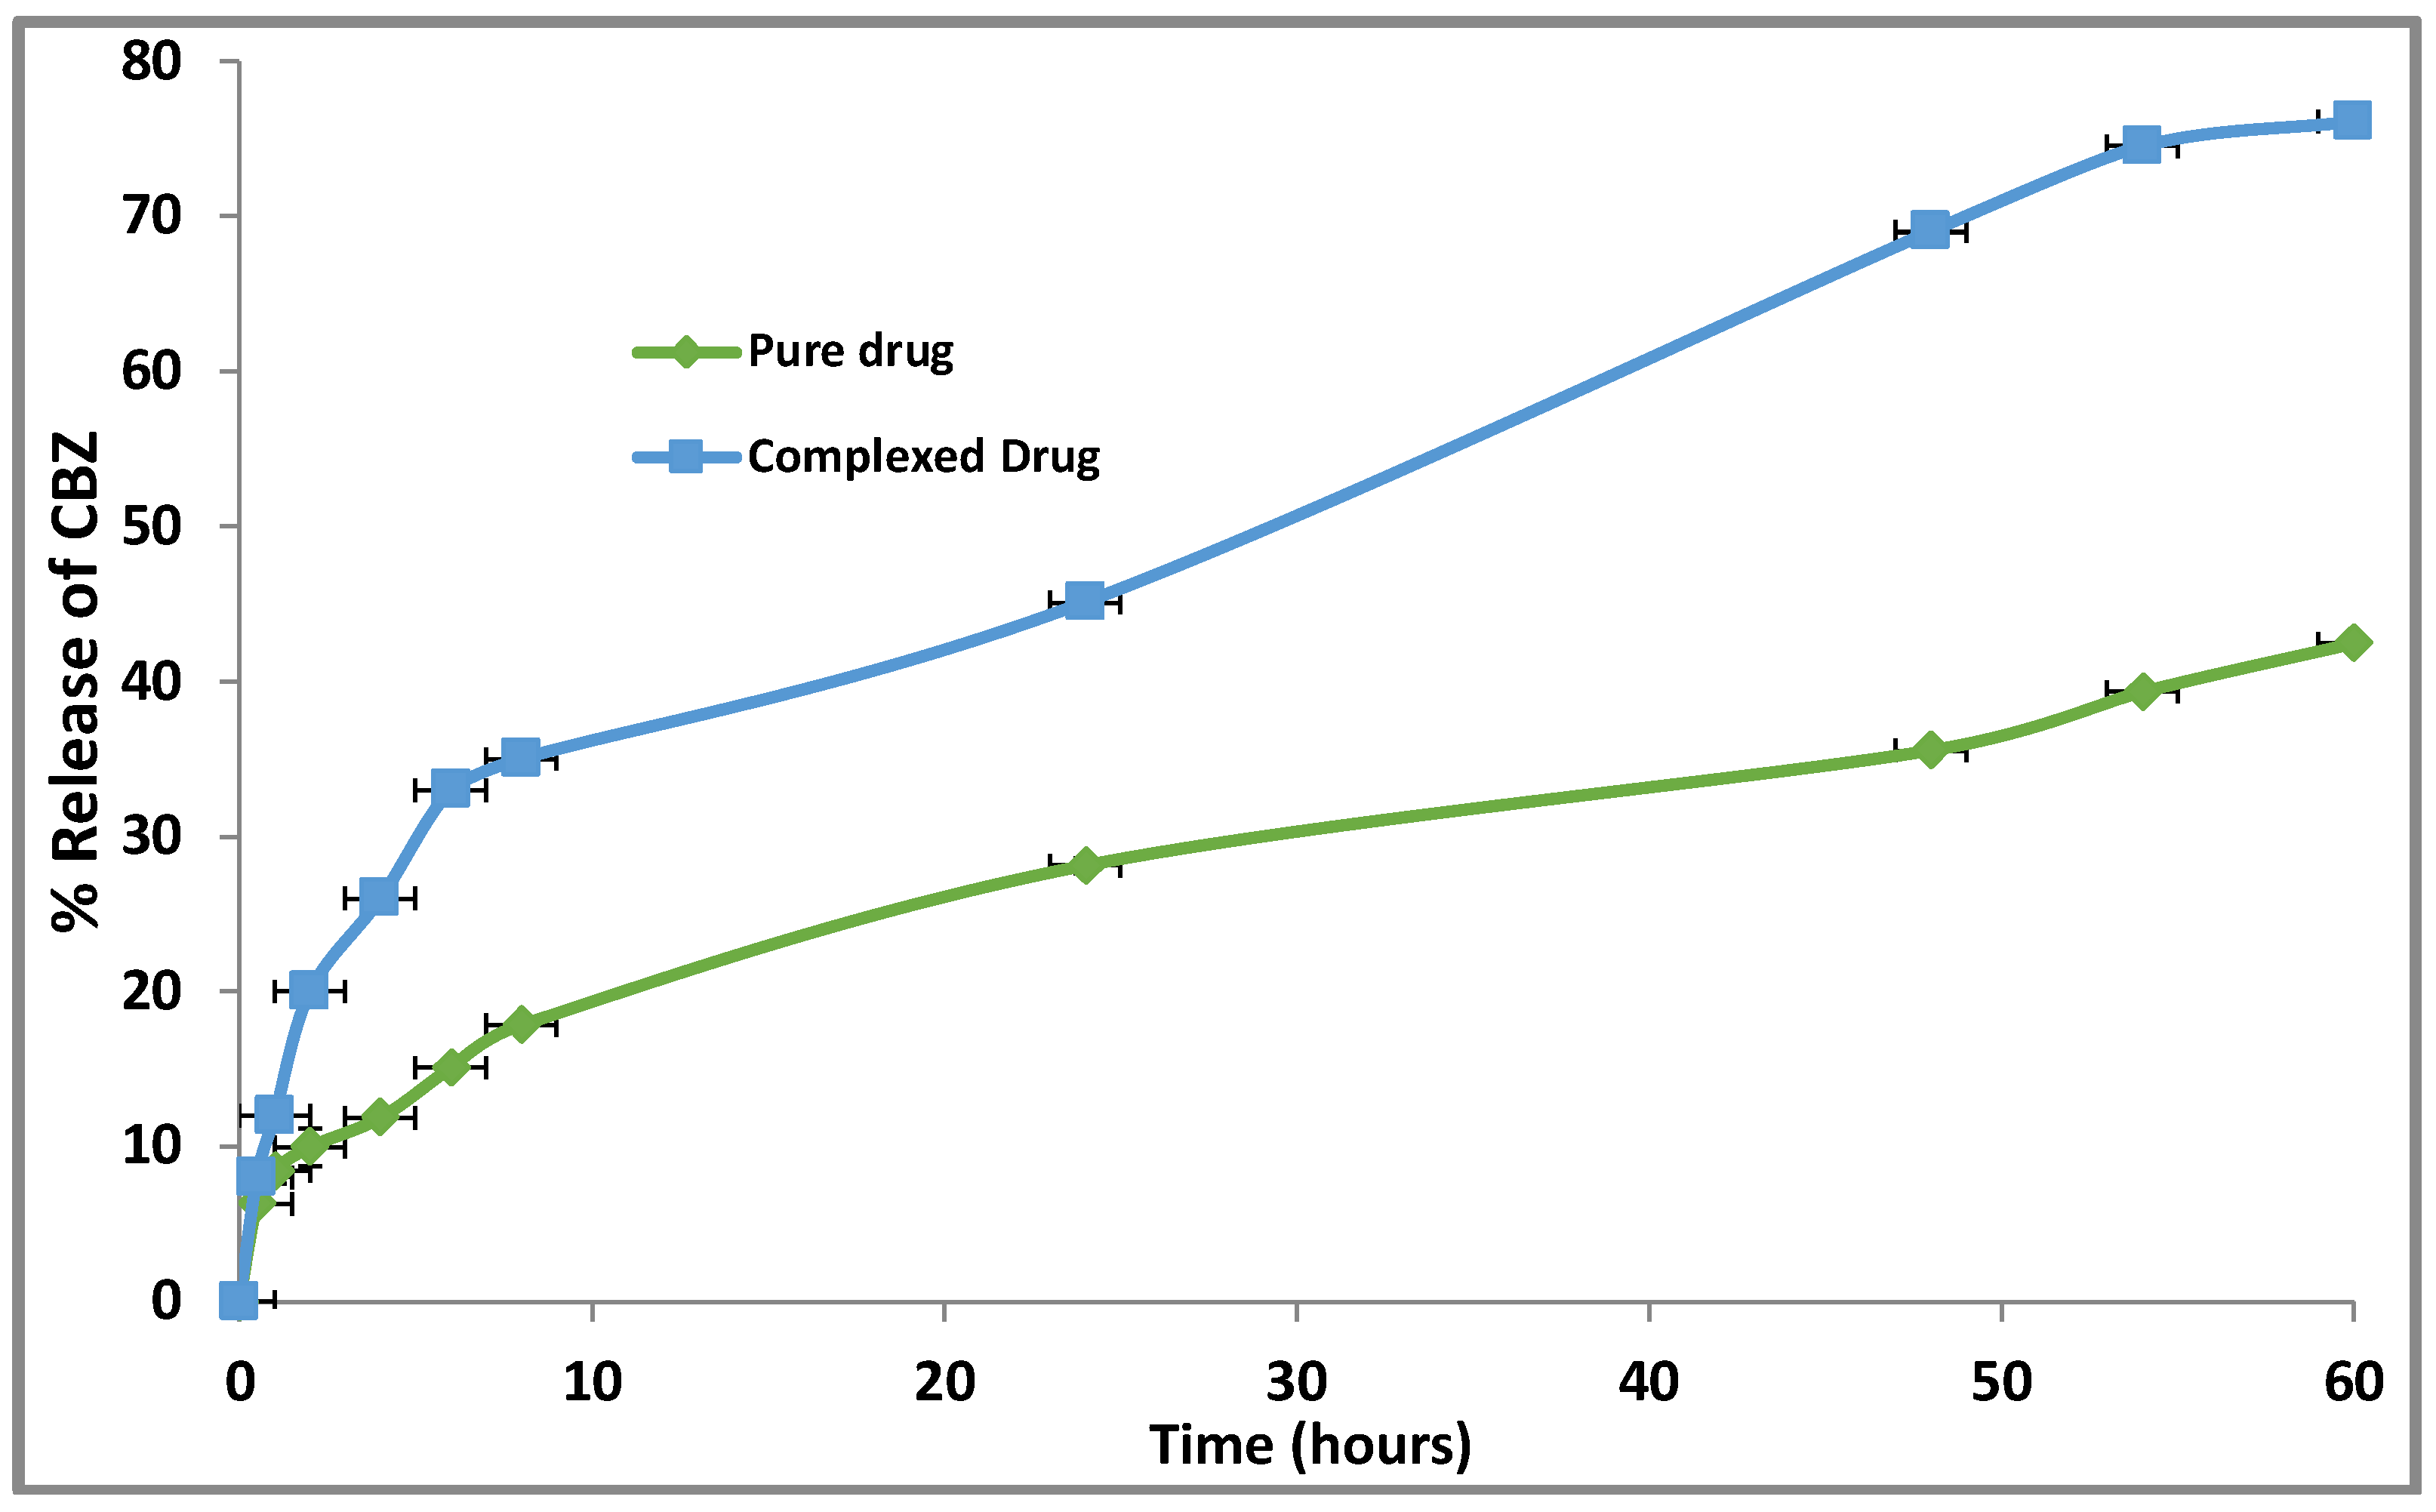
3.2.5. CBZ Release Profile from the Developed Complex

The CBZ release study showed that approximately ~39% of the pure drug was released in 60 min, whereas for the complexed drug, ~79% release was observed in 60 min, as shown in Figure 5. Thus, a better release profile for the complexed drug was observed. From the kinetics of drug release, the regression coefficient was found to be the maximum for the Higuchi model (Table 1) for both the pure drug and the complex, suggesting that the release followed the diffusion mechanism.

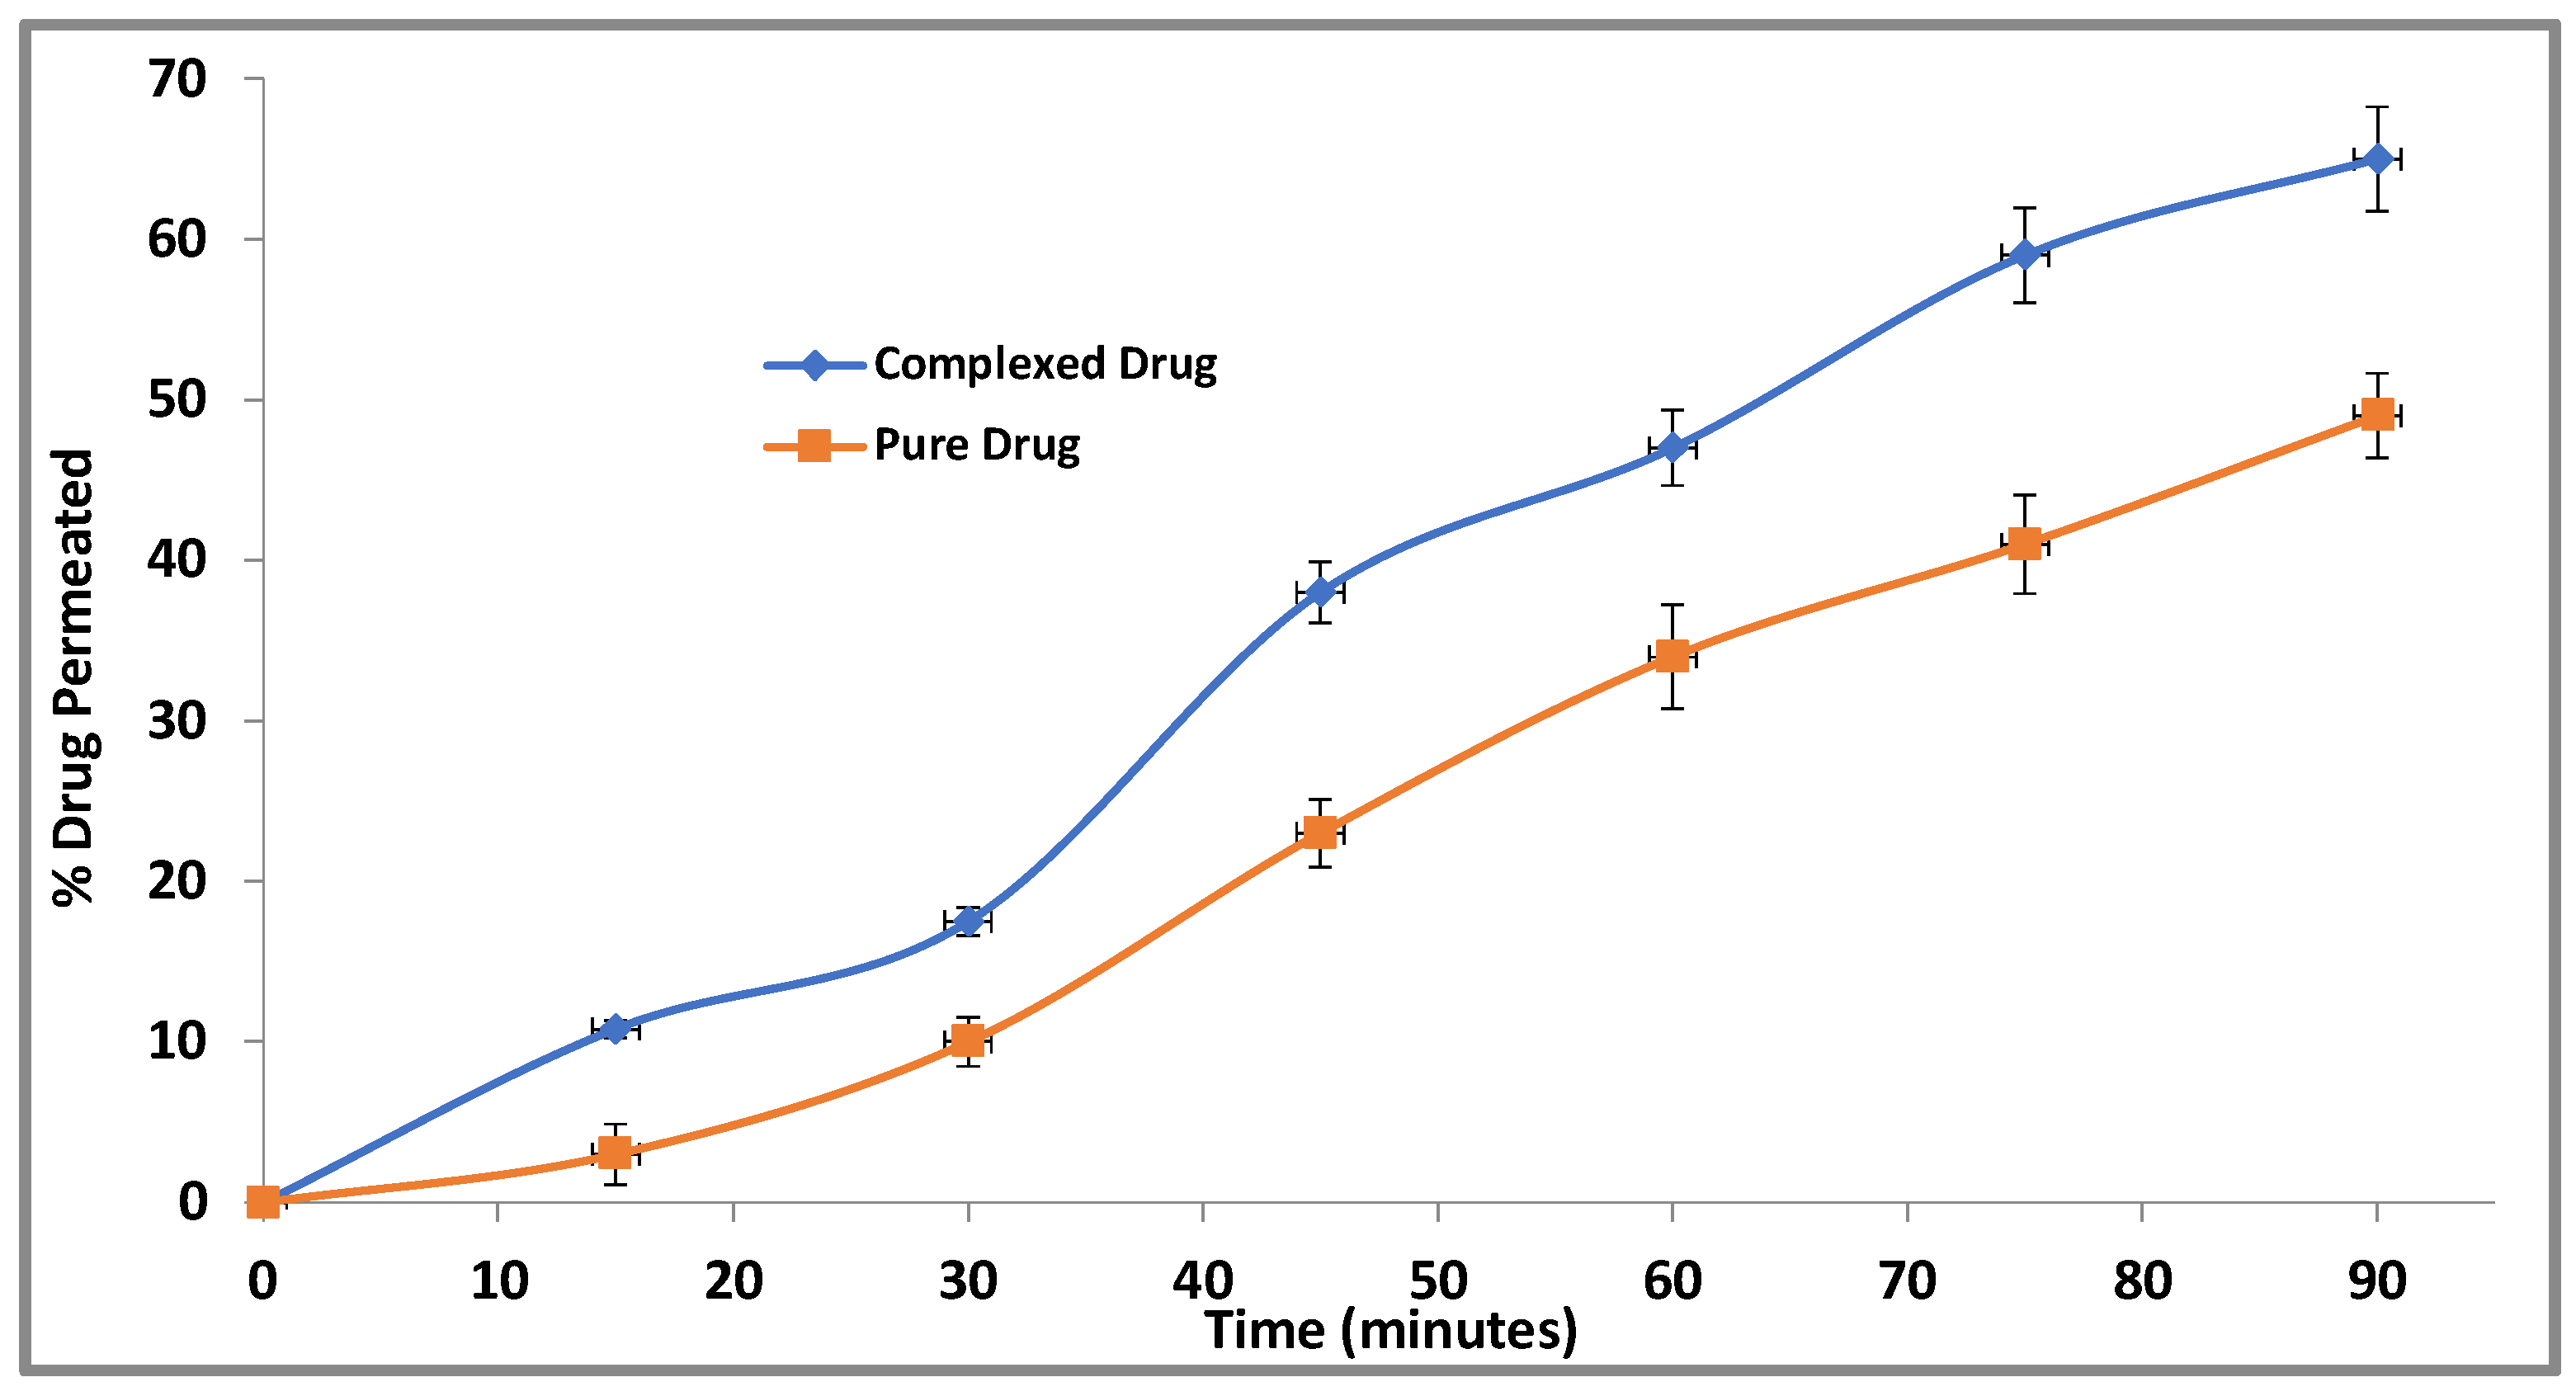
3.2.6. Ex Vivo Everted Intestinal Gut Sac Permeation Study for CBZ-FA Complex

The permeation of the complexed CBZ across the gut sac was greatly enhanced when compared to CBZ suspension in water. As shown in Figure 6, 48 ± 2.5% release of CBZ was observed, whereas the value increased to 69 ± 2.7% for the complexed drug [28]. The flux value was calculated and found to be 18.33 µg/min and 14.59 µg/min for the complex and the pure drug, respectively. The permeability was also enhanced by the complex vs. the pure drug, as shown by their respective apparent permeability coefficient values of 9.16 × 10⁻³ and 7.29 × 10⁻³ [29].

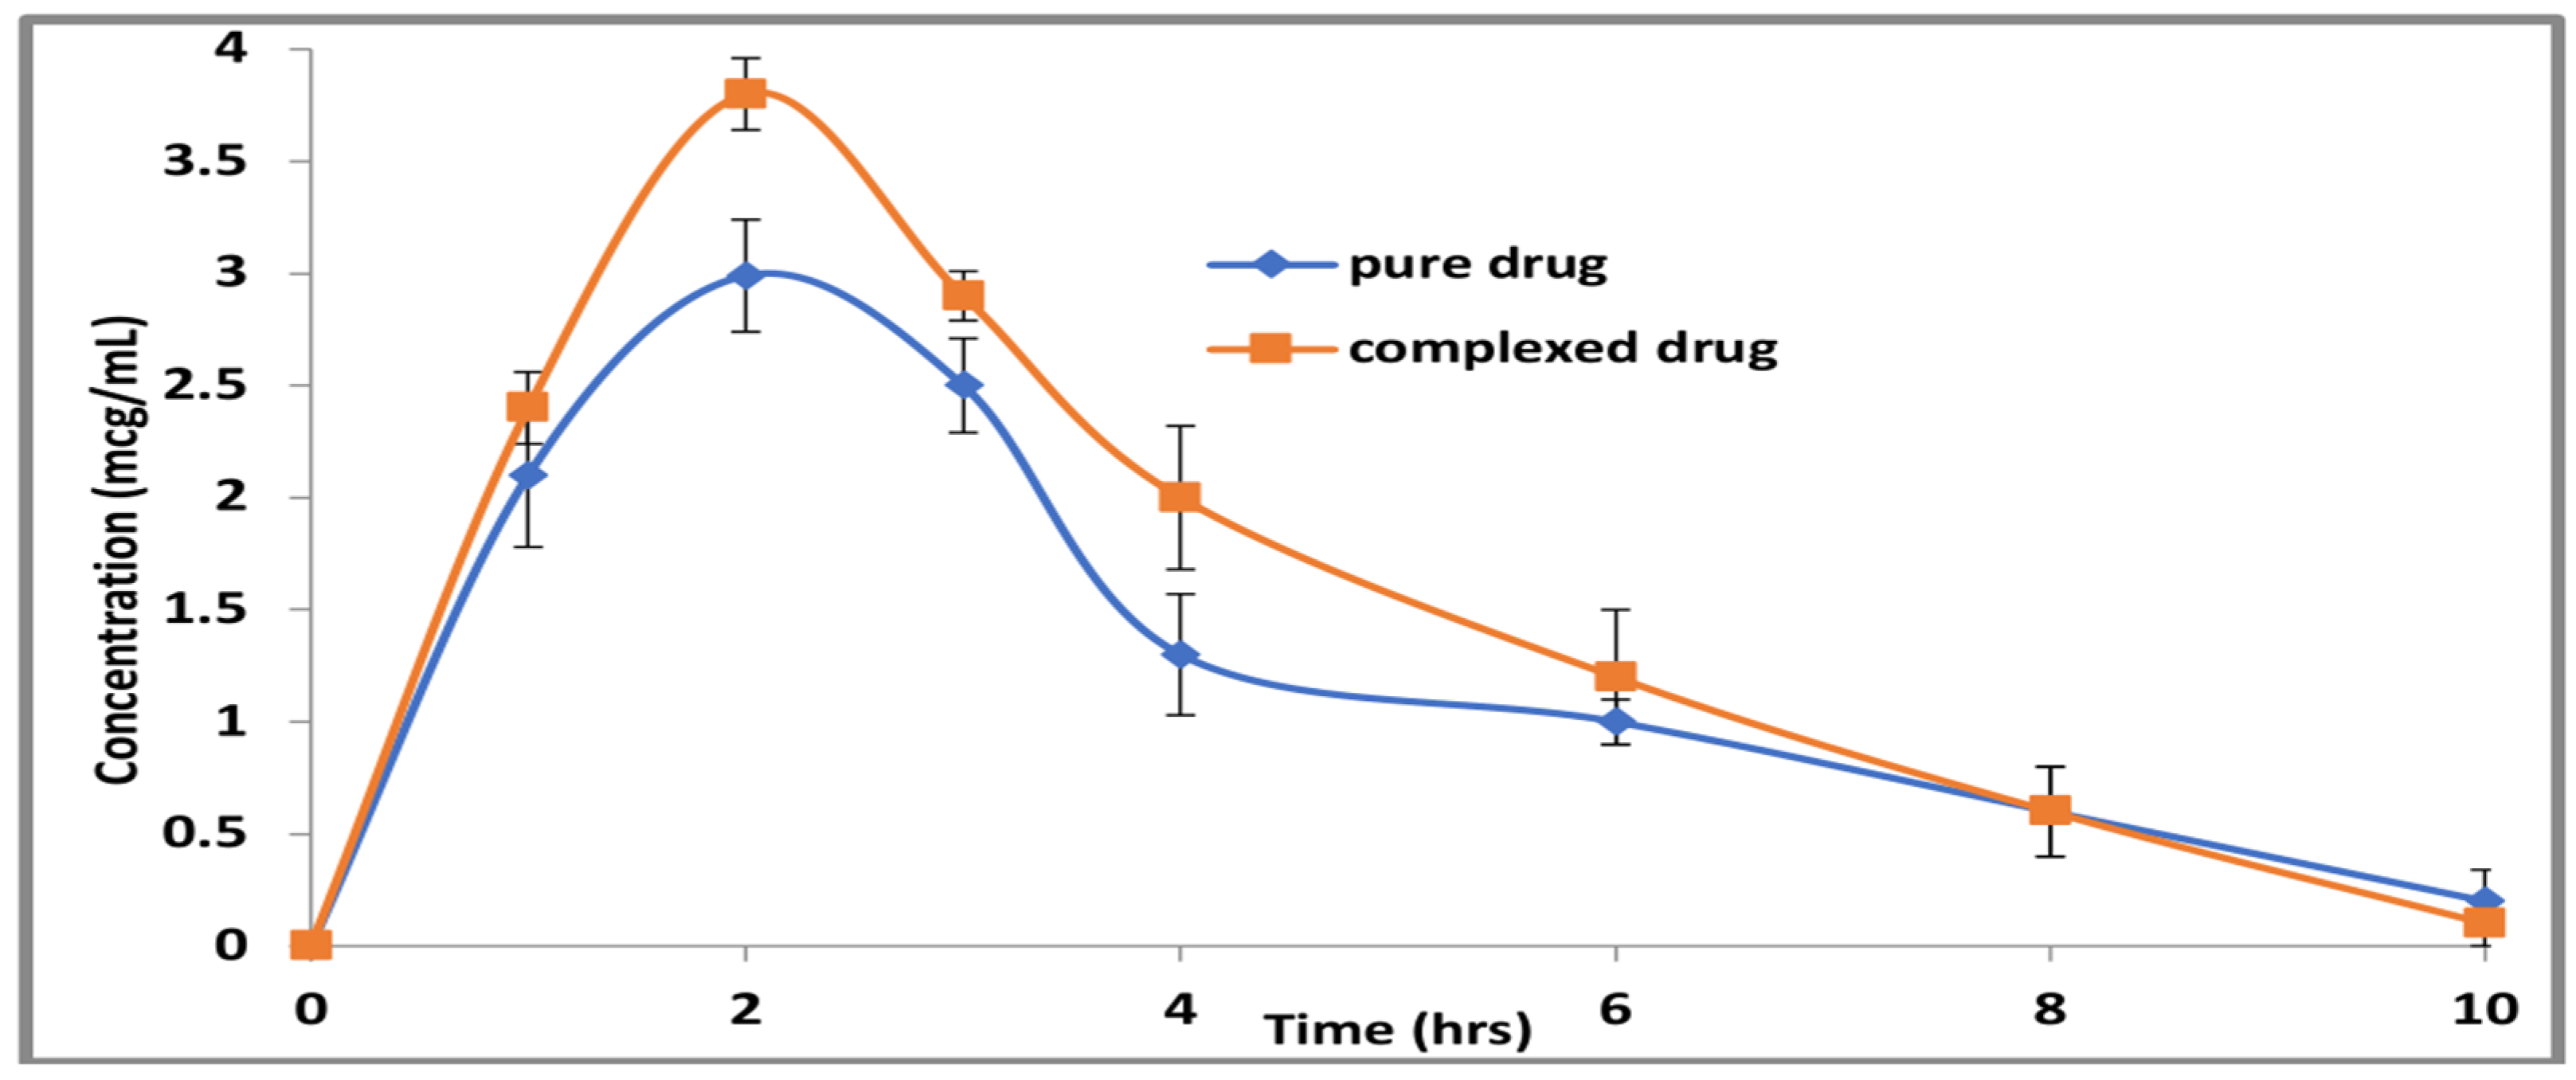
3.2.7. Pharmacokinetics of Carbamazepine

The plasma drug concentrations were plotted (Figure 7) at various time intervals, and the pharmacokinetic parameters, such as maximum plasma drug concentration (Cmax), time to reach maximum plasma drug concentration (Tmax), and area under the plasma concentration–time curve (AUC), were calculated [21]. The various values obtained from the non-compartmental pharmacokinetic model are shown in Table 2.

3.2.8. MES (Maximal Electroshock Seizure)-Induced Convulsion

The incidence and duration of seizures were noted and recorded, as shown in Table 3. The seizure duration shown by the control group was longer as compared to the drug-receiving groups. When the seizure durations in groups I and II were compared, it was noted that the duration was reduced to a value that is almost half of the group I value.

4. Discussion

The poor solubility of CBZ has been a burgeoning problem hindering efficient delivery. In general, Biopharmaceutics Classification System (BCS) Class II and Class IV drugs are associated with this issue. Therefore, we planned this work with the aim to enhance the aqueous solubility of CBZ using complexation with novel peat-sourced FA. In our previous work, we used shilajit FA to enhance the solubility of CBZ [30].
Peat-sourced FA is comparatively cheaper than shilajit-sourced FA [31]. Therefore, using peat-sourced FA could lead to a potential favorable alternative to shilajit-sourced FA. The study started with phase solubility determination, which helped us to select an adequate concentration of FA required to solubilize the maximum amount of CBZ. The optimum concentration was found to be 4% w/v FA solution. When we compared the phase solubility diagrams of peat FA with shilajit FA, it was observed that the maximum solubility was 1.5% w/v [13].
The CoA of peat-derived FA indicates the presence of some elements (Ca, P, Mn, Mg, K, Na, etc.). These elements are organic in nature and are not removed owing to their health benefits in dietary supplements. However, it should be noted that the presence of these elements can adversely affect the complexation capacity of FA. In the commercial-scale extraction of FA, heavy metals and earth-material-related impurities are minimized. Hence, we can expect a further enhancement of the solubility profile of FA in an industrial-scale study. Next, the complex was characterized for physico-chemical attributes using DSC, FTIR, and XRD. Our previous study showed that simple mixing is sufficient for physical interaction between the different functional groups [30]. The shifting and disappearance of peaks strongly indicate that complexation has occurred.
Significantly enhanced drug release was observed for the peat-derived FA-CBZ complex (79%); however, when compared to the shilajit-derived FA-CBZ complex, ~81% drug release was observed in 60 min. Here again, better drug release can be expected after the impurities in peat-sourced FA are removed. [29]. When we compare the permeation profile of the shilajit-based FA complex with that of the peat-sourced FA complex, a ~3.7 times enhancement can be seen in the former as compared to only 1.25 times. Again, we reiterate that once the impurities are removed, better permeation is expected.
Finally, the therapeutic effectiveness of the prepared complex was tested by carrying out pharmacokinetic and pharmacodynamic studies. Since the drug does not undergo hepatic metabolism, enhancing the solubility will improve the bioavailability. From these studies, it is clear that the complexed drug exhibited better performance when compared to the pure drug, as evident by 1.17 times enhanced bioavailability. Hence, we were successful in enhancing the solubility of CBZ by preparing a complex with peat FA. Nonetheless, the presence of mineral impurities obstructed our objective to some extent, and therefore, we had to use an excess amount of FA to solubilize a small amount of the drug. This can lead to a need for larger doses of the CBZ-FA complex, which can be inconvenient to patients. Consequently, there is a need to purify the FA sample so that better yield and minimum impurities can be obtained, which will ultimately improve the bioavailability and performance of the delivery system.

5. Conclusions

From the study, it can be concluded that the CBZ-FA complex successfully enhanced the solubility of CBZ, and hence, peat-sourced FA can be used for solubility enhancement. This observation was supported by in vivo testing, which strengthened our claim. Therefore, the complexation of CBZ with FA could be used for oral drug delivery, but further studies are needed to test the clinical efficacy.

Author Contributions

Conceptualization, methodology, investigation, and data curation, R.K.; software, validation, and writing—original draft P.J.; writing—review and editing, formal analysis, F.Z.; resources and supervision. M.A.; supervision and project administration, M.A.M.; review and editing, S.A.; resources and project administration, Z.I. All authors have read and agreed to the published version of the manuscript.

Funding

This research received no external funding.

Institutional Review Board Statement

Protocol no. 1426 for animal studies was approved by the Institutional Animal Ethics Committee, Jamia Hamdard, New Delhi, India (registration no. 173/GO/Re/S/2000/CPCSEA, 1 March 2018).

Informed Consent Statement

Not applicable.

Data Availability Statement

Not applicable.

Acknowledgments

This research is not funded by any funding agencies. However, the authors are thankful to the NZ Fulvic Ltd. Company (New Zealand) for providing peat-derived fulvic acid as a generous gift.

Conflicts of Interest

The authors declare no conflict of interest.

References

  1. Steffens, K.E.; Wagner, K.G. Dissolution enhancement of carbamazepine using twin-screw melt granulation. Eur. J. Pharm. Biopharm. 2020, 148, 77–87. [Google Scholar] [CrossRef] [PubMed]
  2. Zerrouk, N.; Chemtob, C.; Arnaud, P.; Toscani, S.; Dugue, J. In vitro and in vivo evaluation of carbamazepine-PEG6000 solid dispersions. Int. J. Pharm. 2001, 225, 49–62. [Google Scholar] [CrossRef]
  3. Klučáková, M. Size and charge evaluation of standard humic and fulvic acids as crucial factors to determine their environmental behavior and impact. Front. Chem. 2018, 6, 235. [Google Scholar] [CrossRef]
  4. Jadhav, A.; Acharya, R.; Chandola, H.M.; Harisha, C.R. Development and Validation of Uv Spectrophotophotometric Method for Analysis of Fulvic Acid—A Decomposition Product in Shilajith. Int. J. Ayurveda Allied Sci. 2013, 2, 327–331. [Google Scholar]
  5. Mirza, M.A. Future of Humic substances as Pharmaceutical Excipient. Pharm. Sci. Anal. Res. J. Mini Rev. 2018, 2018, 180004. Available online: http://chembioepub.com/PSARJ/ (accessed on 13 June 2021).
  6. Raish, M.; Ahmad, A.; Alkharfy, K.M.; Jan, B.L.; Mohsin, K.; Ahad, A.; Al-Jenoobi, F.I.; Al-Mohizea, A.M. Effects of Paeonia emodi on hepatic cytochrome P450 (CYP3A2 and CYP2C11) expression and pharmacokinetics of carbamazepine in rats. Biomed. Pharmacother. 2017, 90, 694–698. [Google Scholar] [CrossRef]
  7. Emad, N.A.; Ahmed, B.; Alhalmi, A.; Alzobaidi, N.; Al-Kubati, S.S. Recent progress in nanocarriers for direct nose to brain drug delivery. J. Drug Deliv. Sci. Technol. 2021, 64, 102642. [Google Scholar] [CrossRef]
  8. Zhao, Y.; Paderu, P.; Delmas, G.; Dolgov, E.; Lee, M.H.; Senter, M.; Park, S.; Leivers, S.; Perlin, D.S. Carbohydrate-derived fulvic acid is a highly promising topical agent to enhance healing of wounds infected with drug-resistant pathogens. J. Trauma Acute Care Surg. 2015, 79, S121–S129. [Google Scholar] [CrossRef]
  9. Swift, R.S.; Posner, A.M. Gel Chromatography of Humic Acid. J. Soil Sci. 1971, 22, 237–249. [Google Scholar] [CrossRef]
  10. Sabi, R.; Very, P.; van Rensburg, C.E.J. Carbohydrate-derived fulvic acid (CHD-FA) inhibits carrageenan-induced inflammation and enhances wound healing: Efficacy and toxicity study in rats. Drug Dev. Res. 2012, 73, 18–23. [Google Scholar] [CrossRef] [Green Version]
  11. Hart, R.M.; Jones, H.L.; Jones, V.L.; Malik, S.; Kenny, M.A.; Love, B.; Harnisch, J.P. United States Patent E 2001 1. Available online: https://patents.google.com/patent/US6267962B1/en (accessed on 7 April 2022).
  12. Schnitzer, M.; Kodama, H. An electron microscopic examination of fulvic acid. Geoderma 1975, 13, 279–287. [Google Scholar] [CrossRef]
  13. Leppard, G.G.; Buffle, J.; Baudat, R. A description of the aggregation properties of aquatic pedogenic fulvic acids. Combining physico-chemical data and microscopical observations. Water Res. 1986, 20, 185–196. [Google Scholar] [CrossRef]
  14. Mirza, M.A.; Agarwal, S.P.; Rahman, M.A.; Rauf, A.; Ahmad, N.; Alam, A.; Iqbal, Z. Role of humic acid on oral drug delivery of an antiepileptic drug. Drug Dev. Ind. Pharm. 2011, 37, 310–319. [Google Scholar] [CrossRef] [PubMed]
  15. Gandy, J.J.; Snyman, J.R.; van Rensburg, C.E. Randomized, parallel-group, double-blind, controlled study to evaluate the efficacy and safety of carbohydrate-derived fulvic acid in topical treatment of eczema. Clin. Cosmet. Investig. Dermatol. 2011, 4, 145–148. [Google Scholar] [CrossRef] [Green Version]
  16. Khan, R.; Jain, P.; Aqil, M.; Agarwal, S.P.; Mirza, M.A.; Iqbal, Z. Pharmacokinetic evaluation of fulvic acid-ketoconazole complexes: A validation and line extension study. J. Drug Deliv. Sci. Technol. 2020, 55, 101469. [Google Scholar] [CrossRef]
  17. Agarwal, S.P.; Ansari, S.H.; Karmarkar, R.R. Enhancement of the dissolution rate of ketoconazole through a novel complexation with humic acid extracted from shilajit. Asian J. Chem. 2008, 20, 380–388. [Google Scholar]
  18. Liu, H.; Nie, J.; Chan, H.C.S.; Zhang, H.; Li, L.; Lin, H.; Tong, H.H.Y.; Ma, A.; Zhou, Z. Phase solubility diagrams and energy surface calculations support the solubility enhancement with low hygroscopicity of Bergenin: 4-Aminobenzamide (1:1) cocrystal. Int. J. Pharm. 2021, 601, 120537. [Google Scholar] [CrossRef]
  19. Prashanth, S.; Kumar, A.; Madhu, B.; Rama, N.; Sagar, J.V. Pharmacokinetic and pharmacodynamic drug interactions of carbamazepine and glibenclamide in healthy albino Wistar rats. J. Pharmacol. Pharmacother. 2011, 2, 7–10. [Google Scholar] [CrossRef] [Green Version]
  20. Kouhail, Y.Z.; Benedetti, M.F.; Reiller, P.E. Formation of mixed Eu(III)-CO3-fulvic acid complex: Spectroscopic evidence and NICA-Donnan modeling. Chem. Geol. 2019, 522, 175–185. [Google Scholar] [CrossRef]
  21. Mowafy, H.A.; Alanazi, F.K.; el Maghraby, G.M. Development and validation of an HPLC-UV method for the quantification of carbamazepine in rabbit plasma. Saudi Pharm. J. 2012, 20, 29–34. [Google Scholar] [CrossRef] [Green Version]
  22. Gan, S.H.; Ismail, R.; Adnan, W.A.W.; Wan, Z. Method development and validation of a high-performance liquid chromatographic method for tramadol in human plasma using liquid-liquid extraction. J. Chromatogr. B Anal. Technol. Biomed. Life Sci. 2002, 772, 123–129. [Google Scholar] [CrossRef]
  23. Mirza, M.A.; Agarwal, S.P.; Iqbal, Z. Effect of fulvic acid on oral delivery of carbamazepine. Sci. Adv. Mater. 2011, 3, 223–232. [Google Scholar] [CrossRef]
  24. Verma, D.; Thakur, P.S.; Padhi, S.; Khuroo, T.; Talegaonkar, S.; Iqbal, Z. Design expert assisted nanoformulation design for co-delivery of topotecan and thymoquinone: Optimization, in vitro characterization and stability assessment. J. Mol. Liq. 2017, 242, 382–394. [Google Scholar] [CrossRef]
  25. Anzar, N.; Mirza, M.A.; Anwer, K.; Khuroo, T.; Alshetaili, A.S.; Alshahrani, S.M.; Meena, J.; Hasan, N.; Talegaonkar, S.; Panda, A.K.; et al. Preparation, evaluation and pharmacokinetic studies of spray dried PLGA polymeric submicron particles of simvastatin for the effective treatment of breast cancer. J. Mol. Liq. 2018, 249, 609–616. [Google Scholar] [CrossRef]
  26. Gnananath, K.; Nataraj, K.S.; Rao, B.G.; Kumar, K.P.; Mahnashi, M.H.; Anwer, M.K.; Umar, A.; Iqbal, Z.; Mirza, M.A. Exploration of fulvic acid as a functional excipient in line with the regulatory requirement. Environ. Res. 2020, 187, 109642. [Google Scholar] [CrossRef] [PubMed]
  27. Rahman, M.; Almalki, W.H.; Afzal, O.; Altamimi, A.S.A.; Kazmi, I.; Al-Abbasi, F.A.; Choudhry, H.; Alenezi, S.K.; Barkat, M.A.; Beg, S.; et al. Cationic solid lipid nanoparticles of resveratrol for hepatocellular carcinoma treatment: Systematic optimization, in vitro characterization and preclinical investigation. Int. J. Nanomed. 2020, 15, 9283–9299. [Google Scholar] [CrossRef]
  28. Fatima, S.; Iqbal, Z.; Panda, A.K.; Samim, M.; Talegaonkar, S.; Ahmad, F.J. Polymeric nanoparticles as a platform for permeability enhancement of class III drug amikacin. Colloids Surf. B Biointerfaces 2018, 169, 206–213. [Google Scholar] [CrossRef]
  29. Tambe, A.; Mokashi, P.; Pandita, N. Ex-vivo intestinal absorption study of boswellic acid, cyclodextrin complexes and poloxamer solid dispersions using everted gut sac technique. J. Pharm. Biomed. Anal. 2019, 167, 66–73. [Google Scholar] [CrossRef]
  30. Mirza, M.A.; Ahmad, N.; Agarwal, S.P.; Mahmood, D.; Anwer, M.K.; Iqbal, Z. Comparative evaluation of humic substances in oral drug delivery. Results Pharma Sci. 2011, 1, 16–26. [Google Scholar] [CrossRef] [Green Version]
  31. Wollina, U. Peat: A natural source for dermatocosmetics and dermatotherapeutics. J. Cutan. Aesthet. Surg. 2009, 2, 17–20. [Google Scholar] [CrossRef]
Figure 1. Phase solubility diagram of FA and CBZ at room temperature (25 ± 2 °C).
Scipharm 90 00033 g001
Figure 2. FTIR overlay spectra of FA (A), CBZ (B), and CBZ-FA complex (C).
Scipharm 90 00033 g002
Figure 3. Overlay of DSC thermograms of (A) CBZ, (B) FA, and (C) CBZ-FA complex.
Scipharm 90 00033 g003
Figure 4. Overlay of X-ray diffractograms of A (FA), B (CBZ), and C (CBZ-FA complex).
Scipharm 90 00033 g004
Figure 5. Comparative release profile of the pure drug (FA) and the complexed drug (CBZ-FA) in simulated gastric fluid, pH 1.2 at 37 ± 2 °C.
Scipharm 90 00033 g005
Figure 6. Ex vivo permeation profile of the pure drug and the complexed drug across the rat intestinal sac.
Scipharm 90 00033 g006
Figure 7. The plasma concentration–time curve of the pure drug (80 mg/kg p.o.) and complexed drug (equivalent to 80 mg/kg CBZ) administered in rats.
Scipharm 90 00033 g007
Table 1. Kinetics of in vitro release.
ModelsR2 Value
Zero order0.883
First order0.874
Korsmeyer–Peppas0.932
Higuchi0.984
Table 2. The in vivo pharmacokinetic parameters of pure CBZ and complexed CBZ following oral administration in rats.
ParametersGroup I (Pure Drug)Group II (Complexed Drug)
Cmax (μg/mL)2.9935 ± 0.0063.80 ± 0.1
Tmax (h)2.0 ± 0.02 ± 0.0
AUC0–t (μg/mL ∗ h)12.94 ± 0.0615.8 ± 0.04
AUC0–∞ (μg/mL ∗ h)13.66 ± 0.08116.08 ± 0.05
Table 3. In vivo anticonvulsant activity of CBZ and complexed CBZ in Wistar rats.
ParameterGroup I (Pure Drug)Group II (Complexed Drug)Group III (Control)
Duration of seizures (n = 6)49.4 ± 2 s25 ± 4 s2.48 ± 0.3 min
Publisher’s Note: MDPI stays neutral with regard to jurisdictional claims in published maps and institutional affiliations.

