Article

Optimized Methods for Analytical and Functional Comparison of Biosimilar mAb Drugs: A Case Study for Avastin, Mvasi, and Zirabev

1
SUNUM Nanotechnology Research and Application Center, Sabanci University, Istanbul 34956, Turkey
2
Faculty of Engineering and Natural Sciences, Sabanci University, Istanbul 34956, Turkey
3
ILKO ARGEM Biotechnology R&D Center, Istanbul 34956, Turkey
*
Authors to whom correspondence should be addressed.
Submission received: 1 April 2022 / Revised: 18 May 2022 / Accepted: 27 May 2022 / Published: 31 May 2022

Abstract

:
Bevacizumab is a humanized therapeutic monoclonal antibody used to reduce angiogenesis, a hallmark of cancer, by binding to VEGF-A. Many pharmaceutical companies have developed biosimilars of Bevacizumab in the last decade. The official reports provided by the FDA and EMA summarize the analytical performance of biosimilars as compared to the originators without giving detailed analytical procedures. In the current study, several key methods were optimized and reported for analytical and functional comparison of bevacizumab originators (Avastin, Altuzan) and approved commercial biosimilars (Zirabev and Mvasi). This case study presents a comparative analysis of a set of biosimilars under optimized analytical conditions for the first time in the literature. The chemical structure of all products was analyzed at intact protein and peptide levels by high-resolution mass spectrometry; the major glycoforms and posttranslational modifications, including oxidation, deamidation, N-terminal PyroGlu addition, and C-terminal Lys clipping, were compared. The SPR technique was used to reveal antigen and some receptor binding kinetics of all products, and the ELISA technique was used for C1q binding affinity analysis. Finally, the inhibition performance of the samples was evaluated by an MTS-based proliferation assay in vitro. Major glycoforms were similar, with minor differences among the samples. Posttranslational modifications, except C-terminal Lys, were determined similarly, while unclipped Lys percentage was higher in Zirabev. The binding kinetics for VEGF, FcRn, FcγRIa, and C1q were similar or in the value range of originators. The anti-proliferative effect of Zirabev was slightly higher than the originators and Mvasi. The analysis of biosimilars under the same conditions could provide a new aspect to the literature in terms of the applied analytical techniques. Further studies in this field would be helpful to better understand the inter-comparability of the biosimilars.

Graphical Abstract

1. Introduction

Monoclonal antibodies (mAbs) have gained significant attention due to their efficient and specific therapeutic potential for many diseases [1,2,3]. Unlike conventional chemical drugs, the development and standard production of an original mAbs or biosimilars are challenging due to their complex structure. The manufacturers should carefully follow specific quality parameters for the production of mAbs with consistent efficacy, safety, and quality [4,5].
From upstream production to shelf, many parameters can affect the structure, function, immunogenicity, or stability of mAbs. For instance, glycosylation or sequence variants are generated upstream [6,7], while posttranslational modifications (PTMs) such as deamidation or oxidation can be formed in almost all production steps. Minor differences during the cell culture or purification can lead to these modifications, different charge variants [8], or unforeseen prone sites for aggregation or degradation [6,9]. The binding kinetics of mAbs to their target and effector receptors can also be affected by several modifications based on their locations [10]. Therefore, the biochemical, physical, or functional characterization via advanced analytical tools is pivotal to revealing the dissimilarities between the originator and biosimilar products.
Monoclonal antibodies have been developed and marketed by many pharmaceutical companies due to their proven economic importance. For the approval of newly produced biosimilars, similarity acceptance criteria have been outlined and regulated by several authorities, including the FDA, EMA, WHO, and ICH [11,12,13,14,15]. However, it needs to be regularly updated as the quality and amount of data increase with developing technologies and the biosimilar market. The critical point is that the biochemical and biological characterization of biosimilar candidates should be performed with the originator products simultaneously by using validated methods to diminish the variation and determine the exact range of biosimilarity.
Bevacizumab is a humanized anti-VEGF (vascular endothelial growth factor) antibody used to inhibit the tumors’ vascularization by binding to VEGF, one growth factor that induces angiogenesis. Bevacizumab, commercially known as Avastin or Altuzan (Genentech and Roche), was firstly approved by FDA in 2004 and EMA in 2005 as first-line therapy for colorectal cancer [16,17]. Avastin is also approved for many other cancer types in the following years, including lung, cervical, and glioblastoma [18,19,20]. Many pharmaceutical companies develop bevacizumab biosimilars due to growing demand in the field. More than ten biosimilar candidates are in development, and several biosimilars are approved by the FDA, EMA, or other national medicinal agencies [21].
Mvasi (Amgen) is the first bevacizumab biosimilar approved by the FDA in 2017 and EMA in 2018. Another EMA-approved (2019) bevacizumab biosimilar is Zirabev, developed by Pfizer. The FDA recommends a tiered approach to reveal the analytical similarity between the originator and the innovator products. According to this ranking, tier 1 is recommended for quality attributes with the highest risk and includes the biological and kinetic assays. Tier 2 is recommended for the attributes with a lower risk, and tier 3 for the attributes with the lowest risk. Although the structural and functional similarity of the biosimilars to originators are reported in FDA products quality reviews and EMA assessment reports, detailed characterization of approved biosimilars and the originator under the same conditions by robust and reliable techniques would contribute to the literature in terms of inter-comparableness of the biosimilars.
In this study, the originators (Avastin and Altuzan) and two approved biosimilars (Mvasi and Zirabev) were characterized under the same conditions to ensure a reliable comparison of all of these products. All samples were analyzed by ultra-performance liquid chromatography/mass spectrometry (UPLC-MS/MS) at the intact protein and peptide levels to reveal the posttranslational modifications and major glycoforms. Furthermore, VEGF-A, eonatal receptor (FcRn), and FcγRIa binding capacities of the samples were shown in vitro by surface plasmon resonance (SPR), and C1q binding kinetics were determined by ELISA assay to demonstrate the potential differences in these functional parameters. Additionally, the anti-proliferative activity of the samples was evaluated by a cell culture proliferation (MTS) assay.

2. Materials and Methods

2.1. Intact Protein Analysis

Avastin (33808339, Roche, Basel, Switzerland), Altuzan (B7252H02, Roche, Basel, Switzerland), Zirabev (CN4932, Pfizer, New York, NY, USA), and Mvasi (81111402, Amgen, Thousand Oaks, CA, USA) samples were diluted to 0.5 mg/mL with 50 mM ammonium bicarbonate (AMBIC, Sigma-Aldrich, St. Louis, MO, USA) and injected directly into the LC-MS/MS system (Waters, ACQUITY UPLC-ESI-Xevo G2-XS QtoF, Milford, MA, USA). Mobile phase A was MS grade water (Merck, Rahway, NJ, USA), mobile phase B was © (Merck, Rahway, NJ, USA), and mobile phase C was 1% formic acid (Merck, Rahway, NJ, USA). The reverse-phase separation was performed on ACQUITY UPLC-BEH300 C4 1.7 μm column (2.1 mm × 50 mm, Waters, Milford, MA, USA) using a 1 min gradient (5–85% B). During the run, the flow rate and column temperatures were 0.4 µL/min and 80 °C. The mass range was set to 500–4000 m/z and analyzed in ESI-positive and sensitivity mode. The instrument was calibrated using NaCsI (Sigma-Aldrich, St. Louis, MO, USA), and Glu-1-fibrinopeptide B (Waters, Milford, MA, USA) was used as a lock-mass reference.
The deconvolution of raw mass spectra of intact mAb samples was performed by the UNIFI MaxEnt1 algorithm (1.9 SR4, Waters, Milford, MA, USA) with the following parameters: input m/z range, 2400–3200; output mass range, 146,500–150,000; minimum intensity ratio left and right, 30%, FWHM, 0.73 (low m/z) and 0.92 (high m/z); the number of iterations, 20. Major glycoforms (G0F, G1F, G2F, G0) and C-terminal lysine were introduced as modifications, and only the components identified with <50 ppm mass error were accepted as glycoforms. The percentage of each glycoform was calculated using the formula: “Response % Glycoform = (Response/Total Response of Glycoforms) × 100” [22].

2.2. Peptide Mapping Analysis

Avastin, Altuzan, Zirabev, and Mvasi samples (50 µg) were treated with 1% SDS (Sigma-Aldrich, St. Louis, MO, USA) and 0.1 M DTT (Sigma-Aldrich, St. Louis, MO, USA) in 50 mM AMBIC solution and incubated at 56 °C for 15 min. After the reduction, samples were alkylated with 20 mM IAA (Sigma-Aldrich, St. Louis, MO, USA) for 30 min in the dark at room temperature. After incubation, all samples were diluted with 8 M urea and purified twice with 30 kDa MWCO disposable filter units (Merck Millipore, MA, USA) at 14,000× g for 20 min. The purified samples were incubated with 1 µg trypsin (Thermo Scientific Pierce, Waltham, MA, USA) in 75 µL AMBIC (1:50, w/w, enzyme to protein ratio) at 37 °C overnight. The filtrates, including tryptic peptides, were collected by washing twice the filter unit with 50 µL of 50 mM AMBIC. Finally, the samples were acidified with 1% formic acid before analysis [23].
The tryptic peptides were analyzed by the ACQUITY UPLC-ESI-Xevo G2-Xs QToF system (Waters, Milford, MA, USA). Mobile phase A was composed of MS grade water, mobile phase B was ACN, and mobile phase C was 1% FA. The percentage of mobile C was set to 10%, and the percentage of mobile phase B was increased from 1 to 80% over an 85 min total run time. The instrument was calibrated with NaCsI, and Glu-1-fibrinopeptide B (100 fmol/uL) was used as a lock-mass reference. Data-independent acquisition mode (DIA) was performed by sequential MS, and MS/MS scans with 0.5 s cycle time. All ions within the 50–2000 m/z mass range were fragmented together without selecting precursor ions in sensitivity mode.
The raw data was processed by applying the UNIFI (1.9 SR4, Waters, Milford, MA, USA) peptide mapping workflow parameters. The bevacizumab sequence was retrieved from http://www.drugbank.ca/ (1 June 2020) as a reference database. Trypsin was selected as a digesting reagent with one missed cleavage maximum. Carbamidomethyl-C was set as a fixed modification due to the alkylation step in the sample preparation. In contrast, the other modifications (oxidation-M, oxidation-W, deamidation-N, deamidation-Q, succinimide intermediates, pyroglutamic Acid-N TERM, -lysine C-TERM) were set as a variable. The mass tolerance window was set within 10 ppm. The components greater than 10% matched primary ions (b/y ions), <10 ppm mass error and no in-source fragment were allowed for identification. The percentage of modifications was calculated using the following equation: “%peptide = (Response of modified peptide/Total response of the modified and unmodified peptides) × 100” [22,24].

2.3. VEGF Binding Assay

The VEGF binding analyses were performed on VEGF 165A-immobilized (Sigma-Aldrich, St. Louis, MO, USA) CM5 chips with a Biacore T200 SPR Instrument (Cytiva, Marlborough, MA, USA) [25]. The chip surface was prepared with standard EDC-NHS coupling chemistry [26]. VEGF165A was diluted to 5 ng/µL in pH 5.5 in 10 mM acetate buffer. Following the activation of surface carboxylate groups by EDC/NHS injection, the target protein, VEGF 165A, was covalently immobilized through the free primary amine groups. The excess number of activated carboxyl groups on the matrix was blocked with a 1 M ethanolamine-HCl (Cytiva, Marlborough, MA, USA) injection. The final immobilization level for the active flow cell reached approximately 500 response units (RU) for all experiments. An ethanolamine-immobilized flow channel was used as the control surface. The samples at three concentrations (15 nM, 5 nM, 1.66 nM). were prepared in 1× HBS-EP buffer (10 mM HEPES, 150 mM NaCl, 3 mM EDTA, 0.005% v/v polysorbate 20) at pH 7.4, which was also employed as the running buffer. Single-cycle kinetic analyses were conducted at the flow rate of 30 µL/min at 22 °C. Analytes were injected for 120 s in the association phase, followed by a dissociation phase of the 1800 s with the running buffer. Blank measurements were also performed on the active and control flow channels by running buffer injections under identical conditions. The chip surface was regenerated by injecting 10 mM glycine pH 1.5 buffer for 90 s. Results were obtained by subtracting responses from blank flow cells and zero concentration analyte injection (running buffer). The SPR data were presented as the mean value, calculated from at least three measurements per sample. The equilibrium dissociation constants (KD) were calculated by Biacore Evaluation Software (3.0 Biacore T200, Shrewsbury, MA, USA) using a 1:1 Langmuir binding model [26]. For similarity assessment, statistical equivalence analysis was used. The difference in means between the two products within the equivalence acceptance criterion [±1.5 standard deviation (SD) of the originator data set] in the 90% confidence interval was accepted as similar.

2.4. FcRn Binding Assay

FcRn binding analyses were conducted on Anti-His IgG1 antibody (Cytiva, Marlborough, MA, USA) immobilized CM5 chips (Cytiva, Marlborough, MA, USA). Anti-His IgG1 antibody immobilization procedure was applied by an amine coupling kit based on the manufacturer guide (Cytiva, Marlborough, MA, USA). His-Tagged FcRn (Sigma-Aldrich, St. Louis, MO, USA) protein and all other charge variants or whole molecule samples were prepared in 1× HBS-EP pH 6.0 running buffer with three-fold dilutions (15 nM, 5 nM, 1.66 nM). Recombinant His-tagged FcRn molecule was captured on the active flow cell for 120 s with 10 µL/min flow rate at 22 °C. A blocked flow cell was used as a blank reference during all measurements. Samples were injected over both flow cells (active and blank) at a 30 µL/min flow rate for 120 s, followed by the dissociation phase of 900 s with the running buffer. The chip surface was regenerated with 1× HBS-EP buffer (pH 7.4) for 60 s. Blank buffer injections were also performed on both flow channels, later subtracted from the active surface data before the fitting. The SPR data were presented as the mean value, calculated from at least 3 measurements per sample. One-way analysis of variance, ANOVA, revealed the statistically significant differences between the fractionated sample pairs (p < 0.05 was considered significant and p < 0.005 was considered highly significant). The results were evaluated with Biacore Evaluation Software (3.0 Biacore T200, Shrewsbury, MA, USA) using the steady-state [27,28] and two-state binding models [29,30].

2.5. FcγRIa Binding Assay

The interactions between Fc(RIa and the samples were analyzed using the Anti-His capture method on antibody immobilized CM5 chips (Cytiva, Marlborough, MA, USA). Anti-His IgG1 antibody immobilization procedure was applied by an amine coupling kit based on the manufacturer guide (Cytiva, Marlborough, MA, USA). Immobilization levels were found at 8000 RU levels on active and blank flow channels. His-Tagged FcγRIa (R&D Systems, Minneapolis, MN, USA) protein and all samples were prepared in 1× HBS-EP pH 7.4 running buffer with three-fold dilutions (90 nM, 30 nM, 10 nM). Recombinant His-tagged FcγRIa (0.2 ug/mL) molecule was captured on the active flow cell for 60 s with a 10 µL/min flow rate at 22 °C. A blocked flow cell was used as a blank reference during all measurements. Samples were injected over both flow cells (active and blank) at a 30 µL/min flow rate for 60 s, followed by the dissociation phase of 900 s with the running buffer. The chip surface was regenerated with 10 mM glycine pH 1.5 buffer for 60 s. Blank buffer injections were also performed on both flow channels, later subtracted from the active surface data before the fitting. The SPR data were presented as the mean value, calculated from at least 5 measurements per sample. One-way analysis of variance, ANOVA, revealed the statistically significant differences between the samples (p < 0.05 was considered significant and p < 0.005 was considered highly significant). The KD results were evaluated with Biacore Evaluation Software (3.0 Biacore T200, Shrewsbury, MA, USA) using the steady-state binding model and the 1:1 Langmuir binding model for kinetics [31].

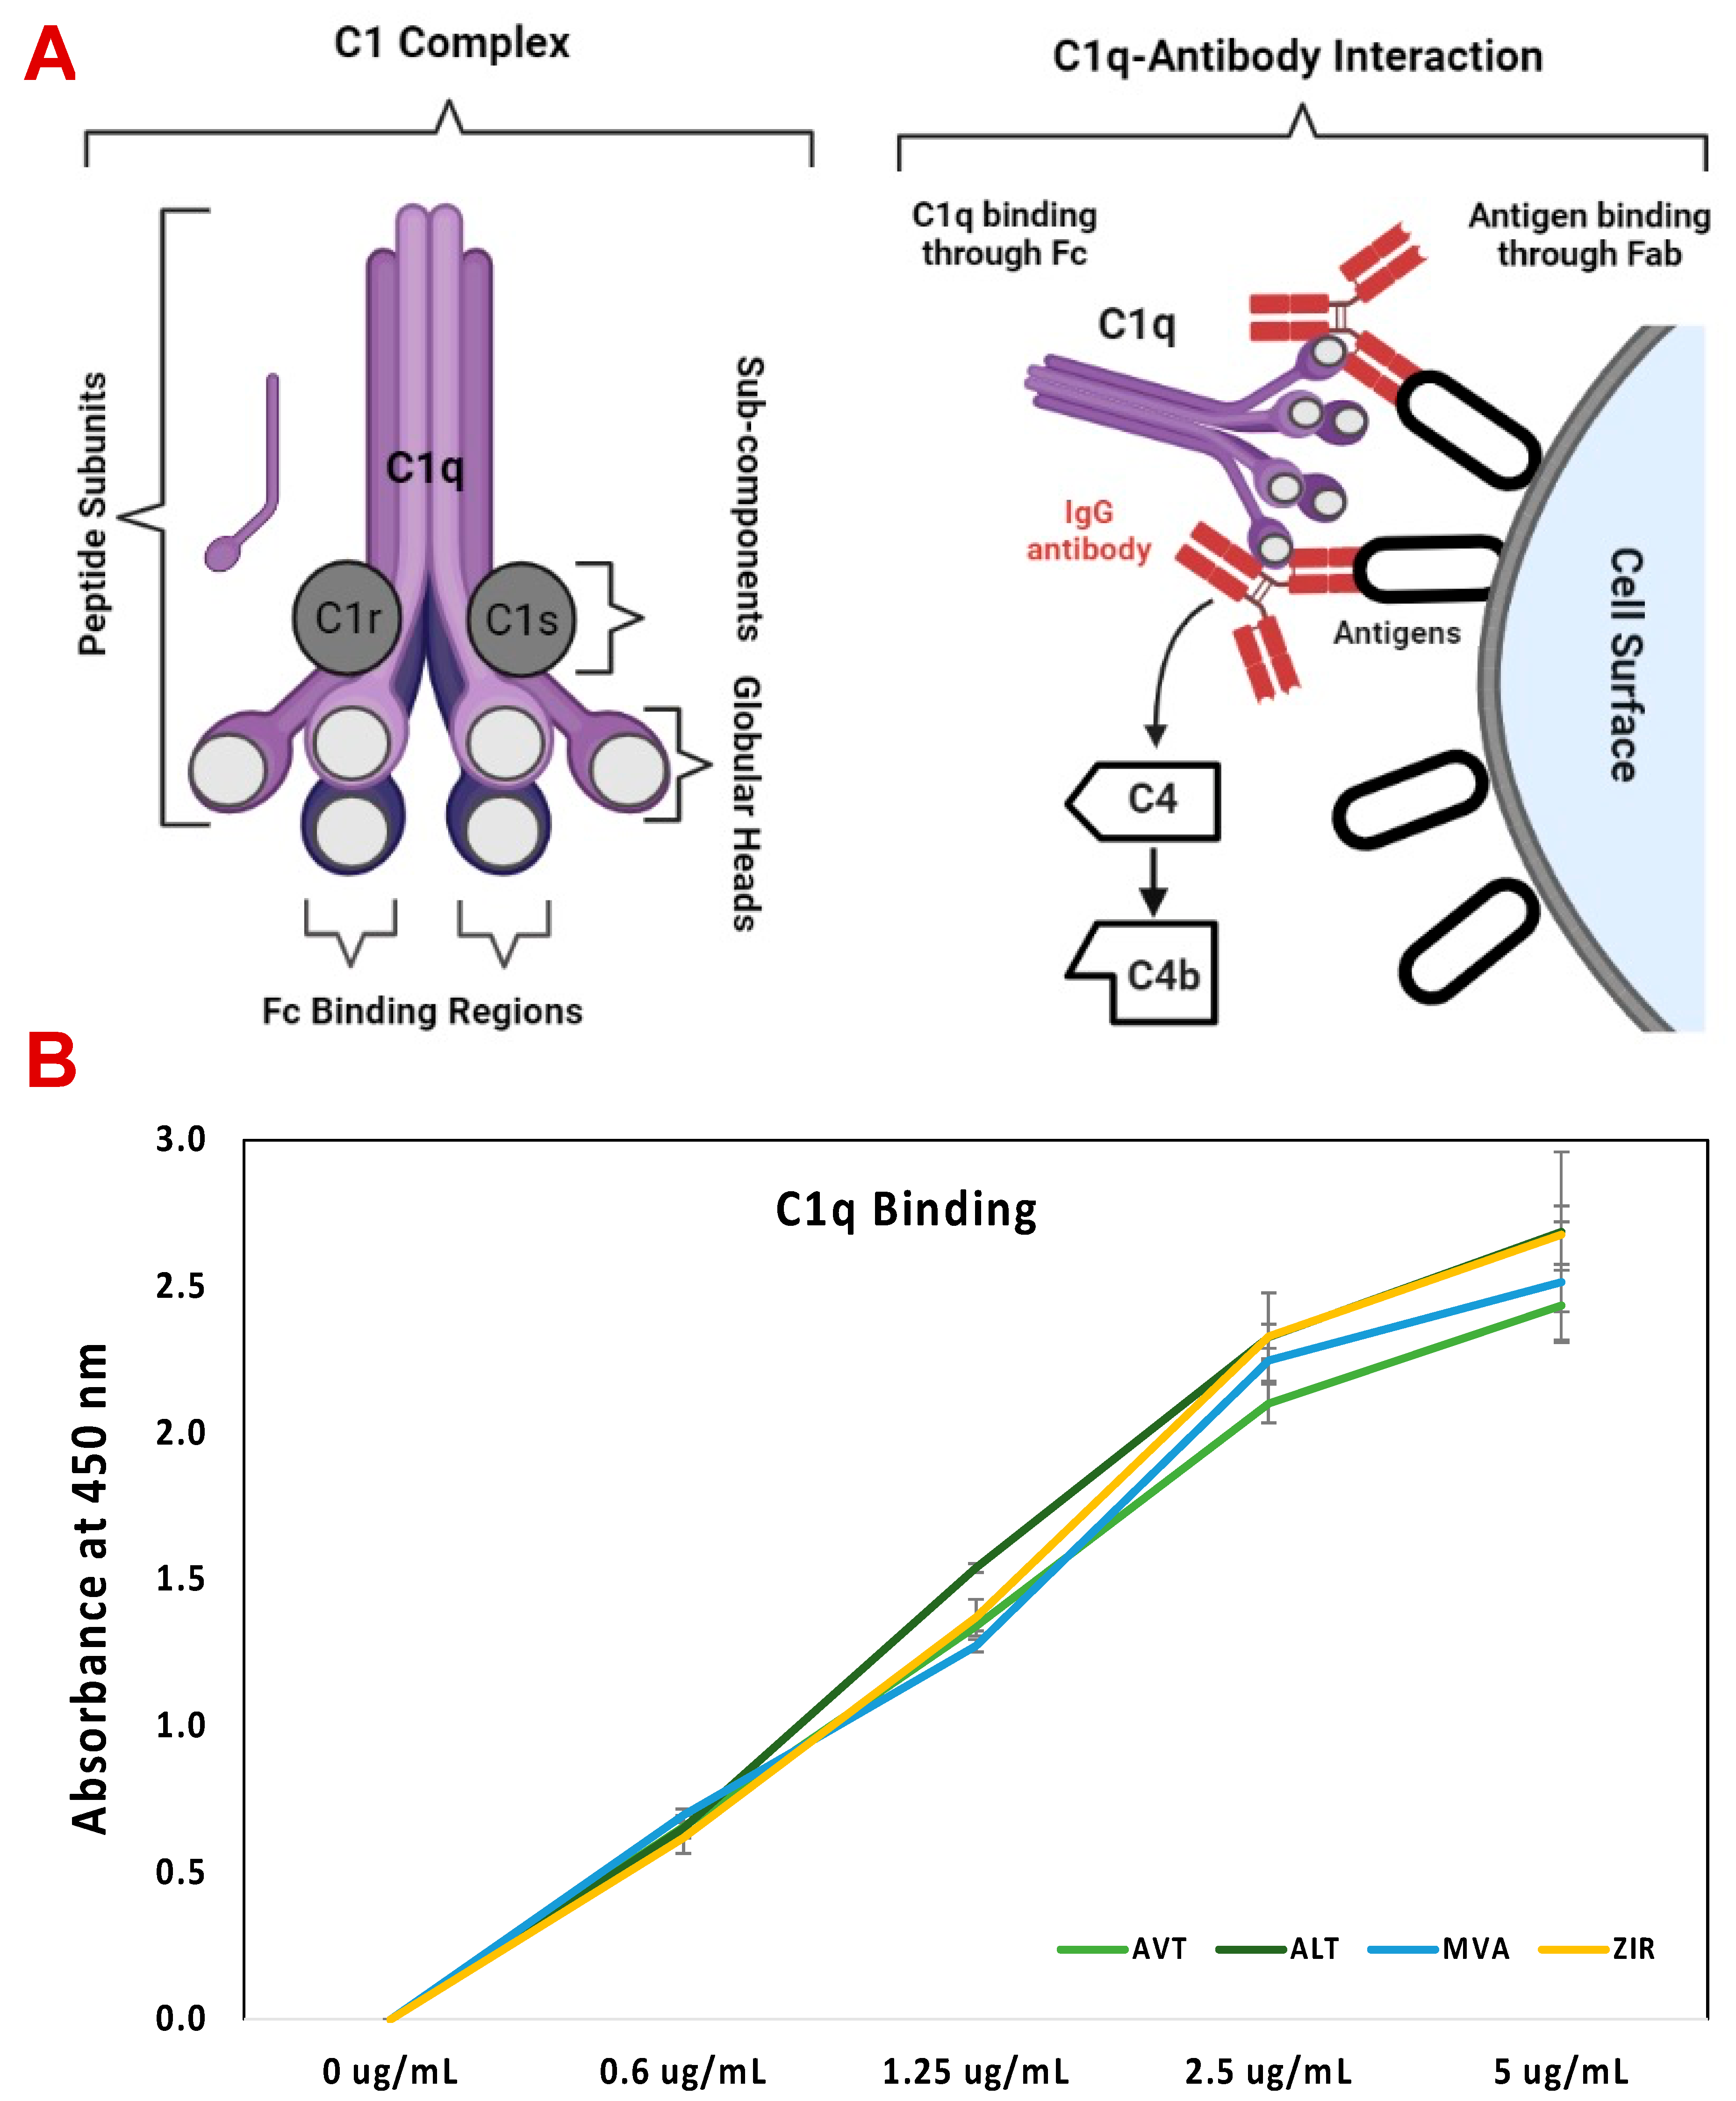
2.6. C1q ELISA Assay

The direct ELISA method was used to evaluate the binding affinity of samples to the C1q molecule. In this method, an Antibody Pair Buffer kit containing coating buffer, blocking buffer (Assay buffer 5×), washing buffer (25×), chromogen, and stop solution was used (CNB0011, Invitrogen, Waltham, MA, USA). Antibodies (0–5 ug/mL) diluted in coating buffer (contains 50 mM carbonate buffer and 0.1% azide, pH 9.4) to Nunc-Immuno 96-well plate with high binding capacity (168194, Thermo Scientific, Waltham, MA, USA) were placed in triplicate and incubated overnight at +4 °C. After the plate was washed once with 1× wash buffer, blocking was done with 1× assay buffer by agitation at 500 rpm for one hour at room temperature (RT) to block the remaining binding sites. Then, human C1q protein (C1740-Sigma Aldrich, St. Louis, MO, USA) prepared in 1× assay buffer at a 2 ug/mL concentration was added to the plate and incubated for 2 h at RT. After washing the plate five times with 1× wash buffer, it was treated with HRP-conjugated anti C1q polyclonal antibody (157277, Invitrogen, Waltham, MA, USA) diluted 1:1000 at RT for 2 h. After washing with 1× wash buffer five times, the substrate/chromogen mixture was added. The reaction was stopped with a stop solution, and absorbance was measured at 450 nm using a microplate reader (Bio-Rad, Hercules, CA, USA).

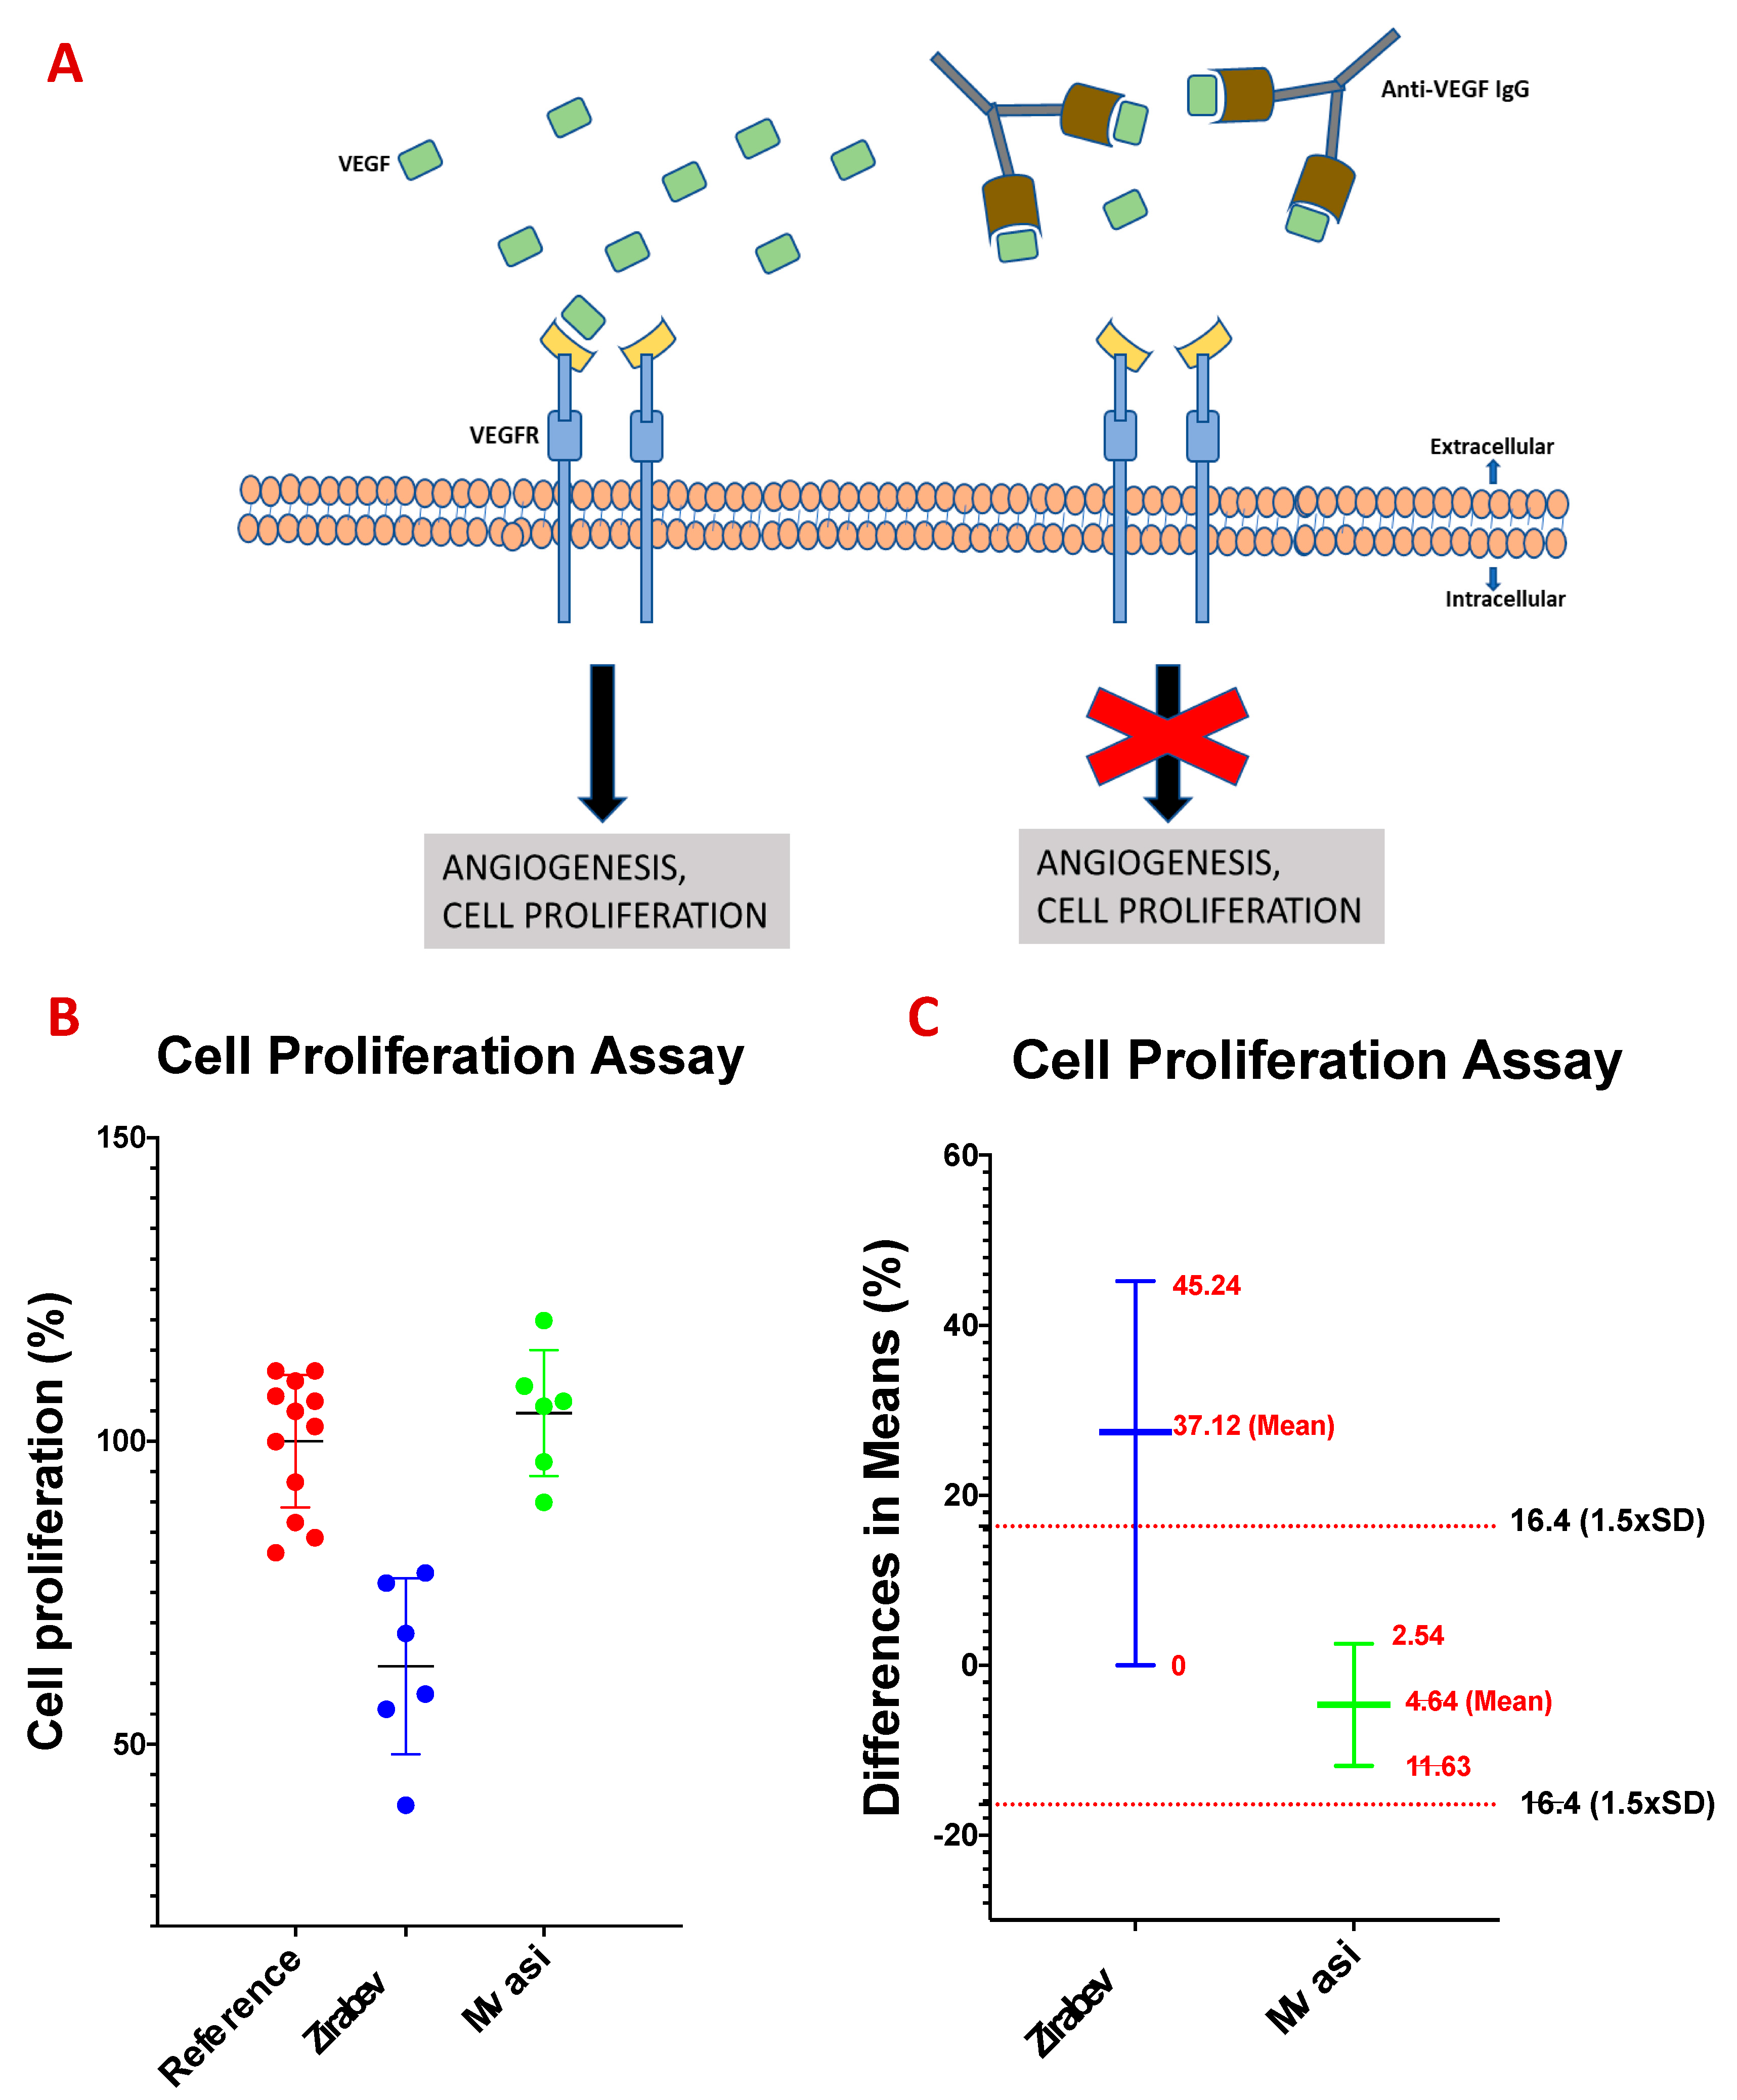
2.7. Cell Proliferation Assay

Primary Umbilical Vein Endothelial Cells (HUVEC) (ATCC PCS-100–013, Manassas, VA, USA) were used for cell proliferation studies. Cells were grown at 37 °C, 5% CO2 in Vascular Cell Basal Medium (ATCC® PCS-100-030, Manassas, VA, USA) supplemented with Endothelial Cell Growth Kit-VEGF (ATCC® PCS-100-41, Manassas, VA, USA). In addition, a vascular cell basal medium containing no growth factors such as VEGF, EGF, and FGF was used as the starvation medium. When the cells reached 80% confluency, subculturing was performed. HUVEC cells were counted before the cell proliferation studies, washed by centrifugation at 300× g for 5 min, and resuspended with a complete medium. 5 × 10³ HUVEC cells/well were inoculated into 96 well plates in 200 µL complete media. It was incubated at 37 °C overnight to allow the cells to adhere. The next day the complete medium was discarded, and the starvation medium that did not contain any growth factors was added. The cells were incubated at 37 °C for 24 h in a starvation medium to allow the proliferative effect of the VEGF growth factor in the complete medium to disappear. After 24 h, monoclonal antibodies were introduced onto the cells at concentrations of 5000 ng/mL, and VEGF was added at a concentration of 20 ng/mL per well. Cells treated with antibodies and VEGFs were incubated at 37 °C for 48 h. Comparison of the potency of originators and biosimilars was represented as relative cell proliferation (%), and similarity acceptance was assessed by statistical equivalence analysis.
CellTiter 96® AQueous One Solution Cell Proliferation Assay (MTS) (G3582, Promega, Madison, WI, USA) was used to determine the proliferation rates of cells after 24 h. The MTS assay is a commonly used test based on metabolic activity assay. 20 µL of MTS reagent was added per well and incubated for 4 h at 37 °C. In addition, the MTS reagent was placed in an empty well and used as a blank during the measurement. After 4 h of incubation, the absorbance values at 490 nm were measured using an ELISA microplate reader (Bio-Rad, Hercules, CA, USA).

3. Results and Discussion

3.1. Intact Protein Analysis of Bevacizumab and Its Biosimilars

The structural characterization of the bevacizumab originators, Avastin (AVT) and Altuzan (ALT), and its biosimilars, Zirabev (ZIR) and Mvasi (MVA), was initially performed by intact protein analysis using mass spectrometry. Intact protein analysis is one of the most critical structural elucidation tools for mAbs. The intact mAb analysis reveals the exact molecular weight of the sample. The method also helps to define the modifications that cause a significant molecular weight shift (>100 kDa), such as glycosylation (>1200 Da) and C-terminal lysine clippings (128 Da) [32]. As one of the best-studied modifications, glycosylation is found at the highly conserved Asn303 residue in each heavy chain of Bevacizumab (Figure 1A). It is already known that the major N-linked glycoform of Bevacizumab is a biantennary fucosylated and agalactosylated structure (G0F:G0F) with fully clipped C-terminal lysine residues (molecular mass: ~149.2 kDa) [33]. The most abundant glycoforms of Bevacizumab are G0F:G0F, G0F:G1F, G1F:G1F, respectively.
Avastin and Altuzan are originator products; they are used as reference samples in biosimilarity analysis. All products were analyzed by intact analysis under the same experimental conditions to determine whether there were any glycoform differences between the originator and biosimilar products. The reverse-phase (RP) chromatography performed before mass analysis provides information about the hydrophobicity of the analytes. The retention times of AVT, ALT, ZIR, and MVA on the RP column were the same in all runs and observed as 2.44 min (Figure 1B) without any shift, which shows that all molecules’ hydrophobicity was the same. Similar raw MS spectrums of multiple charged ZIR and MVA were observed compared to the ALT, as represented in Figure 2A,B. The overlay deconvoluted MS spectrums of each sample were shown, and the molecular mass of the main peak in each spectrum was listed in Figure 2C. The intact molecular mass range was determined according to mass values observed in these lots of AVT and ALT and accepted as 149,200.2–149,200.5 Da. The molecular masses of predominant peaks of ZIR and MVA were observed in this reference mass range.
All samples contained one dominant mass peak identified by matching the observed mass and expected theoretical mass with ±50 ppm mass error. G0F: G0F with clipped C-term lysine (149,200 Da) was identified as the predominant glycoform in all originator and biosimilar products. The percentage of G0F:G0F is between 35–50% in AVT and ALT, while it is 38–40% in ZIR and MVA samples. The other glycoforms, including G0F:G1F (149,362 Da), G1F:G1F (149,522 Da) and G0F:G0F, K1 (149,328 Da), which are lower than 20%, were accepted as minor glycoforms and several trace glycoforms (<5%) were identified in all samples in variable quantities. Figure 2D shows the percentage of the major and minor glycoforms found in the indicated samples. It is seen that the amount of the main glycoform varies around 10% even in the originator products, and both ZIR and MVA are in this range. The percentage of G0F:G0F, K1 (one unclipped Lys residue) was higher in Zirabev than in others, as reported in its FDA product quality review [34]. Although C-terminal lysine can lead to the formation of basic charge variants, it is known that it has no impact on in vitro potency, effector function, or pharmacokinetics of mAbs. [35,36].

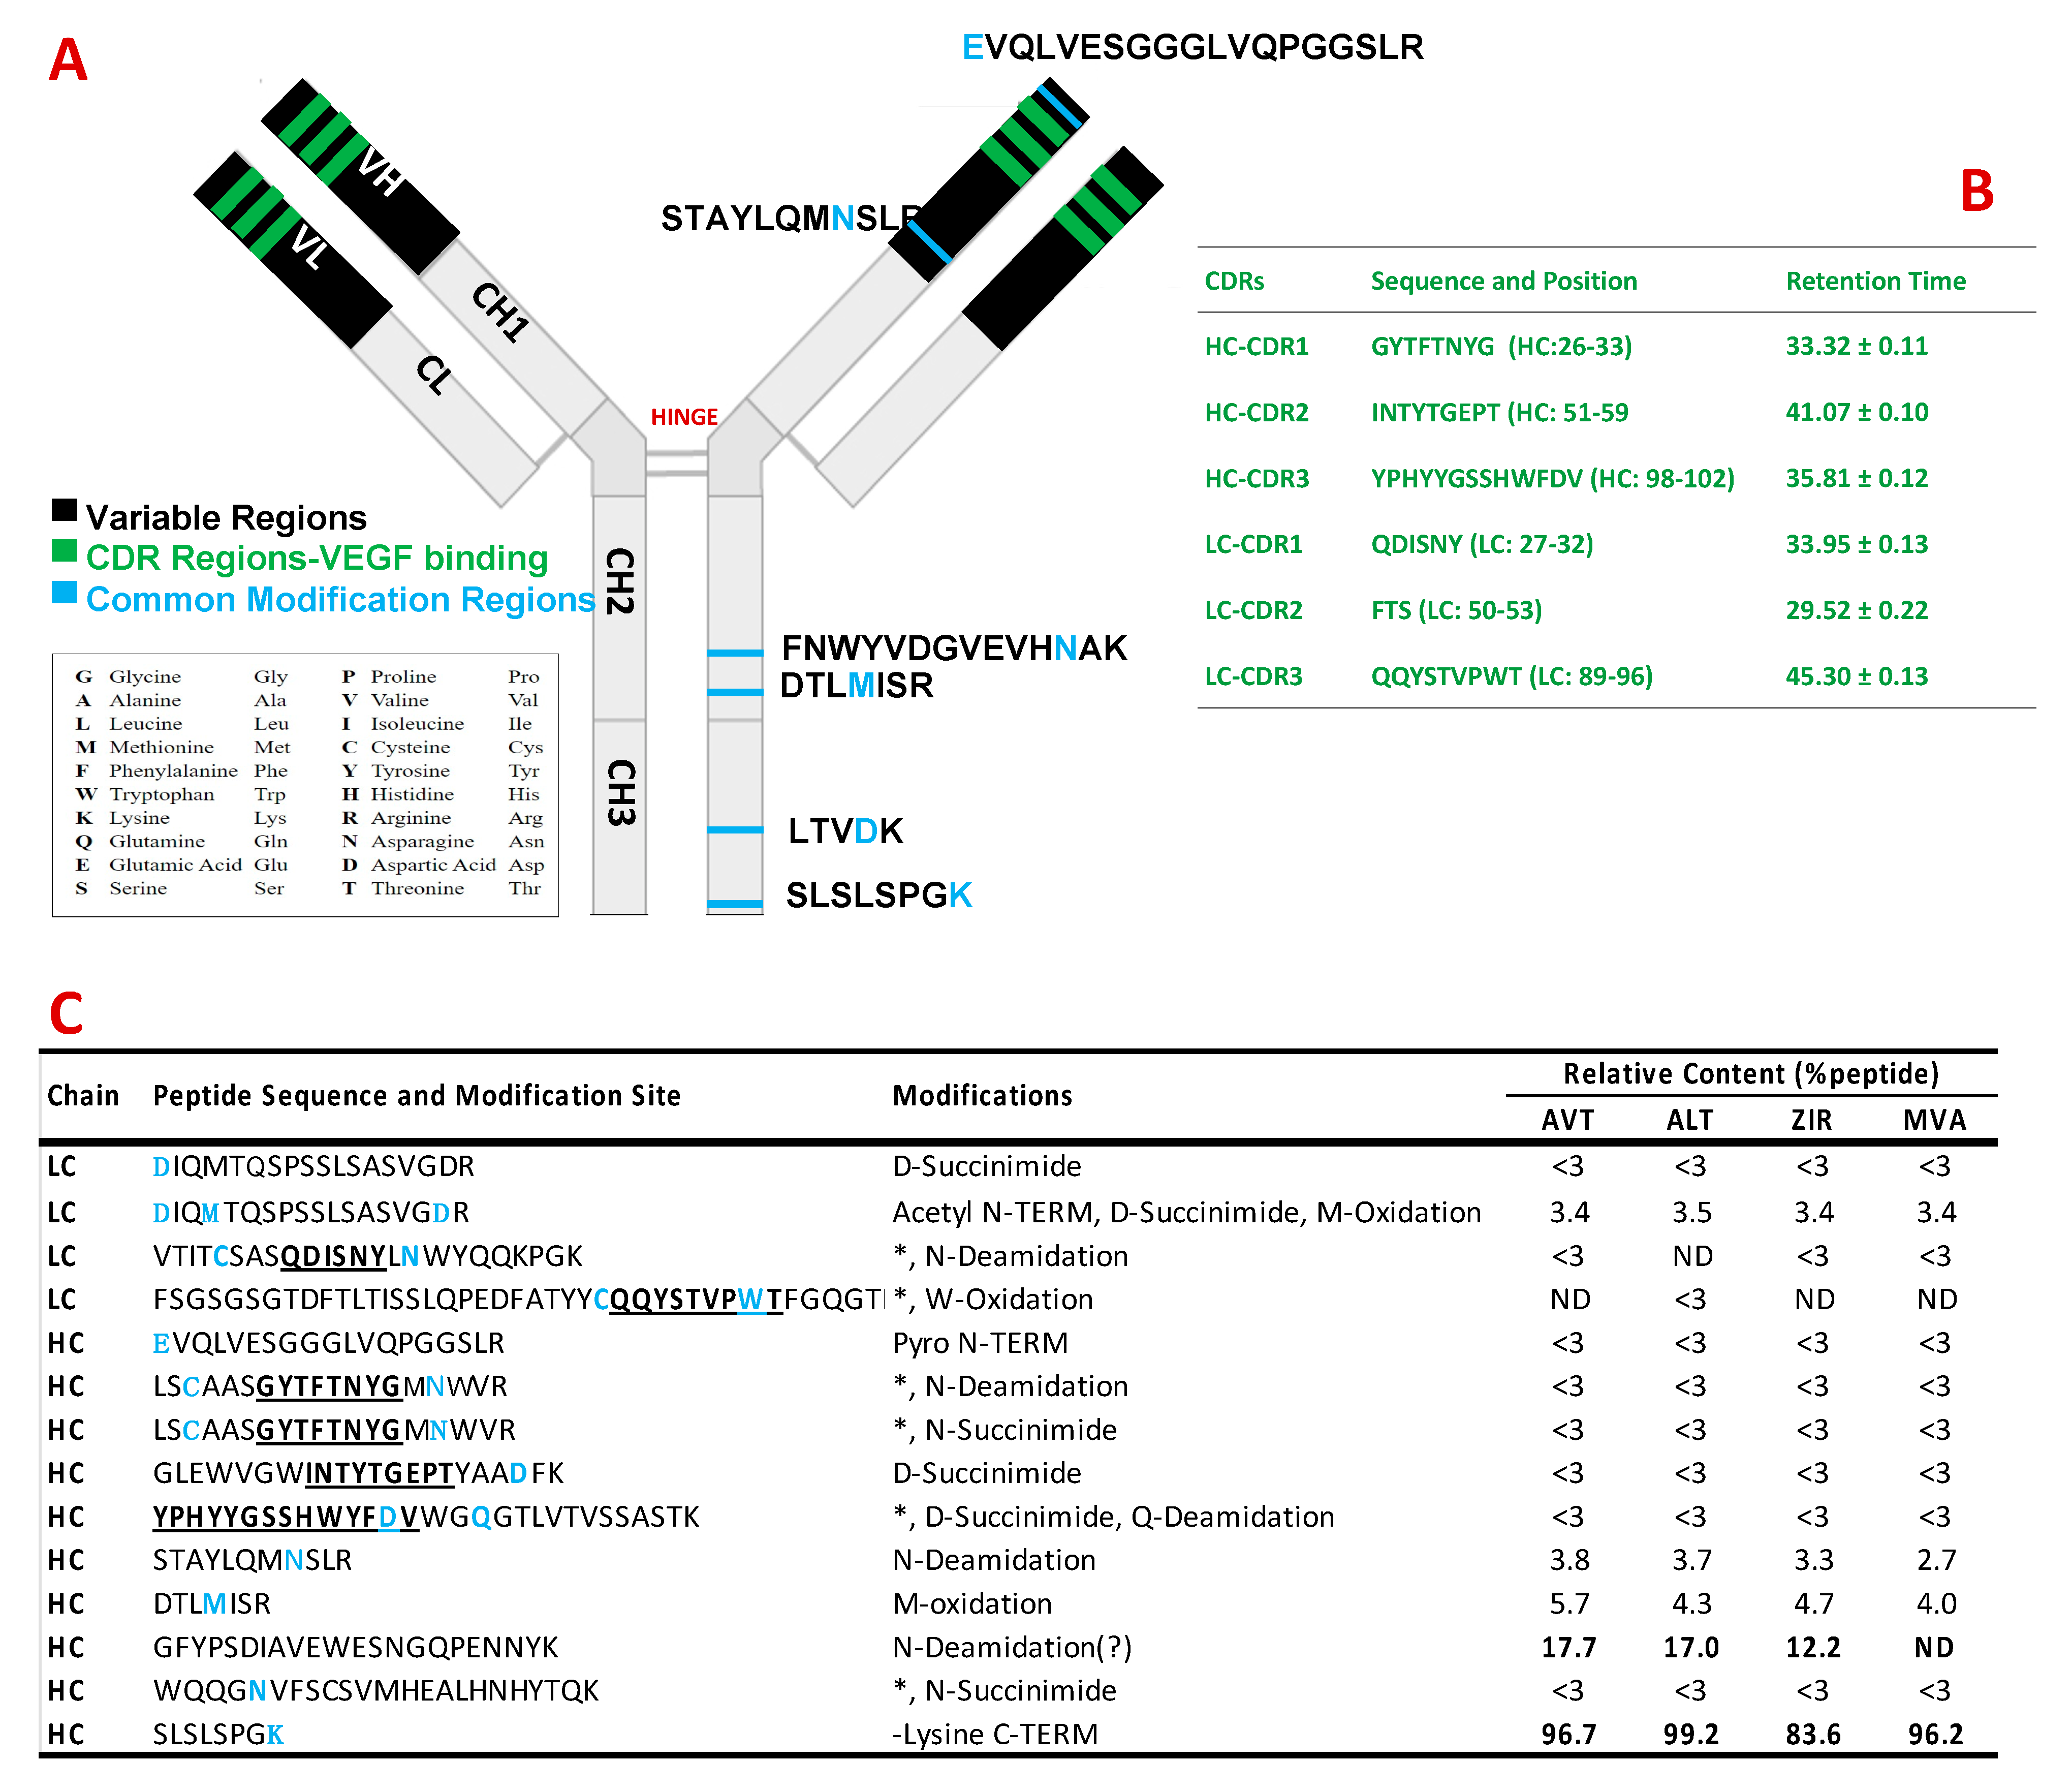
3.2. Peptide Mapping Analysis of Bevacizumab and Its Biosimilars

Peptide mapping is one of the crucial analyses to characterize the monoclonal antibodies’ primer structural features, including sequence variation, signal sequences, disulfide bonds, and posttranslational modifications (PTMs). Although intact (MS) analysis helps analyze several modifications, assigning chemical modifications with minor mass differences is challenging. Additionally, revealing the posttranslational modification site and rate by a reliable and accurate analysis is vital for developing and standardizing a monoclonal antibody since several studies have been reported that the modifications such as oxidation, deamidation, glycation, or N-terminal pyroglutamic acid can affect the stability, function, or immunogenicity of the antibodies [37,38]. Therefore, we performed the peptide mapping to compare the peptide profiles of the originator and biosimilar products and posttranslational modifications (PTMs) such as deamidation (+1 Da), oxidation (+16 Da), and N-terminal cyclization (−17 Da) were analyzed by data-independent acquisition LC-MSE method to reveal the differences beyond the samples. According to peptide mapping analysis of originator and biosimilar products, it was observed that the tryptic peptide profiles of all samples were similar (Figure 3A) without any extra unidentified peak. The criteria for identification of peptide sequence are (1) % matched primary ions (b/y ions) are greater than 10%, (2) mass error on peptide mass is less than 10 ppm, and (3) no in-source fragment. Even though the sequence coverage was enhanced by combining two or three different proteolytic enzymes for digestion, over 96% sequence coverage for heavy and light chains was achieved by only trypsin digestion (Figure 3B).
It has been extensively reviewed those chemical modifications such as deamidation or oxidation on mAbs may be caused by process or storage conditions and affect its stability or biological function [39]. In addition to the types, the site of modifications, mostly related to their chemical or physical structure, has great importance in estimating their possible effect [40]. For example, the antigen-binding capacity of an IgG1 antibody is usually not affected by oxidation since the most susceptible residues for oxidation are found in the CH2 domain [41]. The Met oxidation formed in this domain primarily affects the interaction with FcRn or Fcγ receptors [29]. Figure 4A is a schematic illustration of the critical modification sites. Several prone sites in the constant region of IgG1 for specific modification are already known, such as “DTLMISR,” which contains Met residue, is the most prone site to oxidation, and a higher amount of deamidation is primarily seen in Asn residues of “GQPENNYYK” [9,37,42,43]. It is also reported that complementarity determining regions (CDRs) can undergo deamidation due to their flexibility or solvent exposure [44].
CDRs are the antigen-binding sites, and deamidation or other modifications in this region primarily lead to the loss of target binding and biological activity [38,39]. The sequence and position of CDRs of Bevacizumab are listed in Figure 4B. Three CDRs in heavy chains and three CDRs in light chains were identified (100% sequence coverage) with a maximum 0.25 min retention time shift. No significant modification was determined on the CDRs of any samples. At the same time, minor modifications (<3%) were observed, including Trp oxidation on LC-CDR3 and Asp succinimide on HC-CDR3 Figure 4B,C. In the FDA product quality review report of Zirabev, the risk categories of all assays and attributes are listed in a table [34]. According to the tier-based approach, intact and peptide mapping analyses are suggested as tier 3, the lowest risk ranking. In both intact and peptide mapping analyses performed under the same conditions, there was no significant difference between biosimilars and originators (except for C-terminal Lys clipping).

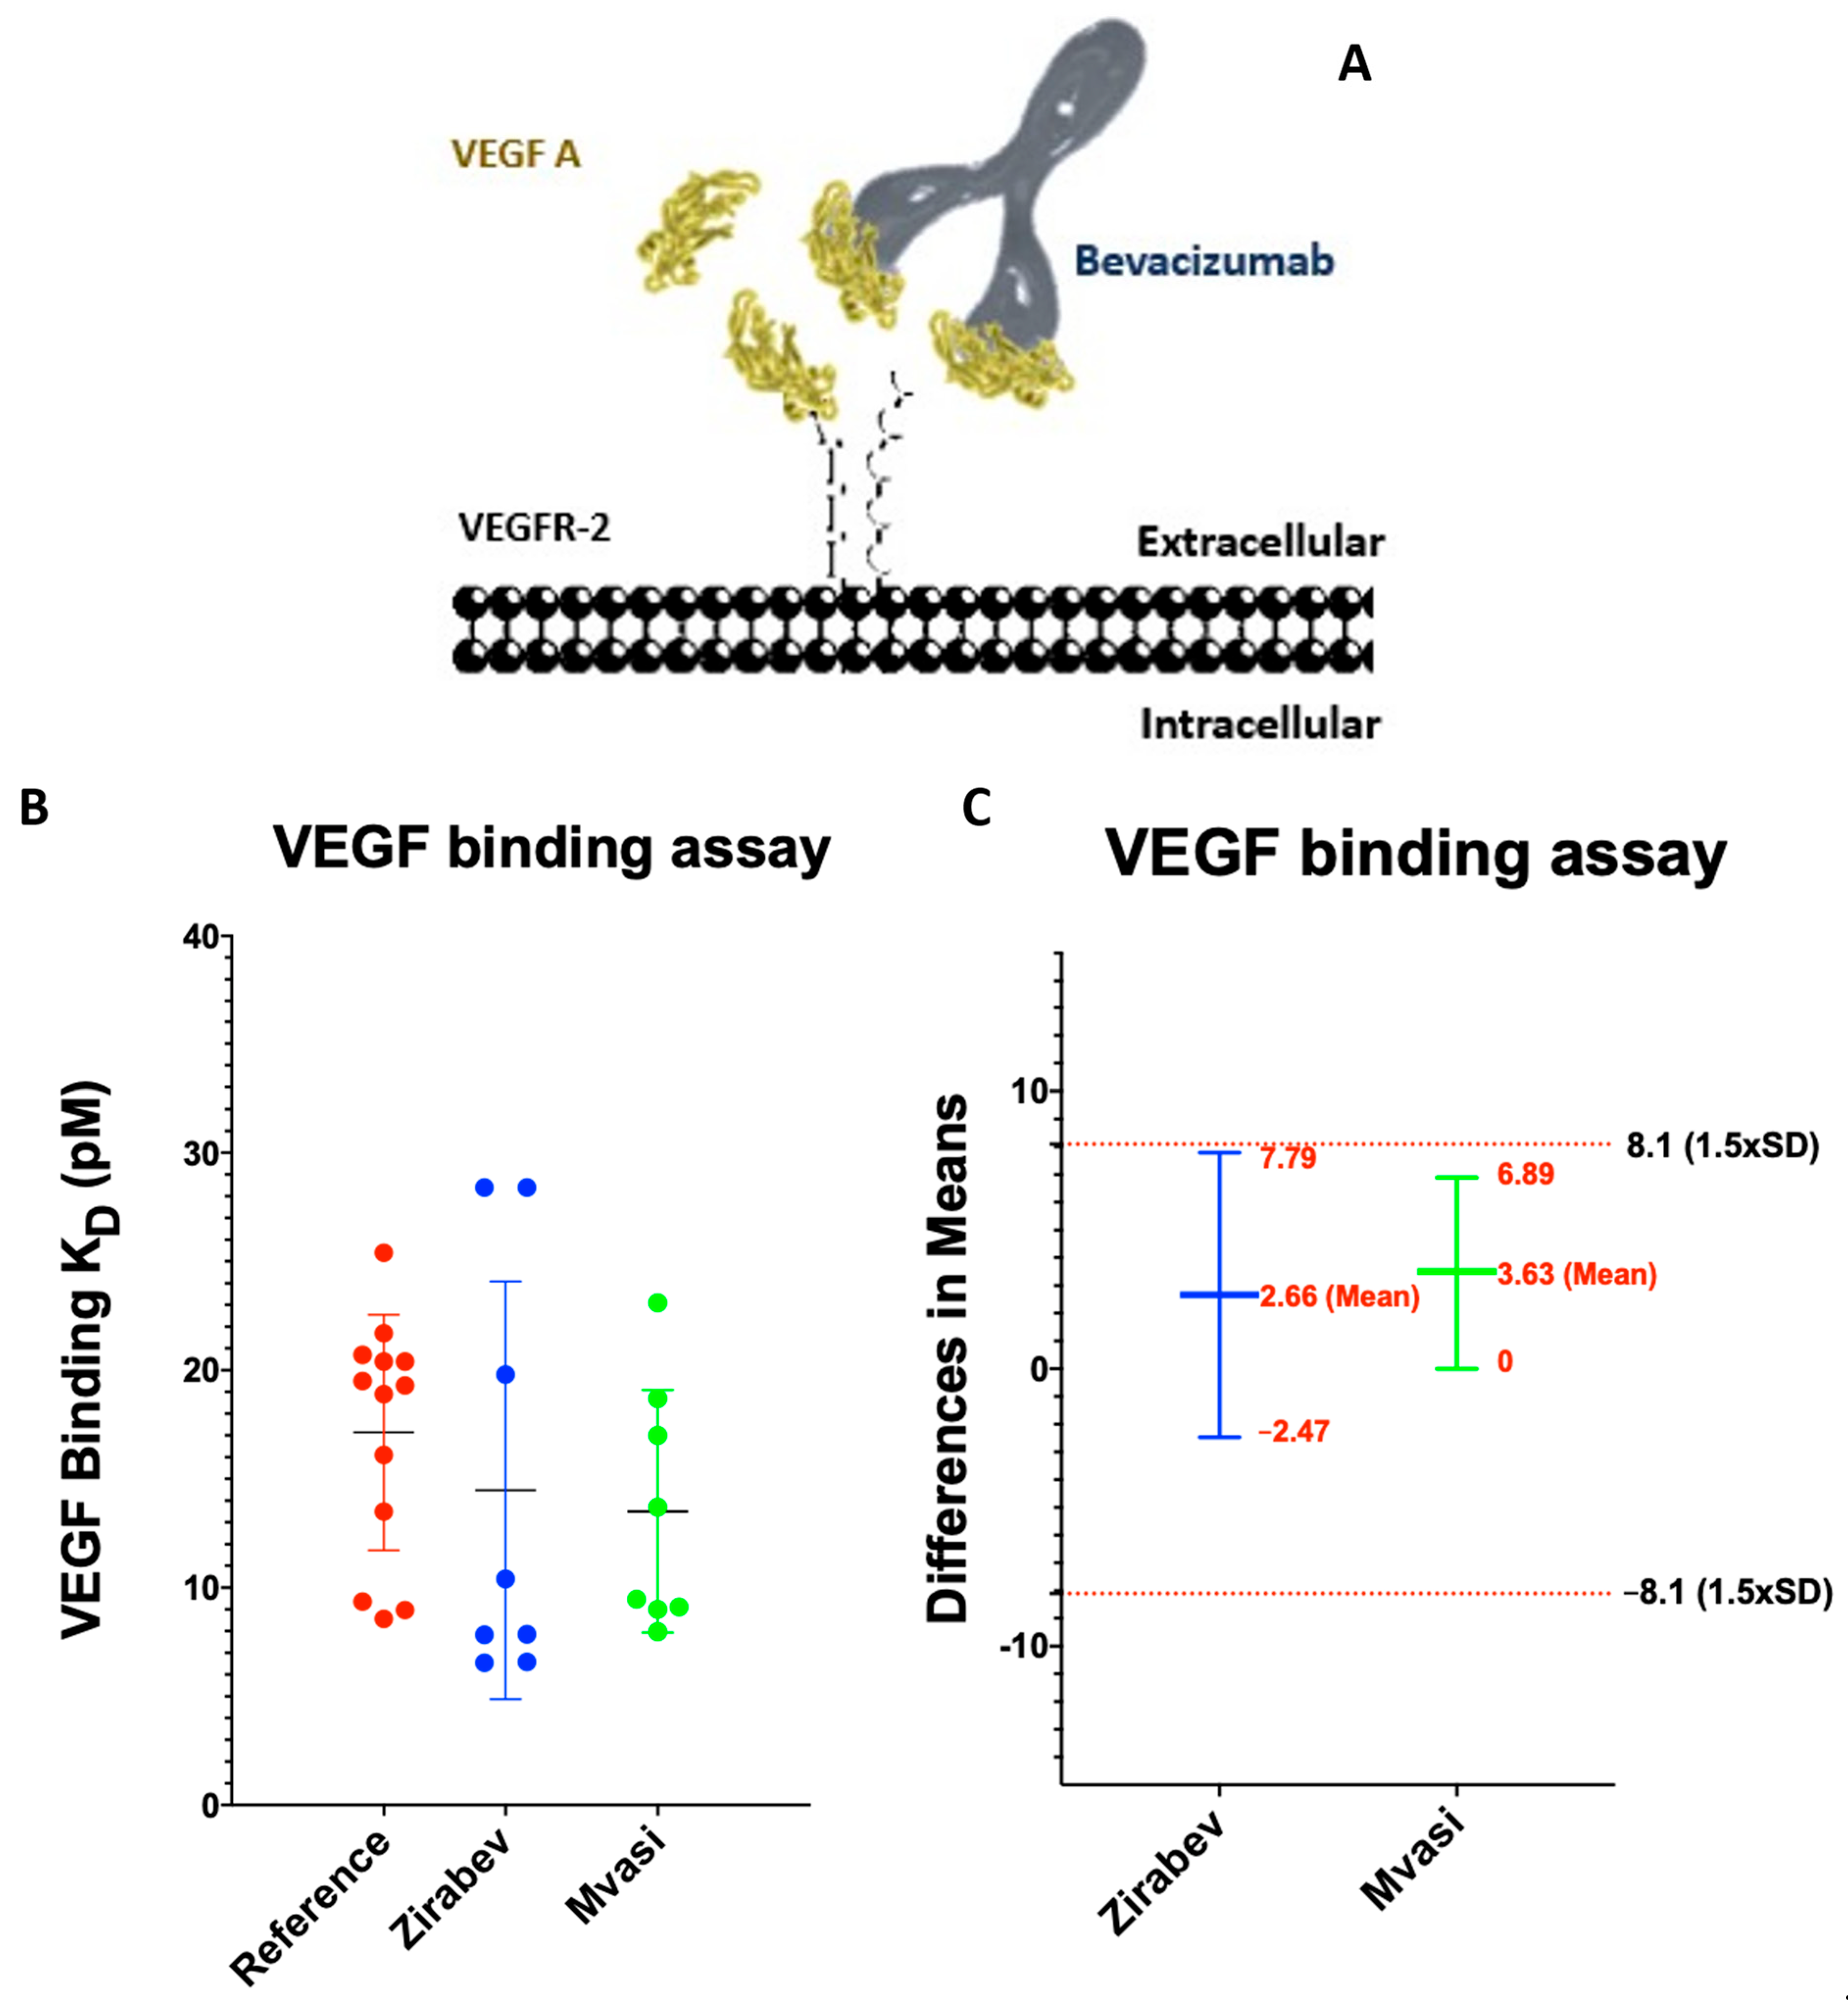
3.3. VEGF Binding Assays of Bevacizumab and Its Biosimilars

Bevacizumab is an IgG1 antibody that binds VEGF-A with their Fab region to neutralize them by preventing their interaction with their receptor, VEGFR, on the cell surface [45] (Figure 5A). Although the biosimilar was “similar” to the originator in terms of structure and function, they are products of different processes, and it is known that the binding kinetics can be affected by the heterogeneities formed during manufacturing [46,47,48]. Enzyme-linked immunosorbent assay (ELISA) [49,50], biolayer interferometry (BLI) [25,51], KinExA [52], and SPR-based methods [53,54] are commonly utilized to investigate antibody-antigen interactions. The SPR technique is robust and reliable for characterizing the binding events in real-time [55]. In this study, SPR revealed the binding affinities of originator and biosimilar drugs.
According to the tier-based approach suggested by FDA, VEGF-A binding is evaluated in the tier 1 category, which means the highest risk in terms of product quality. In this category, the analytical biosimilarity range is usually presented as the “mean ± 1.5 *SD” since there is enough reference product sampled from several different lots [34]. It has been reported that Fab mediated binding assays, including the VEGF, were performed by ELISA for Zirabev and Mvasi. In previous studies, the VEGF-165A binding constant for bevacizumab was reported as 58 pM [56], 321 pM [36], and between 75.4–4456 pM at different SPR chip configurations [53]. In the current study, the binding constants were 19.93 ± 3.05, 14.74 ± 6.03, 14.48 ± 9.61, 13.51 ± 5.58 pM for AVT, ALT, ZIR, and MVA, respectively. All samples were analyzed with three replicates. The graph in Figure 5B represents the distribution of individual KD values in each group. The equivalence test was used in the similarity assessment of Zirabev and Mvasi to originators (Figure 5C). According to analysis, both biosimilars were found statistically equivalent and not different.
It is reported that the extra lysine residues at C-terminal do not affect the antigen binding of the mAbs to their target [36,57]. On the other hand, it is known that the modifications such as deamidation on the CDR region can lead to poor binding of mAbs to their target [38,58]. Surprisingly, the binding kinetics of all products for VEGF seem unaffected by the several minor modifications (<3%) such as deamidation, succinimide formation, or tryptophan oxidation observed in the CDR3 region of all originators (AVT, ALT) and biosimilars (ZIR, MVA) of Bevacizumab (Figure 4C).

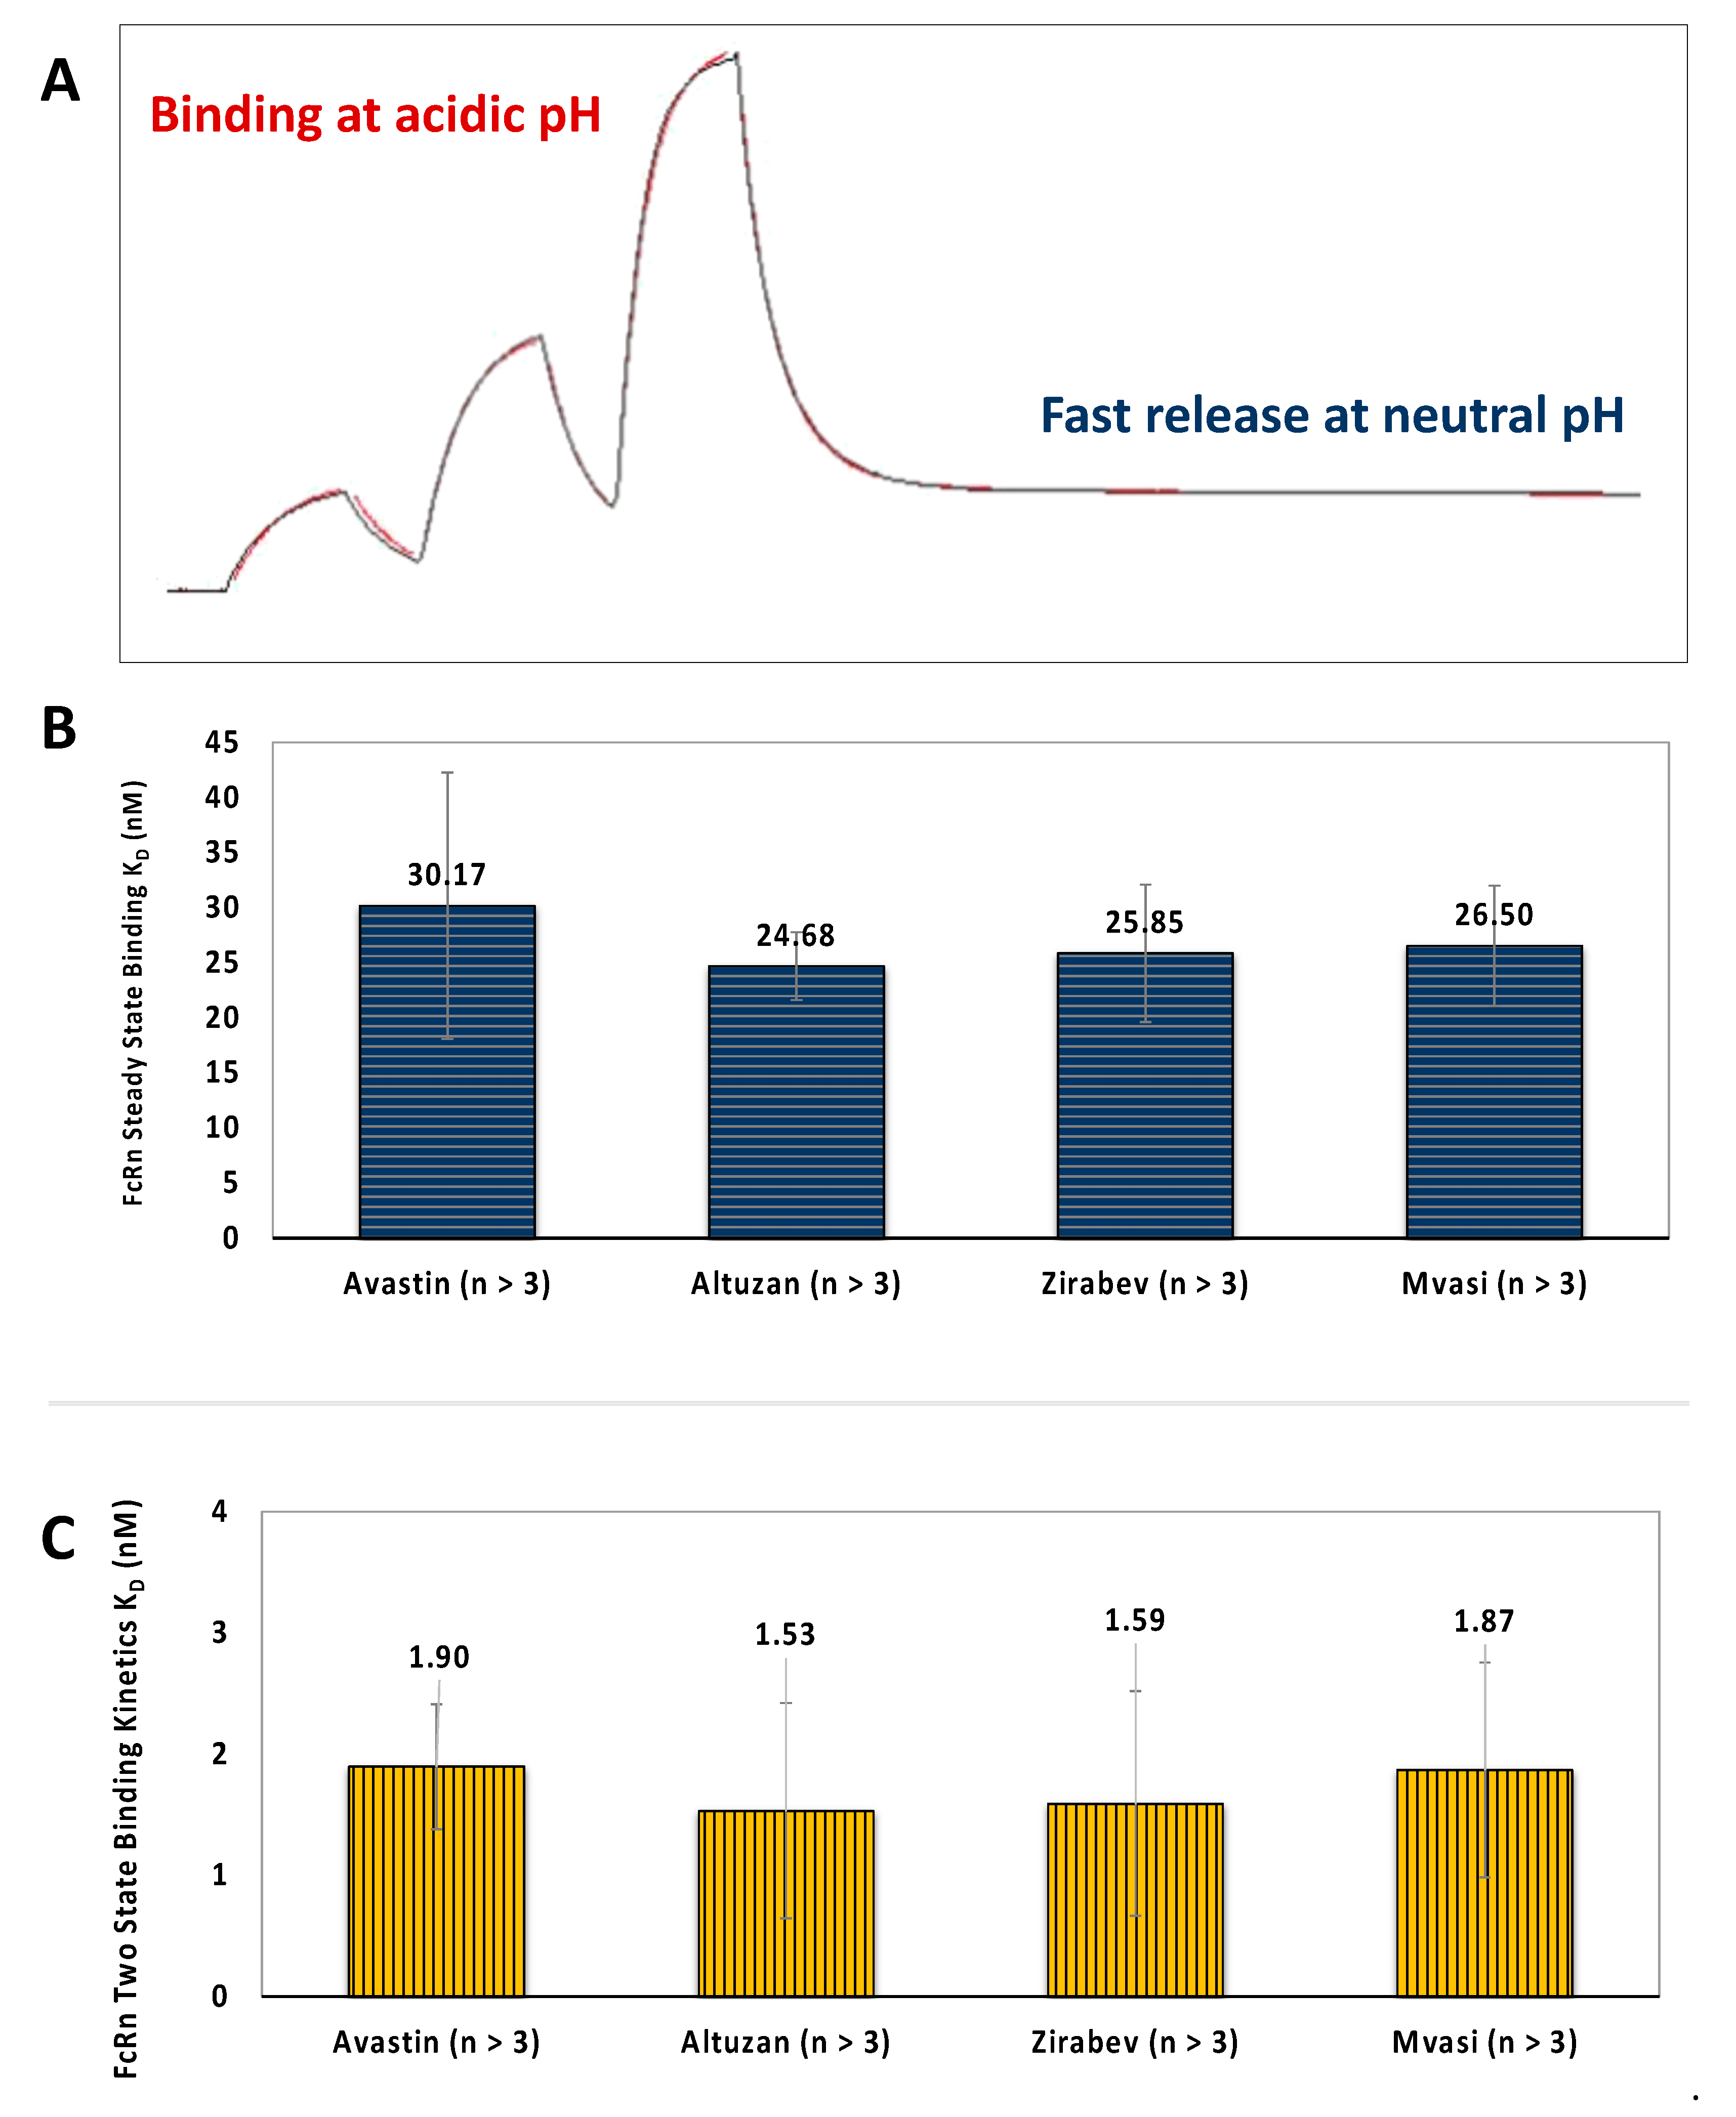
3.4. FcRn Binding Assays of Bevacizumab and Its Biosimilars

The FcRn is a cell surface receptor preventing IgG degradation in endosomes and extends the IgG molecules’ half-life in vivo by binding to Fc parts of IgG molecules in a pH-dependent manner [59]. For this reason, the analysis of FcRn kinetics differs from other Fc receptors. As reported in product quality reviews of biosimilars, the AlphaScreen method is used for Mvasi, and SPR is used for Zirabev similarity analysis. In this study, all products were investigated by the SPR against captured FcRn ligands to reveal the binding patterns among different samples.
In an SPR-based FcRn-IgG interaction study, the affinity values were reported between 6.58 ± 0.12–49.6 ± 1.78 nM for recombinant IgG and between 9.99 ± 0.43–71.9 ± 15.7 nM for human IgG1 [60]. The FcRn binding interaction of mAbs by SPR is considered in the tier 2 category, with lower risk on the product quality. The analytical biosimilarity range for this interaction was accepted as mean ± 3 × SD [34]. In the current analysis, the overlaid sensograms obtained from all samples at different pH conditions were represented in Figure 6A. KD values for bevacizumab-FcRn interactions were calculated by averaging 3 separate analyses and determined as 30.17 ± 12.13, 24.68 ± 3.11, 25.85 ± 6.25, and 26.5 ± 5.47 nM for AVT, ALT, ZIR, and MVA, respectively, by steady-state binding analysis (Figure 6B). In contrast, they are calculated as 1.9 ± 0.52, 1.53 ± 0.89, 1.59 ± 0.93, and 1.87 ± 0.89 nM for AVT, ALT, ZIR, and MVA by the Two-State Kinetic Binding model (Figure 6C). In both analyses, there were no significant differences between originator AVT, ALT, and their biosimilars ZIR and MVA.
It is known that several posttranslational modifications, such as methionine oxidation, can reduce the mAb’s interaction with the FcRn receptor by leading to conformational changes in the structure [29,61,62]. On the other hand, deamidation was shown to increase the affinity of the mAbs to the FcRn [63]. Our analysis shows that the modifications even higher than 3% in the Fc region, including DTLMISR oxidation or PENNY deamidation, may not affect the FcRn binding capability of Bevacizumab.

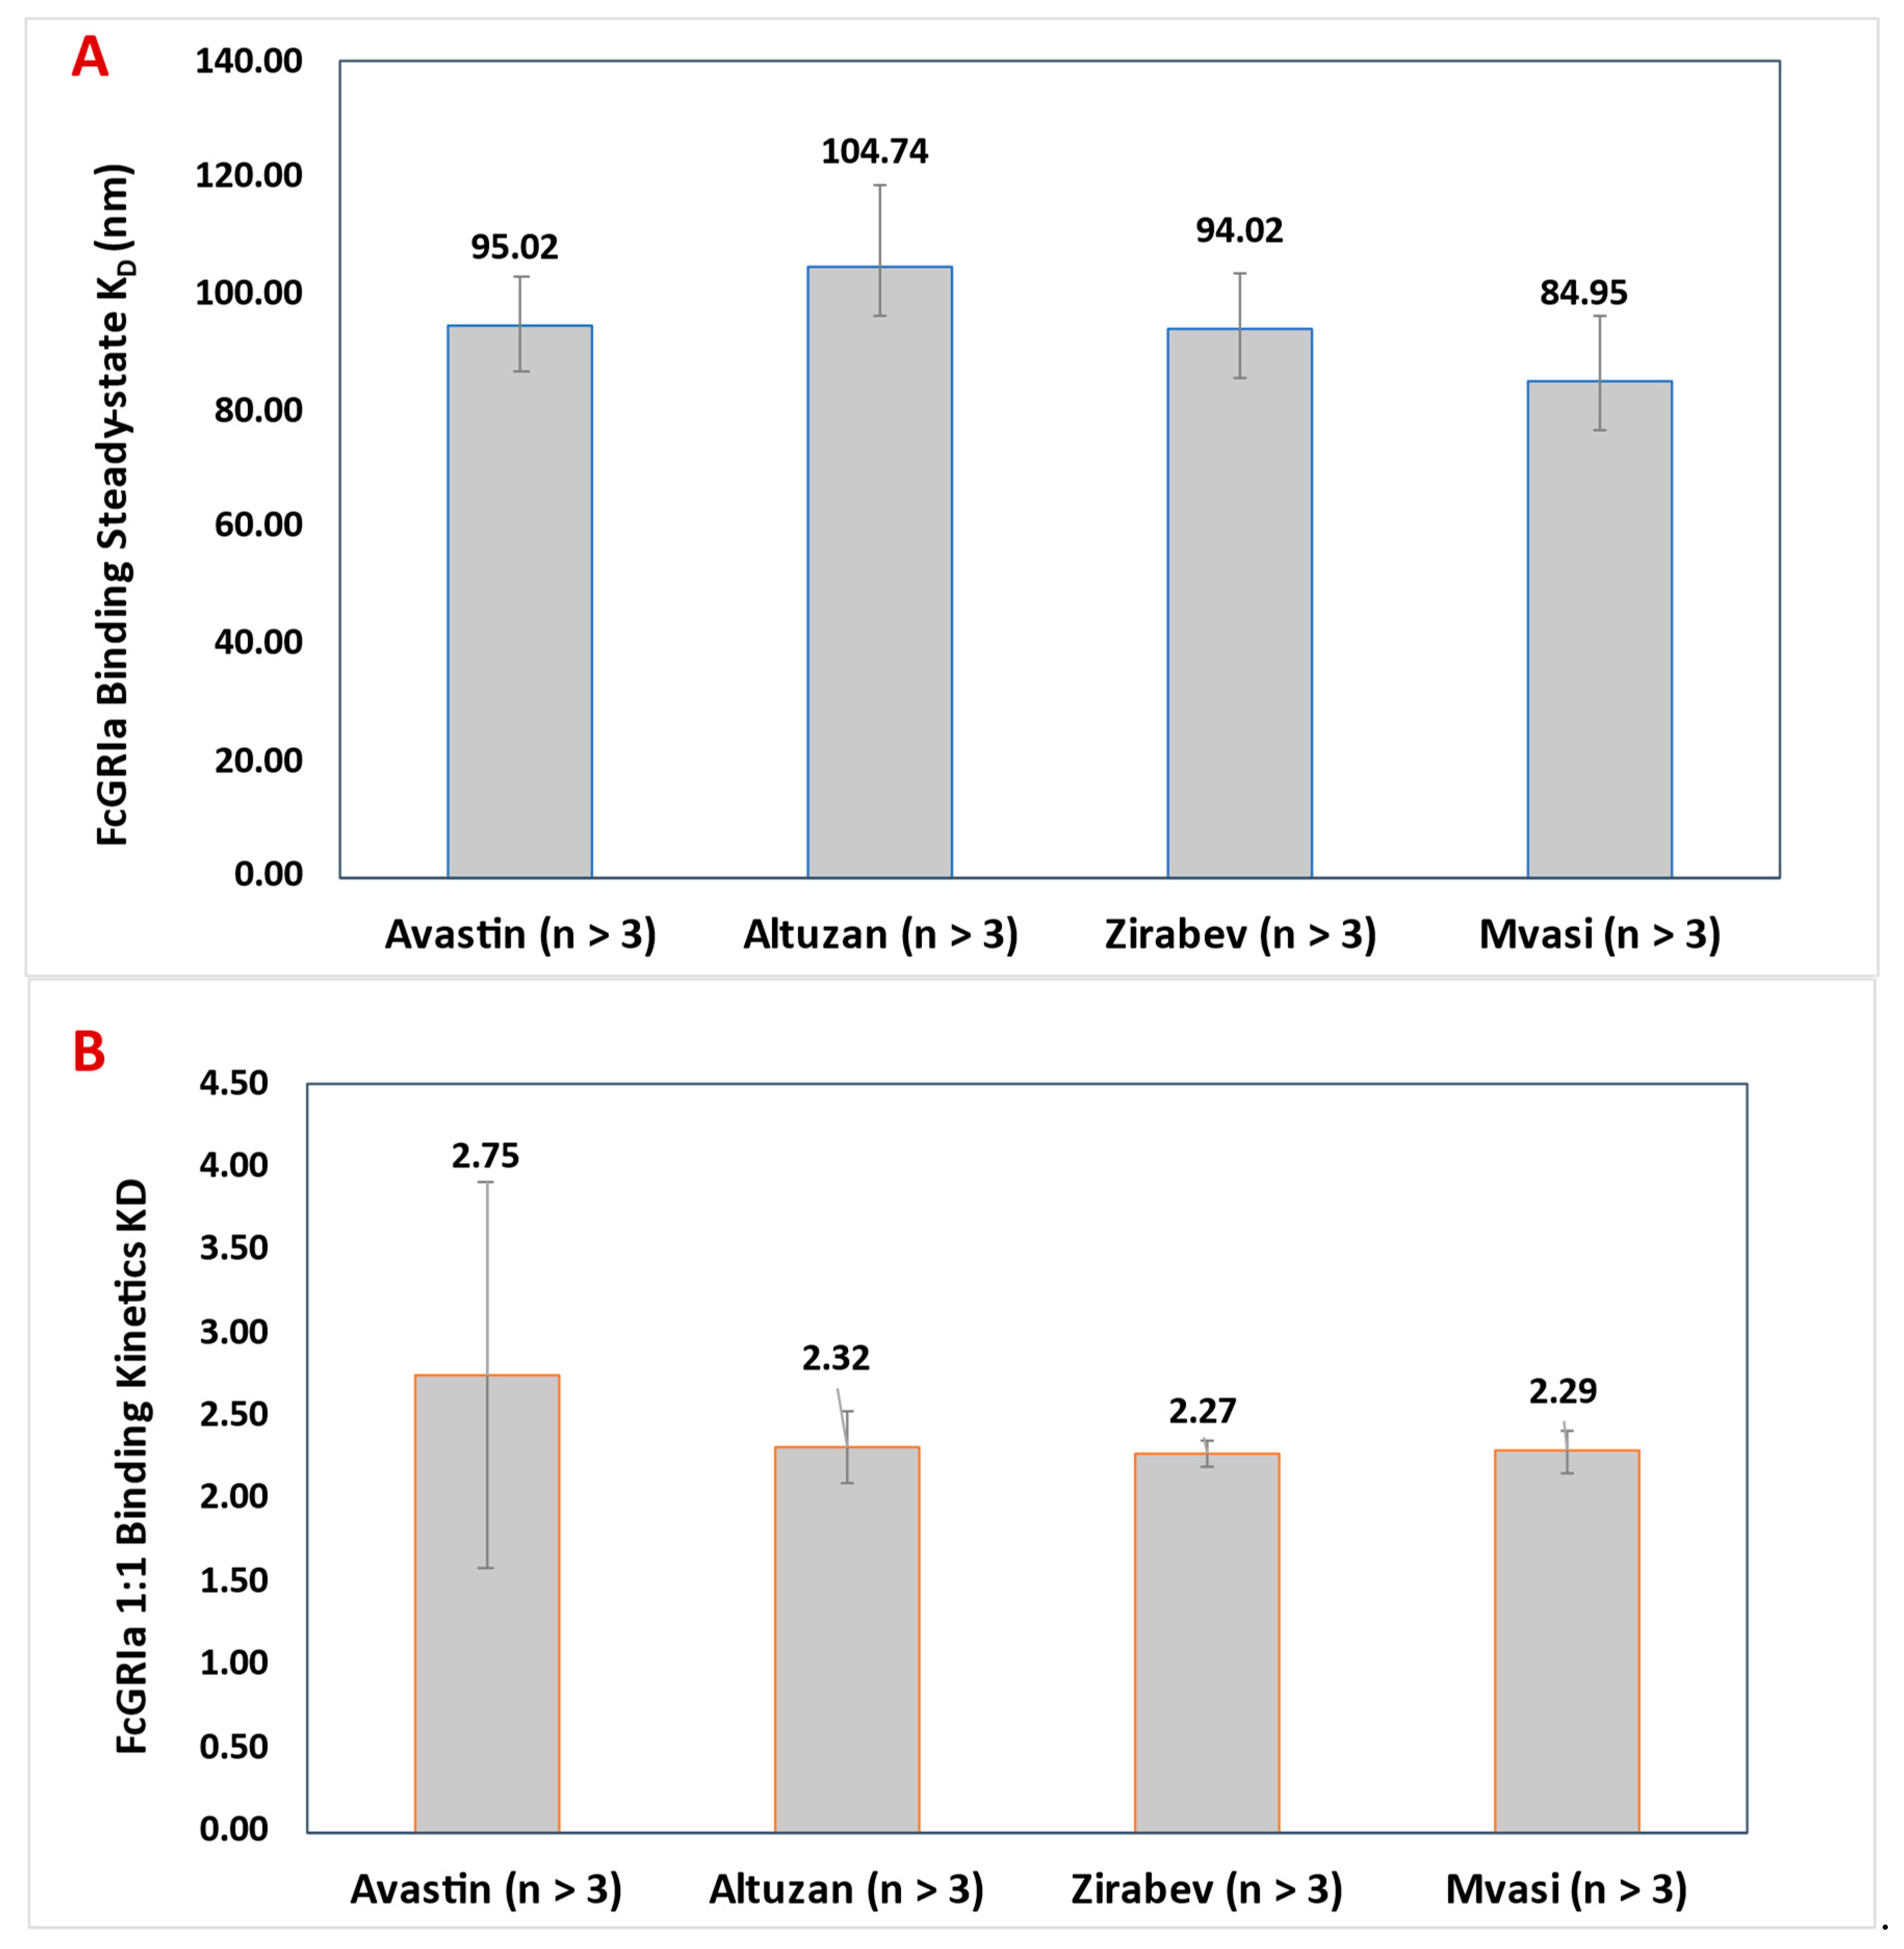
3.5. FcγRIa Binding Assay of Bevacizumab and Its Biosimilars

FcγRs are responsible for the effector functions in the immune system through their interactions with the Fc part of IgG [64,65]. FcγRIa has the highest affinity to IgG1 among other FcγRs (FcγRIIa, FcγRIIb, and FcγRIIIa). It is expressed on monocytes, macrophages, neutrophils, and dendritic cells and activates the release of pro-inflammatory molecules and phagocytosis of antibody-coated complexes [65]. In contrast to FcγRIIa and FcRIIIa, FcγRIa could bind monomeric IgGs without forming antigen: IgG complexes [66]. Bevacizumab is reported as it has no effector activity through their interactions with FcγRs [33,67]. The FcγRs interactions is evaluated to show the candidate biosimilar’s safety and similarity to the original drug [33]. In the official documentation of bevacizumab biosimilars (Zirabev and Mvasi), it is reported that the interactions between IgG:Fc and FcγRs were evaluated with SPR [67,68,69]. Previous studies presented that His capture method ensures an oriented configuration on the chip surfaces for IgG:FcγRI binding analysis [70,71]. With this purpose, the binding analysis of FcγRIa is performed with SPR Biacore T200 via utilizing His tagged FcγRIa ectodomain protein on Anti-His immobilized CM5 chip.
According to steady-state KD results (Figure 7A), FcγRIa affinities were found comparable between originators (AVT: 95.02 ± 8.14 nM, ALT: 104.74 ± 14.35 nM) and the biosimilars (ZIR: 94.02 ± 9.76 nM, MVA: 84.95 ± 11.47 nM). These findings are also compatible with the literature, which states the KD value as 100 nM for the IgG1 molecule in the steady-state model. Also, the KD values were found as 2.75 ± 1.16 nM, 2.32 ± 0.22 nM, 2.27 ± 0.08 nM, and 2.29 ± 0.13 nM for AVT, ALT, ZIR, and MVA, respectively, using 1:1 Langmuir binding model (Figure 7B). A study using the same method, anti-His capture, represented a KD value of 52 nM from kinetics for IgG1 and FcγRIa binding [71]. Another study reported that a bevacizumab biosimilar’s FcγRIa binding affinity is 90–98% similar to the originator [33].

3.6. C1q ELISA Assay of Bevacizumab and Its Biosimilars

The complement system called the complement cascade belongs to the innate immune system and consists of many small proteins. The complement system has many essential functions, such as eliminating pathogens or damaged cells and increasing inflammation. Especially with the cooperation of antibodies, it can perform these tasks properly [72]. IgM and IgG immunoglobulins work effectively with the complement system, developing a membrane attack complex on the target cell and influentially destroying the target [73]. Thanks to this effector function of antibodies, it was aimed to create therapeutic monoclonal antibodies, and CDC activity was started to be used effectively in tumor treatment [74].
One of the effector functions of the IgG antibodies is Complement-dependent cytotoxicity (CDC). They initiate a complement cascade system by binding to C1q with the CH2 domain in their Fc parts [75]. The schematic illustration of C1q binding to an IgG is shown in Figure 8A. In the literature, there are several studies, including C1q binding analysis, which is performed by SPR or ELISA [76,77,78]. According to the product quality assessment reports of both Zirabev and Mvasi, this analysis is performed by ELISA. In the current study, the binding efficiencies of AVT, ALT, ZIR, and MVA were analyzed using direct ELISA under the same conditions.
It can be seen that the C1q binding is increased in correlation with the increased antibody concentration (Figure 8B). Four different C1q concentrations (0, 0.6, 1.25, 2.5, 5 ug/mL) were used, and the C1q binding showed linear increasing. Although Bevacizumab can bind C1q, it is known that it does not demonstrate complement-mediated cytotoxicity [16], and we also confirmed this well-known information by CDC assay (data not shown). On the other hand, the binding efficiency of AVT, ALT, ZIR, and MVA was found to be similar and not differ from each other significantly. It is also known that galactosylation may affect the C1q binding [33], but the minor differences in the glycoforms observed had no impact on C1q binding activity in our analysis.

3.7. Cell Proliferation Assay of Bevacizumab and Its Biosimilars

In vitro proliferation assays using Primary Human Umbilical Vein Endothelial Cells (HUVECs) are highly effective methods for determining the biological activities of the anti-VEGF monoclonal antibodies. HUVECs originate from endothelial cells by isolating them from the umbilical cord vein [79]. It is widely used for the experimental studies of many physiological conditions such as angiogenesis, fibrinolysis, macromolecule transfer, and blood coagulation [80,81]. Due to HUVEC cells being endothelial cells, they can interact with the VEGF via their VEGF receptors, and intracellular signals are transmitted to ensure cell proliferation [82]. In the presence of anti-VEGF mAb, this interaction inhibits cell proliferation, and tumor angiogenesis can be disrupted (Figure 9A).
In this study, HUVEC proliferation analysis was performed using MTS, a metabolic activity-based method [83]. The MTS assay (5-(3-carboxymethoxyphenyl)-2-(4,5-dimethyl-thiazole)-3-(4-sulfophenyl) is a commonly used colorimetric method for cell proliferation analysis [84]. The principle of the method is to examine the activation of some mitochondrial enzymes indirectly due to the rapid metabolic activity of rapidly proliferating cells [85]. The increased mitochondrial enzyme activity causes color change by converting the externally added tetrazolium salts into formazan. The absorbance value of this color change is measured with a spectrophotometer, obtaining information about cell proliferation.
The mechanism of action of Bevacizumab is based on the inhibition of proliferation by binding to VEGF. Therefore, biological activity can be assessed by analyzing the effect of Bevacizumab on cellular proliferation in cell culture. In this study, AVT, ALT, MVA, and ZIR samples were evaluated in HUVEC cells for their anti-proliferation activity by using the MTS proliferation assay. Comparison of the potency of originators and biosimilars was represented as relative cell proliferation (%), and similarity acceptance was assessed by statistical equivalence analysis. All samples showed an inhibitory effect on proliferation, but surprisingly, ZIR was the most effective and reduced the proliferation to ~40% (Figure 9B), although there is no significant difference in VEGF binding among all samples. According to equivalence analysis, MVA was found to be statistically equivalent and not different, while ZIR is nonequivalent and different in cell proliferation (Figure 9C). This is probably the result of the inadequate lot sample tested in the current study; the greater the number of lots, the better the reliability of the test.
According to the FDA, the proliferation assay is evaluated in the tier 1 category and is one of the most critical assays to show the drugs’ potency, efficacy, and safety. There is no detailed technical information about the HUVEC proliferation assay in the FDA and EMA report of Zirabev. On the other hand, the only information about the biological assay of Mvasi is that the ATP-specific luminescent reagent was used to detect proliferation. This study has provided complete data to compare these two biosimilars and the originators (AVT, ALT).

4. Conclusions

The current study aimed to provide inter-comparability of the approved biosimilars by analyzing them under the same conditions. The structural and biological assays were performed for detailed characterization of Avastin, Altuzan, Zirabev, and Mvasi. In the FDA and EMA reports of Zirabev and Mvasi, the analysis methods used and the biosimilarity results were briefly indicated. Nevertheless, the analysis of all products under identical circumstances was provided to get more detailed technical information and compare the biosimilars properly.
The study has similarly identified the glycoforms and their molecular masses except for the unclipped C-terminal Lys in Zirabev, confirmed by peptide mapping analysis. The position and percentages of the posttranslational modifications were determined in a similar range as the originators. There were no modifications to their CDR regions, affecting the antigen-binding efficiency. The VEGF-A binding of the biosimilar products, evaluated by two different binding models, was within an acceptable range.
On the other hand, it is known that several modifications to the Fc region may affect the binding efficiency of mAbs to Fc receptors. Both FcRn and FcγRIa binding ability of Zirabev and Mvasi were found such as the originator despite M-oxidation and N-deamidation on the Fc region. It can be concluded that the FcRn binding of Bevacizumab may need a higher level of these kinds of modifications. It is known that Bevacizumab has no CDC activity. However, the C1q binding of the biosimilars was also determined such as the originator, even at different concentrations of C1q. The action mechanism of Bevacizumab at the molecular level is based on halting cell proliferation by binding VEGF-A. In vitro proliferation assays are the best-known ways to examine the biological activity of Bevacizumab. One of the most important findings of this study is that MTS assay data revealed that Zirabev had a slightly more significant inhibitory effect on cell proliferation than Avastin, Altuzan, and Mvasi, which was due to the small number of samples evaluated.
The reports provided by the FDA and EMA summarize the analytical comparison of biosimilars to the originator without giving detailed analytical procedures. Thus, the analysis of two different approved biosimilars under the same conditions could provide a new aspect to the literature in terms of the applied analytical techniques. Further studies in this field would be helpful for the inter-comparability of the biosimilars [1].

Author Contributions

Conceptualization, B.G. and M.Y.; methodology, B.G., M.Y., E.Ç., A.P.; software, B.G., E.Ç. and M.Y.; validation, B.G., E.Ç., A.P.; formal analysis, B.G., E.Ç., A.P., M.Y.; investigation, B.G., M.Y., E.Ç., A.P.; resources, D.E.D. and M.Y.; data curation, B.G., E.Ç., A.P. and M.Y.; writing—original draft preparation, B.G., E.Ç., A.P., M.Y.; writing—review and editing, B.G., A.Ö., M.Ç., M.Y.; visualization, B.G., E.Ç., A.P., M.Y.; supervision, M.Y.; project administration, D.E.D. and M.Y.; funding acquisition, D.E.D. and M.Y. All authors have read and agreed to the published version of the manuscript.

Funding

This research was funded by The Scientific and Technological Research Council of Turkey (TUBITAK) KAMAG 1007 program (Grant ID: 115G016-115G074). E.Ç. was funded by TUBITAK 2244 Industrial Ph.D. Program (Grant ID: 118C149).

Institutional Review Board Statement

Not applicable.

Informed Consent Statement

Not applicable.

Data Availability Statement

Not applicable.

Acknowledgments

The authors acknowledge The Scientific and Technological Research Council of Turkey (TUBITAK) KAMAG 1007 program (Grant ID: 115G016-115G074) for financial support. E.Ç. acknowledges TUBITAK 2244 Industrial Ph.D. Program (Grant ID: 118C149) for the scholarship.

Conflicts of Interest

The authors declare that they have no conflict of interest.

Abbreviations

DTT: 1,4-Dithiothreitol; IAA, iodoacetamide; AMBIC, ammonium bicarbonate; SDS, sodium dodecyl sulfate; ACN, acetonitrile; NaCsI, sodium cesium iodide; FDA, US Food and Drug Administration; ICH, International Council for Harmonization; EMA, European Medicines Agency; WHO, World Health Organization; CQA, critical quality attributes; AVT, Avastin; FcRn, neonatal Fc receptor; VEGF, vascular endothelial growth factor; KD, dissociation constant.

References

  1. Wang, X.; An, Z.; Luo, W.; Xia, N.; Zhao, Q. Molecular and functional analysis of monoclonal antibodies in support of biologics development. Protein Cell 2018, 9, 74–85. [Google Scholar] [CrossRef]
  2. Chan, K.K.; Bass, A.R. Autoimmune complications of immunotherapy: Pathophysiology and management. BMJ 2020, 369, m736. [Google Scholar] [CrossRef] [PubMed] [Green Version]
  3. Milne, R. The rare and the common: Scale and the genetic imaginary in Alzheimer’s disease drug development. New Genet. Soc. 2020, 39, 101–126. [Google Scholar] [CrossRef] [PubMed] [Green Version]
  4. Kwon, O.; Joung, J.; Park, Y.; Kim, C.W.; Hong, S.H. Considerations of critical quality attributes in the analytical comparability assessment of biosimilar products. Biologicals 2017, 48, 101–108. [Google Scholar] [CrossRef] [PubMed]
  5. Blauvelt, A.; Cohen, A.D.; Puig, L.; Vender, R.; Van Der Walt, J.; Wu, J.J. Biosimilars for psoriasis: Preclinical analytical assessment to determine similarity. Br. J. Dermatol. 2016, 174, 282–286. [Google Scholar] [CrossRef]
  6. Torkashvand, F.; Vaziri, B. Main quality attributes of monoclonal antibodies and effect of cell culture components. Iran. Biomed. J. 2017, 21, 131–141. [Google Scholar] [CrossRef]
  7. Ren, D.; Zhang, J.; Pritchett, R.; Liu, H.; Kyauk, J.; Luo, J.; Amanullah, A. Detection and identification of a serine to arginine sequence variant in a therapeutic monoclonal antibody. J. Chromatogr. B 2011, 879, 2877–2884. [Google Scholar] [CrossRef]
  8. Joshi, S.; Rathore, A.S. Assessment of Structural and Functional Comparability of Biosimilar Products: Trastuzumab as a Case Study. BioDrugs 2020, 34, 209–223. [Google Scholar] [CrossRef]
  9. Kaur, H. Stability testing in monoclonal antibodies. Crit. Rev. Biotechnol. 2021, 41, 692–714. [Google Scholar] [CrossRef]
  10. Wang, Z.; Zhu, J.; Lu, H. Antibody glycosylation: Impact on antibody drug characteristics and quality control. Appl. Microbiol. Biotechnol. 2020, 104, 1905–1914. [Google Scholar] [CrossRef]
  11. FDA. Scientific Considerations in Demonstrating Biosimilarity to a Reference Product. Available online: https://www.fda.gov/regulatory-information/search-fda-guidance-documents/scientific-considerations-demonstrating-biosimilarity-reference-product (accessed on 1 March 2022).
  12. EMA. Guideline on Similar Biological Medicinal Products. Available online: https://www.ema.europa.eu/en/documents/scientific-guideline/guideline-similar-biological-medicinal-products-rev1_en.pdf (accessed on 1 March 2022).
  13. World Health Organization Guidelines on Evaluation of Similar Biotherapeutic Products (SBPs). Available online: https://cdn.who.int/media/docs/default-source/biologicals/who-guidelines-on-evaluation-of-biosimilars---4-nov-2021.pdf?sfvrsn=f17799ae_5 (accessed on 1 March 2022).
  14. Q6B Ich Harmonised Tripartite Guideline Specifications: Test Procedures and Acceptance Criteria for Biotechnological/Biological Products. Available online: https://www.ema.europa.eu/en/documents/scientific-guideline/ich-q-6-b-test-procedures-acceptance-criteria-biotechnological/biological-products-step-5_en.pdf (accessed on 1 March 2022).
  15. Beyer, B.; Walch, N.; Jungbauer, A.; Lingg, N. How Similar Is Biosimilar? A Comparison of Infliximab Therapeutics in Regard to Charge Variant Profile and Antigen Binding Affinity. Biotechnol. J. 2019, 14, 1800340. [Google Scholar] [CrossRef] [PubMed] [Green Version]
  16. Wang, Y.; Fei, D.; Vanderlaan, M.; Song, A. Biological activity of Bevacizumab, a humanized anti-VEGF antibody in vitro. Angiogenesis 2004, 7, 335–345. [Google Scholar] [CrossRef] [PubMed]
  17. Garcia, J.; Hurwitz, H.I.; Sandler, A.B.; Miles, D.; Coleman, R.L.; Deurloo, R.; Chinot, O.L. Bevacizumab (Avastin®) in cancer treatment: A review of 15 years of clinical experience and future outlook. Cancer Treat. Rev. 2020, 86, 102017. [Google Scholar] [CrossRef] [PubMed]
  18. Assoun, S.; Brosseau, S.; Steinmetz, C.; Gounant, V.; Zalcman, G. Bevacizumab in advanced lung cancer: State of the art. Future Oncol. 2017, 13, 2515–2535. [Google Scholar] [CrossRef]
  19. Pfaendler, K.S.; Liu, M.C.; Tewari, K.S. Bevacizumab in cervical cancer: 5 years after. Cancer J. 2018, 24, 187–192. [Google Scholar] [CrossRef]
  20. Diaz, R.J.; Ali, S.; Qadir, M.G.; De La Fuente, M.I.; Ivan, M.E.; Komotar, R.J. The role of Bevacizumab in the treatment of glioblastoma. J. Neurooncol. 2017, 133, 455–467. [Google Scholar] [CrossRef]
  21. Prakash, A.; Mishra, N.N.; Utpreksha, V.; Sharma, S.; Anand, A.; Mahajan, R.V.; Prasad, J.P.; Chand, S. Comparative analytical profiling of bevacizumab biosimilars marketed in India: A national control laboratory study. 3 Biotech 2020, 10, 516. [Google Scholar] [CrossRef]
  22. Sokolowska, I.; Mo, J.; Dong, J.; Lewis, M.J.; Hu, P. Subunit mass analysis for monitoring antibody oxidation. MAbs 2017, 9, 498–505. [Google Scholar] [CrossRef] [Green Version]
  23. Kiris, I.; Basar, M.K.; Sahin, B.; Gurel, B.; Coskun, J.; Mroczek, T.; Baykal, A.T. Evaluation of the Therapeutic Effect of Lycoramine on Alzheimer’s Disease in Mouse Model. Curr. Med. Chem. 2021, 28, 3449–3473. [Google Scholar] [CrossRef]
  24. Rogstad, S.; Yan, H.; Wang, X.; Powers, D.; Brorson, K.; Damdinsuren, B.; Lee, S. Multi-Attribute Method for Quality Control of Therapeutic Proteins. Anal. Chem. 2019, 91, 14170–14177. [Google Scholar] [CrossRef]
  25. Miao, S.; Xie, P.; Zou, M.; Fan, L.; Liu, X.; Zhou, Y.; Zhao, L.; Ding, D.; Wang, H.; Tan, W.-S.S. Identification of multiple sources of the acidic charge variants in an IgG1 monoclonal antibody. Appl. Microbiol. Biotechnol. 2017, 101, 5627–5638. [Google Scholar] [CrossRef] [PubMed]
  26. Kurt, H.; Eyüpoğlu, A.E.; Sütlü, T.; Budak, H.; Yüce, M. Plasmonic Selection of ssDNA Aptamers against Fibroblast Growth Factor Receptor. ACS Comb. Sci. 2019, 21, 578–587. [Google Scholar] [CrossRef] [PubMed]
  27. Wang, X.; McKay, P.; Yee, L.T.; Dutina, G.; Hass, P.E.; Nijem, I.; Allison, D.; Cowan, K.J.; Lin, K.; Quarmby, V.; et al. Impact of SPR biosensor assay configuration on antibody: Neonatal Fc receptor binding data. MAbs 2017, 9, 319–332. [Google Scholar] [CrossRef] [PubMed] [Green Version]
  28. Neuber, T.; Frese, K.; Jaehrling, J.; Jäger, S.; Daubert, D.; Felderer, K.; Linnemann, M.; Höhne, A.; Kaden, S.; Kölln, J.; et al. Characterization and screening of IgG binding to the neonatal Fc receptor. MAbs 2014, 6, 928–942. [Google Scholar] [CrossRef] [Green Version]
  29. Bertolotti-Ciarlet, A.; Wang, W.; Lownes, R.; Pristatsky, P.; Fang, Y.; McKelvey, T.; Li, Y.; Drummond, J.; Prueksaritanont, T.; Vlasak, J. Impact of methionine oxidation on the binding of human IgG1 to FcRn and Fcγ receptors. Mol. Immunol. 2009, 46, 1878–1882. [Google Scholar] [CrossRef]
  30. Abdiche, Y.N.; Yeung, Y.A.; Chaparro-Riggers, J.; Barman, I.; Strop, P.; Chin, S.M.; Pham, A.; Bolton, G.; McDonough, D.; Lindquist, K.; et al. The neonatal Fc receptor (FcRn) binds independently to both sites of the IgG homodimer with identical affinity. MAbs 2015, 7, 331–343. [Google Scholar] [CrossRef] [Green Version]
  31. Biacore SPR Assay Application Guide, Fc Receptor Binding Assays Using Surface Plasmon Resonance. 2020. Available online: https://www.cytivalifesciences.com/en/us/solutions/protein-research/knowledge-center/surface-plasmon-resonance/fc-receptor-binding-assays-using-surface-plasmon-resonance (accessed on 1 March 2022).
  32. Shortreed, M.R.; Frey, B.L.; Scalf, M.; Knoener, R.A.; Cesnik, A.J.; Smith, L.M. Elucidating Proteoform Families from Proteoform Intact-Mass and Lysine-Count Measurements. J. Proteome Res. 2016, 15, 1213–1221. [Google Scholar] [CrossRef] [Green Version]
  33. Seo, N.; Polozova, A.; Zhang, M.; Yates, Z.; Cao, S.; Li, H.; Kuhns, S.; Maher, G.; McBride, H.J.; Liu, J. Analytical and functional similarity of Amgen biosimilar ABP 215 to Bevacizumab. MAbs 2018, 10, 678–691. [Google Scholar] [CrossRef] [Green Version]
  34. US FDA Zirabev Summary Review: Application Number 761099Orig1s000. In Cent Drug Eval. Res.; 2019. Available online: https://www.accessdata.fda.gov/drugsatfda%7B%5C_%7Ddocs/nda/2019/761099Orig1s000SumR.pdf (accessed on 1 March 2022).
  35. Brorson, K.; Jia, A.Y. Therapeutic monoclonal antibodies and consistent ends: Terminal heterogeneity, detection, and impact on quality. Curr. Opin. Biotechnol. 2014, 30, 140–146. [Google Scholar] [CrossRef]
  36. Zhao, Y.-Y.; Wang, N.; Liu, W.-H.; Tao, W.-J.; Liu, L.-L.; Shen, Z.-D. Charge Variants of an Avastin Biosimilar Isolation, Characterization, In Vitro Properties and Pharmacokinetics in Rat. PLoS ONE 2016, 11, e0151874. [Google Scholar] [CrossRef] [Green Version]
  37. Bansal, R.; Dash, R.; Rathore, A.S. Impact of mAb Aggregation on Its Biological Activity: Rituximab as a Case Study. J. Pharm. Sci. 2020, 109, 2684–2698. [Google Scholar] [CrossRef]
  38. Vlasak, J.; Bussat, M.C.; Wang, S.; Wagner-Rousset, E.; Schaefer, M.; Klinguer-Hamour, C.; Kirchmeier, M.; Corvaïa, N.; Ionescu, R.; Beck, A. Identification and characterization of asparagine deamidation in the light chain CDR1 of a humanized IgG1 antibody. Anal. Biochem. 2009, 392, 145–154. [Google Scholar] [CrossRef] [PubMed]
  39. Haberger, M.; Bomans, K.; Diepold, K.; Hook, M.; Gassner, J.; Schlothauer, T.; Zwick, A.; Spick, C.; Kepert, J.F.; Hienz, B.; et al. Assessment of chemical modifications of sites in the CDRs of recombinant antibodies. MAbs 2014, 6, 327–339. [Google Scholar] [CrossRef] [PubMed] [Green Version]
  40. Lamanna, W.C.; Heller, K.; Schneider, D.; Guerrasio, R.; Hampl, V.; Fritsch, C.; Schiestl, M. The in-use stability of the rituximab biosimilar Rixathon®/Riximyo® upon preparation for intravenous infusion. J. Oncol. Pharm. Pract. 2019, 25, 269–278. [Google Scholar] [CrossRef] [PubMed]
  41. Liu, H.; Ponniah, G.; Zhang, H.; Neill, A.; Gonzalez-lopez, N.; Patel, R.; Cheng, G.; Kita, A.Z.; Andrien, B.; Neill, A.; et al. In vitro and in vivo modifications of recombinant and human IgG antibodies In vitro and in vivo modi fi cations of recombinant and human IgG antibodies. mAbs 2014, 6, 1145–1154. [Google Scholar] [CrossRef] [Green Version]
  42. Dashivets, T.; Stracke, J.; Dengl, S.; Knaupp, A.; Pollmann, J.; Buchner, J.; Schlothauer, T. Oxidation in the complementarity-determining regions differentially influences the properties of therapeutic antibodies. MAbs 2016, 8, 1525–1535. [Google Scholar] [CrossRef] [Green Version]
  43. Chelius, D.; Rehder, D.S.; Bondarenko, P.V. Identification and Characterization of Deamidation Sites in the Conserved Regions of Human Immunoglobulin Gamma Antibodies. Anal. Chem. 2005, 77, 6004–6011. [Google Scholar] [CrossRef]
  44. Sinha, S.; Zhang, L.; Duan, S.; Williams, T.D.; Vlasak, J.; Ionescu, R.; Topp, E.M. Effect of protein structure on deamidation rate in the Fc fragment of an IgG1 monoclonal antibody. Protein Sci. 2009, 18, 1573–1584. [Google Scholar] [CrossRef] [Green Version]
  45. Panoilia, E.; Schindler, E.; Samantas, E.; Aravantinos, G.; Kalofonos, H.P.; Christodoulou, C.; Patrinos, G.P.; Friberg, L.E.; Sivolapenko, G. A pharmacokinetic binding model for Bevacizumab and VEGF165 in colorectal cancer patients. Cancer Chemother. Pharmacol. 2015, 75, 791–803. [Google Scholar] [CrossRef]
  46. Beck, A.; Liu, H. Macro- and Micro-Heterogeneity of Natural and Recombinant IgG Antibodies. Antibodies 2019, 8, 18. [Google Scholar] [CrossRef] [Green Version]
  47. Beyer, B.; Schuster, M.; Jungbauer, A.; Lingg, N. Microheterogeneity of Recombinant Antibodies: Analytics and Functional Impact. Biotechnol. J. 2018, 13, 1700476. [Google Scholar] [CrossRef] [PubMed] [Green Version]
  48. Chung, S.; Tian, J.; Tan, Z.; Chen, J.; Lee, J.; Borys, M.; Li, Z.J. Industrial bioprocessing perspectives on managing therapeutic protein charge variant profiles. Biotechnol. Bioeng. 2018, 115, 1646–1665. [Google Scholar] [CrossRef] [PubMed]
  49. Presta, L.G.; Chen, H.; O’Connor, S.J.; Chisholm, V.; Meng, Y.G.; Krummen, L.; Winkler, M.; Ferrara, N. Humanization of an anti-vascular endothelial growth factor monoclonal antibody for the therapy of solid tumors and other disorders. Cancer Res. 1997, 57, 4593–4599. [Google Scholar] [PubMed]
  50. Sreenivasan, S.; Kumar, D.; Malani, H.; Rathore, A.S. Does interaction of monoclonal antibody charge variants with VEGF-A and ELISA reagents affect its quantification? Quantification of anti-VEGF mAb charge variants by ELISA? Anal. Biochem. 2020, 590, 113513. [Google Scholar] [CrossRef] [PubMed]
  51. Kim, T.K.; Park, C.S.; Jang, J.; Kim, M.R.; Na, H.J.; Lee, K.; Kim, H.J.; Heo, K.; Yoo, B.C.; Kim, Y.M.; et al. Inhibition of VEGF-dependent angiogenesis and tumor angiogenesis by an optimized antibody targeting CLEC14a. Mol. Oncol. 2018, 12, 356–372. [Google Scholar] [CrossRef] [Green Version]
  52. Drake, A.W.; Myszka, D.G.; Klakamp, S.L. Characterizing high-affinity antigen/antibody complexes by kinetic- and equilibrium-based methods. Anal. Biochem. 2004, 328, 35–43. [Google Scholar] [CrossRef]
  53. Yang, J.; Wang, X.; Fuh, G.; Yu, L.; Wakshull, E.; Khosraviani, M.; Day, E.S.; Demeule, B.; Liu, J.; Shire, S.J.; et al. Comparison of binding characteristics and in vitro activities of three inhibitors of vascular endothelial growth factor A. Mol. Pharm. 2014, 11, 3421–3430. [Google Scholar] [CrossRef]
  54. Wang, X.; Phan, M.M.; Li, J.; Gill, H.; Williams, S.; Gupta, N.; Quarmby, V.; Yang, J. Molecular Interaction Characterization Strategies for the Development of New Biotherapeutic Antibody Modalities. Antibodies 2020, 9, 7. [Google Scholar] [CrossRef] [Green Version]
  55. Patel, R.; Neill, A.; Liu, H.; Andrien, B. IgG subclass specificity to C1q determined by surface plasmon resonance using Protein L capture technique. Anal. Biochem. 2015, 479, 15–17. [Google Scholar] [CrossRef]
  56. Papadopoulos, N.; Martin, J.; Ruan, Q.; Rafique, A.; Rosconi, M.P.; Shi, E.; Pyles, E.A.; Yancopoulos, G.D.; Stahl, N.; Wiegand, S.J. Binding and neutralization of vascular endothelial growth factor (VEGF) and related ligands by VEGF Trap, ranibizumab and Bevacizumab. Angiogenesis 2012, 15, 171–185. [Google Scholar] [CrossRef] [Green Version]
  57. Hintersteiner, B.; Lingg, N.; Zhang, P.; Woen, S.; Hoi, K.M.; Stranner, S.; Wiederkum, S.; Mutschlechner, O.; Schuster, M.; Loibner, H.; et al. Charge heterogeneity: Basic antibody charge variants with increased binding to Fc receptors. MAbs 2016, 8, 1548–1560. [Google Scholar] [CrossRef] [PubMed] [Green Version]
  58. Yan, B.; Steen, S.; Hambly, D.; Valliere-Douglass, J.; Vanden Bos, T.; Smallwood, S.; Yates, Z.; Arroll, T.; Han, Y.; Gadgil, H.; et al. Succinimide formation at Asn 55 in the complementarity determining region of a recombinant monoclonal antibody IgG1 heavy chain. J. Pharm. Sci. 2009, 98, 3509–3521. [Google Scholar] [CrossRef]
  59. Schmid, I.; Bonnington, L.; Gerl, M.; Bomans, K.; Thaller, A.L.; Wagner, K.; Schlothauer, T.; Falkenstein, R.; Zimmermann, B.; Kopitz, J.; et al. Assessment of susceptible chemical modification sites of trastuzumab and endogenous human immunoglobulins at physiological conditions. Commun. Biol. 2018, 1, 28. [Google Scholar] [CrossRef] [PubMed]
  60. Szikora, B.; Hiripi, L.; Bender, B.; Kacskovics, I.; Iliás, A. Characterization of the interactions of rabbit neonatal Fc receptor (FcRn) with rabbit and human IgG isotypes. PLoS ONE 2017, 12, e0185662. [Google Scholar] [CrossRef] [PubMed]
  61. Wang, W.; Vlasak, J.; Li, Y.; Pristatsky, P.; Fang, Y.; Pittman, T.; Roman, J.; Wang, Y.; Prueksaritanont, T.; Ionescu, R. Impact of methionine oxidation in human IgG1 Fc on serum half-life of monoclonal antibodies. Mol. Immunol. 2011, 48, 860–866. [Google Scholar] [CrossRef]
  62. Pan, H.; Chen, K.; Chu, L.; Kinderman, F.; Apostol, I.; Huang, G. Methionine oxidation in human IgG2 Fc decreases binding affinities to protein A and FcRn. Protein Sci. 2009, 18, 424–433. [Google Scholar] [CrossRef] [PubMed] [Green Version]
  63. Khawli, L.A.; Goswami, S.; Hutchinson, R.; Kwong, Z.W.; Yang, J.; Wang, X.; Yao, Z.; Sreedhara, A.; Cano, T.; Tesar, D.B.; et al. Charge variants in IgG1. MAbs 2010, 2, 613–624. [Google Scholar] [CrossRef] [PubMed] [Green Version]
  64. Subedi, G.P.; Barb, A.W. The immunoglobulin G1 N-glycan composition affects binding to each low affinity Fc γ receptor. MAbs 2016, 8, 1512–1524. [Google Scholar] [CrossRef] [Green Version]
  65. Bournazos, S.; Gupta, A.; Ravetch, J.V. The role of IgG Fc receptors in antibody-dependent enhancement. Nat. Rev. Immunol. 2020, 20, 633–643. [Google Scholar] [CrossRef]
  66. Bruhns, P.; Iannascoli, B.; England, P.; Mancardi, D.A.; Fernandez, N.; Jorieux, S.; Daëron, M. Specificity and affinity of human Fcγ receptors and their polymorphic variants for human IgG subclasses. Blood 2009, 113, 3716–3725. [Google Scholar] [CrossRef]
  67. Avastin: EPAR—European Medicines Agency. Avastin, INN-Bevacizumab—European Medicines Agency. Available online: https://www.ema.europa.eu/en/documents/product-information/avastin-epar-product-information_en.pdf (accessed on 1 March 2022).
  68. Zirabev: EPAR—European Medicines Agency. Zirabev: EPAR—Public Assessment Report. Available online: https://www.ema.europa.eu/en/documents/assessment-report/zirabev-epar-public-assessment-report_en.pdf (accessed on 1 March 2022).
  69. Mvasi: EPAR—European Medicines Agency. Mvasi: EPAR—Public Asssessment Report. Available online: https://www.ema.europa.eu/en/documents/assessment-report/mvasi-epar-public-assessment-report_en.pdf (accessed on 1 March 2022).
  70. Forest-Nault, C.; Gaudreault, J.; Henry, O.; Durocher, Y.; De Crescenzo, G. On the Use of Surface Plasmon Resonance Biosensing to Understand IgG-FcγR Interactions. Int. J. Mol. Sci. 2021, 22, 6616. [Google Scholar] [CrossRef] [PubMed]
  71. Dorion-Thibaudeau, J.; Raymond, C.; Lattová, E.; Perreault, H.; Durocher, Y.; De Crescenzo, G. Towards the development of a surface plasmon resonance assay to evaluate the glycosylation pattern of monoclonal antibodies using the extracellular domains of CD16a and CD64. J. Immunol. Methods 2014, 408, 24–34. [Google Scholar] [CrossRef] [PubMed]
  72. Merle, N.S.; Church, S.E.; Fremeaux-Bacchi, V.; Roumenina, L.T. Complement system part I—Molecular mechanisms of activation and regulation. Front. Immunol. 2015, 6, 1–30. [Google Scholar] [CrossRef] [PubMed] [Green Version]
  73. Merle, N.S.; Noe, R.; Halbwachs-Mecarelli, L.; Fremeaux-Bacchi, V.; Roumenina, L.T. Complement system part II: Role in immunity. Front. Immunol. 2015, 6, 1–26. [Google Scholar] [CrossRef] [Green Version]
  74. Meyer, S.; Leusen, J.H.W.; Boross, P. Regulation of complement and modulation of its activity in monoclonal antibody therapy of cancer. MAbs 2014, 6, 1133–1144. [Google Scholar] [CrossRef] [Green Version]
  75. Wang, B.; Yang, C.; Jin, X.; Du, Q.; Wu, H.; Dall’acqua, W.; Mazor, Y. Regulation of antibody-mediated complement-dependent cytotoxicity by modulating the intrinsic affinity and binding valency of IgG for target antigen. mAbs 2020, 12, 1690959. [Google Scholar] [CrossRef] [Green Version]
  76. Zeitlin, L.; Pettitt, J.; Scully, C.; Bohorova, N.; Kim, D.; Pauly, M.; Hiatt, A.; Ngo, L.; Steinkellner, H.; Whaley, K.J.; et al. Enhanced potency of a fucose-free monoclonal antibody being developed as an Ebola virus immunoprotectant. Proc. Natl. Acad. Sci. USA 2011, 108, 20690–20694. [Google Scholar] [CrossRef] [Green Version]
  77. He, J.; Lai, H.; Engle, M.; Gorlatov, S.; Gruber, C.; Steinkellner, H.; Diamond, M.S.; Chen, Q. Generation and Analysis of Novel Plant-Derived Antibody-Based Therapeutic Molecules against West Nile Virus. PLoS ONE 2014, 9, e93541. [Google Scholar] [CrossRef]
  78. Jovic, M.; Cymer, F. Qualification of a surface plasmon resonance assay to determine binding of IgG-type antibodies to complement component C1q. Biologicals 2019, 61, 76–79. [Google Scholar] [CrossRef]
  79. Park, H.-J.; Zhang, Y.; Georgescu, S.P.; Johnson, K.L.; Kong, D.; Galper, J.B. Human Umbilical Vein Endothelial Cells and Human Dermal Microvascular Endothelial Cells Offer New Insights Into the Relationship Between Lipid Metabolism and Angiogenesis. Stem Cell Rev. 2006, 2, 93–102. [Google Scholar] [CrossRef]
  80. Jiménez, N.; Krouwer, V.J.D.; Post, J.A. A new, rapid and reproducible method to obtain high quality endothelium in vitro. Cytotechnology 2013, 65, 1–14. [Google Scholar] [CrossRef] [PubMed] [Green Version]
  81. Chen, Z.; Htay, A.; Dos Santos, W.; Gillies, G.T.; Fillmore, H.L.; Sholley, M.M.; Broaddus, W.C. In vitro angiogenesis by human umbilical vein endothelial cells (HUVEC) induced by three-dimensional co-culture with glioblastoma cells. J. Neurooncol. 2009, 92, 121–128. [Google Scholar] [CrossRef] [PubMed]
  82. Yu, C.; Zhang, F.; Xu, G.; Wu, G.; Wang, W.; Liu, C.; Fu, Z.; Li, M.; Guo, S.; Yu, X.; et al. Analytical Similarity of a Proposed Biosimilar BVZ-BC to Bevacizumab. Anal. Chem. 2020, 92, 3161–3170. [Google Scholar] [CrossRef]
  83. Aslantürk, Ö.S. In Vitro Cytotoxicity and Cell Viability Assays: Principles, Advantages, and Disadvantages. In Genotoxicity—A Predictable Risk to Our Actual World; IntechOpen: London, UK, 2018; pp. 1–18. [Google Scholar] [CrossRef] [Green Version]
  84. Stone, V.; Johnston, H.; Schins, R.P.F. Development of in vitro systems for nanotoxicology: Methodological considerations. Crit. Rev. Toxicol. 2009, 39, 613–626. [Google Scholar] [CrossRef] [PubMed]
  85. Mosmann, T. Rapid colorimetric assay for cellular growth and survival: Application to proliferation and cytotoxicity assays. J. Immunol. Methods 1983, 65, 55–63. [Google Scholar] [CrossRef]
Figure 1. Intact Protein Analysis of AVT, ALT, ZIR, and MVA. (A) Schematic illustration of bevacizumab glycosylation site and main glycans. (B) Overlay representation of UV chromatograms of samples.
Scipharm 90 00036 g001
Figure 2. Comparative raw MS spectrums of Zirabev (A) and Mvasi (B) in zoom-out(up) and zoom-in(down) form. (C) Overlay representation of deconvoluted MS spectrums of samples and the list of observed molecular mass of the main peaks. (D) Graph of percentages of major glycoforms identified in the samples. Each sample was injected three times.
Scipharm 90 00036 g002
Figure 3. Peptide mapping analysis of the samples. (A) Comparison of peptide profiles of samples by overlaying TIC chromatograms of tryptic peptides. (B) A representative coverage map of ALT indicating 99% coverage. The blue highlighting indicates the identified sequences.
Scipharm 90 00036 g003
Figure 4. Peptide mapping analysis of the samples. (A) The schematic representations of Bevacizumab and approximate locations of modified sequences. (B) The table of complementarity-determining regions (CDRs) in heavy and light chains, their sequence and positions, and retention time observed. (C) The table of modified peptides, modifications, and relative content. All samples were injected three times, and the values in the table are the average values. ND not detected. (*) represents carbamidomethyl-C modification. Bold and underlined letters indicate the CDR sequences, while red letters indicate modified amino acid residues.
Scipharm 90 00036 g004
Figure 5. VEGF binding analysis of the samples (A) Specific interaction of bevacizumab-based monoclonal antibody drugs with free VEGF molecules in the extracellular region inhibits angiogenesis. (B) SPR results for VEGF binding. The data represented the mean of KD values obtained from at least 3 independent measurements. (C) Results of equivalency test. The Upper and lower limit was determined as mean ± 1.5 × SD.
Scipharm 90 00036 g005
Figure 6. FcRn binding analysis of the samples (A) Typical sensograms for an injected mAb sample and immobilized FcRn were shown. FcRn captures mAb molecules at acidic pH and releases them when the pH becomes neutral. (B) Steady-state interaction of bevacizumab-based mAb-based samples with immobilized FcRn molecules was represented as the mean of at least three measurements. (B) Langmuir 1:1 binding model based SPR results for VEGF binding. The data represented the mean of at least three independent measurements. (C) Two-state binding interaction of bevacizumab-based mAb-based samples with immobilized FcRn molecules was represented as the mean of at least three measurements. There was no significant difference between Avastin, and other samples based on the Single-way ANOVA analysis (p < 0.05).
Scipharm 90 00036 g006
Figure 7. FcγRIa binding analysis of Bevacizumab and biosimilars. (A) Steady-state interaction of the samples with the Anti-His capture method was represented as the mean of at least three measurements. (B) Langmuir 1:1 binding model based SPR results for FcγRIa binding. The data represented the mean of at least three independent measurements. There was no significant difference between Avastin, and other samples based on the Single-way ANOVA analysis (p < 0.05).
Scipharm 90 00036 g007
Figure 8. C1q binding analysis of the samples. (A) Schematic illustration of C1q complex (left) and basic C1q and IgG interaction (right). (B) The results of C1q binding of AVT, ALT, ZIR, and MVA by ELISA at different concentrations. The data represented the mean of at least three independent measurements. There was no significant difference between Avastin, and other samples based on the statistical analysis (p < 0.05).
Scipharm 90 00036 g008
Figure 9. Inhibitory effect of samples on VEGF-induced HUVEC proliferation. (A) Schematic illustration of the action mechanism of anti-VEGF antibody. (B) Comparison of the potency of originators and biosimilars was represented as relative proliferation (%). Each sample was analyzed in triplicate. (C) Equivalence test results represent the differences in means of biosimilars comparing the originators.
Scipharm 90 00036 g009
Publisher’s Note: MDPI stays neutral with regard to jurisdictional claims in published maps and institutional affiliations.

