Analytical Platforms for the Determination of Phospholipid Turnover in Breast Cancer Tissue: Role of Phospholipase Activity in Breast Cancer Development


Abstract
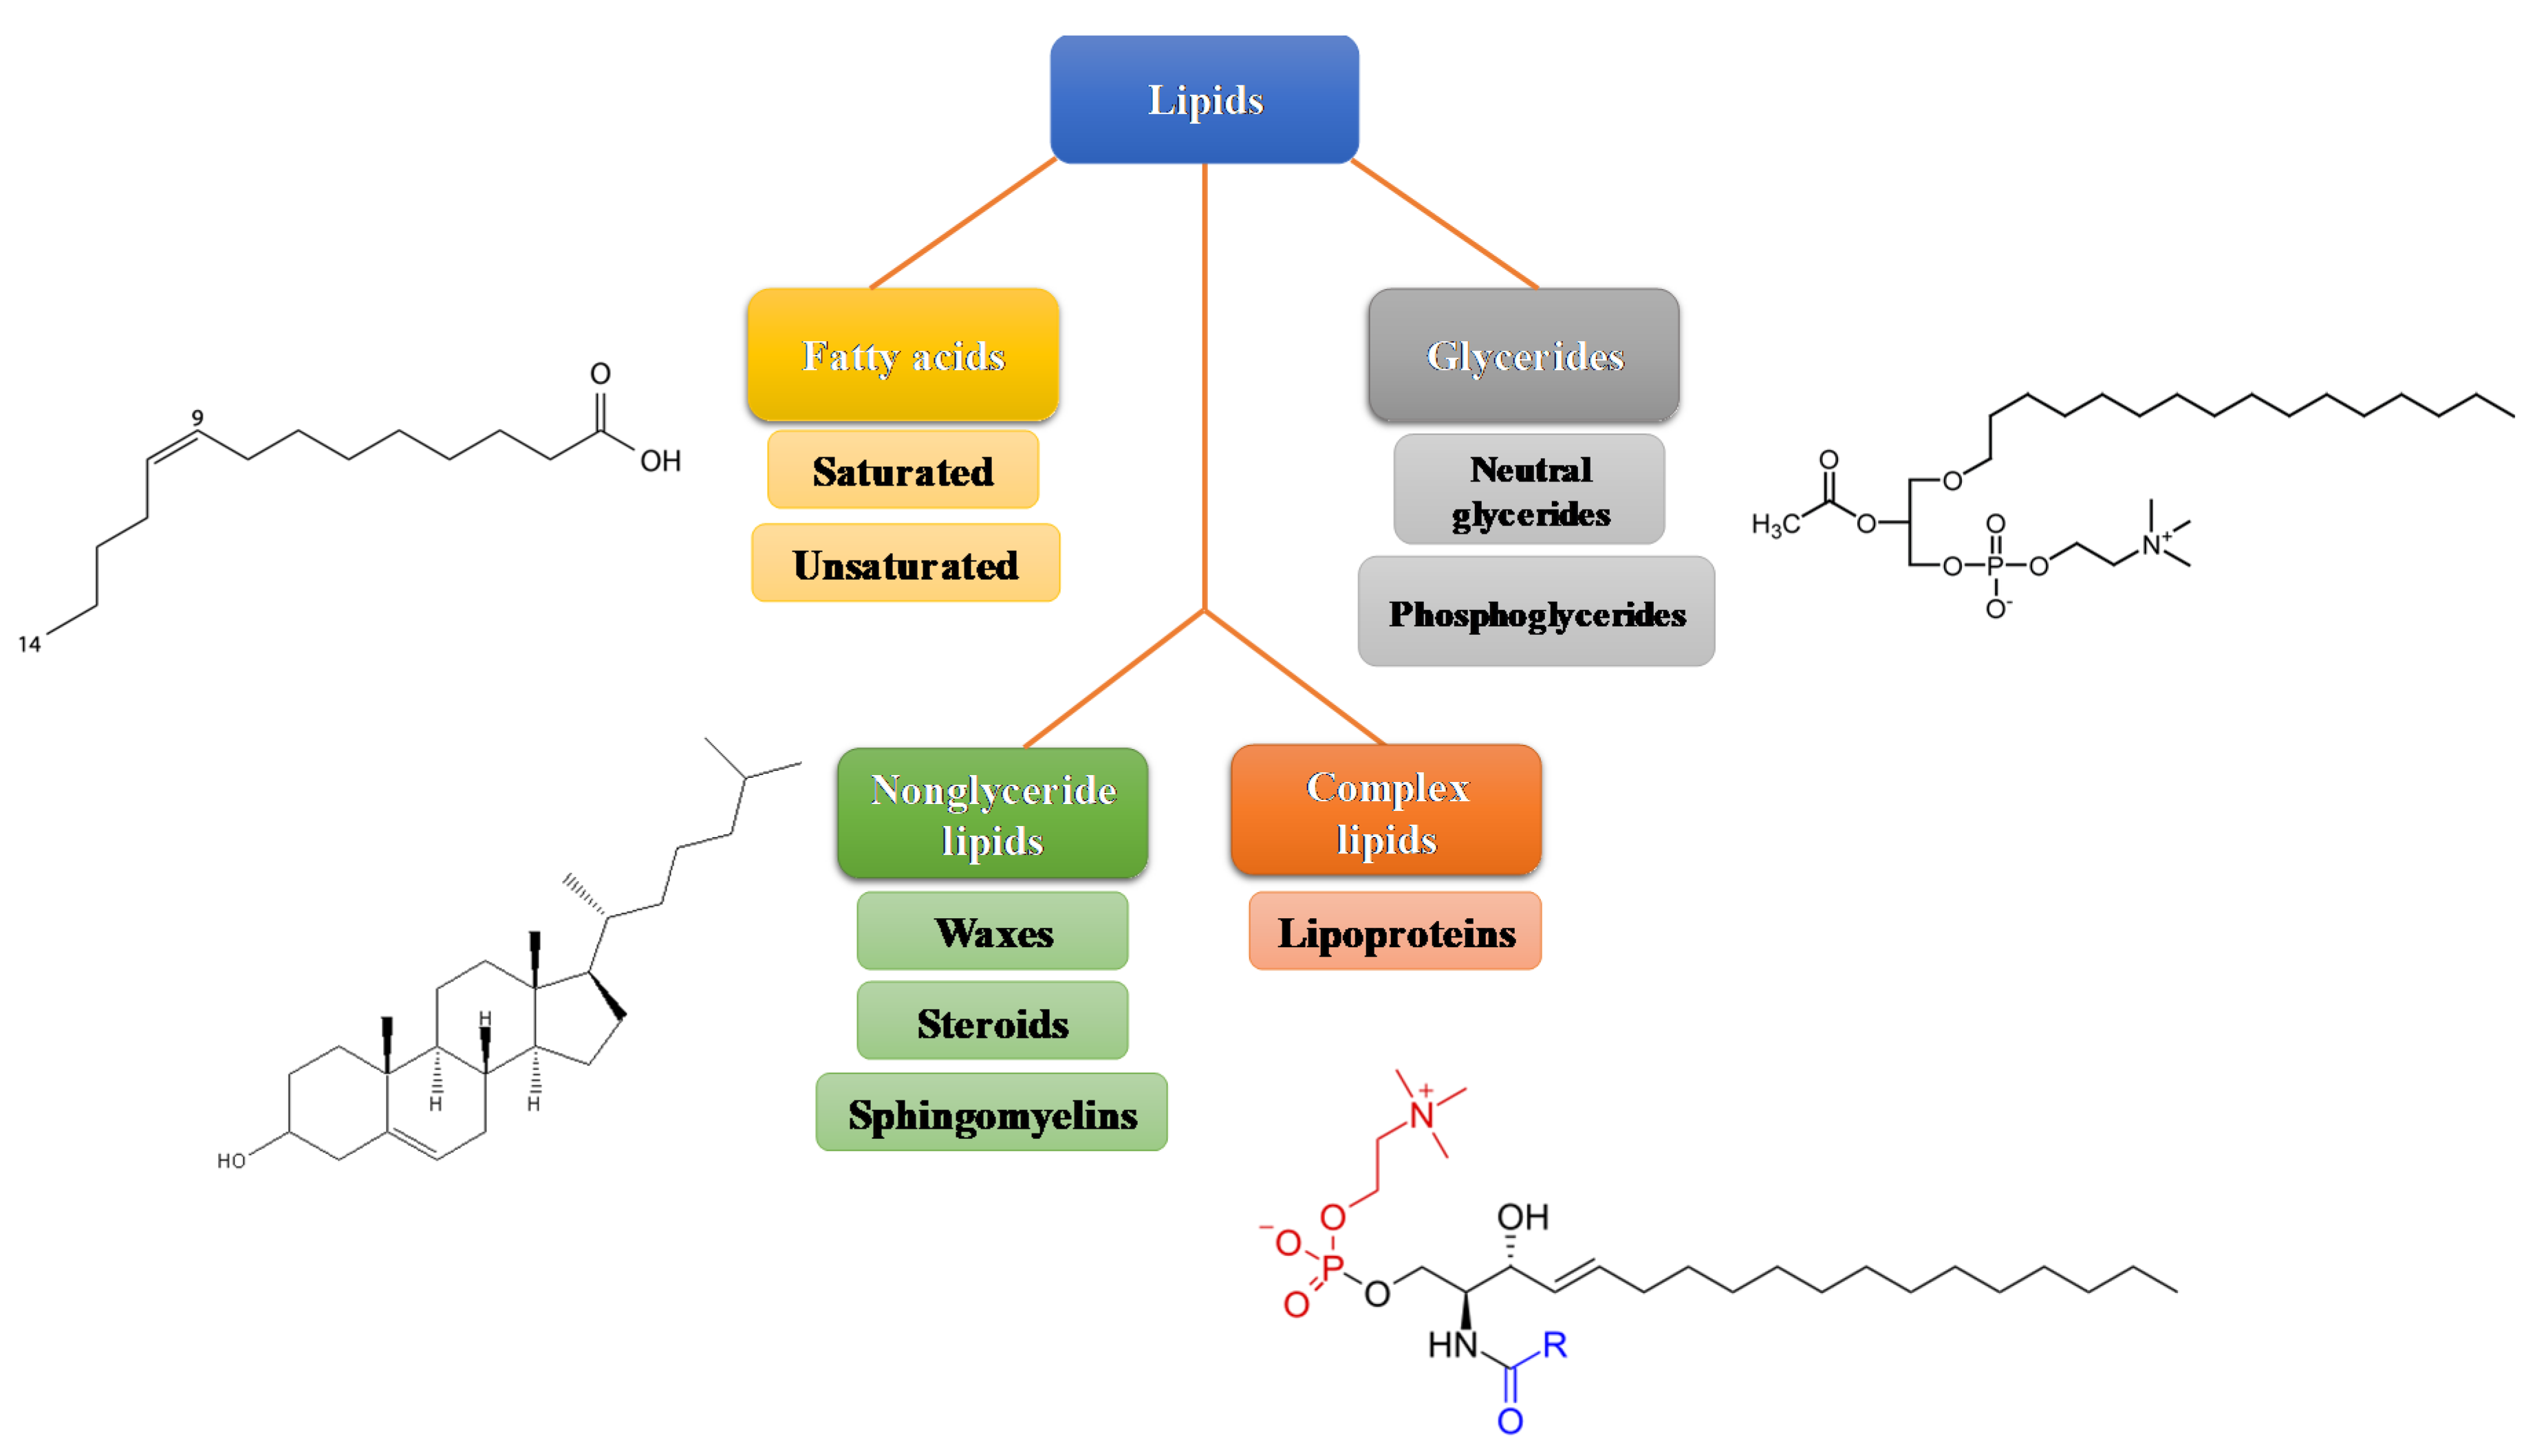
:1. Lipids Structure and Metabolism

2. Role of Lipids and Alterations in Breast Cancer
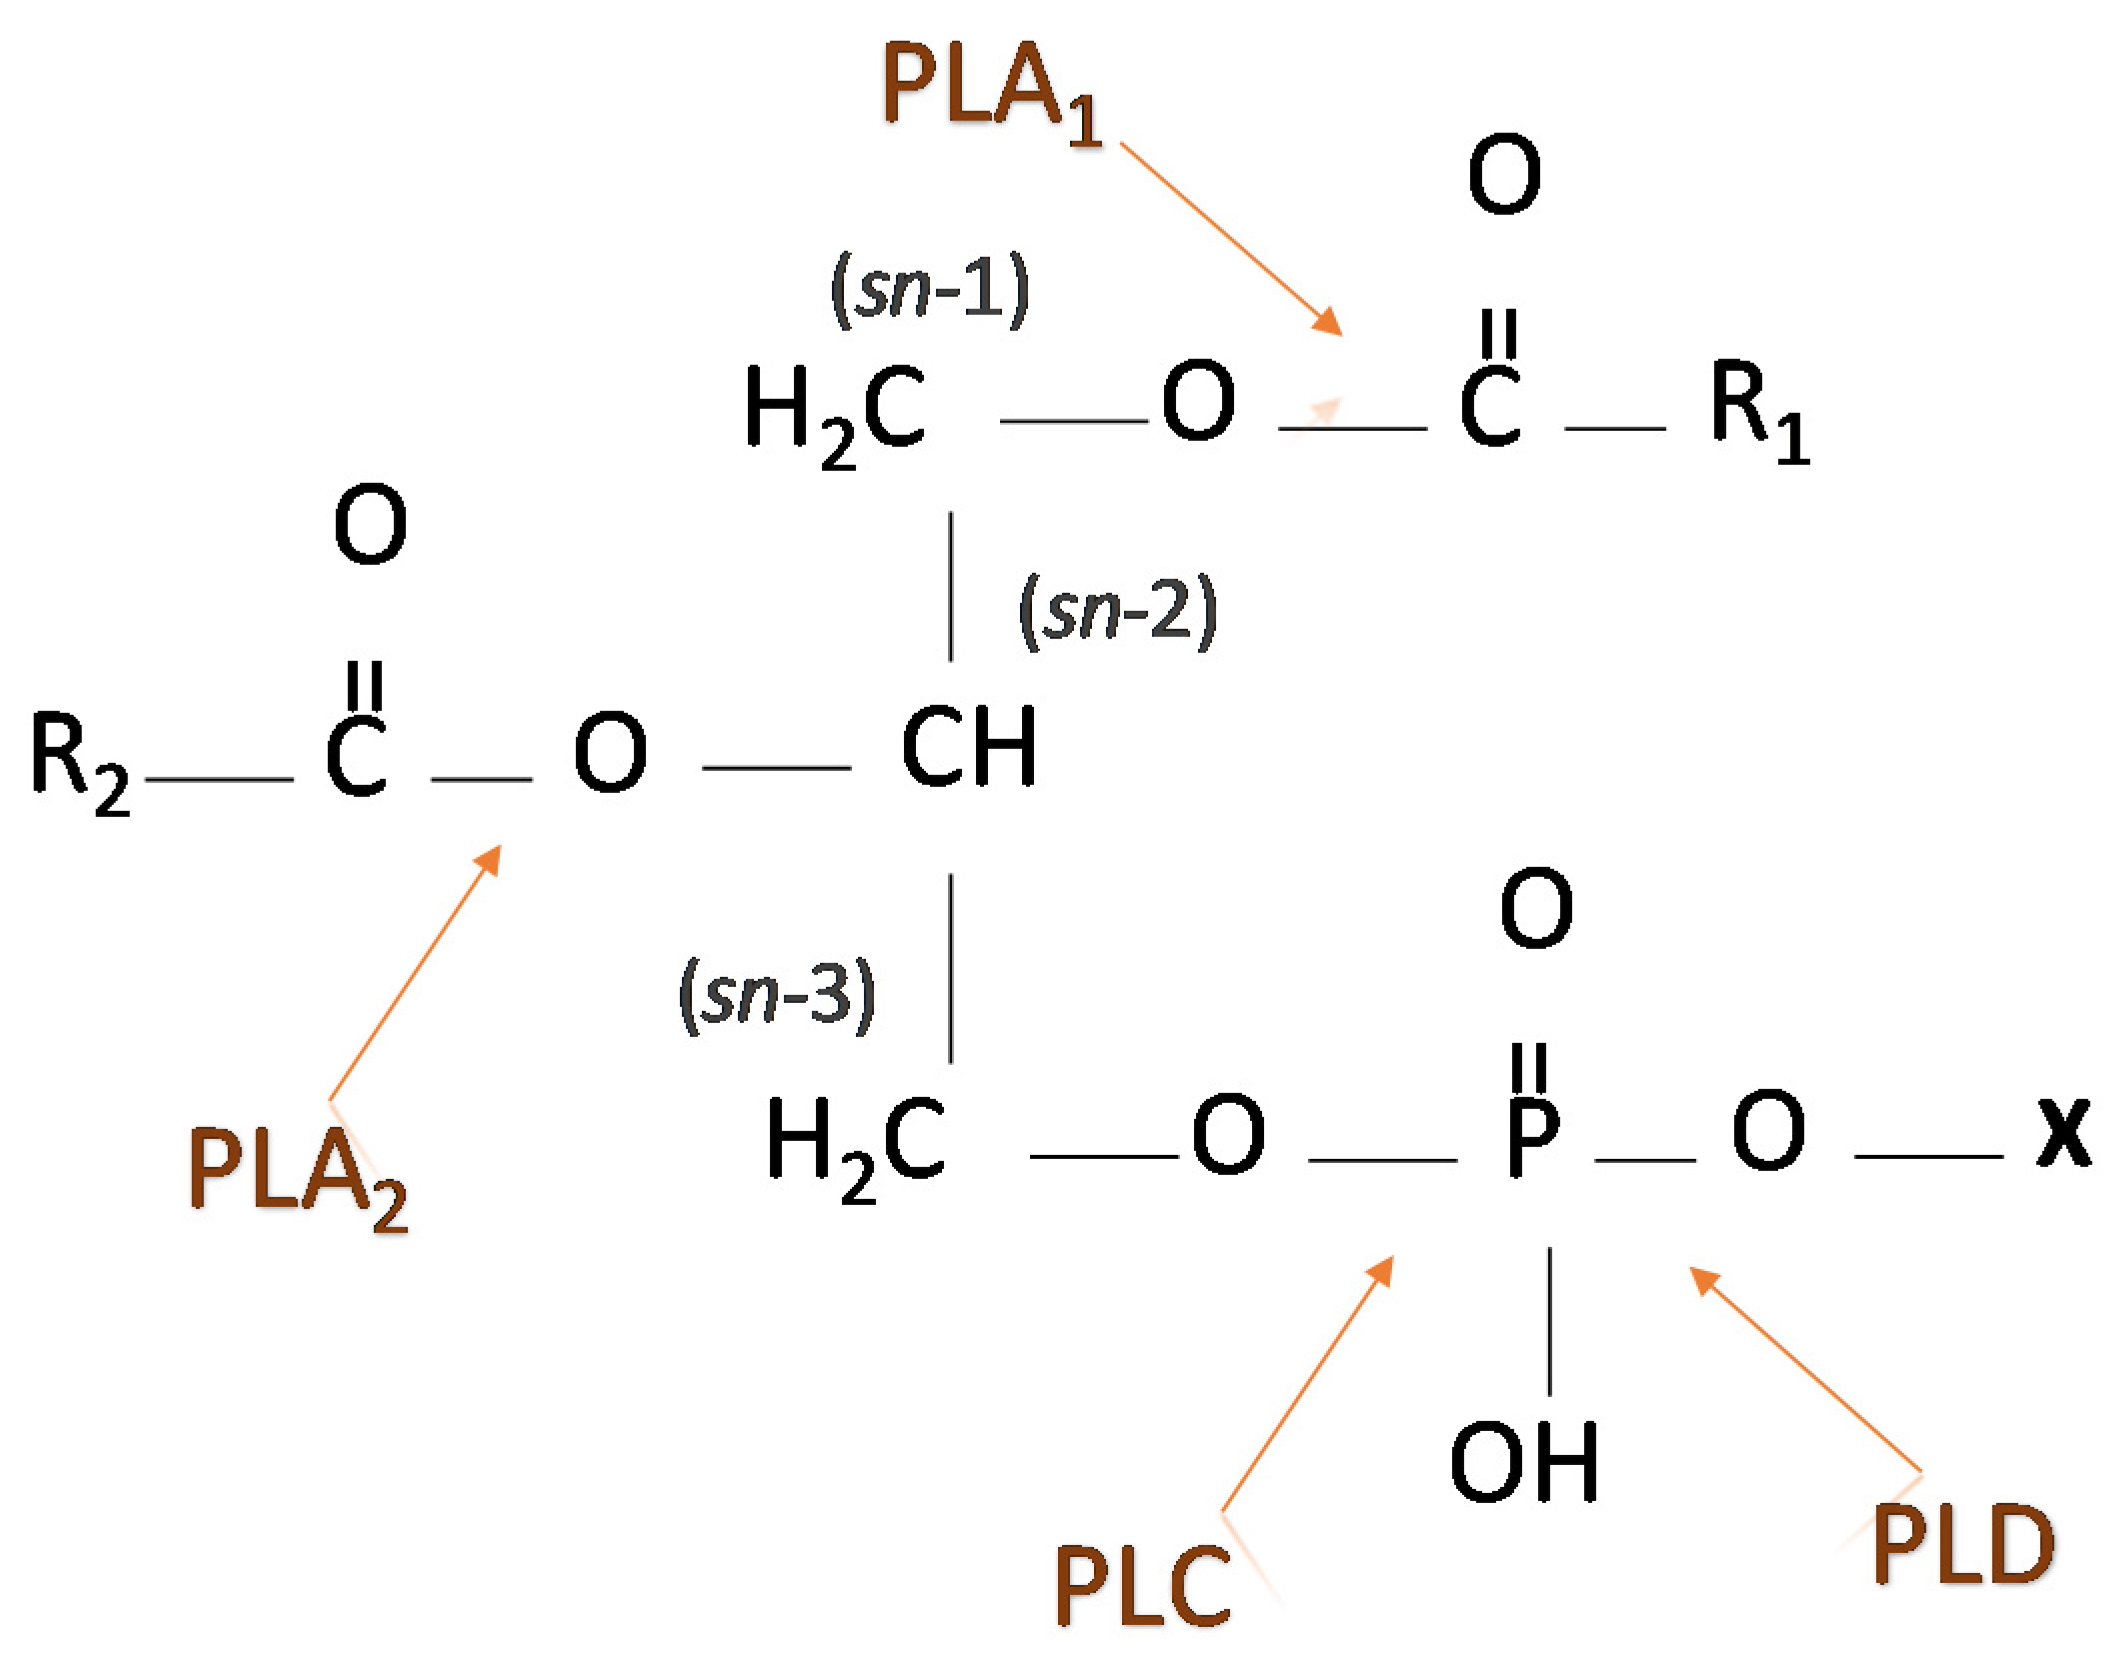
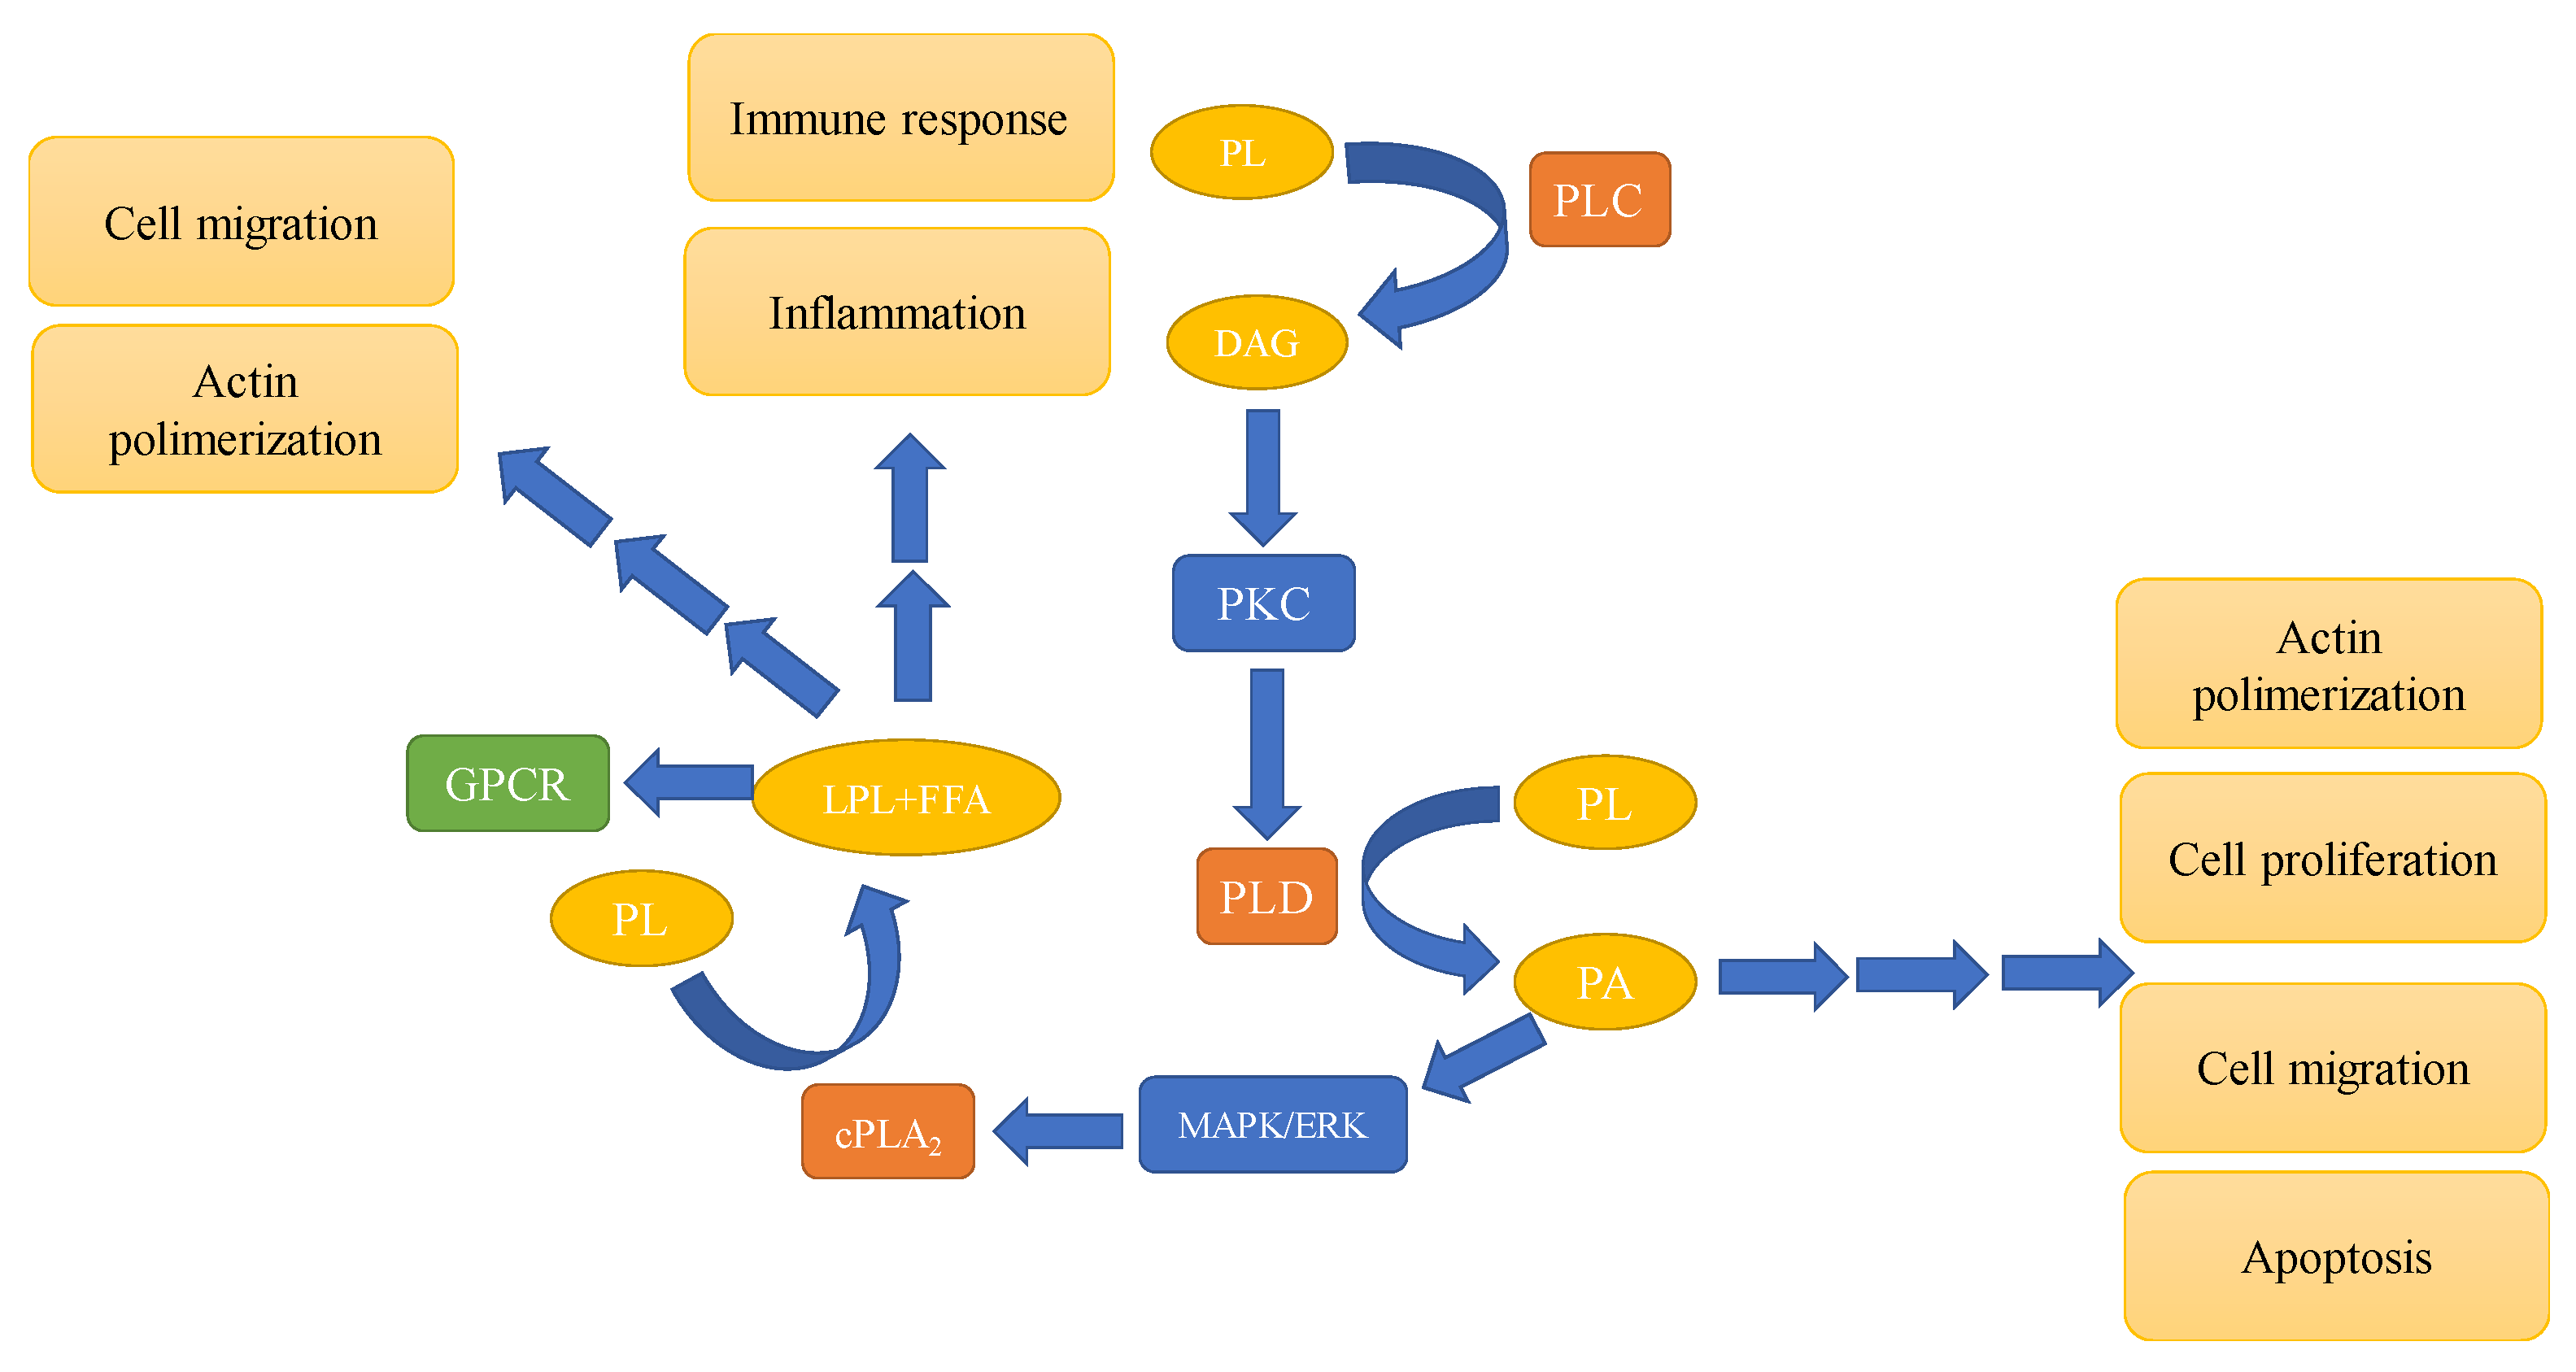
3. Phospholipases—Types and Involvement in Signaling Pathways
4. Breast Cancer Lipidomics—In Tissue Approach
4.1. Lipid Extraction Procedures
4.2. Chromatographic Separation Coupled with Mass Spectrometry
4.3. Direct Infusion Mass Spectrometry (DIMS)
4.4. Mass Spectrometry Imaging (MSI)
4.5. Batch Effects in Breast Cancer Lipidomics and Identification of Lipids
Detection of Oxidatively Modified Lipids in Breast Cancer Tissue
4.6. Statistical Analysis
5. Breast Cancer Lipidome: Comparison of Results Obtained with Cell Lines and Breast Cancer Tissues
6. Expression and Activity of PLA2 in Breast Cancer: What Is the Best Method to Determine It in the Tissue?
7. Conclusions and Future Directions
Author Contributions
Funding
Acknowledgments
Conflicts of Interest
Abbreviations
| AFAI | air flow-assisted ionization |
| ANOVA | analysis of variance |
| AUC | area under the curve |
| BC | breast cancer |
| BMP | bis(monoacylglycero)phosphate |
| COX 1 and COX 2 | cyclooxygenases 1 and 2 |
| cPLA2 | cytosolic PLA2 |
| CV | cross validation |
| DAG | diacylglycerol |
| DAG | diacylglycerol |
| DCIS | breast ductal carcinoma in situ |
| DESI | desorption electrospray ionization |
| DIMS | direct infusion mass spectrometry |
| ESI | electrospray ionization |
| FA | fatty acid |
| FAK | focal adhesion kinase |
| FFA | free fatty acid |
| GC | gas chromatography |
| GC-MS | gas chromatography-mass spectrometry |
| GPCR | heterotrimeric G-protein coupled receptor |
| HILIC | hydrophilic interaction chromatography |
| IDC | breast invasive ductal carcinoma |
| iPLA2 | calcium-independent |
| LC | liquid chromatography |
| LC–ESI/MS | liquid chromatography-electrospray ionization mass spectrometry |
| LC–PB–MS/MS | liquid chromatography tandem mass spectrometry |
| LPA | lysophosphatidic acid |
| LPCAT1 | lysophosphatidylcholine acyltransferase 1 |
| MALDI | matrix assisted laser desorption/ionization |
| MAPK/ERK | mitogen activated protein kinase/extracellular-signal-regulated kinase |
| MSI | mass spectrometry imaging |
| MUFA | monounsaturated fatty acid |
| NF-κB | light-chain-enhancer of activated B cells |
| NMR | nuclear magnetic resonance |
| NPLC | normal phase liquid chromatography |
| OPLS-DA | orthogonal partial least-squares discriminant analysis |
| PA | phosphatidic acid |
| PAF-AH | platelet-activating factor acetylhydrolase |
| PC | phosphatidyl choline |
| PCA | principal components analysis |
| PI3K | phosphatidylinositol-3-kinase |
| PIP2 | phosphatidylinositol 4,5-bisphosphate |
| PKC | protein kinase C |
| PKCδ | protein kinase C delta type |
| PL | phospholipid |
| PLA | phospholipase A |
| PLC | phospholipase C |
| PLD | phospholipase D |
| PLS-DA | partial least squares discriminate analysis |
| PUFA | polyunsaturated fatty acid |
| RIA | radioimmunoassay |
| ROC | receiver operating characteristic curve |
| SATA | saturated fatty acid |
| sPLA2 | phospholipase A2 |
| TGs | triglycerides |
| TNF α | tumor necrosis factor α |
| TOFMS | time-of-flight mass spectrometry |
| UHPLC | ultra-high performance liquid chromatography |
| UHPSFC | ultra-high performance supercritical fluid chromatography |
References
- Fahy, E.; Cotter, D.; Sud, M.; Subramaniam, S. Lipid classification, structures and tools. Biochim. Biophys. Acta Mol. Cell Biol. Lipids 2011, 1811, 637–647. [Google Scholar] [CrossRef] [PubMed]
- Valenzuela, R.; Valenzuela, A. Overview About Lipid Structure. In Lipid Metabolism; InTech: London, UK, 2013. [Google Scholar]
- Yan Lim, J.; Yee Kwan, H. Roles of Lipids in Cancer. In Lipid Metabolism [Working Title]; IntechOpen: London, UK, 2018. [Google Scholar]
- Wolrab, D.; Jirásko, R.; Chocholoušková, M.; Peterka, O.; Holčapek, M. Oncolipidomics: Mass spectrometric quantitation of lipids in cancer research. TrAC Trends Anal. Chem. 2019, 120, 115480. [Google Scholar] [CrossRef]
- Li, M.; Fan, P.; Wang, Y. Lipidomics in Health and Diseases-Beyond the Analysis of Lipids. J. Glycom. Lipidom. 2015, 5, 1. [Google Scholar]
- Santos, C.R.; Schulze, A. Lipid metabolism in cancer. FEBS J. 2012, 279, 2610–2623. [Google Scholar] [CrossRef] [PubMed]
- Baenke, F.; Peck, B.; Miess, H.; Schulze, A. Hooked on fat: The role of lipid synthesis in cancer metabolism and tumour development. DMM Dis. Model. Mech. 2013, 6, 1353–1363. [Google Scholar] [CrossRef] [PubMed] [Green Version]
- Greene, E.R.; Huang, S.; Serhan, C.N.; Panigrahy, D. Regulation of inflammation in cancer by eicosanoids. Prostaglandins Other Lipid Mediat. 2011, 96, 27–36. [Google Scholar] [CrossRef] [Green Version]
- Wang, D.; Dubois, R.N. Eicosanoids and cancer. Nat. Rev. Cancer 2010, 10, 181–193. [Google Scholar] [CrossRef] [PubMed]
- Baumann, J.; Sevinsky, C.; Conklin, D.S. Lipid biology of breast cancer. Biochim. Biophys. Acta Mol. Cell Biol. Lipids 2013, 1831, 1509–1517. [Google Scholar] [CrossRef] [Green Version]
- Jové, M.; Pradas, I.; Naudí, A.; Rovira-Llopis, S.; Bañuls, C.; Rocha, M.; Portero-Otin, M.; Hernández-Mijares, A.; Victor, V.M.; Pamplona, R. Lipidomics reveals altered biosynthetic pathways of glycerophospholipids and cell signaling as biomarkers of the polycystic ovary syndrome. Oncotarget 2018, 9, 4522–4536. [Google Scholar] [CrossRef] [Green Version]
- Perrotti, F.; Rosa, C.; Cicalini, I.; Sacchetta, P.; Del Boccio, P.; Genovesi, D.; Pieragostino, D. Advances in lipidomics for cancer biomarkers discovery. Int. J. Mol. Sci. 2016, 17, 1992. [Google Scholar] [CrossRef] [Green Version]
- Califf, R.M. Biomarker definitions and their applications. Exp. Biol. Med. 2018, 243, 213–221. [Google Scholar] [CrossRef] [PubMed]
- Pavlova, N.N.; Thompson, C.B. The Emerging Hallmarks of Cancer Metabolism. Cell Metab. 2016, 23, 27–47. [Google Scholar] [CrossRef] [PubMed] [Green Version]
- Long, J.; Zhang, C.-J.; Zhu, N.; Du, K.; Yin, Y.-F.; Tan, X.; Liao, D.-F.; Qin, L. Lipid metabolism and carcinogenesis, cancer development. Am. J. Cancer Res. 2018, 8, 778–791. [Google Scholar] [PubMed]
- Hilvo, M.; Orešič, M. Regulation of lipid metabolism in breast cancer provides diagnostic and therapeutic opportunities. Clin. Lipidol. 2012, 7, 177–188. [Google Scholar] [CrossRef]
- Panupinthu, N.; Lee, H.Y.; Mills, G.B. Lysophosphatidic acid production and action: Critical new players in breast cancer initiation and progression. Br. J. Cancer 2010, 102, 941–946. [Google Scholar] [CrossRef] [Green Version]
- Nam, J.S.; Sharma, A.R.; Nguyen, L.T.; Jagga, S.; Lee, Y.H.; Sharma, G.; Lee, S.S. Lysophosphatidic acid enhances breast cancer cells-mediated osteoclastogenesis. Korean J. Physiol. Pharmacol. 2018, 22, 503–511. [Google Scholar] [CrossRef] [Green Version]
- Cífková, E.; Lísa, M.; Hrstka, R.; Vrána, D.; Gatěk, J.; Melichar, B.; Holčapek, M. Correlation of lipidomic composition of cell lines and tissues of breast cancer patients using hydrophilic interaction liquid chromatography/electrospray ionization mass spectrometry and multivariate data analysis. Rapid Commun. Mass Spectrom. 2017, 31, 253–263. [Google Scholar] [CrossRef]
- Monaco, M.E. Fatty acid metabolism in breast cancer subtypes. Oncotarget 2017, 8, 29487–29500. [Google Scholar] [CrossRef] [Green Version]
- Kourtidis, A.; Srinivasaiah, R.; Carkner, R.D.; Brosnan, M.J.; Conklin, D.S. Peroxisome proliferator-activated receptor-γ protects ERBB2-positive breast cancer cells from palmitate toxicity. Breast Cancer Res. 2009, 11, R16. [Google Scholar] [CrossRef] [Green Version]
- Newton, A.C.; Bootman, M.D.; Scott, J. Second messengers. Cold Spring Harb. Perspect. Biol. 2016, 8. [Google Scholar] [CrossRef]
- Abdelzaher, E.; Mostafa, M.F. Lysophosphatidylcholine acyltransferase 1 (LPCAT1) upregulation in breast carcinoma contributes to tumor progression and predicts early tumor recurrence. Tumor Biol. 2015, 36, 5473–5483. [Google Scholar] [CrossRef] [PubMed]
- Balla, T. Phosphoinositides: Tiny lipids with giant impact on cell regulation. Physiol. Rev. 2013, 93, 1019–1137. [Google Scholar] [CrossRef] [PubMed]
- Burke, J.E.; Dennis, E.A. Phospholipase A2 structure/function, mechanism, and signaling. J. Lipid Res. 2009, 50, S237. [Google Scholar] [CrossRef] [PubMed] [Green Version]
- Qu, J.; Zhao, X.; Wang, J.; Liu, C.; Sun, Y.; Cai, H.; Liu, J. Plasma phospholipase A2 activity may serve as a novel diagnostic biomarker for the diagnosis of breast cancer. Oncol. Lett. 2018, 15, 5236–5242. [Google Scholar] [CrossRef] [Green Version]
- Xu, H.; Sun, Y.; Zeng, L.; Li, Y.; Hu, S.; He, S.; Chen, H.; Zou, Q.; Luo, B. Inhibition of cytosolic phospholipase A2 alpha increases chemosensitivity in cervical carcinoma through suppressing β-catenin signaling. Cancer Biol. Ther. 2019, 20, 912–921. [Google Scholar] [CrossRef]
- Alberghina, M. Phospholipase A2: New lessons from endothelial cells. Microvasc. Res. 2010, 80, 280–285. [Google Scholar] [CrossRef]
- Tian, W.; Wijewickrama, G.T.; Jung, H.K.; Das, S.; Tun, M.P.; Gokhale, N.; Jin, W.J.; Kwang, P.K.; Cho, W. Mechanism of regulation of group IVA phospholipase A2 activity by Ser727 phosphorylation. J. Biol. Chem. 2008, 283, 3960–3971. [Google Scholar] [CrossRef] [Green Version]
- Ramanadham, S.; Tomader, A.; Ashley, J.W.; Bone, R.N.; Hancock, W.D.; Lei, X. Calcium-independent phospholipases A2 and their roles in biological processes and diseases. J. Lipid Res. 2015, 56, 1643–1668. [Google Scholar] [CrossRef] [Green Version]
- Kita, Y.; Ohto, T.; Uozumi, N.; Shimizu, T. Biochemical properties and pathophysiological roles of cytosolic phospholipase A2s. Biochim. Biophys. Acta Mol. Cell Biol. Lipids 2006, 1761, 1317–1322. [Google Scholar] [CrossRef]
- Yates, C.M.; Calder, P.C.; Ed Rainger, G. Pharmacology and therapeutics of omega-3 polyunsaturated fatty acids in chronic inflammatory disease. Pharmacol. Ther. 2014, 141, 272–282. [Google Scholar] [CrossRef]
- Yang, Y.; Lee, M.; Fairn, G.D. Phospholipid subcellular localization and dynamics. J. Biol. Chem. 2018, 293, 6230–6240. [Google Scholar] [CrossRef] [PubMed] [Green Version]
- Mμller, J.; Petković, M.; Schiller, J.; Arnhold, J. Pancreatic Phospholipase A2- Mediated Enhancement of the Respiratory Burst Response of Human Neutrophils. Z. fur Naturforsch. Sect. C J. Biosci. 2001, 56, 1150–1156. [Google Scholar] [CrossRef] [PubMed]
- Müller, J.; Petković, M.; Schiller, J.; Arnold, K.; Reichl, S.; Arnhold, J. Effects of lysophospholipids on the generation of reactive oxygen species by fMLP- and PMA-stimulated human neutrophils. Luminescence 2002, 17, 141–149. [Google Scholar] [CrossRef] [PubMed]
- Murakami, M.; Nakatani, Y.; Atsumi, G.I.; Inoue, K.; Kudo, I. Regulatory functions of phospholipase A2. Crit. Rev. Immunol. 2017, 37, 121–180. [Google Scholar] [CrossRef] [PubMed]
- Gresset, A.; Sondek, J.; Harden, T.K. The phospholipase C isozymes and their regulation. Subcell. Biochem. 2015, 58, 61–94. [Google Scholar]
- Reyland, M.E. Protein kinase C isoforms: Multi-functional regulators of cell life and death. Front. Biosci. 2009, 14, 2386–2399. [Google Scholar] [CrossRef] [Green Version]
- Litosch, I. Regulation of Phospholipase C-β Activity by Phosphatidic Acid: Isoform Dependence, Role of Protein Kinase C, and G Protein Subunits †. Biochemistry 2003, 42, 1618–1623. [Google Scholar] [CrossRef]
- Landgraf, K.E.; Malmberg, N.J.; Falke, J.J. Effect of PIP2 binding on the membrane docking geometry of PKCα C2 domain: An EPR site-directed spin-labeling and relaxation study. Biochemistry 2008, 47, 8301–8316. [Google Scholar] [CrossRef] [Green Version]
- Newton, A.C. Protein kinase C: Structure, function, and regulation. J. Biol. Chem. 1995, 270, 28495–28498. [Google Scholar] [CrossRef] [Green Version]
- Koss, H.; Bunney, T.D.; Behjati, S.; Katan, M. Dysfunction of phospholipase Cγ in immune disorders and cancer. Trends Biochem. Sci. 2014, 39, 603–611. [Google Scholar] [CrossRef] [Green Version]
- Selvy, P.E.; Lavieri, R.R.; Lindsley, C.W.; Brown, H.A. Phospholipase D: Enzymology, functionality, and chemical modulation. Chem. Rev. 2011, 111, 6064–6119. [Google Scholar] [CrossRef] [PubMed] [Green Version]
- Regier, D.S.; Waite, K.A.; Wallin, R.; McPhail, L.C. A phosphatidic acid-activated protein kinase and conventional protein kinase C isoforms phosphorylate p22(phox), an NADPH oxidase component. J. Biol. Chem. 1999, 274, 36601–36608. [Google Scholar] [CrossRef] [PubMed] [Green Version]
- Cho, J.H.; Han, J.S. Phospholipase D and its essential role in cancer. Mol. Cells 2017, 40, 805–813. [Google Scholar] [PubMed]
- Noble, A.R.; Maitland, N.J.; Berney, D.M.; Rumsby, M.G. Phospholipase D inhibitors reduce human prostate cancer cell proliferation and colony formation. Br. J. Cancer 2018, 118, 189–199. [Google Scholar] [CrossRef] [PubMed] [Green Version]
- Henkels, K.M.; Boivin, G.P.; Dudley, E.S.; Berberich, S.J.; Gomez-Cambronero, J. Phospholipase D (PLD) drives cell invasion, tumor growth and metastasis in a human breast cancer xenograph model. Oncogene 2013, 32, 5551–5562. [Google Scholar] [CrossRef] [Green Version]
- Teo, C.C.; Chong, W.P.K.; Tan, E.; Basri, N.B.; Low, Z.J.; Ho, Y.S. Advances in sample preparation and analytical techniques for lipidomics study of clinical samples. TrAC Trends Anal. Chem. 2015, 66, 1–18. [Google Scholar] [CrossRef]
- Aldana, J.; Romero-otero, A.; Cala, M.P. Exploring the lipidome: Current lipid extraction techniques for mass spectrometry analysis. Metabolites 2020, 10, 231. [Google Scholar] [CrossRef]
- Petković, M.; Vocks, A.; Müller, M.; Schiller, J.; Arnhold, J. Comparison of different procedures for the lipid extraction from HL-60 cells: A MALDI-TOF mass spectrometric study. Z. fur Naturforsch. Sect. C J. Biosci. 2005, 60, 143–151. [Google Scholar] [CrossRef]
- Bligh, E.G.; Dyer, W.J. A RAPID METHOD OF TOTAL LIPID EXTRACTION AND PURIFICATION. Can. J. Biochem. Physiol. 1959, 37, 911–917. [Google Scholar] [CrossRef] [Green Version]
- Wolf, C.; Quinn, P.J. Lipidomics: Practical aspects and applications. Prog. Lipid Res. 2008, 47, 15–36. [Google Scholar] [CrossRef]
- Züllig, T.; Trötzmüller, M.; Köfeler, H.C. Lipidomics from sample preparation to data analysis: A primer. Anal. Bioanal. Chem. 2020, 412, 2191–2209. [Google Scholar] [CrossRef] [PubMed] [Green Version]
- Vosse, C.; Wienken, C.; Cadenas, C.; Hayen, H. Separation and identification of phospholipids by hydrophilic interaction liquid chromatography coupled to tandem high resolution mass spectrometry with focus on isomeric phosphatidylglycerol and bis(monoacylglycero)phosphate. J. Chromatogr. A 2018, 1565, 105–113. [Google Scholar] [CrossRef] [PubMed]
- Hsu, F.F. Mass spectrometry-based shotgun lipidomics—A critical review from the technical point of view. Anal. Bioanal. Chem. 2018, 410, 6387–6409. [Google Scholar] [CrossRef] [PubMed]
- Cajka, T.; Fiehn, O. Toward Merging Untargeted and Targeted Methods in Mass Spectrometry-Based Metabolomics and Lipidomics. Anal. Chem. 2016, 88, 524–545. [Google Scholar] [CrossRef] [PubMed]
- Budczies, J.; Denkert, C.; Müller, B.M.; Brockmöller, S.F.; Klauschen, F.; Györffy, B.; Dietel, M.; Richter-Ehrenstein, C.; Marten, U.; Salek, R.M.; et al. Remodeling of central metabolism in invasive breast cancer compared to normal breast tissue—A GC-TOFMS based metabolomics study. BMC Genom. 2012, 13, 334. [Google Scholar] [CrossRef] [PubMed] [Green Version]
- Tsugawa, H.; Ikeda, K.; Arita, M. The importance of bioinformatics for connecting data-driven lipidomics and biological insights. Biochim. Biophys. Acta Mol. Cell Biol. Lipids 2017, 1862, 762–765. [Google Scholar] [CrossRef]
- Cífková, E.; Holčapek, M.; Lísa, M.; Vrána, D.; Gatěk, J.; Melichar, B. Determination of lipidomic differences between human breast cancer and surrounding normal tissues using HILIC-HPLC/ESI-MS and multivariate data analysis. Anal. Bioanal. Chem. 2015, 407, 991–1002. [Google Scholar] [CrossRef]
- Zhang, W.; Zhang, D.; Chen, Q.; Wu, J.; Ouyang, Z.; Xia, Y. Online photochemical derivatization enables comprehensive mass spectrometric analysis of unsaturated phospholipid isomers. Nat. Commun. 2019, 10, 1–9. [Google Scholar]
- Hilvo, M.; Denkert, C.; Lehtinen, L.; Müller, B.; Brockmöller, S.; Seppänen-Laakso, T.; Budczies, J.; Bucher, E.; Yetukuri, L.; Castillo, S.; et al. Novel theranostic opportunities offered by characterization of altered membrane lipid metabolism in breast cancer progression. Cancer Res. 2011, 71, 3236–3245. [Google Scholar] [CrossRef] [Green Version]
- Chong, J.; Wishart, D.S.; Xia, J. Using MetaboAnalyst 4.0 for Comprehensive and Integrative Metabolomics Data Analysis. Curr. Protoc. Bioinform. 2019, 68, e86. [Google Scholar] [CrossRef]
- Petković, M.; Schiller, J.; Müller, M.; Benard, S.; Reichl, S.; Arnold, K.; Arnhold, J. Detection of individual phospholipids in lipid mixtures by matrix-assisted laser desorption/ionization time-of-flight mass spectrometry: Phosphatidylcholine prevents the detection of further species. Anal. Biochem. 2001, 289, 202–216. [Google Scholar] [CrossRef] [PubMed]
- Schiller, J.; Süß, R.; Petković, M.; Hilbert, N.; Müller, M.; Zschörnig, O.; Arnhold, J.; Arnold, K. CsCl as an auxiliary reagent for the analysis of phosphatidylcholine mixtures by matrix-assisted laser desorption and ionization time-of-flight mass spectrometry (MALDI-TOF MS). Chem. Phys. Lipids 2001, 113, 123–131. [Google Scholar] [CrossRef]
- Jelonek, K.; Ros, M.; Pietrowska, M.; Widlak, P. Cancer biomarkers and mass spectrometry-based analyses of phospholipids in body fluids. Clin. Lipidol. 2013, 8, 137–150. [Google Scholar] [CrossRef]
- Angel, M.; Rodrigo, M.; Zitka, O.; Krizkova, S.; Moulick, A.; Adam, V.; Kizek, R. MALDI-TOF MS as evolving cancer diagnostic tool: A review. J. Pharm. Biomed. Anal. 2014, 95, 245–255. [Google Scholar]
- Arentz, G.; Mittal, P.; Zhang, C.; Ho, Y.Y.; Briggs, M.; Winderbaum, L.; Hoffmann, M.K.; Hoffmann, P. Applications of Mass Spectrometry Imaging to Cancer. In Advances in Cancer Research; Academic Press Inc.: Cambridge, MA, USA, 2017; Volume 134, pp. 27–66. ISBN 9780128052495. [Google Scholar]
- Silva, C.L.; Perestrelo, R.; Sousa-Ferreira, I.; Capelinha, F.; Câmara, J.S.; Petković, M. Lipid biosignature of breast cancer tissues by matrix-assisted laser desorption/ionization time-of-flight mass spectrometry. Breast Cancer Res. Treat. 2020, 182, 9–19. [Google Scholar] [CrossRef] [PubMed]
- Cho, Y.T.; Su, H.; Chiang, Y.Y.; Shiea, J.; Yuan, S.S.F.; Hung, W.C.; Yeh, Y.T.; Hou, M.F. Fine Needle Aspiration Combined With Matrix-assisted Laser Desorption Ionization Time-of-Flight/Mass Spectrometry to Characterize Lipid Biomarkers for Diagnosing Accuracy of Breast Cancer. Clin. Breast Cancer 2017, 17, 373–381.e1. [Google Scholar] [CrossRef]
- Kang, H.S.; Lee, S.C.; Park, Y.S.; Jeon, Y.E.; Lee, J.H.; Jung, S.Y.; Park, I.H.; Jang, S.H.; Park, H.M.; Yoo, C.W.; et al. Protein and lipid MALDI profiles classify breast cancers according to the intrinsic subtype. BMC Cancer 2011, 11, 465. [Google Scholar] [CrossRef] [Green Version]
- Calligaris, D.; Caragacianu, D.; Liu, X.; Norton, I.; Thompson, C.J.; Richardson, A.L.; Golshan, M.; Easterling, M.L.; Santagata, S.; Dillon, D.A.; et al. Application of desorption electrospray ionization mass spectrometry imaging in breast cancer margin analysis. Proc. Natl. Acad. Sci. USA 2014, 111, 15184–15189. [Google Scholar] [CrossRef] [Green Version]
- Gessel, M.M.; Norris, J.L.; Caprioli, R.M. MALDI imaging mass spectrometry: Spatial molecular analysis to enable a new age of discovery. J. Proteom. 2014, 107, 71–82. [Google Scholar] [CrossRef]
- Wang, S.; Chen, X.; Luan, H.; Gao, D.; Lin, S.; Cai, Z.; Liu, J.; Liu, H.; Jiang, Y. Matrix-assisted laser desorption/ionization mass spectrometry imaging of cell cultures for the lipidomic analysis of potential lipid markers in human breast cancer invasion. Rapid Commun. Mass Spectrom. 2016, 30, 533–542. [Google Scholar] [CrossRef]
- Ide, Y.; Waki, M.; Hayasaka, T.; Nishio, T.; Morita, Y.; Tanaka, H.; Sasaki, T.; Koizumi, K.; Matsunuma, R.; Hosokawa, Y.; et al. Human Breast Cancer Tissues Contain Abundant Phosphatidylcholine(36:1) with High Stearoyl-CoA Desaturase-1 Expression. PLoS ONE 2013, 8, e61204. [Google Scholar] [CrossRef]
- Végvári, Á.; Shavkunov, A.S.; Fehniger, T.E.; Grabau, D.; Niméus, E.; Marko-Varga, G. Localization of tamoxifen in human breast cancer tumors by MALDI mass spectrometry imaging. Clin. Transl. Med. 2016, 5, 10. [Google Scholar] [CrossRef] [PubMed] [Green Version]
- Mao, X.; He, J.; Li, T.; Lu, Z.; Sun, J.; Meng, Y.; Abliz, Z.; Chen, J. Application of imaging mass spectrometry for the molecular diagnosis of human breast tumors. Sci. Rep. 2016, 6, 21043. [Google Scholar] [CrossRef] [PubMed]
- Barupal, D.K.; Fan, S.; Wancewicz, B.; Cajka, T.; Sa, M.; Showalter, M.R.; Baillie, R.; Tenenbaum, J.D.; Louie, G.; Kaddurah-Daouk, R.; et al. Generation and quality control of lipidomics data for the alzheimer’s disease neuroimaging initiative cohort. Sci. Data 2018, 5, 180263. [Google Scholar] [CrossRef] [PubMed]
- Eiriksson, F.F.; Nøhr, M.K.; Costa, M.; Bödvarsdottir, S.K.; Ögmundsdottir, H.M.; Thorsteinsdottir, M. Lipidomic study of cell lines reveals differences between breast cancer subtypes. PLoS ONE 2020, 15, e0231289. [Google Scholar] [CrossRef] [PubMed] [Green Version]
- Garwolińska, D.; Hewelt-Belka, W.; Namieśnik, J.; Kot-Wasik, A. Rapid Characterization of the Human Breast Milk Lipidome Using a Solid-Phase Microextraction and Liquid Chromatography-Mass Spectrometry-Based Approach. J. Proteome Res. 2017, 16, 3200–3208. [Google Scholar] [CrossRef] [PubMed]
- Hutchins, P.D.; Russell, J.D.; Coon, J.J. Mapping Lipid Fragmentation for Tailored Mass Spectral Libraries. J. Am. Soc. Mass Spectrom. 2019, 30, 659–668. [Google Scholar] [CrossRef]
- Pi, J.; Wu, X.; Feng, Y. Fragmentation patterns of five types of phospholipids by ultra-high-performance liquid chromatography electrospray ionization quadrupole time-of-flight tandem mass spectrometry. Anal. Methods 2016, 8, 1319–1332. [Google Scholar] [CrossRef]
- Zemski Berry, K.A.; Hankin, J.A.; Barkley, R.M.; Spraggins, J.M.; Caprioli, R.M.; Murphy, R.C. MALDI imaging of lipid biochemistry in tissues by mass spectrometry. Chem. Rev. 2011, 111, 6491–6512. [Google Scholar] [CrossRef] [Green Version]
- Reuter, S.; Gupta, S.C.; Chaturvedi, M.M.; Aggarwal, B.B. Oxidative stress, inflammation, and cancer: How are they linked? Free Radic. Biol. Med. 2010, 49, 1603–1616. [Google Scholar] [CrossRef] [PubMed] [Green Version]
- Azordegan, N.; Fraser, V.; Le, K.; Hillyer, L.M.; Ma, D.W.L.; Fischer, G.; Moghadasian, M.H. Carcinogenesis alters fatty acid profile in breast tissue. Mol. Cell. Biochem. 2013, 374, 223–232. [Google Scholar] [CrossRef] [PubMed]
- Barrera, G. Oxidative Stress and Lipid Peroxidation Products in Cancer Progression and Therapy. ISRN Oncol. 2012, 2012, 137289. [Google Scholar] [CrossRef] [PubMed] [Green Version]
- Karihtala, P.; Kauppila, S.; Puistola, U.; Jukkola-Vuorinen, A. Divergent behaviour of oxidative stress markers 8-hydroxydeoxyguanosine (8-OHdG) and 4-hydroxy-2-nonenal (HNE) in breast carcinogenesis. Histopathology 2011, 58, 854–862. [Google Scholar] [CrossRef]
- Fuchs, B.; Bresler, K.; Schiller, J. Oxidative changes of lipids monitored by MALDI MS. Chem. Phys. Lipids 2011, 164, 782–795. [Google Scholar] [CrossRef] [PubMed]
- Arnhold, J.; Osipov, A.N.; Spalteholz, H.; Panasenko, O.M.; Schiller, J. Formation of lysophospholipids from unsaturated phosphatidylcholines under the influence of hypochlorous acid. Biochim. Biophys. Acta Gen. Subj. 2002, 1572, 91–100. [Google Scholar] [CrossRef]
- Rodrigues, C.; Milkovic, L.; Bujak, I.T.; Tomljanovic, M.; Soveral, G.; Cipak Gasparovic, A. Lipid Profile and Aquaporin Expression under Oxidative Stress in Breast Cancer Cells of Different Malignancies. Oxid. Med. Cell. Longev. 2019, 2019, 2061830. [Google Scholar] [CrossRef] [Green Version]
- Erejuwa, O.O.; Sulaiman, S.A.; Ab Wahab, M.S. Evidence in support of potential applications of lipid peroxidation products in cancer treatment. Oxid. Med. Cell. Longev. 2013, 2013, 931251. [Google Scholar] [CrossRef]
- Umetani, M.; Domoto, H.; Gormley, A.K.; Yuhanna, I.S.; Cummins, C.L.; Javitt, N.B.; Korach, K.S.; Shaul, P.W.; Mangelsdorf, D.J. 27-Hydroxycholesterol is an endogenous SERM that inhibits the cardiovascular effects of estrogen. Nat. Med. 2007, 13, 1185–1192. [Google Scholar] [CrossRef]
- Moresco, M.A.; Raccosta, L.; Corna, G.; Maggioni, D.; Soncini, M.; Bicciato, S.; Doglioni, C.; Russo, V. Enzymatic Inactivation of Oxysterols in Breast Tumor Cells Constraints Metastasis Formation by Reprogramming the Metastatic Lung Microenvironment. Front. Immunol. 2018, 9, 2251. [Google Scholar] [CrossRef] [Green Version]
- Sparvero, L.J.; Amoscato, A.A.; Dixon, C.E.; Long, J.B.; Kochanek, P.M.; Pitt, B.R.; Bayir, H.; Kagan, V.E. Mapping of phospholipids by MALDI imaging (MALDI-MSI): Realities and expectations. Chem. Phys. Lipids 2012, 165, 545–562. [Google Scholar] [CrossRef] [Green Version]
- Heather, L.C.; Wang, X.; West, J.A.; Griffin, J.L. A practical guide to metabolomic profiling as a discovery tool for human heart disease. J. Mol. Cell. Cardiol. 2013, 55, 2–11. [Google Scholar] [CrossRef] [PubMed]
- Silva, C.; Perestrelo, R.; Silva, P.; Tomás, H.; Câmara, J.S. Breast Cancer Metabolomics: From Analytical Platforms to Multivariate Data Analysis. A Review. Metabolites 2019, 9, 102. [Google Scholar] [CrossRef] [PubMed] [Green Version]
- Yi, L.; Dong, N.; Yun, Y.; Deng, B.; Ren, D.; Liu, S.; Liang, Y. Chemometric methods in data processing of mass spectrometry-based metabolomics: A review. Anal. Chim. Acta 2016, 914, 17–34. [Google Scholar] [CrossRef] [PubMed]
- Xi, B.; Gu, H.; Baniasadi, H.; Raftery, D. Statistical analysis and modeling of mass spectrometry-based metabolomics data. Methods Mol. Biol. 2014, 1198, 333–353. [Google Scholar]
- Chagovets, V.V.; Starodubtseva, N.L.; Tokareva, A.O.; Frankevich, V.E.; Rodionov, V.V.; Kometova, V.V.; Chingin, K.; Kukaev, E.N.; Chen, H.; Sukhikh, G.T. Validation of Breast Cancer Margins by Tissue Spray Mass Spectrometry. Int. J. Mol. Sci. 2020, 21, 4568. [Google Scholar] [CrossRef]
- Dória, M.L.; Cotrim, C.Z.; Simões, C.; Macedo, B.; Domingues, P.; Domingues, M.R.; Helguero, L.A. Lipidomic analysis of phospholipids from human mammary epithelial and breast cancer cell lines. J. Cell. Physiol. 2013, 228, 457–468. [Google Scholar] [CrossRef]
- Hu, J.; Tian, G.; Zhang, N. Cytosolic phospholipase A2 and its role in cancer. Clin. Oncol. Cancer Res. 2011, 8, 71–76. [Google Scholar] [CrossRef]
- Luquain, C.; Sciorra, V.A.; Morris, A.J. Lysophosphatidic acid signaling: How a small lipid does big things. Trends Biochem. Sci. 2003, 28, 377–383. [Google Scholar] [CrossRef]
- Song, Y.; Wilkins, P.; Hu, W.; Murthy, K.S.; Chen, J.; Lee, Z.; Oyesanya, R.; Wu, J.; Barbour, S.E.; Fang, X. Inhibition of calcium-independent phospholipase A2 suppresses proliferation and tumorigenicity of ovarian carcinoma cells. Biochem. J. 2007, 406, 427–436. [Google Scholar] [CrossRef] [Green Version]
- Yamashita, S.I.; Yamashita, J.I.; Ogawa, M. Overexpression of group II phospholipase A2 in human breast cancer tissues is closely associated with their malignant potency. Br. J. Cancer 1994, 69, 1166–1170. [Google Scholar] [CrossRef] [Green Version]
- Chen, H.-Z.; Qu, Y.-H.; Diao, C.-Y.; Wang, X.-H.; Gao, M.; Song, L.-J.; Gao, X.-Z.; Han, J.; Wang, F.; Li, S.-L.; et al. Expression of phospholipase A2 in breast cancer tissues and its significance. Int. J. Clin. Exp. Pathol. 2016, 9, 11820–11825. [Google Scholar]
- Li, Z.; Qu, M.; Sun, Y.; Wan, H.; Chai, F.; Liu, L.; Zhang, P. Blockage of cytosolic phospholipase A2 alpha sensitizes aggressive breast cancer to doxorubicin through suppressing ERK and mTOR kinases. Biochem. Biophys. Res. Commun. 2018, 496, 153–158. [Google Scholar] [CrossRef]
- Sved, P.; Scott, K.F.; McLeod, D.; King, N.J.C.; Singh, J.; Tsatralis, T.; Nikolov, B.; Boulas, J.; Nallan, L.; Gelb, M.H.; et al. Oncogenic action of secreted phospholipase A2 in prostate cancer. Cancer Res. 2004, 64, 6934–6940. [Google Scholar] [CrossRef] [PubMed] [Green Version]
- Kameva, T.; Flemmig, J.; Damnjanović, B.; Arnhold, J.; Mijatović, A.; Petković, M. Inhibitory effect of platinum and ruthenium bipyridyl complexes on porcine pancreatic phospholipase A 2. Metallomics 2011, 3, 1056–1063. [Google Scholar] [CrossRef] [PubMed]
- Kamčeva, T.; Radisavljević, M.; Vukićević, I.; Arnhold, J.; Petković, M. Interactions of Platinum and Ruthenium Coordination Complexes with Pancreatic Phospholipase A 2 and Phospholipids Investigated by MALDI TOF Mass Spectrometry. Chem. Biodivers. 2013, 10, 1972–1986. [Google Scholar] [CrossRef] [PubMed]
- Stephenson, D.J.; Macknight, H.P.; Hoeferlin, L.A.; Park, M.A.; Allegood, J.C.; Cardona, C.L.; Chalfant, C.E. A rapid and adaptable lipidomics method for quantitative UPLC-mass spectrometric analysis of phosphatidylethanolamine and phosphatidylcholine: In vitro, and in cells. Anal. Methods 2019, 11, 1765–1776. [Google Scholar] [CrossRef] [PubMed]
- Tyurin, V.A.; Yanamala, N.; Tyurina, Y.Y.; Klein-Seetharaman, J.; MacPhee, C.H.; Kagan, V.E. Specificity of lipoprotein-associated phospholipase A2 toward oxidized phosphatidylserines: Liquid chromatography-electrospray ionization mass spectrometry characterization of products and computer modeling of interactions. Biochemistry 2012, 51, 9736–9750. [Google Scholar] [CrossRef] [Green Version]
- Zaima, N.; Hayasaka, T.; Goto-Inoue, N.; Setou, M. Matrix-Assisted Laser Desorption/Ionization Imaging Mass Spectrometry. Int. J. Mol. Sci. 2010, 11, 5040–5055. [Google Scholar] [CrossRef] [Green Version]
- Ucal, Y.; Durer, Z.A.; Atak, H.; Kadioglu, E.; Sahin, B.; Coskun, A.; Baykal, A.T.; Ozpinar, A. Clinical applications of MALDI imaging technologies in cancer and neurodegenerative diseases. Biochim. Biophys. Acta Proteins Proteom. 2017, 1865, 795–816. [Google Scholar] [CrossRef]
- Koizumi, S.; Yamamoto, S.; Hayasaka, T.; Konishi, Y.; Yamaguchi-Okada, M.; Goto-Inoue, N.; Sugiura, Y.; Setou, M.; Namba, H. Imaging mass spectrometry revealed the production of lyso-phosphatidylcholine in the injured ischemic rat brain. Neuroscience 2010, 168, 219–225. [Google Scholar] [CrossRef]
- Goto, T.; Terada, N.; Inoue, T.; Nakayama, K.; Okada, Y.; Yoshikawa, T.; Miyazaki, Y.; Uegaki, M.; Sumiyoshi, S.; Kobayashi, T.; et al. The Expression Profile of Phosphatidylinositol in High Spatial Resolution Imaging Mass Spectrometry as a Potential Biomarker for Prostate Cancer. PLoS ONE 2014, 9, e90242. [Google Scholar] [CrossRef] [Green Version]
- Zhou, X.; Mei, H.; Agee, J.; Brown, T.; Mao, J. Racial differences in distribution of fatty acids in prostate cancer and benign prostatic tissues. Lipids Health Dis. 2019, 18, 189. [Google Scholar] [CrossRef] [PubMed] [Green Version]
- Wang, X.; Han, J.; Hardie, D.B.; Yang, J.; Pan, J.; Borchers, C.H. Metabolomic profiling of prostate cancer by matrix assisted laser desorption/ionization-Fourier transform ion cyclotron resonance mass spectrometry imaging using Matrix Coating Assisted by an Electric Field (MCAEF). Biochim. Biophys. Acta Proteins Proteom. 2017, 1865, 755–767. [Google Scholar] [CrossRef] [PubMed]


| Class | Fragments, Positive Ion Mode | Fragments, Negative Ion Mode | References |
|---|---|---|---|
| PC | m/z 184, Δ59 (neutral loss of choline), Δ183 (loss of phosphocholine), loss of fatty acid (corresponding LPC) | m/z 168 | [81] |
| SM | m/z 184, Δ59 (neutral loss of choline) | m/z 168 | [81,82] |
| PE | m/z [M-H-141]+, loss of FA (corresponding LPE) | m/z 140 | [81] |
| PI | m/z 417 | m/z 241 | [81] |
| PS | m/z [M-H-185]+ | m/z [M-H-87]− | [81] |
| Fatty acyl ions | m/z 239 (C16:0), m/z 267 (C18:0), m/z 287 (C20:4) | m/z 255 (C16:0), m/z 283 (C18:0), m/z 303 (C20:4) | [81,82] |
Publisher’s Note: MDPI stays neutral with regard to jurisdictional claims in published maps and institutional affiliations. |
© 2021 by the authors. Licensee MDPI, Basel, Switzerland. This article is an open access article distributed under the terms and conditions of the Creative Commons Attribution (CC BY) license (http://creativecommons.org/licenses/by/4.0/).
Share and Cite
Perestrelo, R.; Petkovic, M.; Silva, C.L. Analytical Platforms for the Determination of Phospholipid Turnover in Breast Cancer Tissue: Role of Phospholipase Activity in Breast Cancer Development. Metabolites 2021, 11, 32. https://0-doi-org.brum.beds.ac.uk/10.3390/metabo11010032
Perestrelo R, Petkovic M, Silva CL. Analytical Platforms for the Determination of Phospholipid Turnover in Breast Cancer Tissue: Role of Phospholipase Activity in Breast Cancer Development. Metabolites. 2021; 11(1):32. https://0-doi-org.brum.beds.ac.uk/10.3390/metabo11010032
Chicago/Turabian StylePerestrelo, Rosa, Marijana Petkovic, and Catarina Luís Silva. 2021. "Analytical Platforms for the Determination of Phospholipid Turnover in Breast Cancer Tissue: Role of Phospholipase Activity in Breast Cancer Development" Metabolites 11, no. 1: 32. https://0-doi-org.brum.beds.ac.uk/10.3390/metabo11010032