
Metabolomic Profile of Young Adults Born Preterm

 , , , , ,
Abstract
:1. Introduction
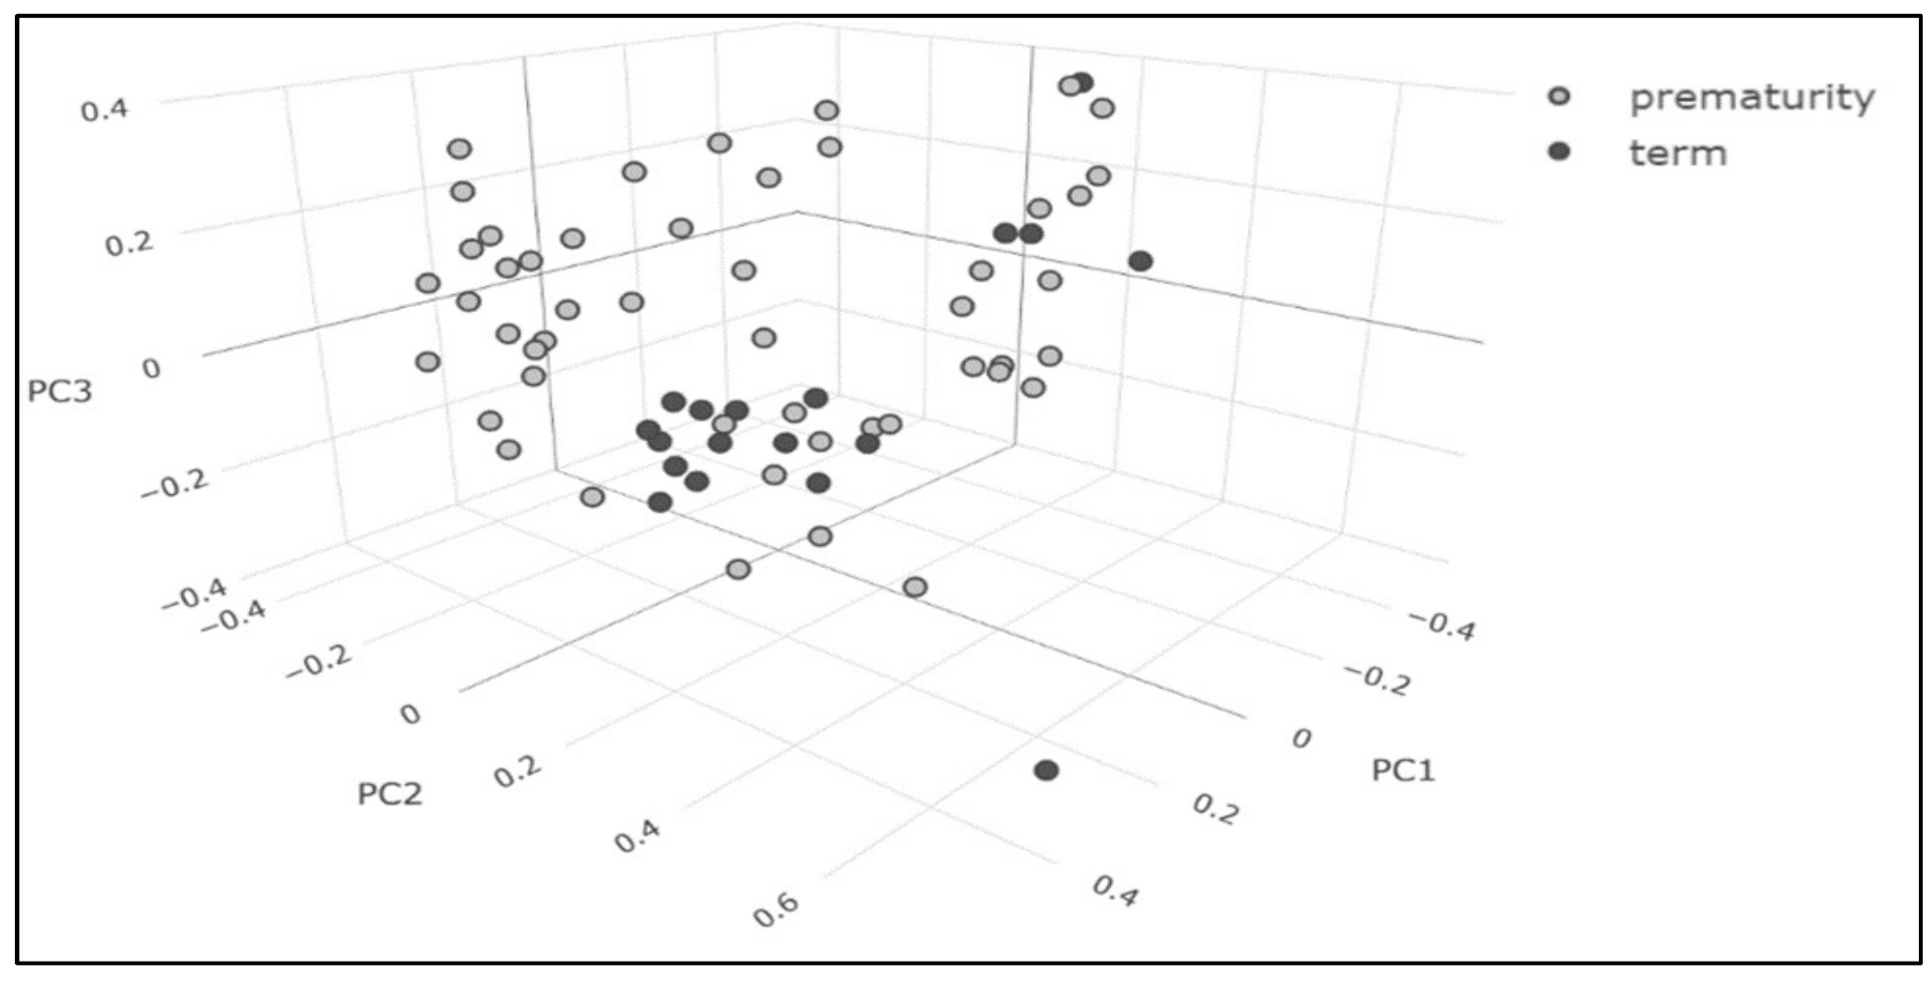
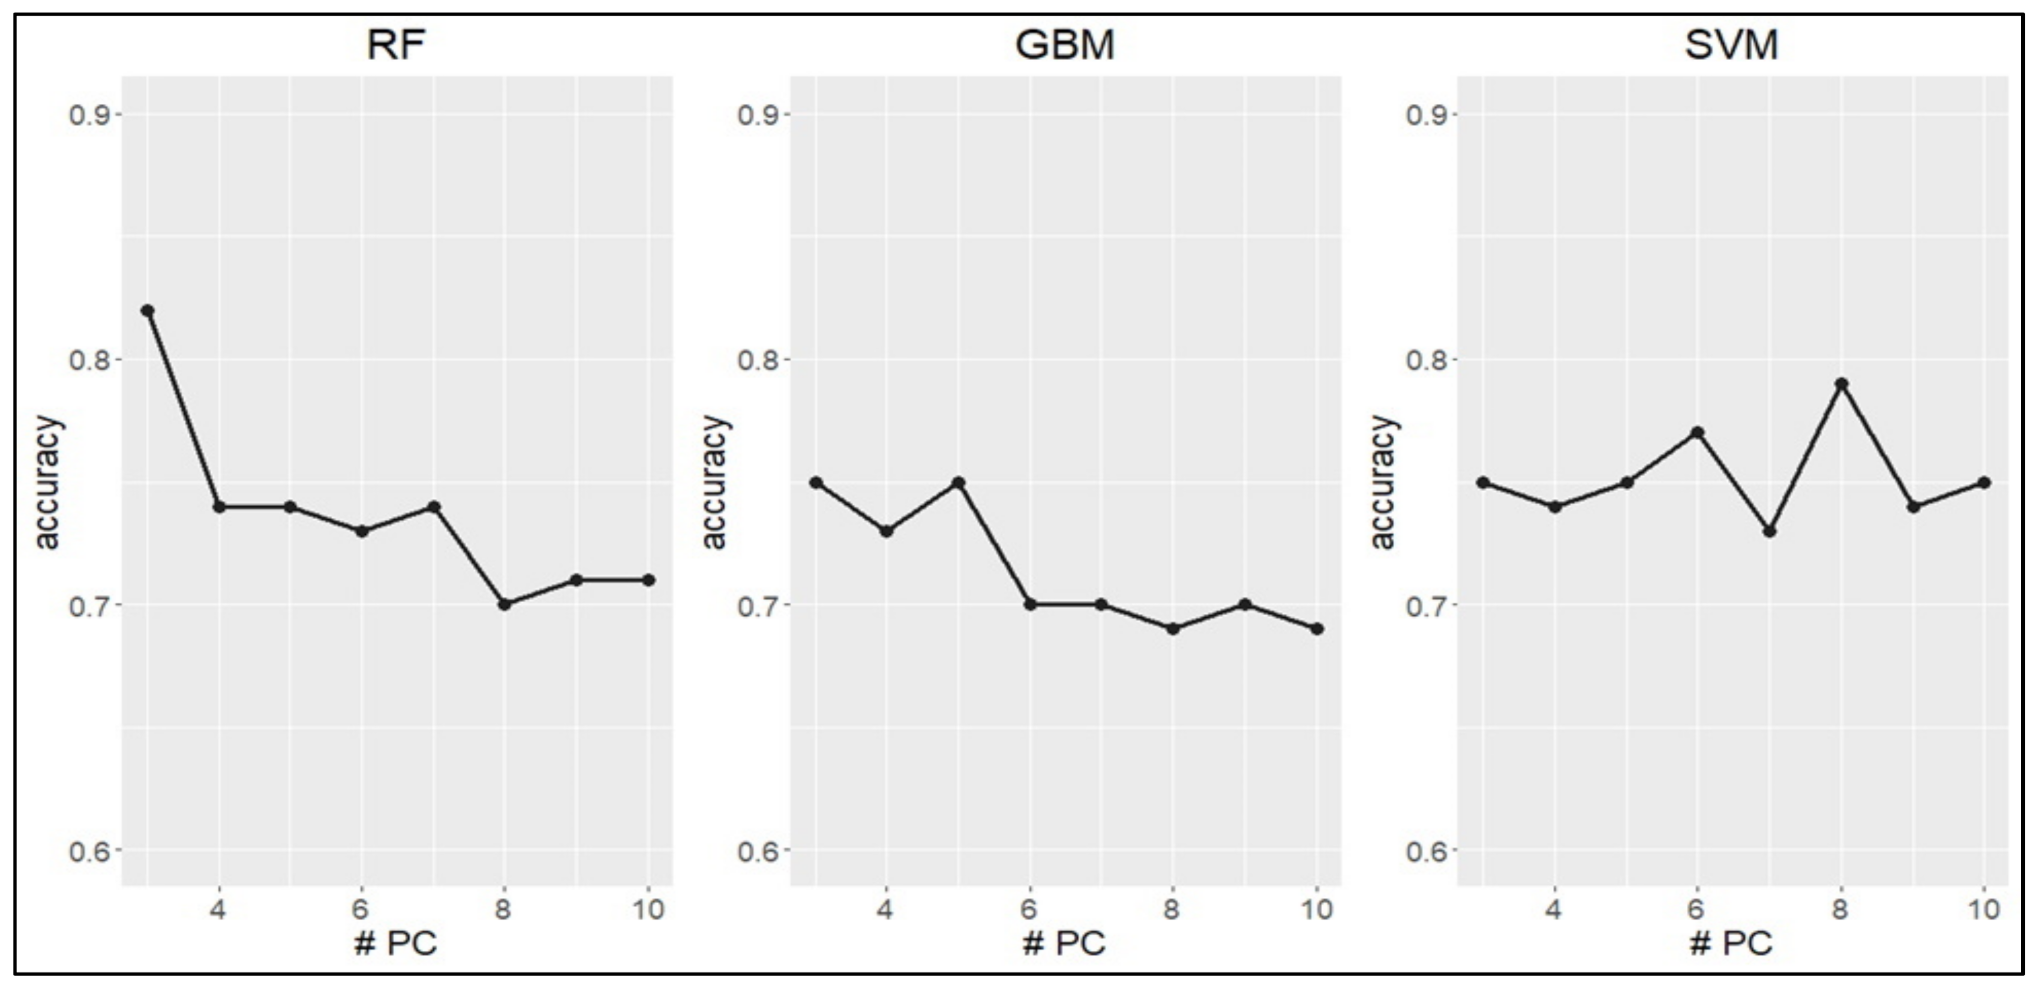
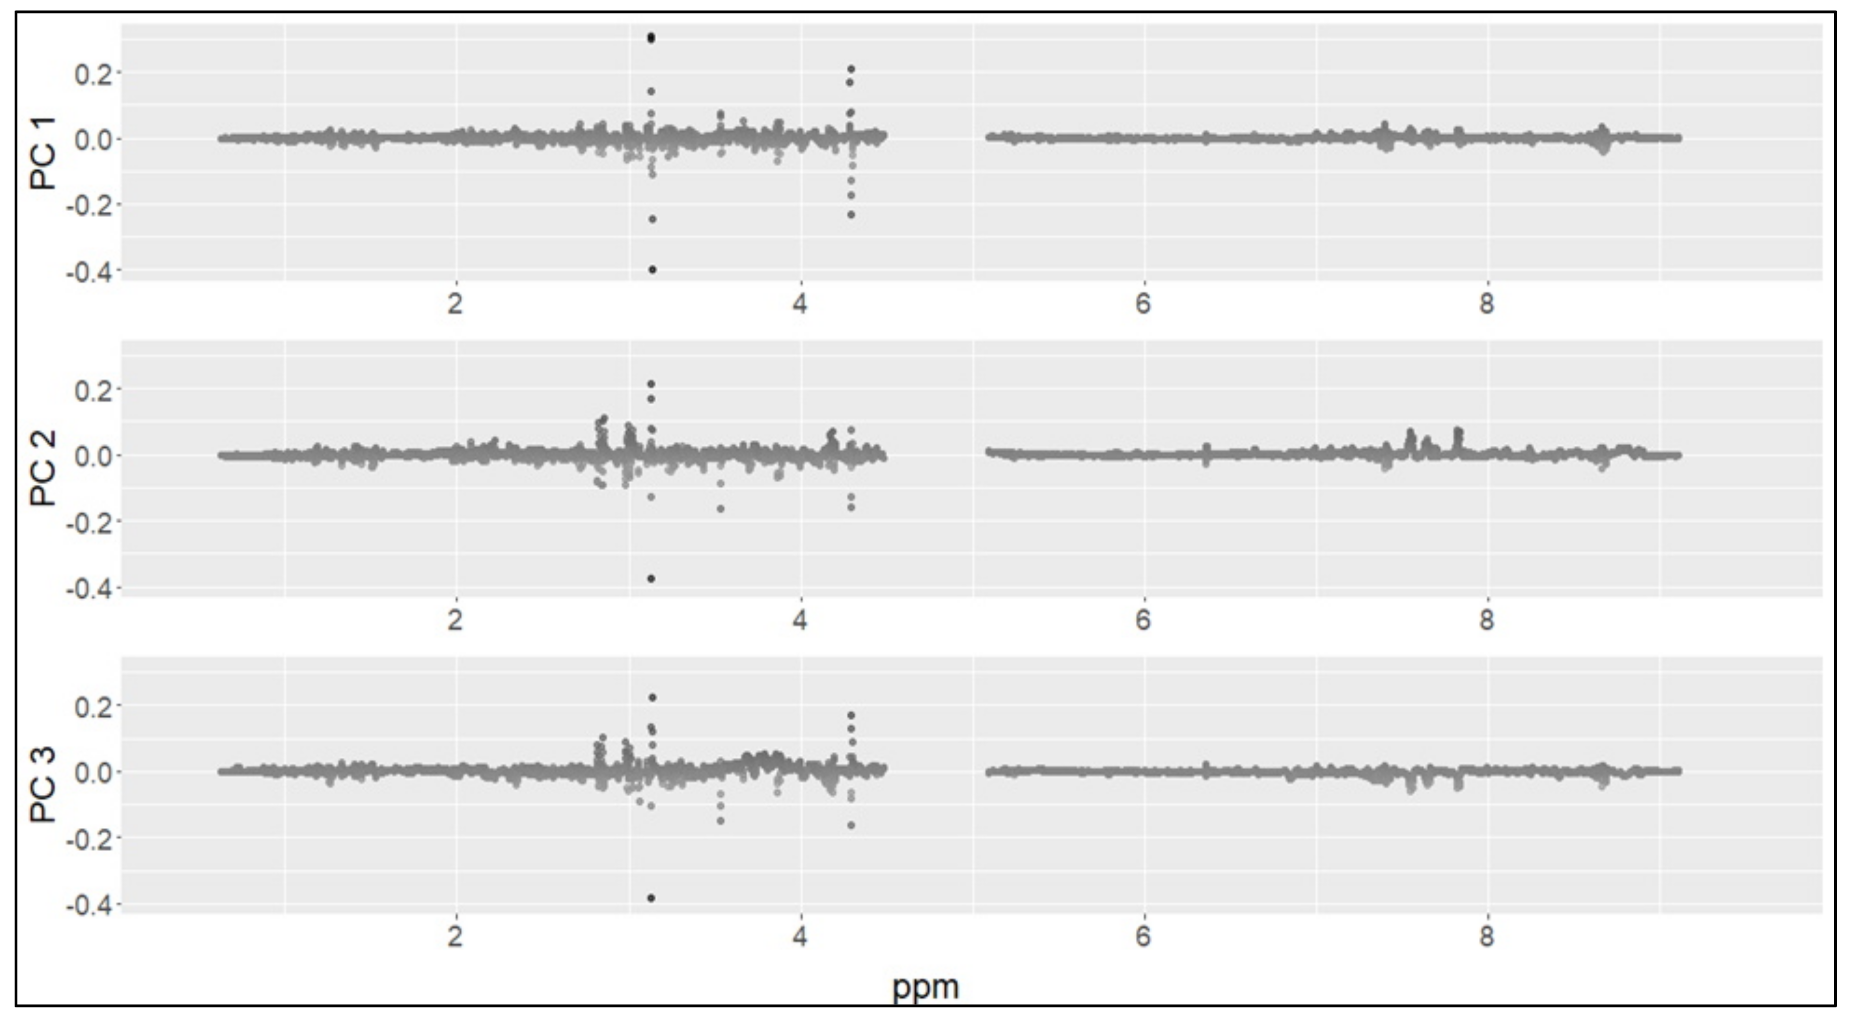
2. Results
3. Discussion
4. Materials and Methods
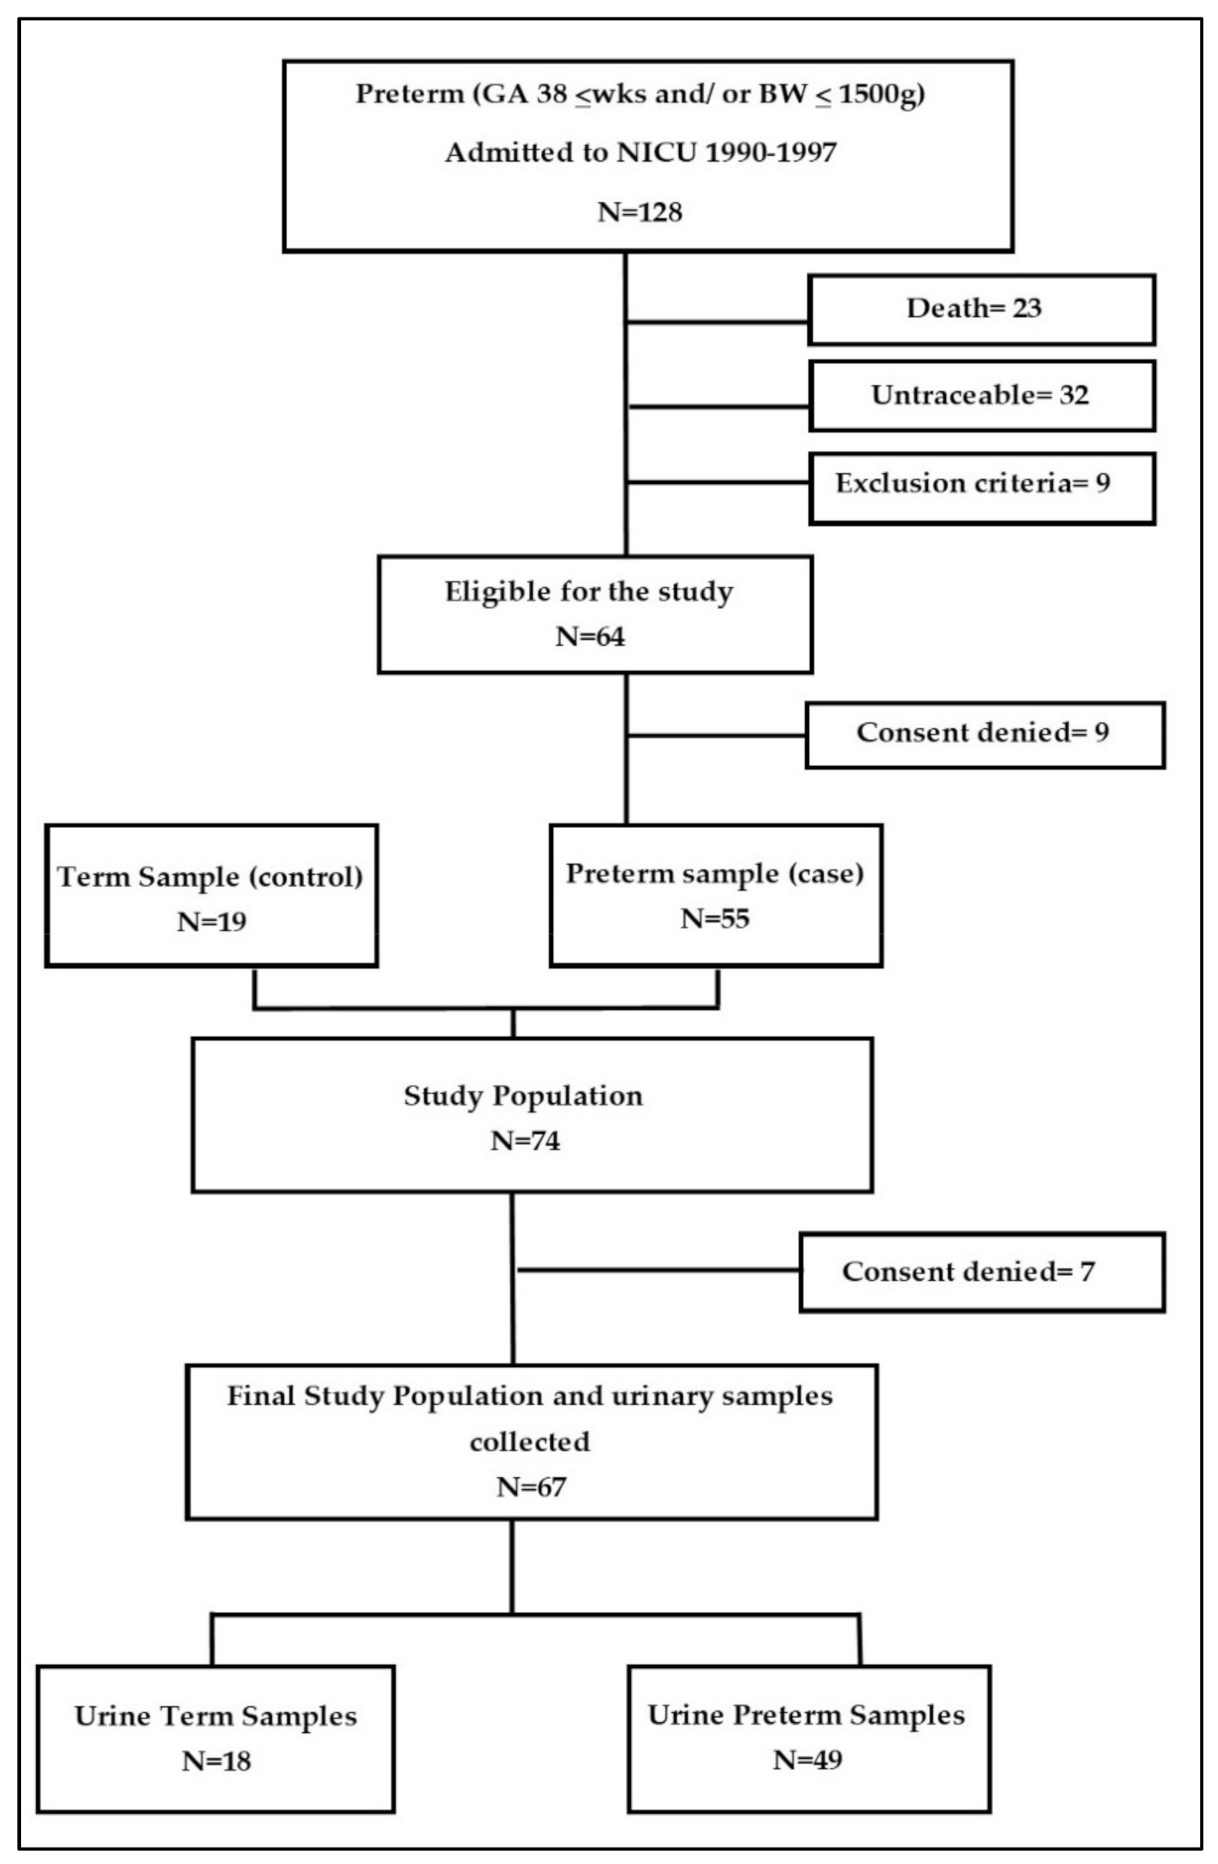
4.1. Inclusion and Exclusion Criteria
4.2. Clinical Data Collection
4.3. 1H-NMR
4.4. Statistical Analysis
5. Conclusions
Author Contributions
Funding
Institutional Review Board Statement
Informed Consent Statement
Data Availability Statement
Conflicts of Interest
References
- Hofman, P.L.; Regan, F.; Jackson, W.E.; Jefferies, C.; Knight, D.B.; Robinson, E.M.; Cutfield, W.S. Premature birth and later insulin resistance. N. Engl. J. Med. 2004, 351, 2179–2186. [Google Scholar] [CrossRef] [PubMed] [Green Version]
- Tinnion, R.; Gillone, J.; Cheetham, T.; Embleton, N. Preterm birth and subsequent insulin sensitivity: A systematic review. Arch. Dis. Child. 2014, 99, 362–368. [Google Scholar] [CrossRef] [PubMed]
- Hack, M.; Schluchter, M.; Cartar, L.; Rahman, M. Blood pressure among very low birth weight (<1.5 kg) young adults. Pediatr. Res. 2005, 58, 677–684. [Google Scholar] [CrossRef] [PubMed] [Green Version]
- De Jong, F.; Monuteaux, M.C.; van Elburg, R.M.; Gillman, M.W.; Belfort, M.B. Systematic review and meta-analysis of preterm birth and later systolic blood pressure. Hypertension 2012, 59, 226–234. [Google Scholar] [CrossRef] [Green Version]
- Barker, D.J.; Gluckman, P.D.; Robinson, J.S. Conference report: Fetal origins of adult disease—Report of the First International Study Group, Sydney, 29–30 October 1994. Placenta 1995, 16, 317–320. [Google Scholar] [CrossRef]
- Perrone, S.; Tataranno, M.L.; Santacroce, A.; Bracciali, C.; Riccitelli, M.; Alagna, M.G.; Longini, M.; Belvisi, E.; Bazzini, F.; Buonocore, G.F.; et al. Programming, Maternal Nutrition, and Oxidative Stress Hypothesis. J. Pediatr. Biochem. 2016, 06, 96–102. [Google Scholar] [CrossRef]
- Ellis, D.I.; Dunn, W.B.; Griffin, J.L.; Allwood, J.W.; Goodacre, R. Metabolic fingerprinting as a diagnostic tool. Pharmacogenomics 2007, 8, 1243–1266. [Google Scholar] [CrossRef] [Green Version]
- Gracie, S.; Pennell, C.; Ekman-Ordeberg, G.; Lye, S.; McManaman, J.; Williams, S.; Palmer, L.; Kelley, M.; Menon, R.; Gravett, M.; et al. An integrated systems biology approach to the study of preterm birth using “-omic” technology—A guideline for research. BMC Pregnancy Childbirth 2011, 11, 71. [Google Scholar] [CrossRef] [Green Version]
- Atzori, L.; Antonucci, R.; Barberini, L.; Locci, E.; Marincola, F.C.; Scano, P.; Cortesi, P.; Agostiniani, R.; Defraia, R.; Weljie, A.; et al. 1H NMR-based metabolomic analysis of urine from preterm and term neonates. Front. Biosci. 2011, 3, 1005–1012. [Google Scholar] [CrossRef] [Green Version]
- Dessì, A.; Atzori, L.; Noto, A.; Visser, G.H.; Gazzolo, D.; Zanardo, V.; Barberini, L.; Puddu, M.; Ottonello, G.; Atzei, A.; et al. Metabolomics in newborns with intrauterine growth retardation (IUGR): Urine reveals markers of metabolic syndrome. J. Matern Fetal. Neonatal. Med. 2011, 24 (Suppl. 2), 35–39. [Google Scholar] [CrossRef]
- Thomas, E.L.; Parkinson, J.R.; Hyde, M.J.; Yap, I.K.; Holmes, E.; Doré, C.J.; Bell, J.D.; Modi, N. Aberrant adiposity and ectopic lipid deposition characterize the adult phenotype of the preterm infant. Pediatr. Res. 2011, 70, 507–512. [Google Scholar] [CrossRef]
- Parkinson, J.R.C.; Wijeyesekera, A.D.; Hyde, M.J.; Singhal, A.; Lucas, A.; Holmes, E.; Modi, N. Early preterm nutrition and the urinary metabolome in young adult life: Follow-up of a randomised controlled trial. BMJ Paediatr. Open. 2017, 1, e000192. [Google Scholar] [CrossRef]
- Atzori, L.; Mussap, M.; Noto, A.; Barberini, L.; Puddu, M.; Coni, E.; Murgia, F.; Lussu, M.; Fanos, V. Clinical metabolomics and urinary NGAL for the early prediction of chronic kidney disease in healthy adults born ELBW. J. Matern Fetal. Neonatal. Med. 2011, 24 (Suppl 2), 40–43. [Google Scholar] [CrossRef]
- Scalabre, A.; Jobard, E.; Demède, D.; Gaillard, S.; Pontoizeau, C.; Mouriquand, P.; Elena-Herrmann, B.; Mure, P.Y. Evolution of Newborns’ Urinary Metabolomic Profiles According to Age and Growth. J. Proteome Res. 2017, 16, 3732–3740. [Google Scholar] [CrossRef]
- Chiu, C.Y.; Yeh, K.W.; Lin, G.; Chiang, M.H.; Yang, S.C.; Chao, W.J.; Yao, T.C.; Tsai, M.H.; Hua, M.C.; Liao, S.L.; et al. Metabolomics Reveals Dynamic Metabolic Changes Associated with Age in Early Childhood. PLoS ONE 2016, 11, e0149823. [Google Scholar] [CrossRef] [Green Version]
- Dessì, A.; Puddu, M.; Ottonello, G.; Fanos, V. Metabolomics and fetal-neonatal nutrition: Between “not enough” and “too much”. Molecules 2013, 18, 11724–11732. [Google Scholar] [CrossRef] [Green Version]
- Wilson, K.; Hawken, S.; Ducharme, R.; Potter, B.K.; Little, J.; Thébaud, B.; Chakraborty, P. Metabolomics of prematurity: Analysis of patterns of amino acids, enzymes, and endocrine markers by categories of gestational age. Pediatr. Res. 2014, 75, 367–373. [Google Scholar] [CrossRef] [Green Version]
- Gluckman, P.D.; Hanson, M.A. Living with the past: Evolution, development, and patterns of disease. Science 2004, 305, 1733–1736. [Google Scholar] [CrossRef] [Green Version]
- DiBattista, A.; Chakraborty, P. Quantitative characterization of the urine and serum metabolomes of children is essential for ‘omics’ studies. BMC Med. 2018, 16, 222. [Google Scholar] [CrossRef]
- Kim, O.Y.; Lee, J.H.; Sweeney, G. Metabolomic profiling as a useful tool for diagnosis and treatment of chronic disease: Focus on obesity, diabetes and cardiovascular diseases. Expert Rev. Cardiovasc. Ther. 2013, 11, 61–68. [Google Scholar] [CrossRef]
- Perrone, S.; Laschi, E.; De Bernardo, G.; Giordano, M.; Vanacore, F.; Tassini, M.; Calderisi, M.; Toni, A.L.; Buonocore, G.; Longini, M. Newborn metabolomic profile mirrors that of mother in pregnancy. Med. Hypotheses 2020, 137, 109543. [Google Scholar] [CrossRef] [PubMed]
- Tataranno, M.L.; Perrone, S.; Longini, M.; Coviello, C.; Tassini, M.; Vivi, A.; Calderisi, M.; deVries, L.S.; Groenendaal, F.; Buonocore, G.; et al. Predictive Role of Urinary Metabolic Profile for Abnormal MRI Score in Preterm Neonates. Dis. Mark. 2018, 2018, 4938194. [Google Scholar] [CrossRef] [PubMed]
- Lee, J.; Cai, J.; Li, F.; Vesoulis, Z.A. Predicting mortality risk for preterm infants using random forest. Sci. Rep. 2021, 11, 7308. [Google Scholar] [CrossRef] [PubMed]
- Menin, D.; Costabile, A.; Tenuta, F.; Oster, H.; Dondi, M. Identifying fetal yawns based on temporal dynamics of mouth openings: A preterm neonate model using support vector machines (SVMs). PLoS ONE 2019, 14, e0226921. [Google Scholar] [CrossRef] [Green Version]
- Sufriyana, H.; Husnayain, A.; Chen, Y.L.; Kuo, C.Y.; Singh, O.; Yeh, T.Y.; Wu, Y.W.; Su, E.C. Comparison of Multivariable Logistic Regression and Other Machine Learning Algorithms for Prognostic Prediction Studies in Pregnancy Care: Systematic Review and Meta-Analysis. JMIR Med. Inform. 2020, 8, e16503. [Google Scholar] [CrossRef]


| Variables | Cases (n = 49) | Controls (n = 18) | p-Value |
|---|---|---|---|
| Maternal age (years), mean (SD) | 31.19 (4.72) | 31.15 (4.04) | Ns |
| Gestational age (weeks), mean (SD) | 30.25 (2.72) | 38.52 (1.44) | <0.05 |
| Birth weight (grams), mean (SD) | 1131.91 (118.15) | 3120.43 (261.02) | <0.05 |
| Male gender, n (%) | 31 (63.26) | 12 (66.6) | Ns |
| Apgar score at 1 min, median (IR) | 5 (1–10) | 9 (8–10) | <0.05 |
| Apgar score at 5 min, median (IR) | 8 (1–10) | 10 (10–10) | <0.05 |
| Neonatal resuscitation, n (%) | 43 (87.7) | - | - |
| Intraventricular hemorrhage, n (%) | 16 (32.6) | - | - |
| Hospital stay (months), mean (SD) | 2.15 (1.11) | - | - |
| Age at assessment (years), mean (SD) | 21.68 (2.42) | 20.95 (2.55) | Ns |
| Caucasian population, n (%) | 47 (95.9) | 18 (100) | Ns |
| Same region of residency, n (%) | 48 (97.9) | 16 (88.8) | Ns |
| Actual mean systolic/diastolic blood pressure values (mmHg) | 105/73 | 108/75 | Ns |
| Actual body mass index < 18.5, n (%) | 11 (22.4) | 4 (22.2) | Ns |
| Actual body mass index 18.5–25, n (%) | 34 (69.4) | 13 (72) | Ns |
| Actual body mass index > 25, n (%) | 4 (8.1) | 1 (5.5) | Ns |
| Sport, n (%) | 16 (32.6) | 7 (38.9) | Ns |
| Accuracy | F1 Measure | False Positive Rate | False Negative Rate | True Positive Rate | True Negative Rate | |
|---|---|---|---|---|---|---|
| RF | 0.7 | 0.82 | 0.94 | 0.06 | 0.94 | 0.06 |
| GBM | 0.72 | 0.82 | 0.72 | 0.12 | 0.88 | 0.28 |
| SVM | 0.73 | 0.84 | 1 | 0 | 1 | 0 |
Publisher’s Note: MDPI stays neutral with regard to jurisdictional claims in published maps and institutional affiliations. |
© 2021 by the authors. Licensee MDPI, Basel, Switzerland. This article is an open access article distributed under the terms and conditions of the Creative Commons Attribution (CC BY) license (https://creativecommons.org/licenses/by/4.0/).
Share and Cite
Perrone, S.; Negro, S.; Laschi, E.; Calderisi, M.; Giordano, M.; De Bernardo, G.; Parigi, G.; Toni, A.L.; Esposito, S.; Buonocore, G. Metabolomic Profile of Young Adults Born Preterm. Metabolites 2021, 11, 697. https://0-doi-org.brum.beds.ac.uk/10.3390/metabo11100697
Perrone S, Negro S, Laschi E, Calderisi M, Giordano M, De Bernardo G, Parigi G, Toni AL, Esposito S, Buonocore G. Metabolomic Profile of Young Adults Born Preterm. Metabolites. 2021; 11(10):697. https://0-doi-org.brum.beds.ac.uk/10.3390/metabo11100697
Chicago/Turabian StylePerrone, Serafina, Simona Negro, Elisa Laschi, Marco Calderisi, Maurizio Giordano, Giuseppe De Bernardo, Gianni Parigi, Anna Laura Toni, Susanna Esposito, and Giuseppe Buonocore. 2021. "Metabolomic Profile of Young Adults Born Preterm" Metabolites 11, no. 10: 697. https://0-doi-org.brum.beds.ac.uk/10.3390/metabo11100697