
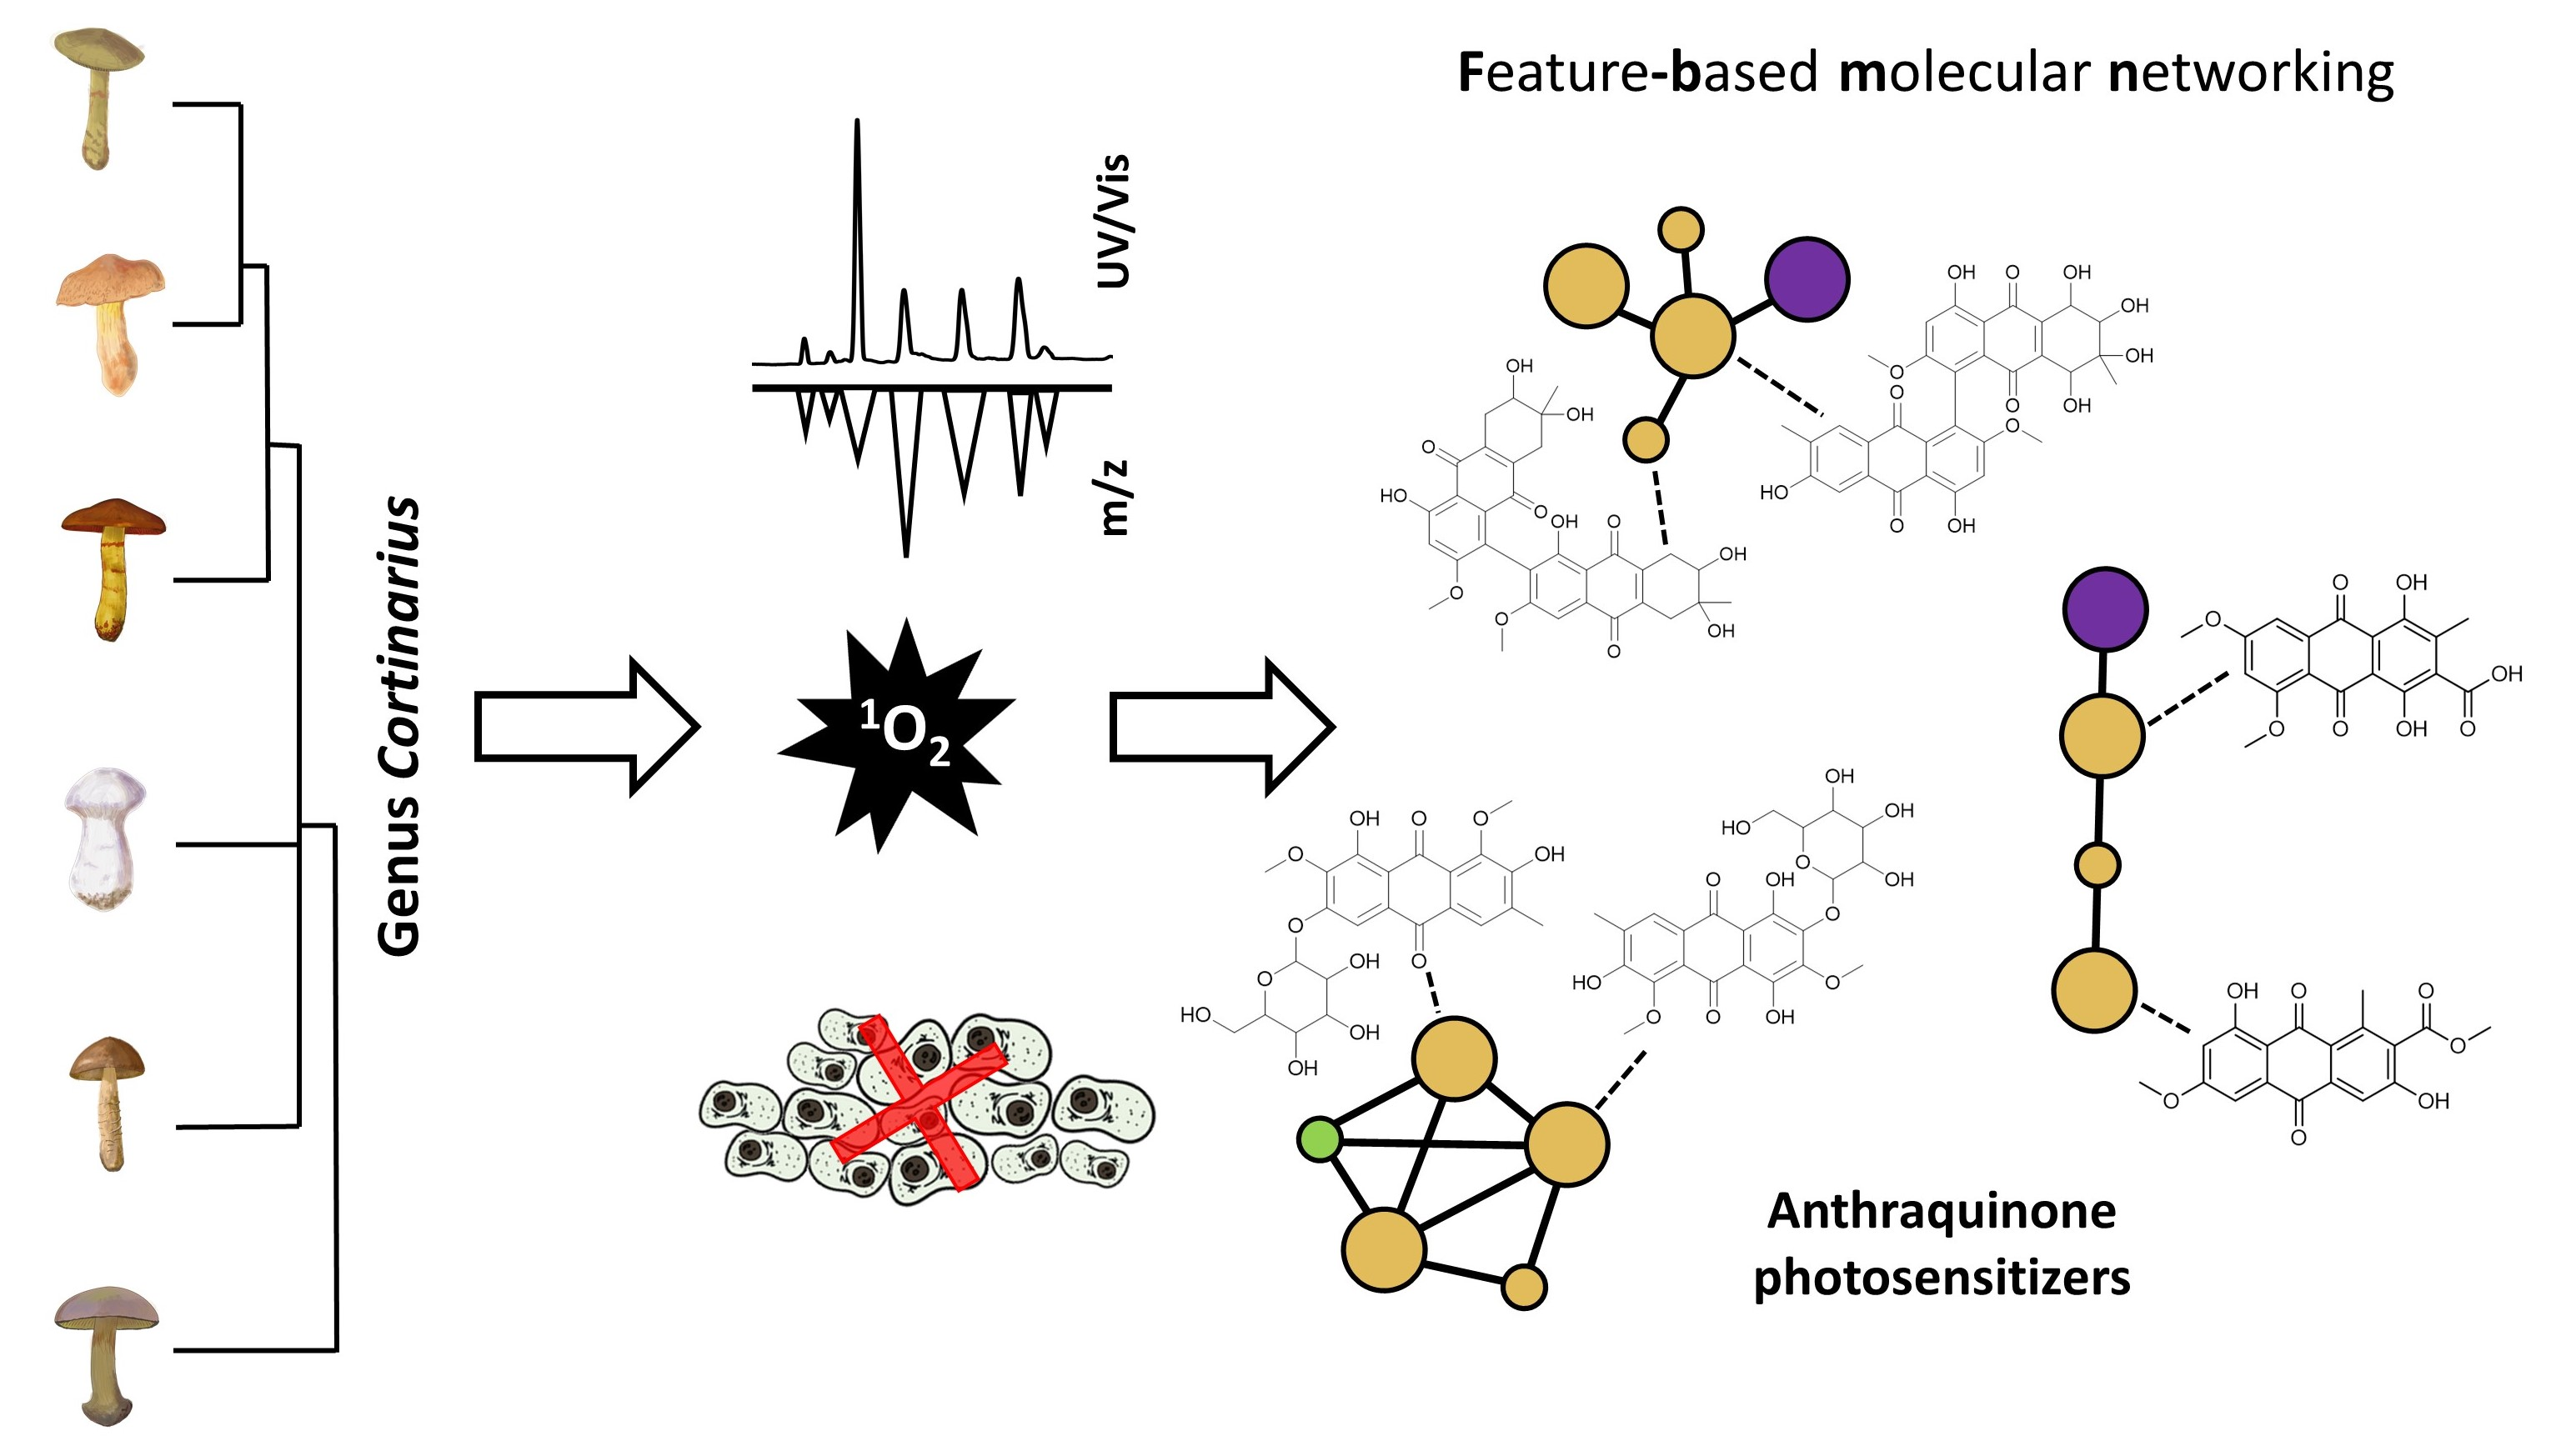
Feature-Based Molecular Networking—An Exciting Tool to Spot Species of the Genus Cortinarius with Hidden Photosensitizers

 , ,
, ,  , , , and
Abstract
:
1. Introduction
2. Results and Discussion
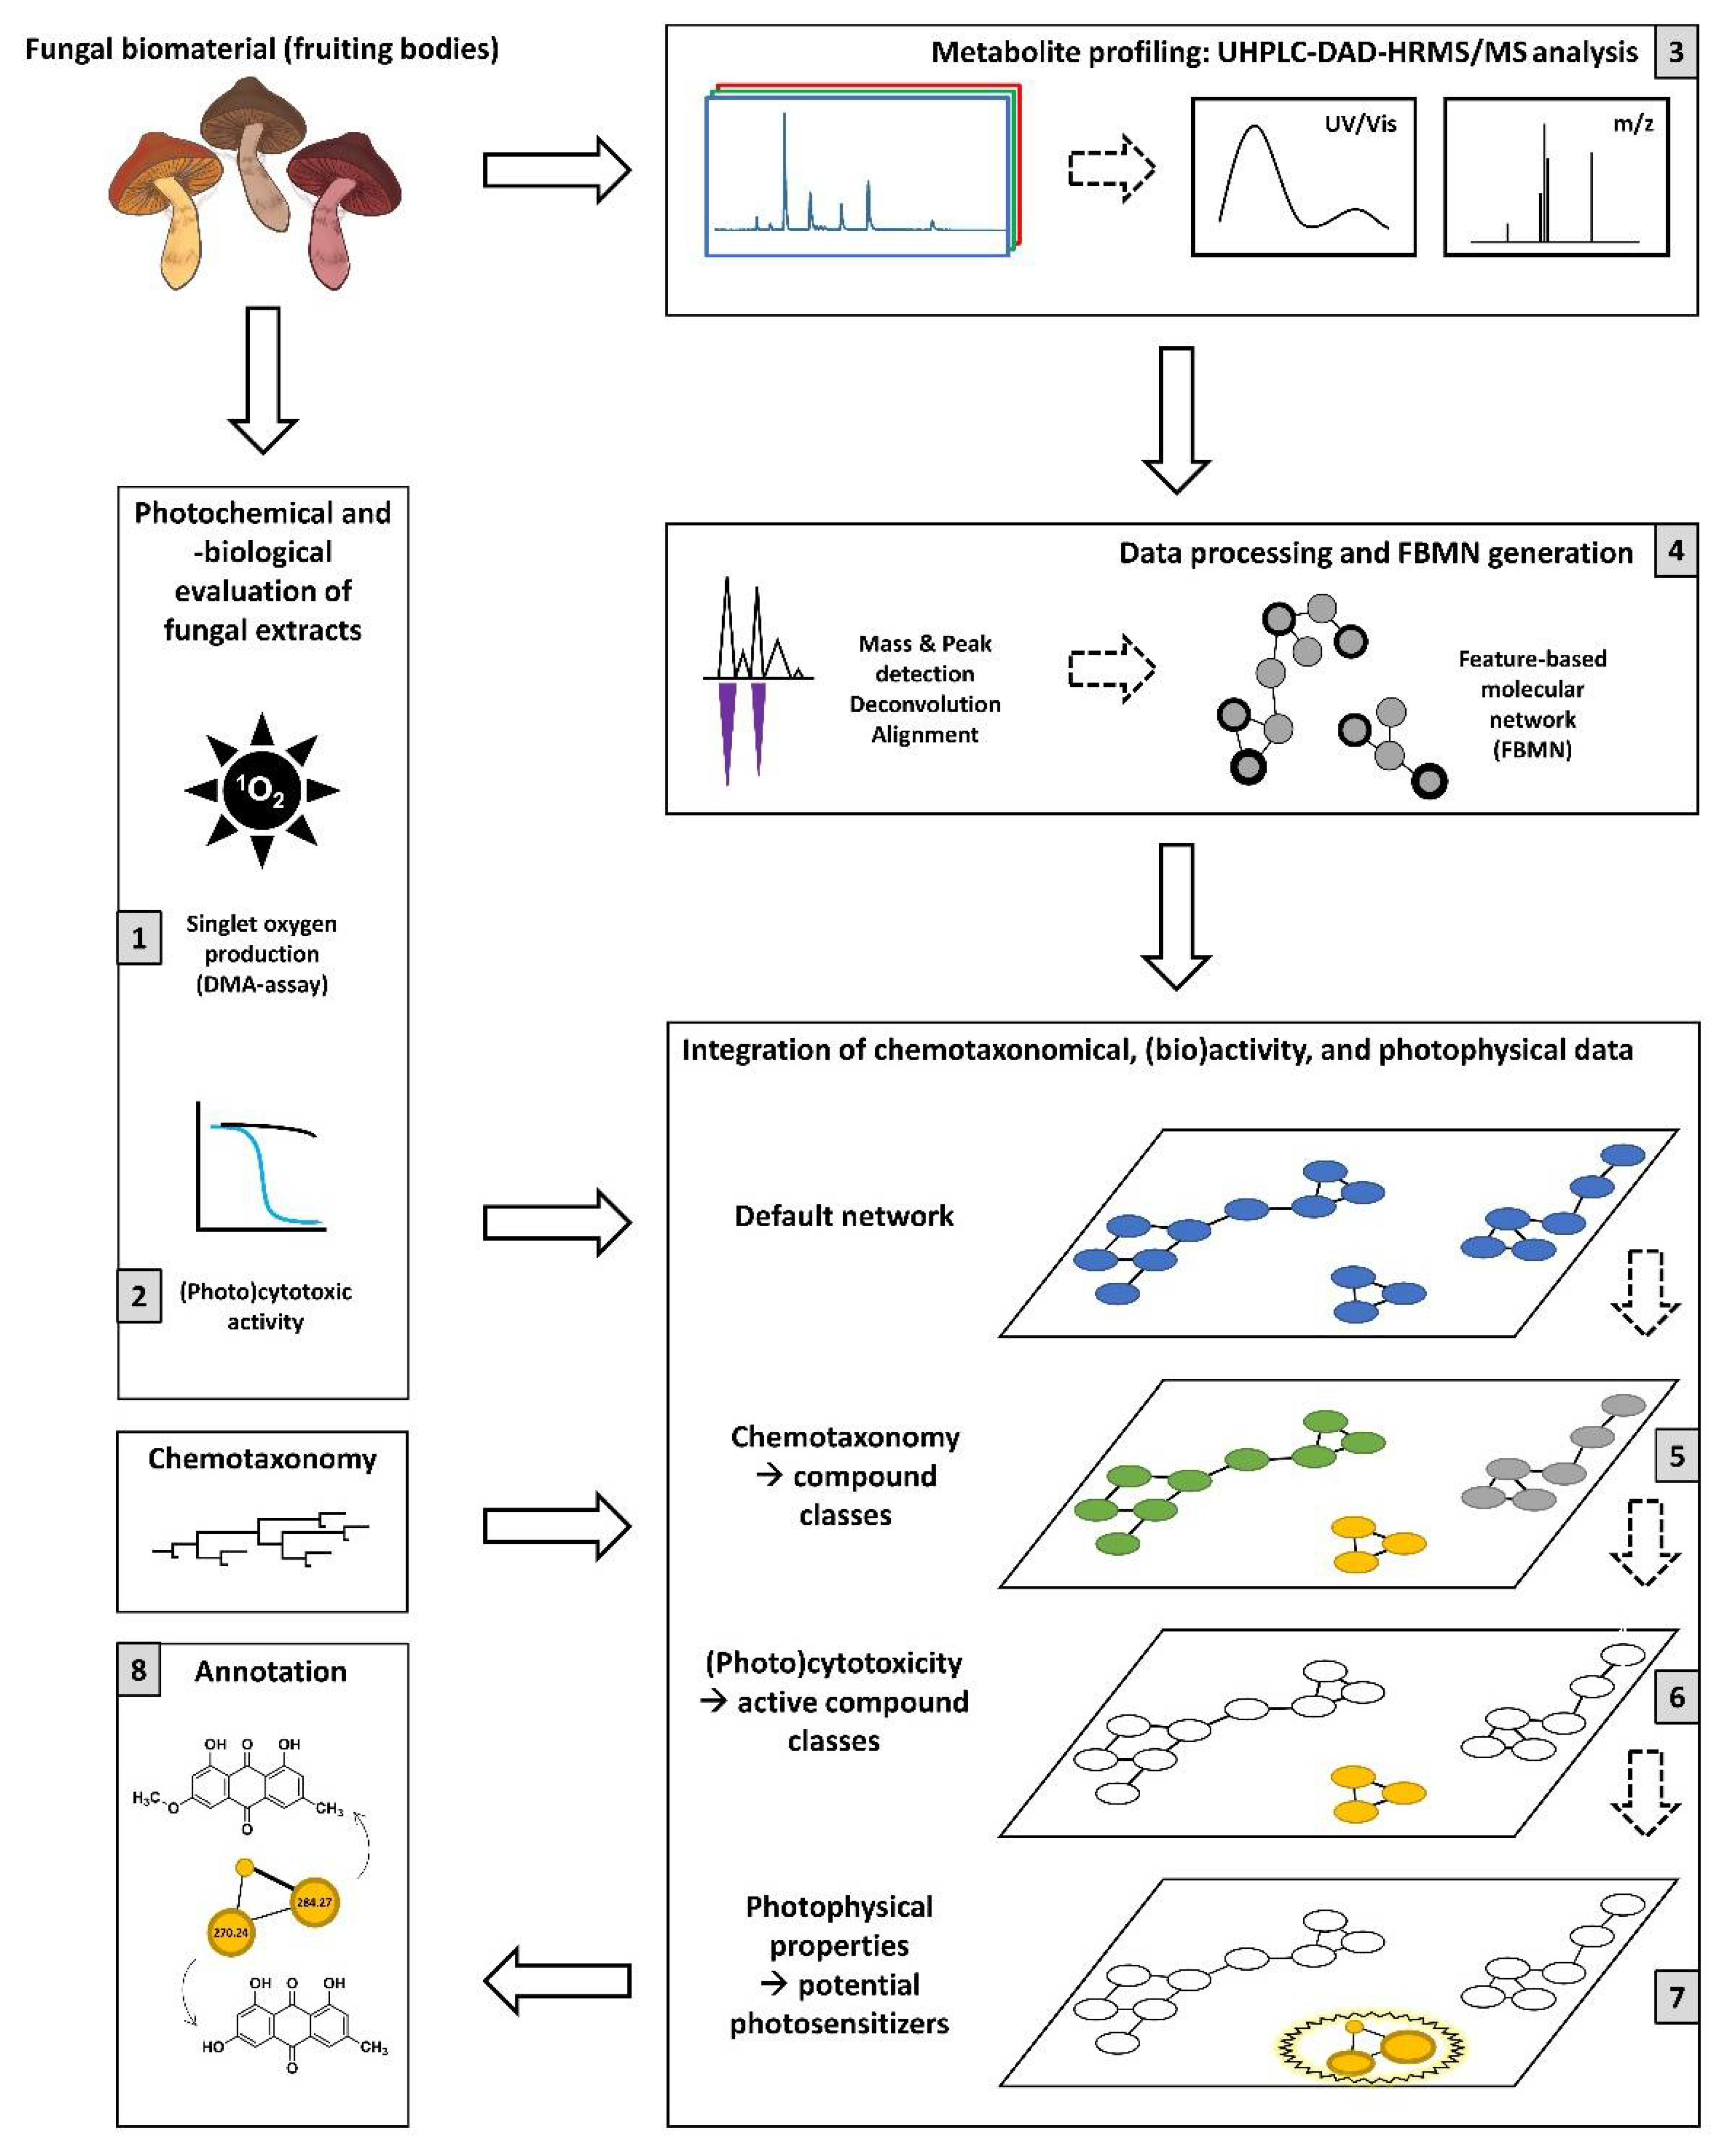
2.1. Study Overview
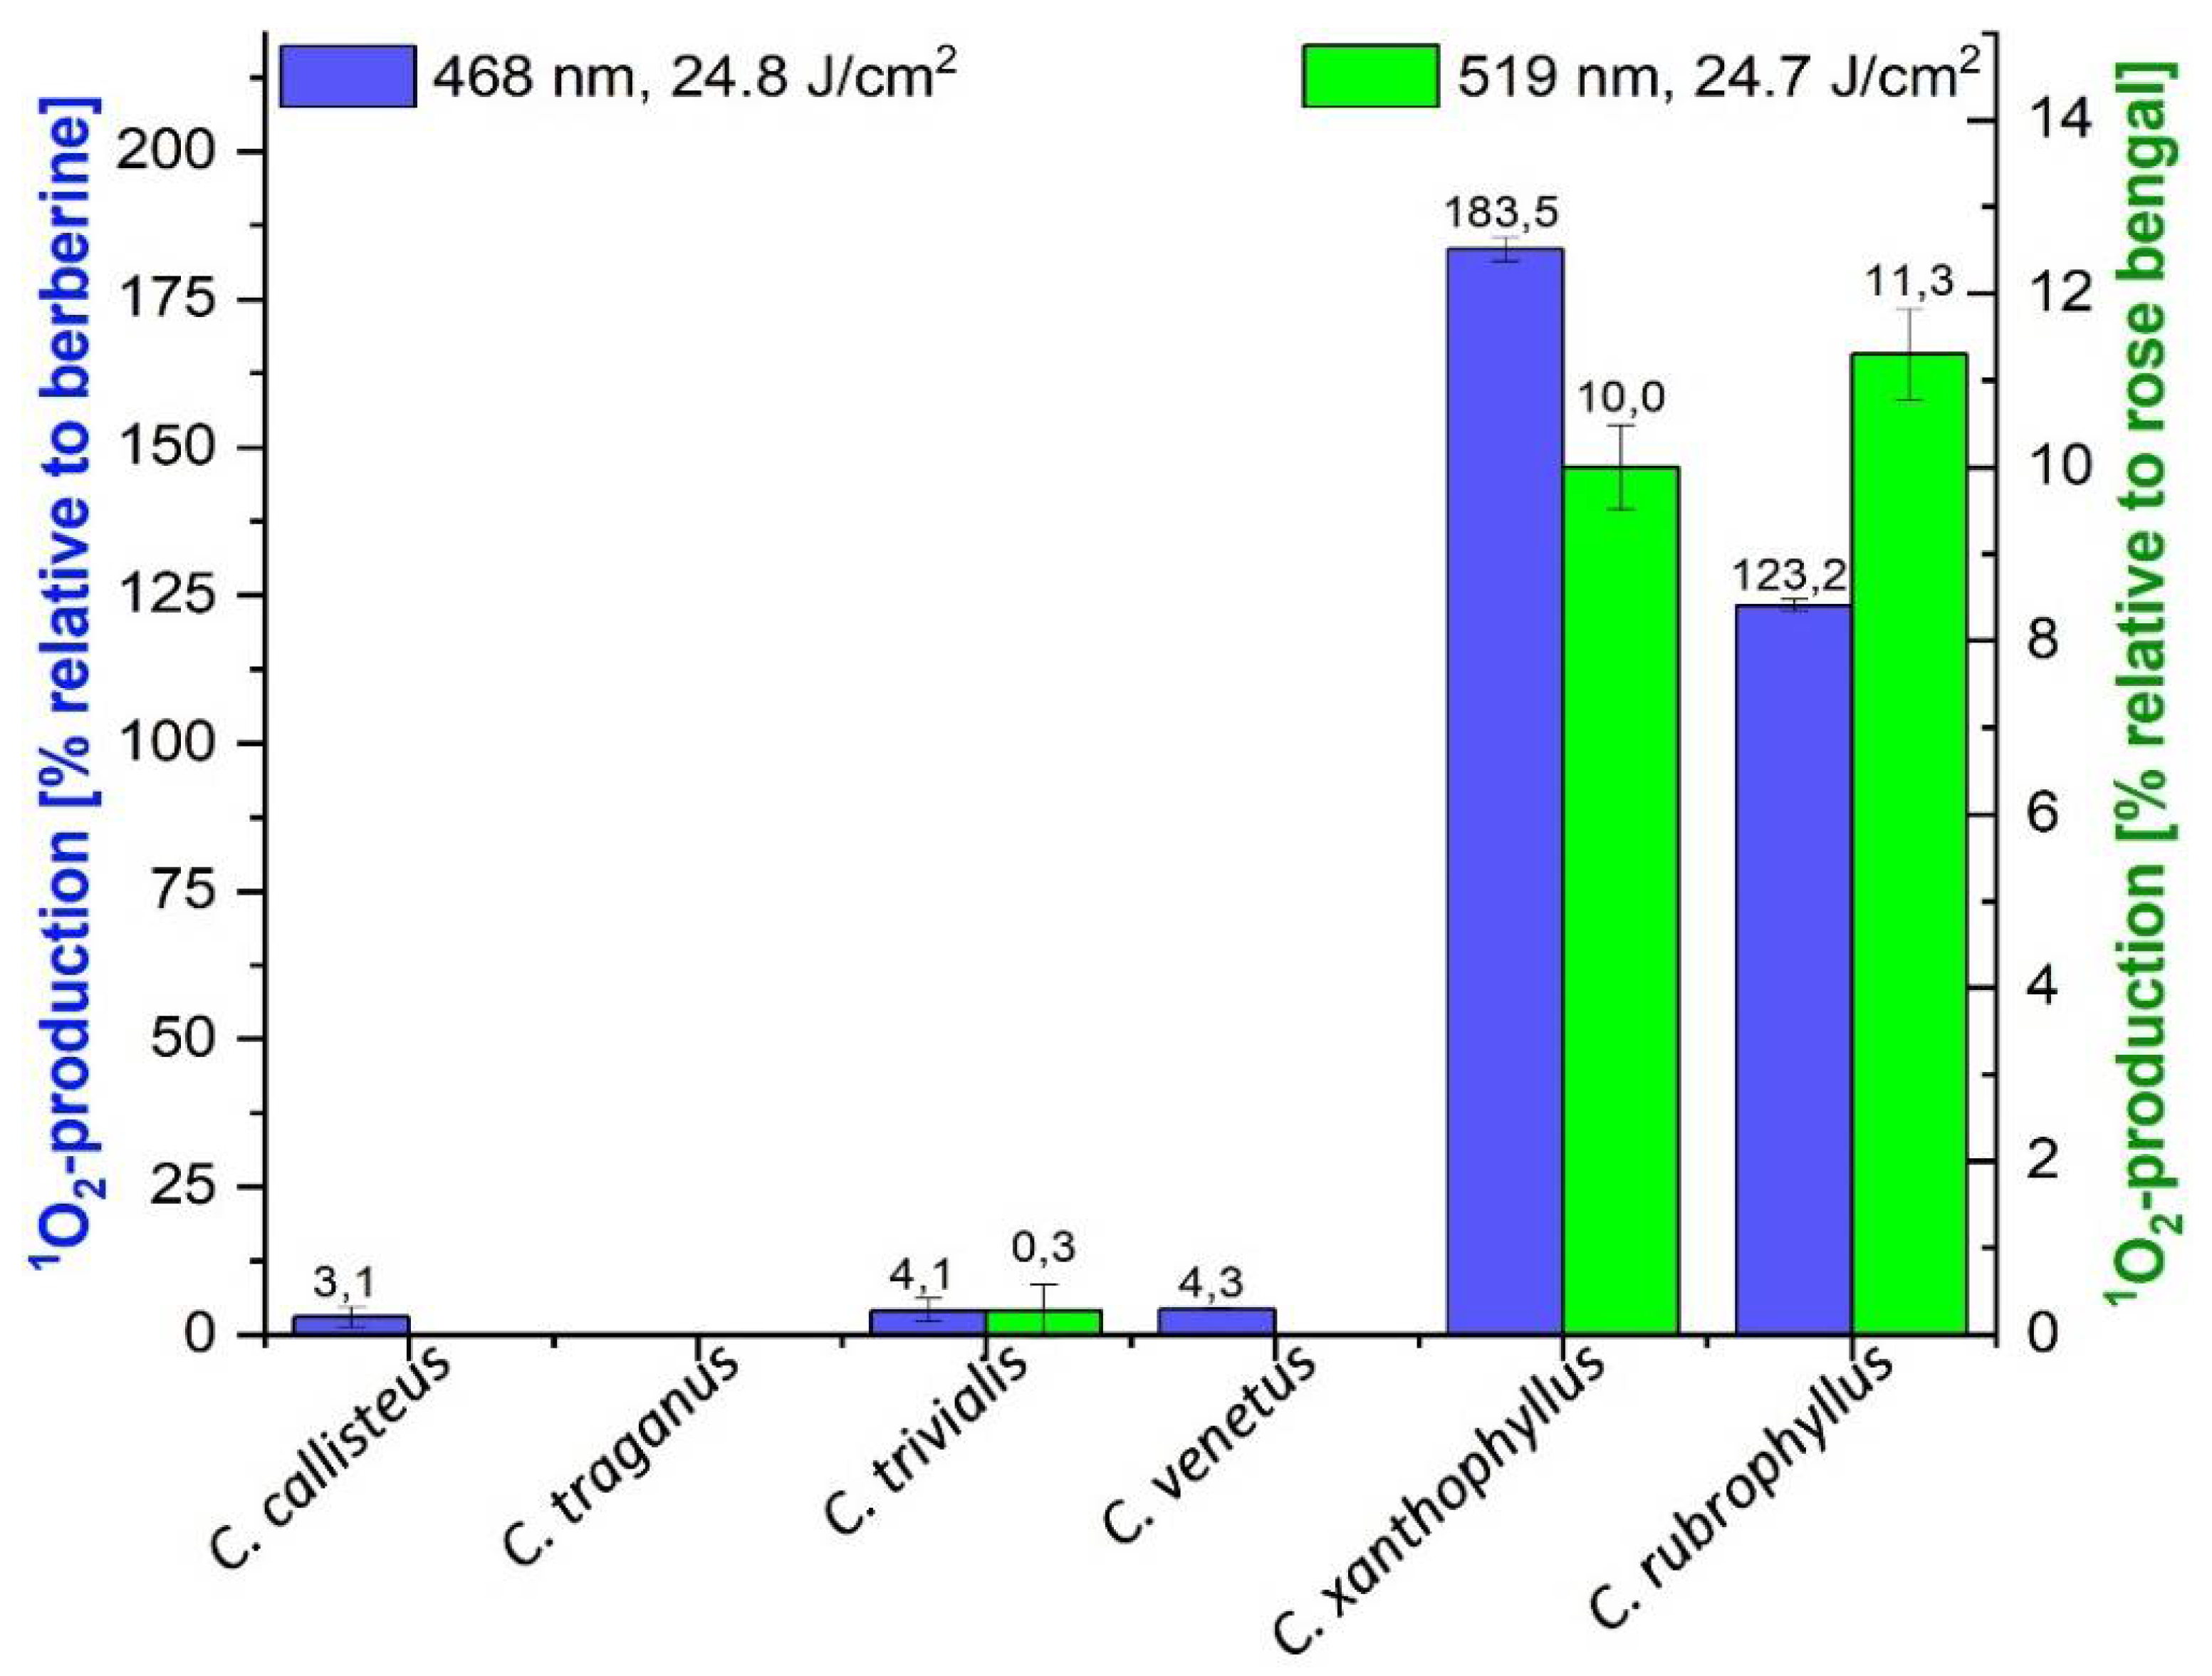
2.2. DMA Assay
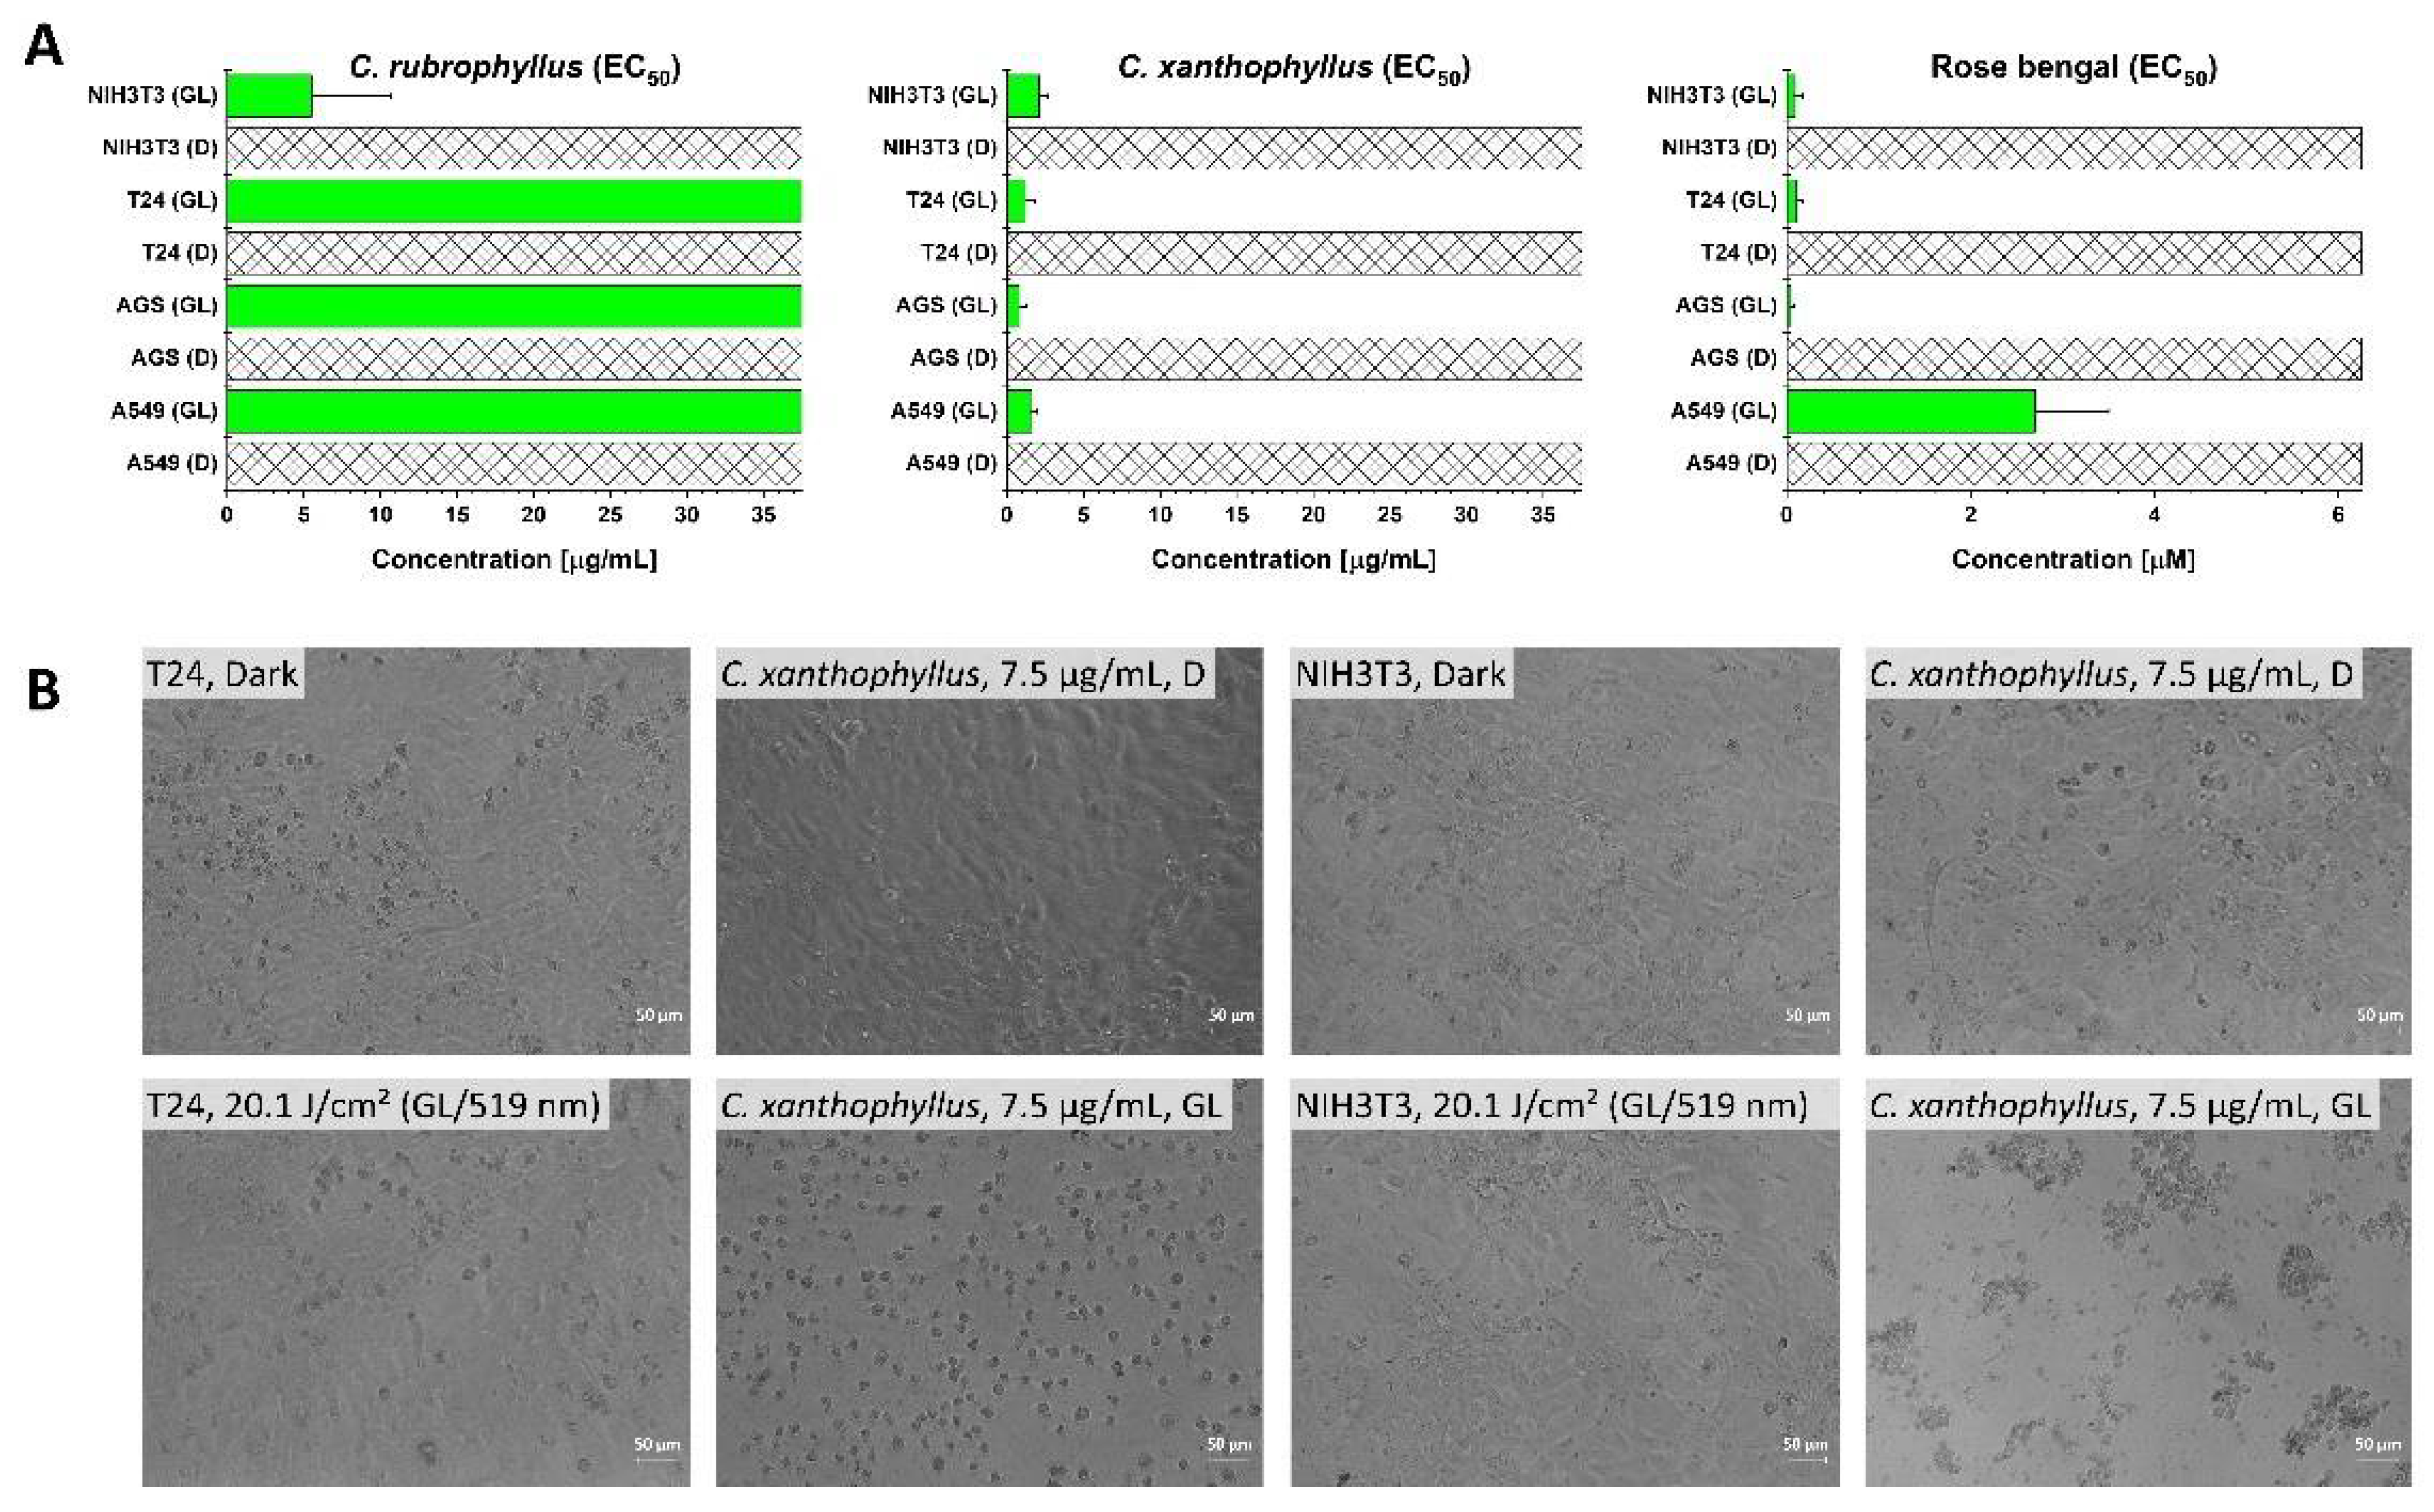
2.3. (Photo)Cytotoxicity Assay
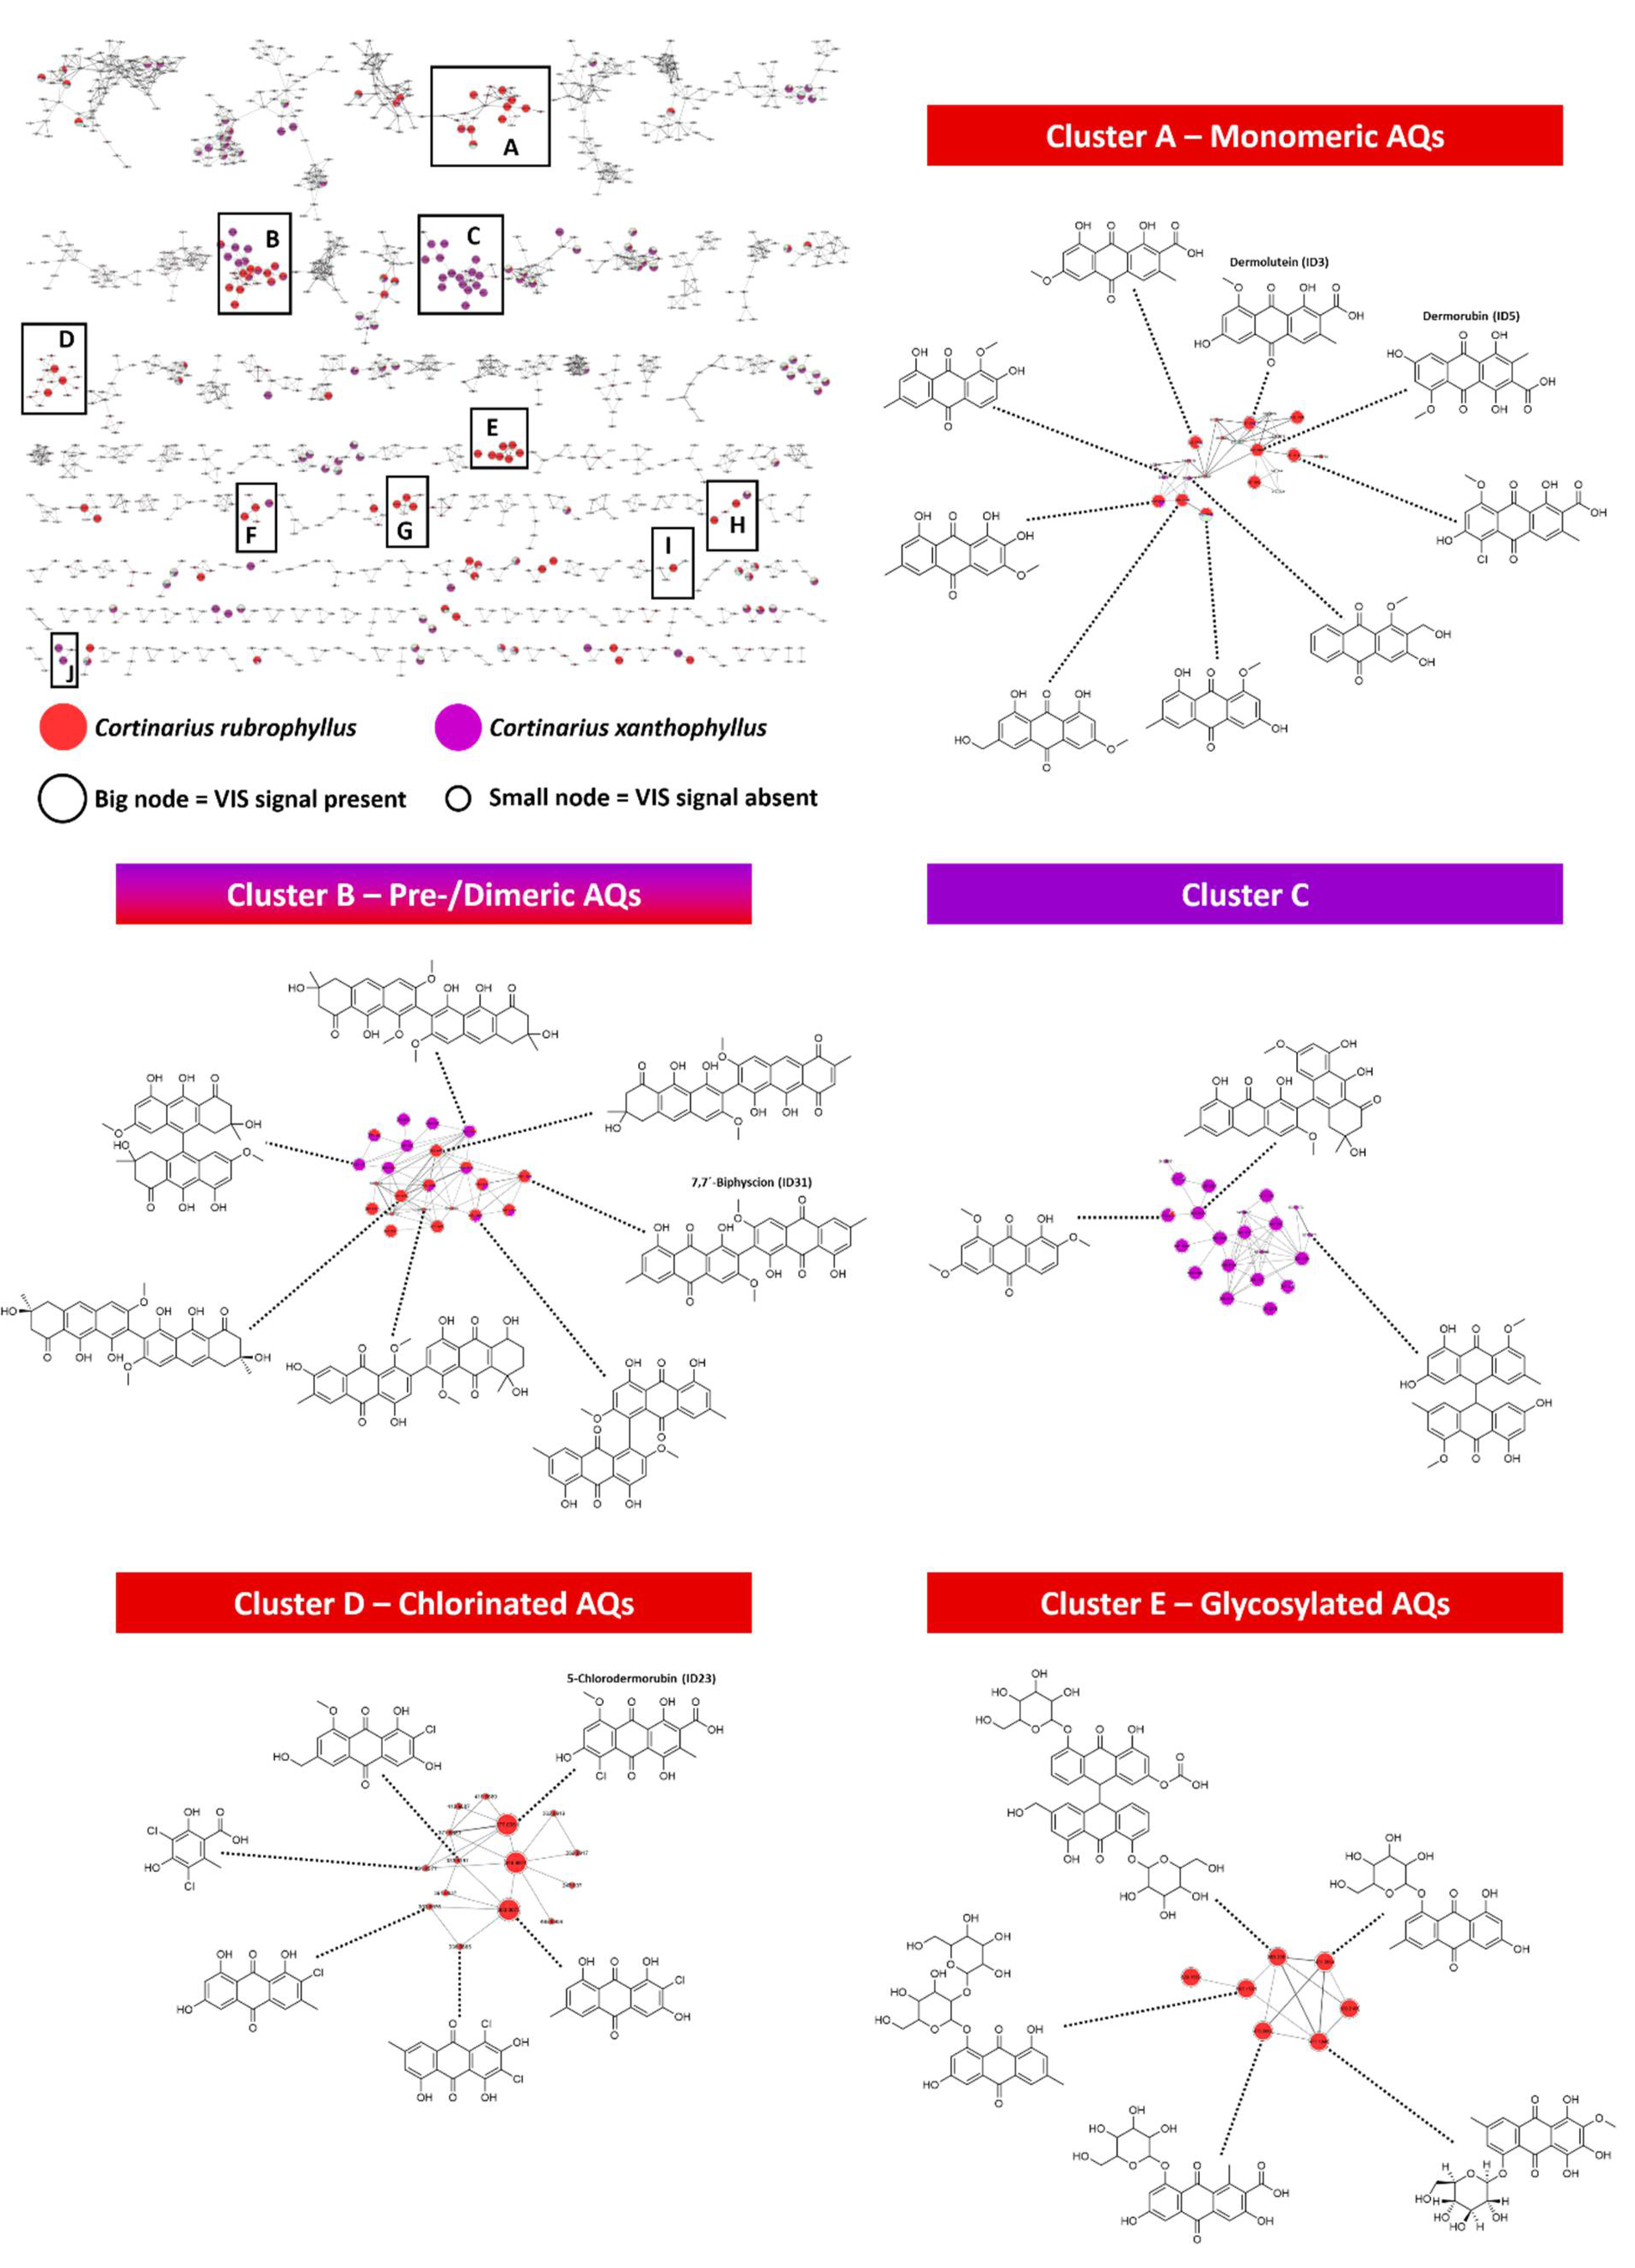
2.4. Feature-Based Molecular Network
2.4.1. Generation and General Investigation
2.4.2. Photoactive-Feature Annotation Overview
2.4.3. Specificity of Features and Phylogenetic Relevance
2.4.4. Cluster Annotation and Bioactivity Prioritization
2.4.5. FBMN—Final Specific Remarks
2.5. Outlook
3. Materials and Methods
3.1. General Instrumentation
3.2. Chemicals
3.3. Phylogenetic Analysis
3.4. Fungal Material
3.5. Sample Preparation and Extraction Procedures
3.6. Feature-Based Molecular Networking (FBMN)
3.7. DMA Assay
3.8. Cell Culture Maintenance and (Photo)Cytotoxicity Assay
4. Conclusions
Supplementary Materials
Author Contributions
Funding
Institutional Review Board Statement
Informed Consent Statement
Data Availability Statement
Acknowledgments
Conflicts of Interest
References
- Cannon, W.B. The Wisdom of the Body; W. W. Norton and Company, Inc.: New York, NY, USA, 1932; pp. 202–216. [Google Scholar]
- Cannon, W.B. Bodily Changes in Pain, Hunger, and Rage; D. Appleton and Company: New York, NY, USA; London, UK, 1915. [Google Scholar]
- Spiteller, P. Chemical Defence Strategies of Higher Fungi. Chem. Eur. J. 2008, 14, 9100–9110. [Google Scholar] [CrossRef]
- Spiteller, P. Chemical ecology of fungi. Nat. Prod. Rep. 2015, 32, 971–993. [Google Scholar] [CrossRef] [PubMed]
- Wieland, T. The toxic peptides from Amanita mushrooms. Int. J. Pept. Protein Res. 1983, 22, 257–276. [Google Scholar] [CrossRef]
- Wurzenberger, M.; Grosch, W. The formation of 1-octen-3-ol from the 10-hydroperoxide isomer of linoleic acid by a hydroperoxide lyase in mushrooms (Psalliota bispora). Biochim. Biophys. Acta (BBA) Lipids Lipid Metab. 1984, 794, 25–30. [Google Scholar] [CrossRef]
- Siewert, B.; Vrabl, P.; Hammerle, F.; Bingger, I.; Stuppner, H. A convenient workflow to spot photosensitizers revealed photo-activity in basidiomycetes. RSC Adv. 2019, 9, 4545–4552. [Google Scholar] [CrossRef] [Green Version]
- Hammerle, F.; Bingger, I.; Pannwitz, A.; Magnutzki, A.; Gstir, R.; Rutz, A.; Wolfender, J.-L.; Peintner, U.; Siewert, B. Targeted Isolation of Photoactive Pigments from Mushrooms Yielded a Highly Potent New Photosensitizer: 7,7′-Biphyscion. ChemRXiv 2021. preprint. [Google Scholar] [CrossRef]
- Keller, G. Pigmentationsuntersuchungen bei europäischen Arten aus der Gattung Dermocybe (FR.) WÜNSCHE. Sydowia 1982, 35, 110–126. [Google Scholar]
- Abrahamse, H.; Hamblin, M.R. New photosensitizers for photodynamic therapy. Biochem. J. 2016, 473, 347–364. [Google Scholar] [CrossRef] [Green Version]
- Dichiara, M.; Prezzavento, O.; Marrazzo, A.; Pittalà, V.; Salerno, L.; Rescifina, A.; Amata, E. Recent advances in drug discovery of phototherapeutic non-porphyrinic anticancer agents. Eur. J. Med. Chem. 2017, 142, 459–485. [Google Scholar] [CrossRef]
- Zhao, X.; Liu, J.; Fan, J.; Chao, H.; Peng, X. Recent progress in photosensitizers for overcoming the challenges of photodynamic therapy: From molecular design to application. Chem. Soc. Rev. 2021, 50, 4185–4219. [Google Scholar] [CrossRef]
- Pham, T.C.; Nguyen, V.-N.; Choi, Y.; Lee, S.; Yoon, J. Recent Strategies to Develop Innovative Photosensitizers for Enhanced Photodynamic Therapy. Chem. Rev. 2021, 121, 13454–13619. [Google Scholar] [CrossRef]
- Siewert, B.; Stuppner, H. The photoactivity of natural products—An overlooked potential of phytomedicines? Phytomedicine 2019, 60, 152985. [Google Scholar] [CrossRef]
- Kögl, F.; Postowsky, J.J. Untersuchungen über Pilzfarbstoffe. II. Über die Farbstoffe des blutroten Hautkopfes (Dermocybe sanguinea Wulf.). Justus Liebigs Ann. Chem. 1925, 444, 1–7. [Google Scholar] [CrossRef]
- Gill, M.; Steglich, W. Pigments of fungi (Macromycetes). Prog. Chem. Org. Nat. Prod. 1987, 51, 1–317. [Google Scholar]
- Gill, M. Pigments of fungi (Macromycetes). Nat. Prod. Rep. 1994, 11, 67–90. [Google Scholar] [CrossRef]
- Tingstad, L.; Gjerde, I.; Dahlberg, A.; Grytnes, J.A. The influence of spatial scales on Red List composition: Forest species in Fennoscandia. Glob. Ecol. Conserv. 2017, 11, 247–297. [Google Scholar]
- Allard, P.-M.; Bisson, J.; Azzollini, A.; Pauli, G.F.; Cordell, G.A.; Wolfender, J.-L. Pharmacognosy in the digital era: Shifting to contextualized metabolomics. Curr. Opin. Biotechnol. 2018, 54, 57–64. [Google Scholar] [CrossRef] [PubMed]
- Nothias, L.-F.; Petras, D.; Schmid, R.; Duhrkop, K.; Rainer, J.; Sarvepalli, A.; Protsyuk, I.; Ernst, M.; Tsugawa, H.; Fleischauer, M.; et al. Feature-based molecular networking in the GNPS analysis environment. Nat. Methods 2020, 17, 905–908. [Google Scholar] [CrossRef]
- Olivon, F.; Allard, P.-M.; Koval, A.; Righi, D.; Genta-Jouve, G.; Neyts, J.; Apel, C.; Pannecouque, C.; Nothias, L.-F.; Cachet, X.; et al. Bioactive Natural Products Prioritization Using Massive Multi-informational Molecular Networks. ACS Chem. Biol. 2017, 12, 2644–2651. [Google Scholar] [CrossRef]
- Pluskal, T.; Castillo, S.; Villar-Briones, A.; Oresic, M. MZmine 2: Modular framework for processing, visualizing, and analyzing mass spectrometry-based molecular profile data. BMC Bioinf. 2010, 11. [Google Scholar] [CrossRef] [PubMed] [Green Version]
- Wang, M.; Carver, J.J.; Phelan, V.V.; Sanchez, L.M.; Garg, N.; Peng, Y.; Nguyen, D.D.; Watrous, J.; Kapono, C.A.; Luzzatto-Knaan, T.; et al. Sharing and community curation of mass spectrometry data with Global Natural Products Social Molecular Networking. Nat. Biotechnol. 2016, 34, 828–837. [Google Scholar] [CrossRef] [PubMed] [Green Version]
- Dührkop, K.; Fleischauer, M.; Ludwig, M.; Aksenov, A.A.; Melnik, A.V.; Meusel, M.; Dorrestein, P.C.; Rousu, J.; Böcker, S. SIRIUS 4: A rapid tool for turning tandem mass spectra into metabolite structure information. Nat. Methods 2019, 16, 299–302. [Google Scholar] [CrossRef] [PubMed] [Green Version]
- Allard, P.-M.; Peresse, T.; Bisson, J.; Gindro, K.; Marcourt, L.; Pham, V.C.; Roussi, F.; Litaudon, M.; Wolfender, J.-L. Integration of Molecular Networking and In-Silico MS/MS Fragmentation for Natural Products Dereplication. Anal. Chem. 2016, 88, 3317–3323. [Google Scholar] [CrossRef] [PubMed]
- Rutz, A.; Dounoue-Kubo, M.; Ollivier, S.; Bisson, J.; Bagheri, M.; Saesong, T.; Ebrahimi, S.N.; Ingkaninan, K.; Wolfender, J.-L.; Allard, P.-M. Taxonomically Informed Scoring Enhances Confidence in Natural Products Annotation. Front. Plant Sci. 2019, 10. [Google Scholar] [CrossRef] [PubMed] [Green Version]
- Djoumbou Feunang, Y.; Eisner, R.; Knox, C.; Chepelev, L.; Hastings, J.; Owen, G.; Fahy, E.; Steinbeck, C.; Subramanian, S.; Bolton, E.; et al. ClassyFire: Automated chemical classification with a comprehensive, computable taxonomy. J. Cheminform. 2016, 8, 61. [Google Scholar] [CrossRef] [Green Version]
- Redmond, R.W.; Gamlin, J.N. A compilation of singlet oxygen yields from biologically relevant molecules. Photochem. Photobiol. 1999, 70, 391–475. [Google Scholar] [CrossRef]
- Görner, H.; Miskolczy, Z.; Megyesi, M.; Biczók, L. Photoreduction and Ketone-sensitized Reduction of Alkaloids. Photochem. Photobiol. 2011, 87, 284–291. [Google Scholar] [CrossRef]
- Comini, L.R.; Fernandez, I.M.; Vittar, N.B.R.; Nunez Montoya, S.C.; Cabrera, J.L.; Rivarola, V.A. Photodynamic activity of anthraquinones isolated from Heterophyllaea pustulata Hook f. (Rubiaceae) on MCF-7c3 breast cancer cells. Phytomedicine 2011, 18, 1093–1095. [Google Scholar] [CrossRef]
- Comini, L.R.; Moran Vieyra, F.E.; Mignone, R.A.; Paez, P.L.; Laura Mugas, M.; Konigheim, B.S.; Cabrera, J.L.; Nunez Montoya, S.C.; Borsarelli, C.D. Parietin: An efficient photo-screening pigment in vivo with good photosensitizing and photodynamic antibacterial effects in vitro. Photochem. Photobiol. Sci. 2017, 16, 201–210. [Google Scholar] [CrossRef]
- Rumie Vittar, N.B.; Comini, L.; Fernadez, I.M.; Agostini, E.; Nunez-Montoya, S.; Cabrera, J.L.; Rivarola, V.A. Photochemotherapy using natural anthraquinones: Rubiadin and Soranjidiol sensitize human cancer cell to die by apoptosis. Photodiagn. Photodyn. Ther. 2014, 11, 182–192. [Google Scholar] [CrossRef] [Green Version]
- Kim, M.M.; Darafsheh, A. Light Sources and Dosimetry Techniques for Photodynamic Therapy. Photochem. Photobiol. 2020, 96, 280–294. [Google Scholar] [CrossRef] [PubMed] [Green Version]
- Saraste, A.; Pulkki, K. Morphologic and biochemical hallmarks of apoptosis. Cardiovasc. Res. 2000, 45, 528–537. [Google Scholar] [CrossRef]
- Cardoso, D.R.; Libardi, S.H.; Skibsted, L.H. Riboflavin as a photosensitizer. Effects on human health and food quality. Food Funct. 2012, 3, 487–502. [Google Scholar] [CrossRef] [PubMed]
- Thomas, C.; Pardini, R.S. Oxygen dependence of hypericin-induced phototoxicity to EMT6 mouse mammary carcinoma cells. Photochem. Photobiol. 1992, 55, 831–837. [Google Scholar] [CrossRef]
- Lavie, G.; Valentine, F.; Levin, B.; Mazur, Y.; Gallo, G.; Lavie, D.; Weiner, D.; Meruelo, D. Studies of the mechanisms of action of the antiretroviral agents hypericin and pseudohypericin. Proc. Natl. Acad. Sci. USA 1989, 86, 5963–5967. [Google Scholar] [CrossRef] [Green Version]
- Kakrani, P.H.; Kakrani, H.; Raval, M. Isolation of cytotoxic constituent from bioactivity guided fraction of Alysicarpus monilifer L. (DC.). Int. J. Pharm. Pharm. Sci. 2019, 11, 69–77. [Google Scholar] [CrossRef] [Green Version]
- Li, T.; Pan, H.; Feng, Y.; Li, H.; Zhao, Y. Bioactivity-guided isolation of anticancer constituents from Hedera nepalensis K. Koch. S. Afr. J. Bot. 2015, 100, 87–93. [Google Scholar] [CrossRef]
- Liu, L.; Yin, Q.-M.; Zhang, X.-W.; Wang, W.; Dong, X.-Y.; Yan, X.; Hu, R. Bioactivity-guided isolation of biphenanthrenes from Liparis nervosa. Fitoterapia 2016, 115, 15–18. [Google Scholar] [CrossRef]
- Ludwiczuk, A.; Saha, A.; Kuzuhara, T.; Asakawa, Y. Bioactivity guided isolation of anticancer constituents from leaves of Alnus sieboldiana (Betulaceae). Phytomedicine 2011, 18, 491–498. [Google Scholar] [CrossRef]
- Rafieian-kopaei, M.; Suleimani dehkordi, I.; Ghanadian, M.; Shokrollahi, A.; Aghaei, M.; Syed Majid, A.; Choudhary, M.I. Bioactivity-guided isolation of new antiproliferative compounds from Juniperus foetidissima Willd. Nat. Prod. Res. 2016, 30, 1927–1933. [Google Scholar] [CrossRef]
- Aron, A.T.; Gentry, E.C.; McPhail, K.L.; Nothias, L.-F.; Nothias-Esposito, M.; Bouslimani, A.; Petras, D.; Gauglitz, J.M.; Sikora, N.; Vargas, F.; et al. Reproducible molecular networking of untargeted mass spectrometry data using GNPS. Nat. Protoc. 2020, 15, 1954–1991. [Google Scholar] [CrossRef]
- Chambers, M.C.; Maclean, B.; Burke, R.; Amodei, D.; Ruderman, D.L.; Neumann, S.; Gatto, L.; Fischer, B.; Pratt, B.; Egertson, J.; et al. A cross-platform toolkit for mass spectrometry and proteomics. Nat. Biotechnol. 2012, 30, 918–920. [Google Scholar] [CrossRef] [PubMed]
- Shannon, P.; Markiel, A.; Ozier, O.; Baliga, N.S.; Wang, J.T.; Ramage, D.; Amin, N.; Schwikowski, B.; Ideker, T. Cytoscape: A software environment for integrated models of biomolecular interaction networks. Genome Res. 2003, 13, 2498–2504. [Google Scholar] [CrossRef]
- Soop, K.; Dima, B.; Dima, B.; Cooper, J.A.; Park, D.; Oertel, B. A phylogenetic approach to a global supraspecific taxonomy of Cortinarius (Agaricales) with an emphasis on the southern mycota. Persoonia 2019, 42, 261–290. [Google Scholar] [CrossRef] [PubMed] [Green Version]
- Chen, Q.; Li, K.-T.; Tian, S.; Yu, T.-H.; Yu, L.-H.; Lin, H.-D.; Bai, D.-Q. Photodynamic Therapy Mediated by Aloe-Emodin Inhibited Angiogenesis and Cell Metastasis Through Activating MAPK Signaling Pathway on HUVECs. Technol. Cancer Res. Treat. 2018, 17, 1533033818785512. [Google Scholar] [CrossRef] [PubMed] [Green Version]
- Liu, Y.-Q.; Meng, P.-S.; Zhang, H.-C.; Liu, X.; Wang, M.-X.; Cao, W.-W.; Hu, Z.; Zhang, Z.-G. Inhibitory effect of aloe emodin mediated photodynamic therapy on human oral mucosa carcinoma in vitro and in vivo. Biomed. Pharmacother. 2018, 97, 697–707. [Google Scholar] [CrossRef] [PubMed]
- Kessel, D. Exploring Modes of Photokilling by Hypericin. Photochem. Photobiol. 2020, 96, 1101–1104. [Google Scholar] [CrossRef]
- Kleemann, B.; Loos, B.; Scriba, T.J.; Lang, D.; Davids, L.M. St. John’s Wort (Hypericum perforatum L.) photomedicine: Hypericin-photodynamic therapy induces metastatic melanoma cell death. PLoS ONE 2014, 9, e103762. [Google Scholar] [CrossRef]
- Flors, C.; Nonell, S. Light and Singlet Oxygen in Plant Defense Against Pathogens: Phototoxic Phenalenone Phytoalexins. Acc. Chem. Res. 2006, 39, 293–300. [Google Scholar] [CrossRef]
- Dührkop, K.; Shen, H.; Meusel, M.; Rousu, J.; Böcker, S. Searching molecular structure databases with tandem mass spectra using CSI:FingerID. Proc. Natl. Acad. Sci. USA 2015, 112, 12580–12585. [Google Scholar] [CrossRef] [Green Version]
- Sumner, L.W.; Amberg, A.; Barrett, D.; Beale, M.H.; Beger, R.; Daykin, C.A.; Fan, T.W.M.; Fiehn, O.; Goodacre, R.; Griffin, J.L.; et al. Proposed minimum reporting standards for chemical analysis. Metabolomics 2007, 3, 211–221. [Google Scholar] [CrossRef] [Green Version]
- Peintner, U.; Moncalvo, J.-M.; Vilgalys, R. Toward a better understanding of the infrageneric relationships in Cortinarius (Agaricales, Basidiomycota). Mycologia 2004, 96, 1042–1058. [Google Scholar] [CrossRef] [PubMed]
- Garnica, S.; Schoen, M.E.; Abarenkov, K.; Riess, K.; Liimatainen, K.; Niskanen, T.; Dima, B.; Soop, K.; Froeslev, T.G.; Jeppesen, T.S.; et al. Determining threshold values for barcoding fungi: Lessons from Cortinarius (Basidiomycota), a highly diverse and widespread ectomycorrhizal genus. FEMS Microbiol. Ecol. 2016, 92, fiw045. [Google Scholar] [CrossRef] [PubMed] [Green Version]
- Garnica, S.; Weiß, M.; Oertel, B.; Ammirati, J.; Oberwinkler, F. Phylogenetic relationships in Cortinarius, section Calochroi, inferred from nuclear DNA sequences. BMC Evol. Biol. 2009, 9, 1. [Google Scholar] [CrossRef] [Green Version]
- Pachon-Pena, G.; Reyes-Zurita, F.J.; Deffieux, G.; Azqueta, A.; de Cerain, A.L.; Centelles, J.J.; Creppy, E.E.; Cascante, M. Antiproliferative effect of flavomannin-6,6’-dimethylether from Tricholoma equestre on Caco-2 cells. Toxicology 2009, 264, 192–197. [Google Scholar] [CrossRef] [PubMed]
- Steglich, W.; Toepfer-Petersen, E. Phlegmacin and anhydrophlegmacin, novel pigments from Cortinarius odorifer (agaricales). Z. Naturforsch. B 1972, 27, 1286–1287. [Google Scholar] [CrossRef]
- Steglich, W.; Toepfer-Petersen, E.; Pils, I. Pigments of fungi. XVI. Novel phlegmacin derivatives from Cortinarius percomis (Agaricales). Z. Naturforsch. Teil C 1973, 28, 354–355. [Google Scholar]
- Elsworth, C.; Gill, M.; Gimenez, A.; Milanovic, N.M.; Raudies, E. Pigments of fungi. Part 50. Structure, biosynthesis and stereochemistry of new dimeric dihydroanthracenones of the phlegmacin type from Cortinarius sinapicolor Cleland. J. Chem. Soc. Perkin Trans. 1 1999, 119–125. [Google Scholar] [CrossRef]
- Mueller, M.; Lamottke, K.; Steglich, W.; Busemann, S.; Reichert, M.; Bringmann, G.; Spiteller, P. Biosynthesis and stereochemistry of phlegmacin-type fungal pigments. Eur. J. Org. Chem. 2004, 4850–4855. [Google Scholar] [CrossRef]
- Xia, G.; Li, J.; Li, H.; Long, Y.; Lin, S.; Lu, Y.; He, L.; Lin, Y.; Liu, L.; She, Z. Alterporriol-type dimers from the mangrove endophytic fungus, Alternaria sp. (SK11), and their MptpB inhibitions. Mar. Drugs 2014, 12, 2953–2969. [Google Scholar] [CrossRef] [Green Version]
- Debbab, A.; Aly, A.H.; Edrada-Ebel, R.; Wray, V.; Müller, W.E.G.; Totzke, F.; Zirrgiebel, U.; Schächtele, C.; Kubbutat, M.H.G.; Lin, W.H.; et al. Bioactive Metabolites from the Endophytic Fungus Stemphylium globuliferum Isolated from Mentha pulegium. J. Nat. Prod. 2009, 72, 626–631. [Google Scholar] [CrossRef] [PubMed]
- Singer, R. The Agaricales in Modern Taxonomy, 4th ed.; Koeltz Botanical Books: Koenigstein, Germany, 1986; 981p. [Google Scholar]
- Gollnick, K.; Held, S.; Mártire, D.O.; Braslavsky, S.E. Hydroxyanthraquinones as sensitizers of singlet oxygen reactions: Quantum yields of triplet formation and singlet oxygen generation in acetonitrile. J. Photochem. Photobiol. A Chem. 1992, 69, 155–165. [Google Scholar] [CrossRef]
- Vargas, F.; Fraile, G.; Velasquez, M.; Correia, H.; Fonseca, G.; Marin, M.; Marcano, E.; Sanchez, Y. Studies on the photostability and phototoxicity of aloe-emodin, emodin and rhein. Pharmazie 2002, 57, 399–404. [Google Scholar]
- Kersten, B.; Zhang, J.; Brendler-Schwaab, S.Y.; Kasper, P.; Müller, L. The application of the micronucleus test in Chinese hamster V79 cells to detect drug-induced photogenotoxicity. Mutat. Res./Genet. Toxicol. Environ. Mutagenesis 1999, 445, 55–71. [Google Scholar] [CrossRef]
- Wang, W.; Zhang, Y.; Nakashima, S.; Nakamura, S.; Wang, T.; Yoshikawa, M.; Matsuda, H. Inhibition of melanin production by anthracenone dimer glycosides isolated from Cassia auriculata seeds. J. Nat. Med. 2019, 73, 439–449. [Google Scholar] [CrossRef] [PubMed]
- Yang, Q.; Liu, T.; Chen, L.; Duan, Y.; Lu, X. Use of Phlegmacin B1 as Chitinase and Hexosaminidase Inhibitors for Preventing and Treating Agricultural Pests. CN106854144A, 14 July 2017. [Google Scholar]
- Hopkins, S.L.; Siewert, B.; Askes, S.H.C.; Veldhuizen, P.; Zwier, R.; Heger, M.; Bonnet, S. An in vitro cell irradiation protocol for testing photopharmaceuticals and the effect of blue, green, and red light on human cancer cell lines. Photochem. Photobiol. Sci. 2016, 15, 644–653. [Google Scholar] [CrossRef] [PubMed] [Green Version]
- Stecher, G.; Tamura, K.; Kumar, S. Molecular Evolutionary Genetics Analysis (MEGA) for macOS. Mol. Biol. Evol. 2020, 37, 1237–1239. [Google Scholar] [CrossRef]
- Kim, H.W.; Wang, M.; Leber, C.; Nothias, L.-F.; Reher, R.; Kang, K.B.; Hooft, J.J.J.; Dorrestein, P.; Gerwick, W.; Cottrell, G. NPClassifier: A Deep Neural Network-Based Structural Classification Tool for Natural Products. ChemRXiv 2020. preprint. [Google Scholar] [CrossRef] [PubMed]


Publisher’s Note: MDPI stays neutral with regard to jurisdictional claims in published maps and institutional affiliations. |
© 2021 by the authors. Licensee MDPI, Basel, Switzerland. This article is an open access article distributed under the terms and conditions of the Creative Commons Attribution (CC BY) license (https://creativecommons.org/licenses/by/4.0/).
Share and Cite
Hammerle, F.; Quirós-Guerrero, L.; Rutz, A.; Wolfender, J.-L.; Schöbel, H.; Peintner, U.; Siewert, B. Feature-Based Molecular Networking—An Exciting Tool to Spot Species of the Genus Cortinarius with Hidden Photosensitizers. Metabolites 2021, 11, 791. https://0-doi-org.brum.beds.ac.uk/10.3390/metabo11110791
Hammerle F, Quirós-Guerrero L, Rutz A, Wolfender J-L, Schöbel H, Peintner U, Siewert B. Feature-Based Molecular Networking—An Exciting Tool to Spot Species of the Genus Cortinarius with Hidden Photosensitizers. Metabolites. 2021; 11(11):791. https://0-doi-org.brum.beds.ac.uk/10.3390/metabo11110791
Chicago/Turabian StyleHammerle, Fabian, Luis Quirós-Guerrero, Adriano Rutz, Jean-Luc Wolfender, Harald Schöbel, Ursula Peintner, and Bianka Siewert. 2021. "Feature-Based Molecular Networking—An Exciting Tool to Spot Species of the Genus Cortinarius with Hidden Photosensitizers" Metabolites 11, no. 11: 791. https://0-doi-org.brum.beds.ac.uk/10.3390/metabo11110791