
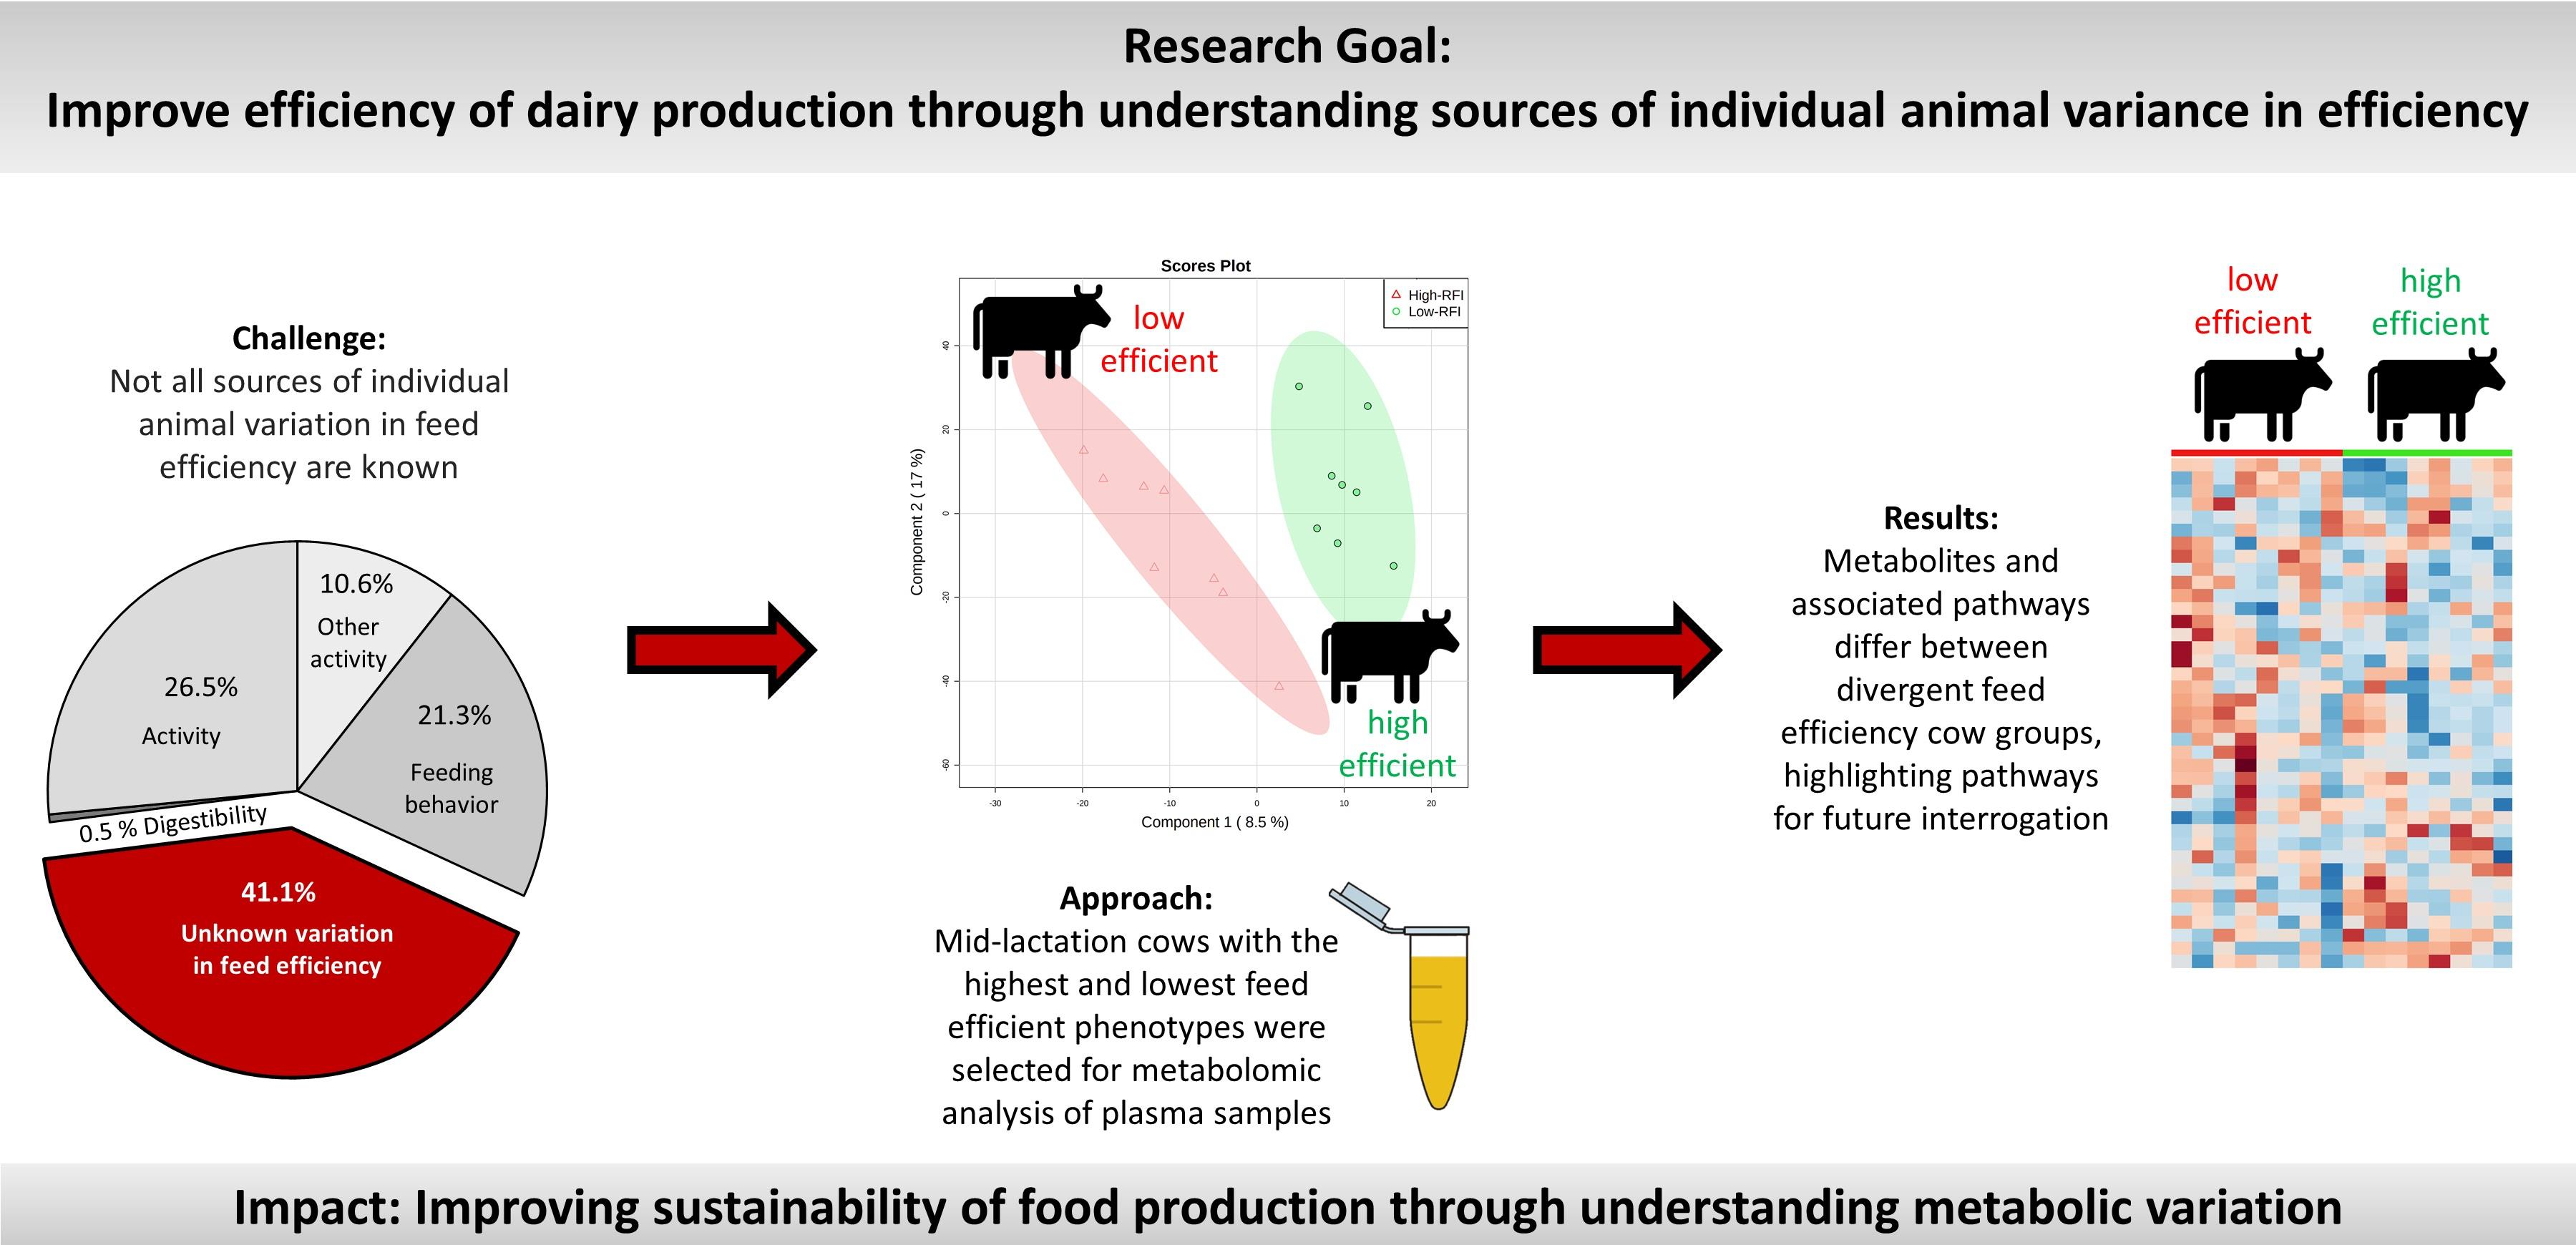
Circulating Metabolites Indicate Differences in High and Low Residual Feed Intake Holstein Dairy Cows

 , ,
, ,
Abstract
:
1. Introduction
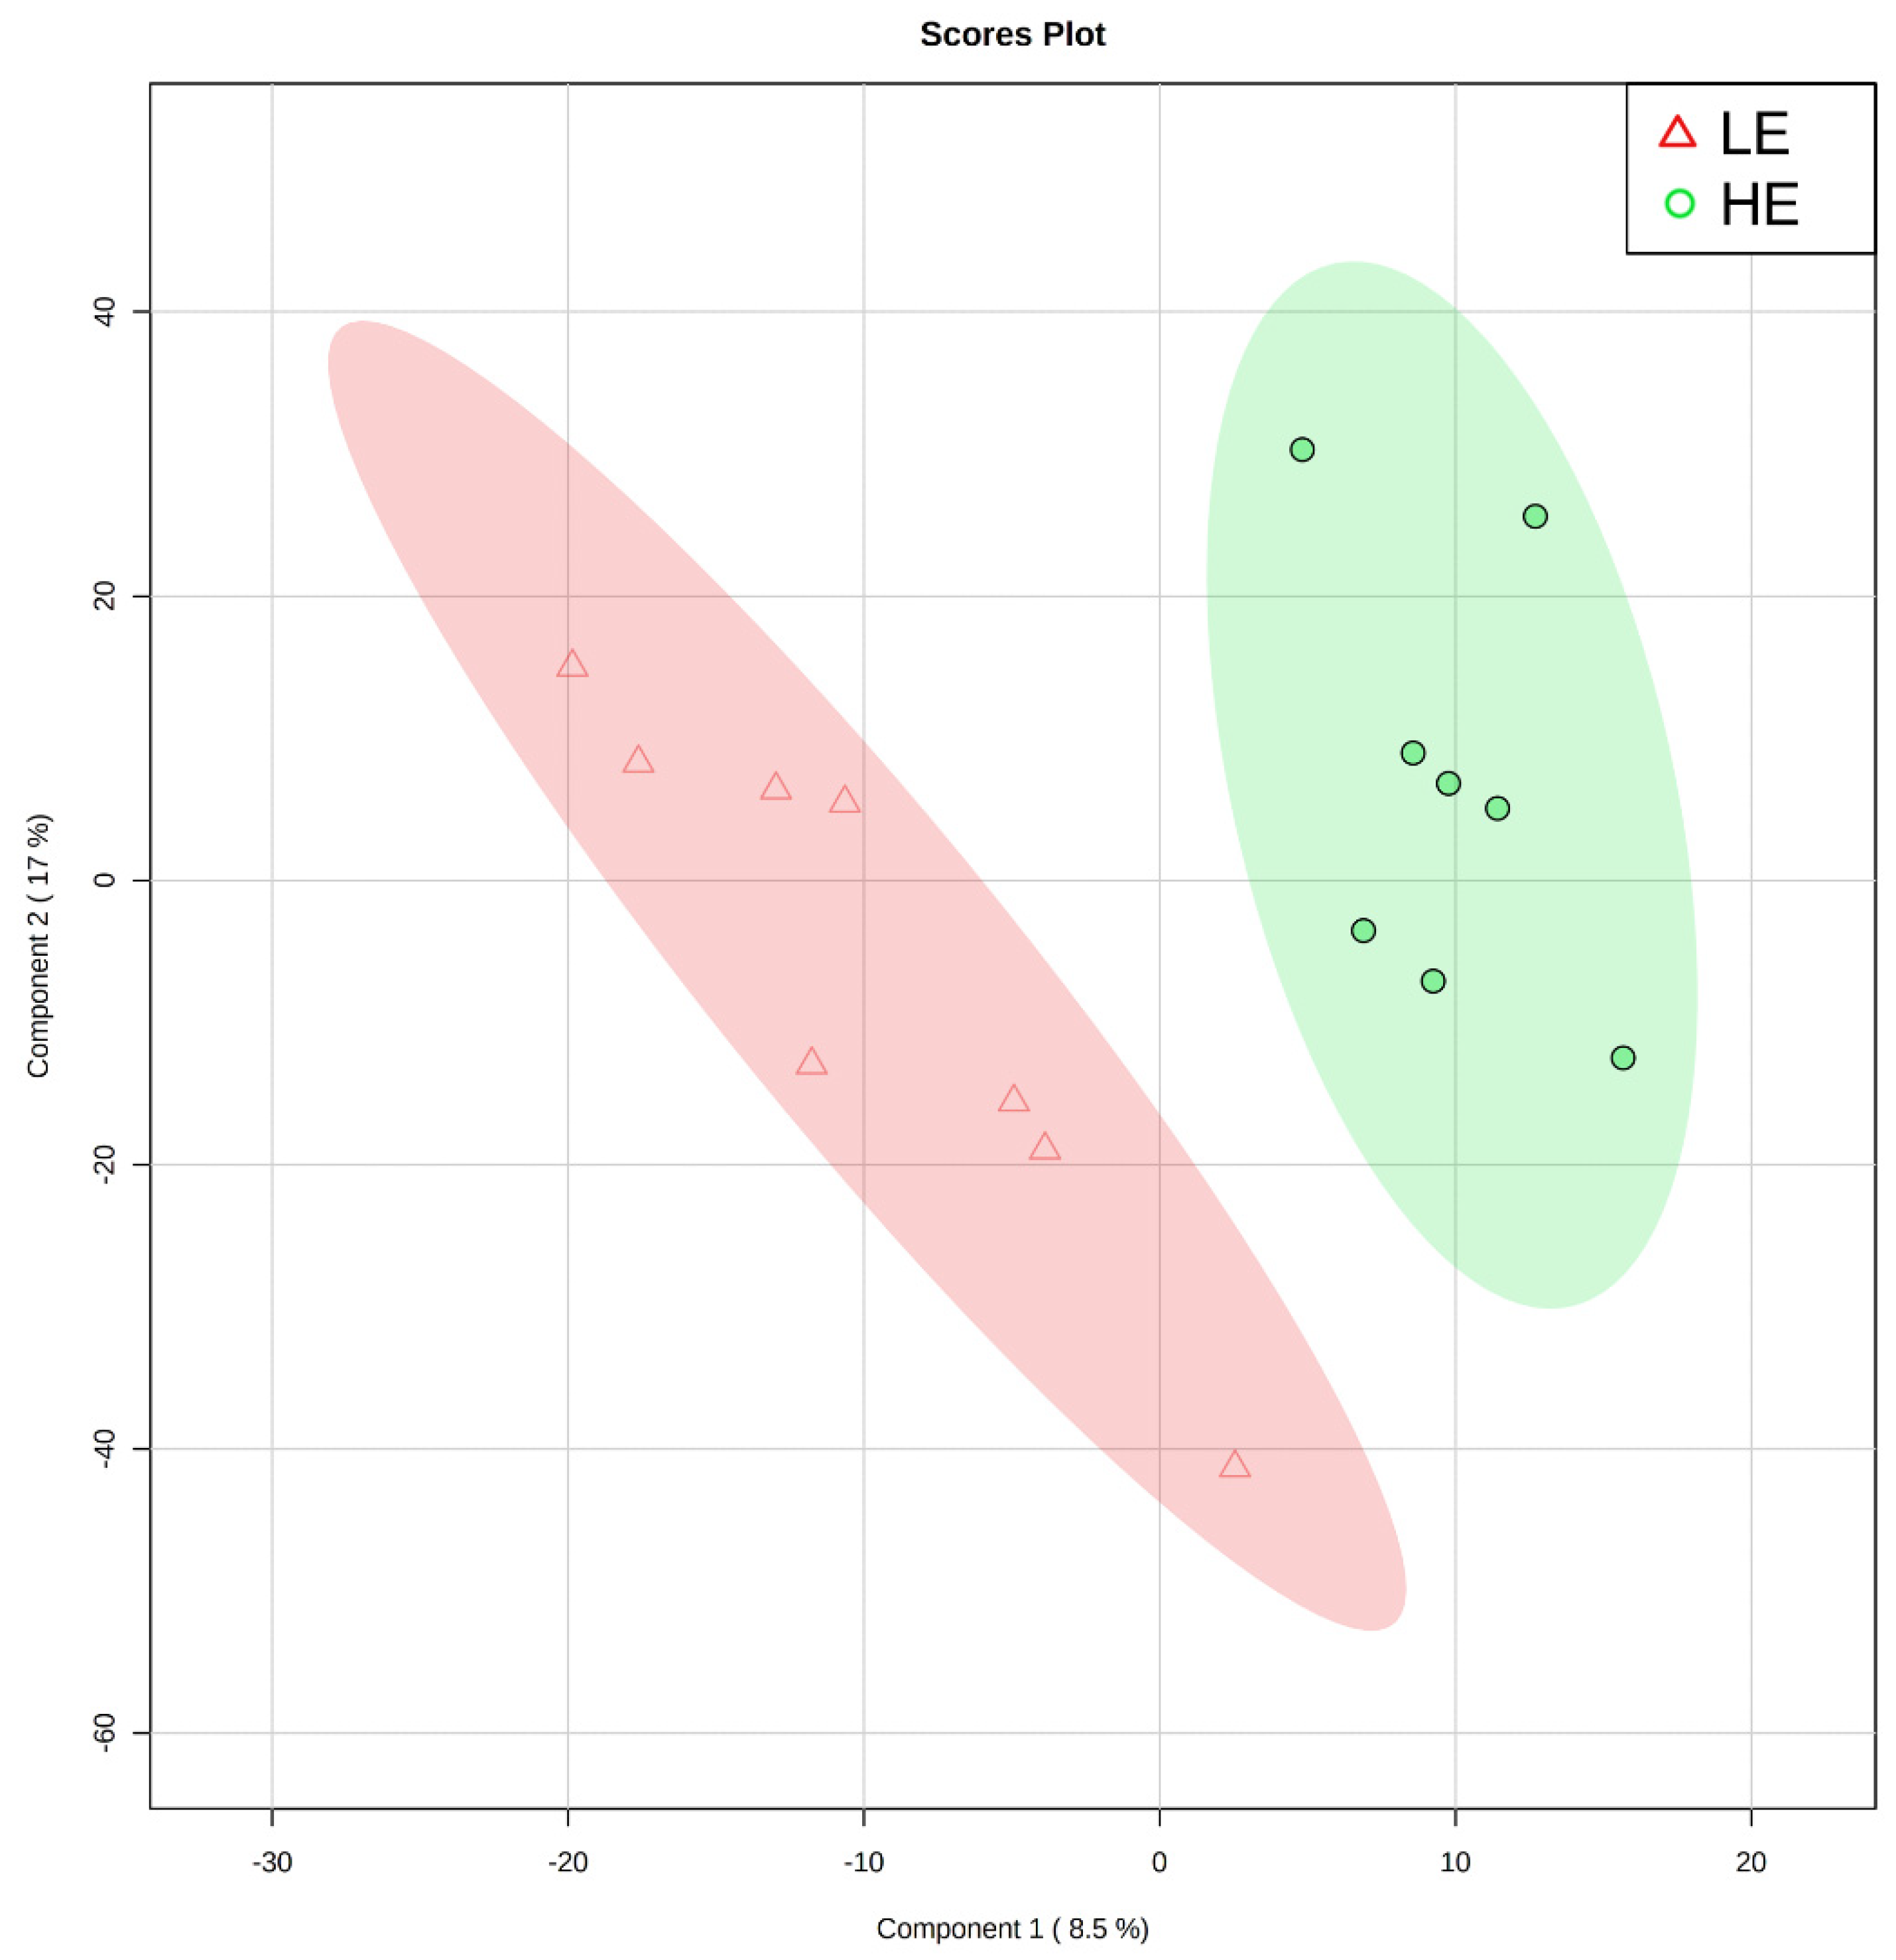
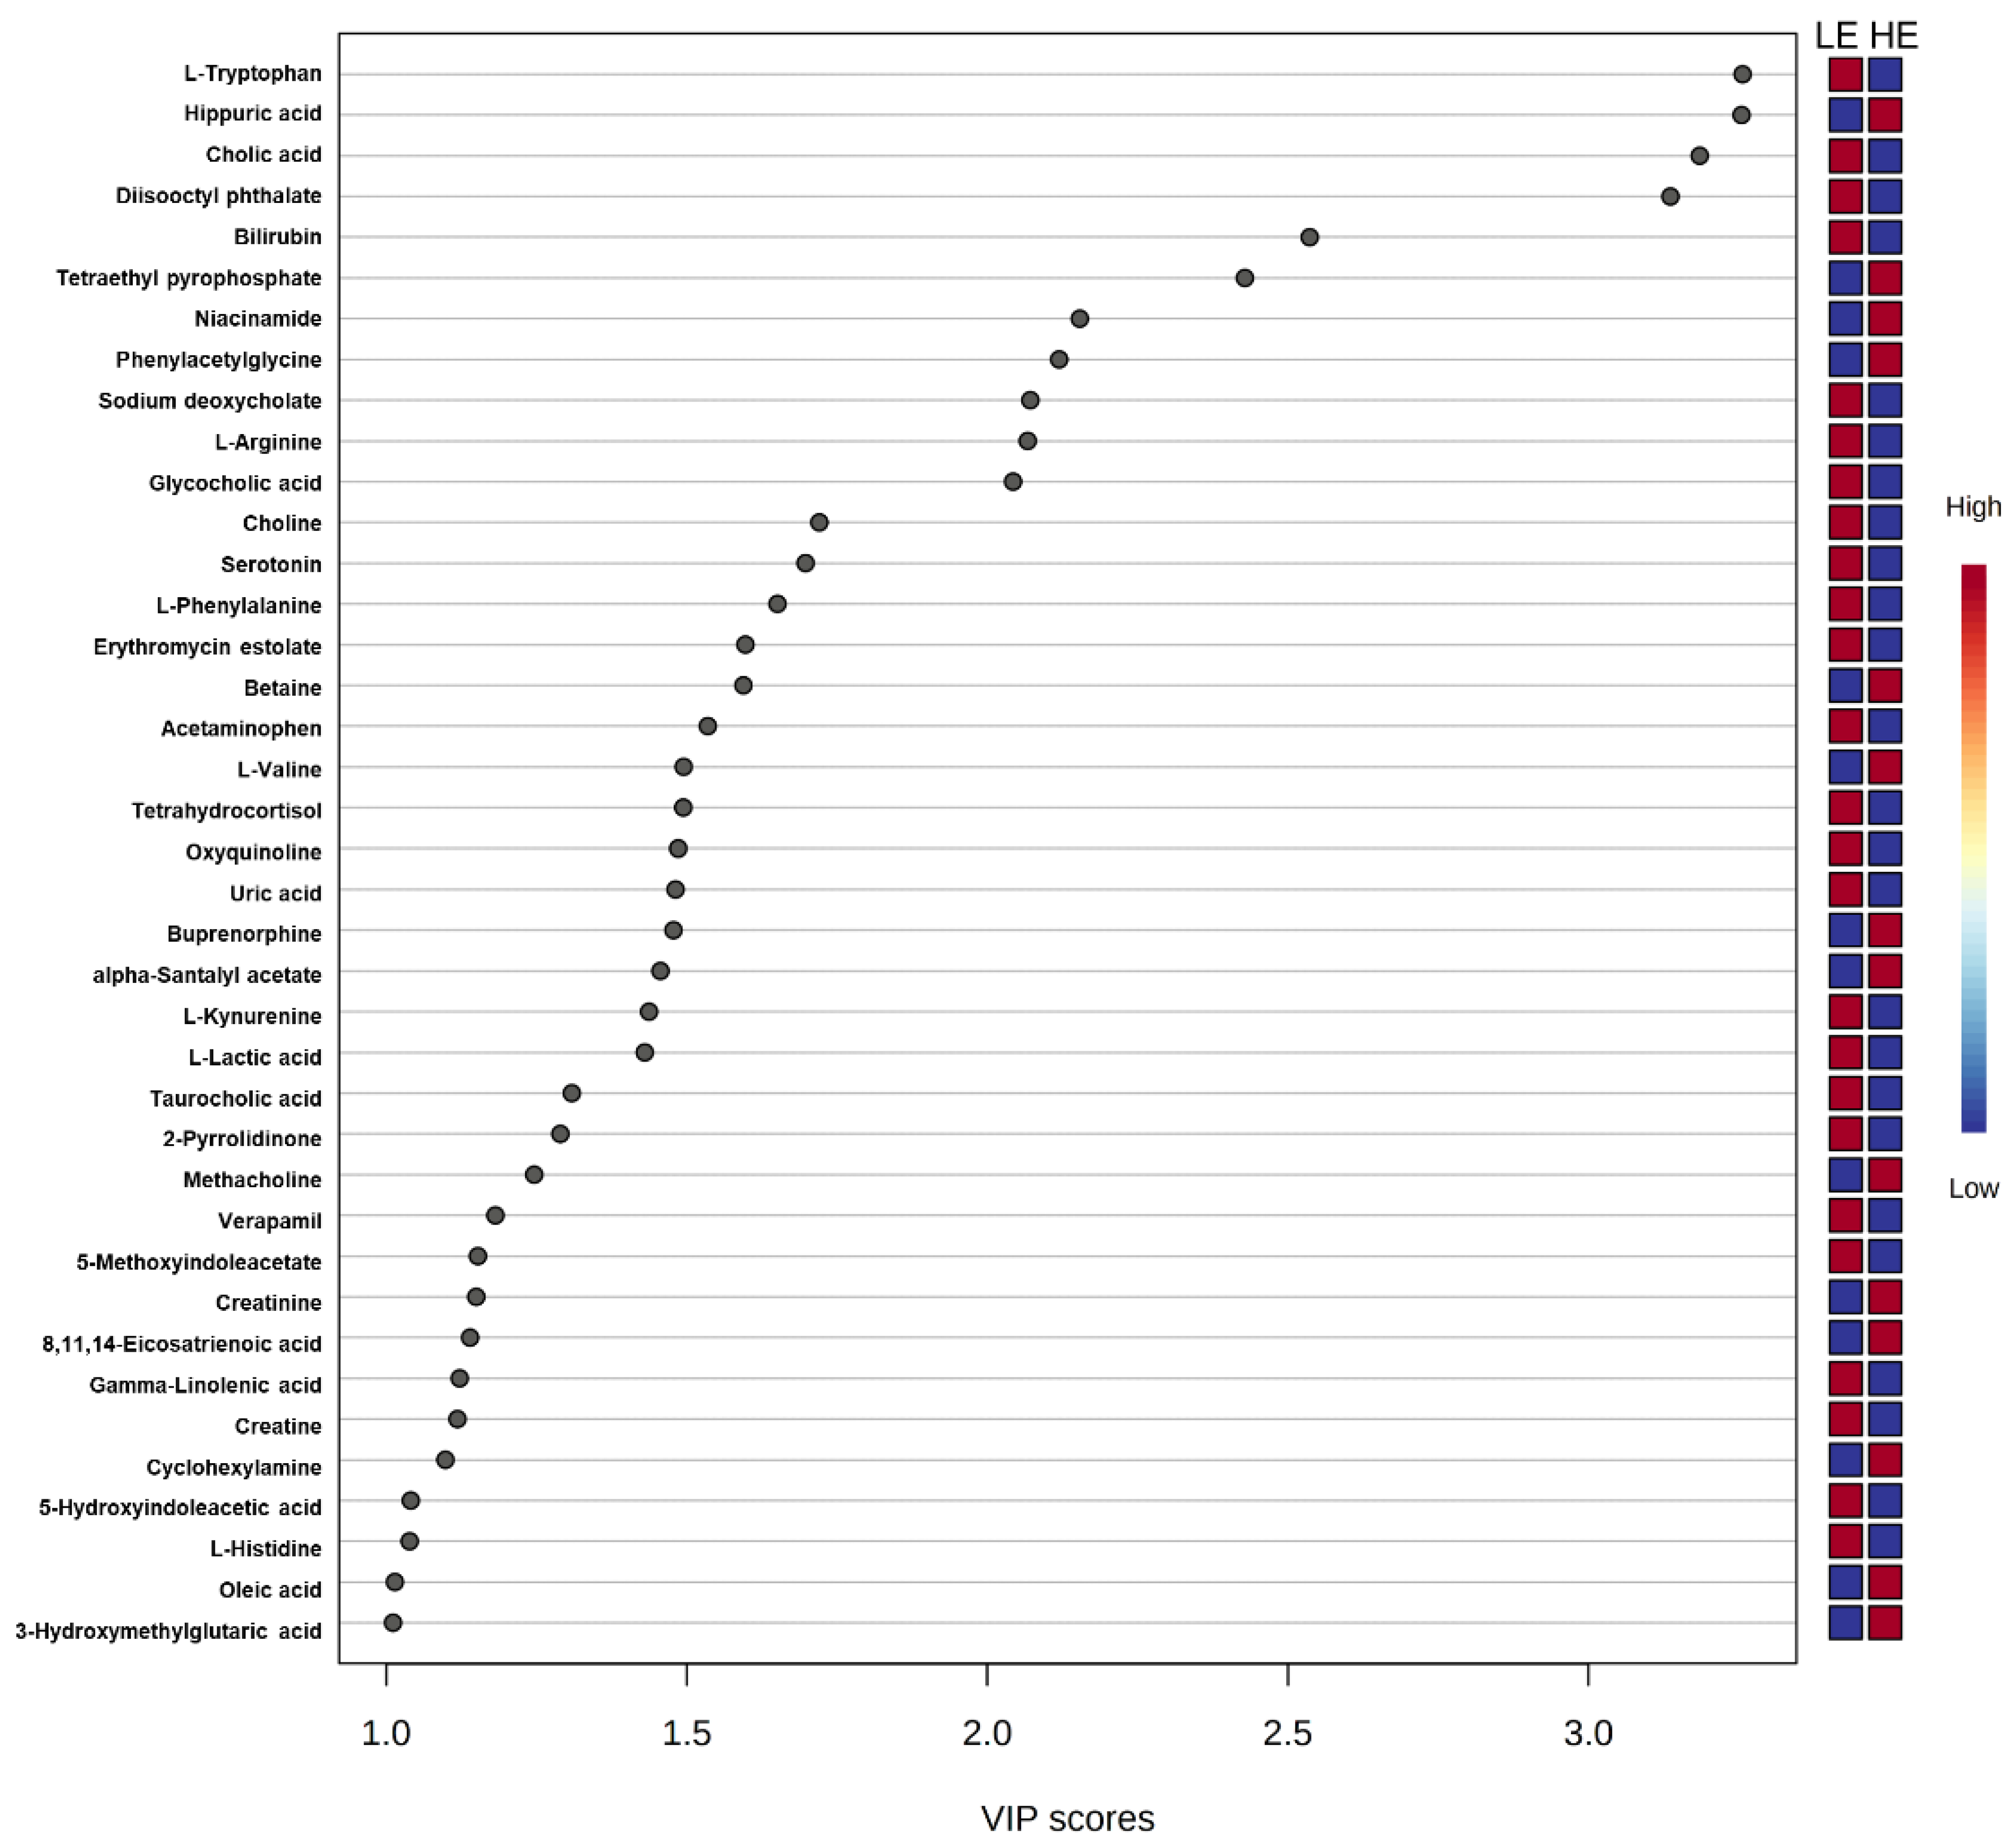
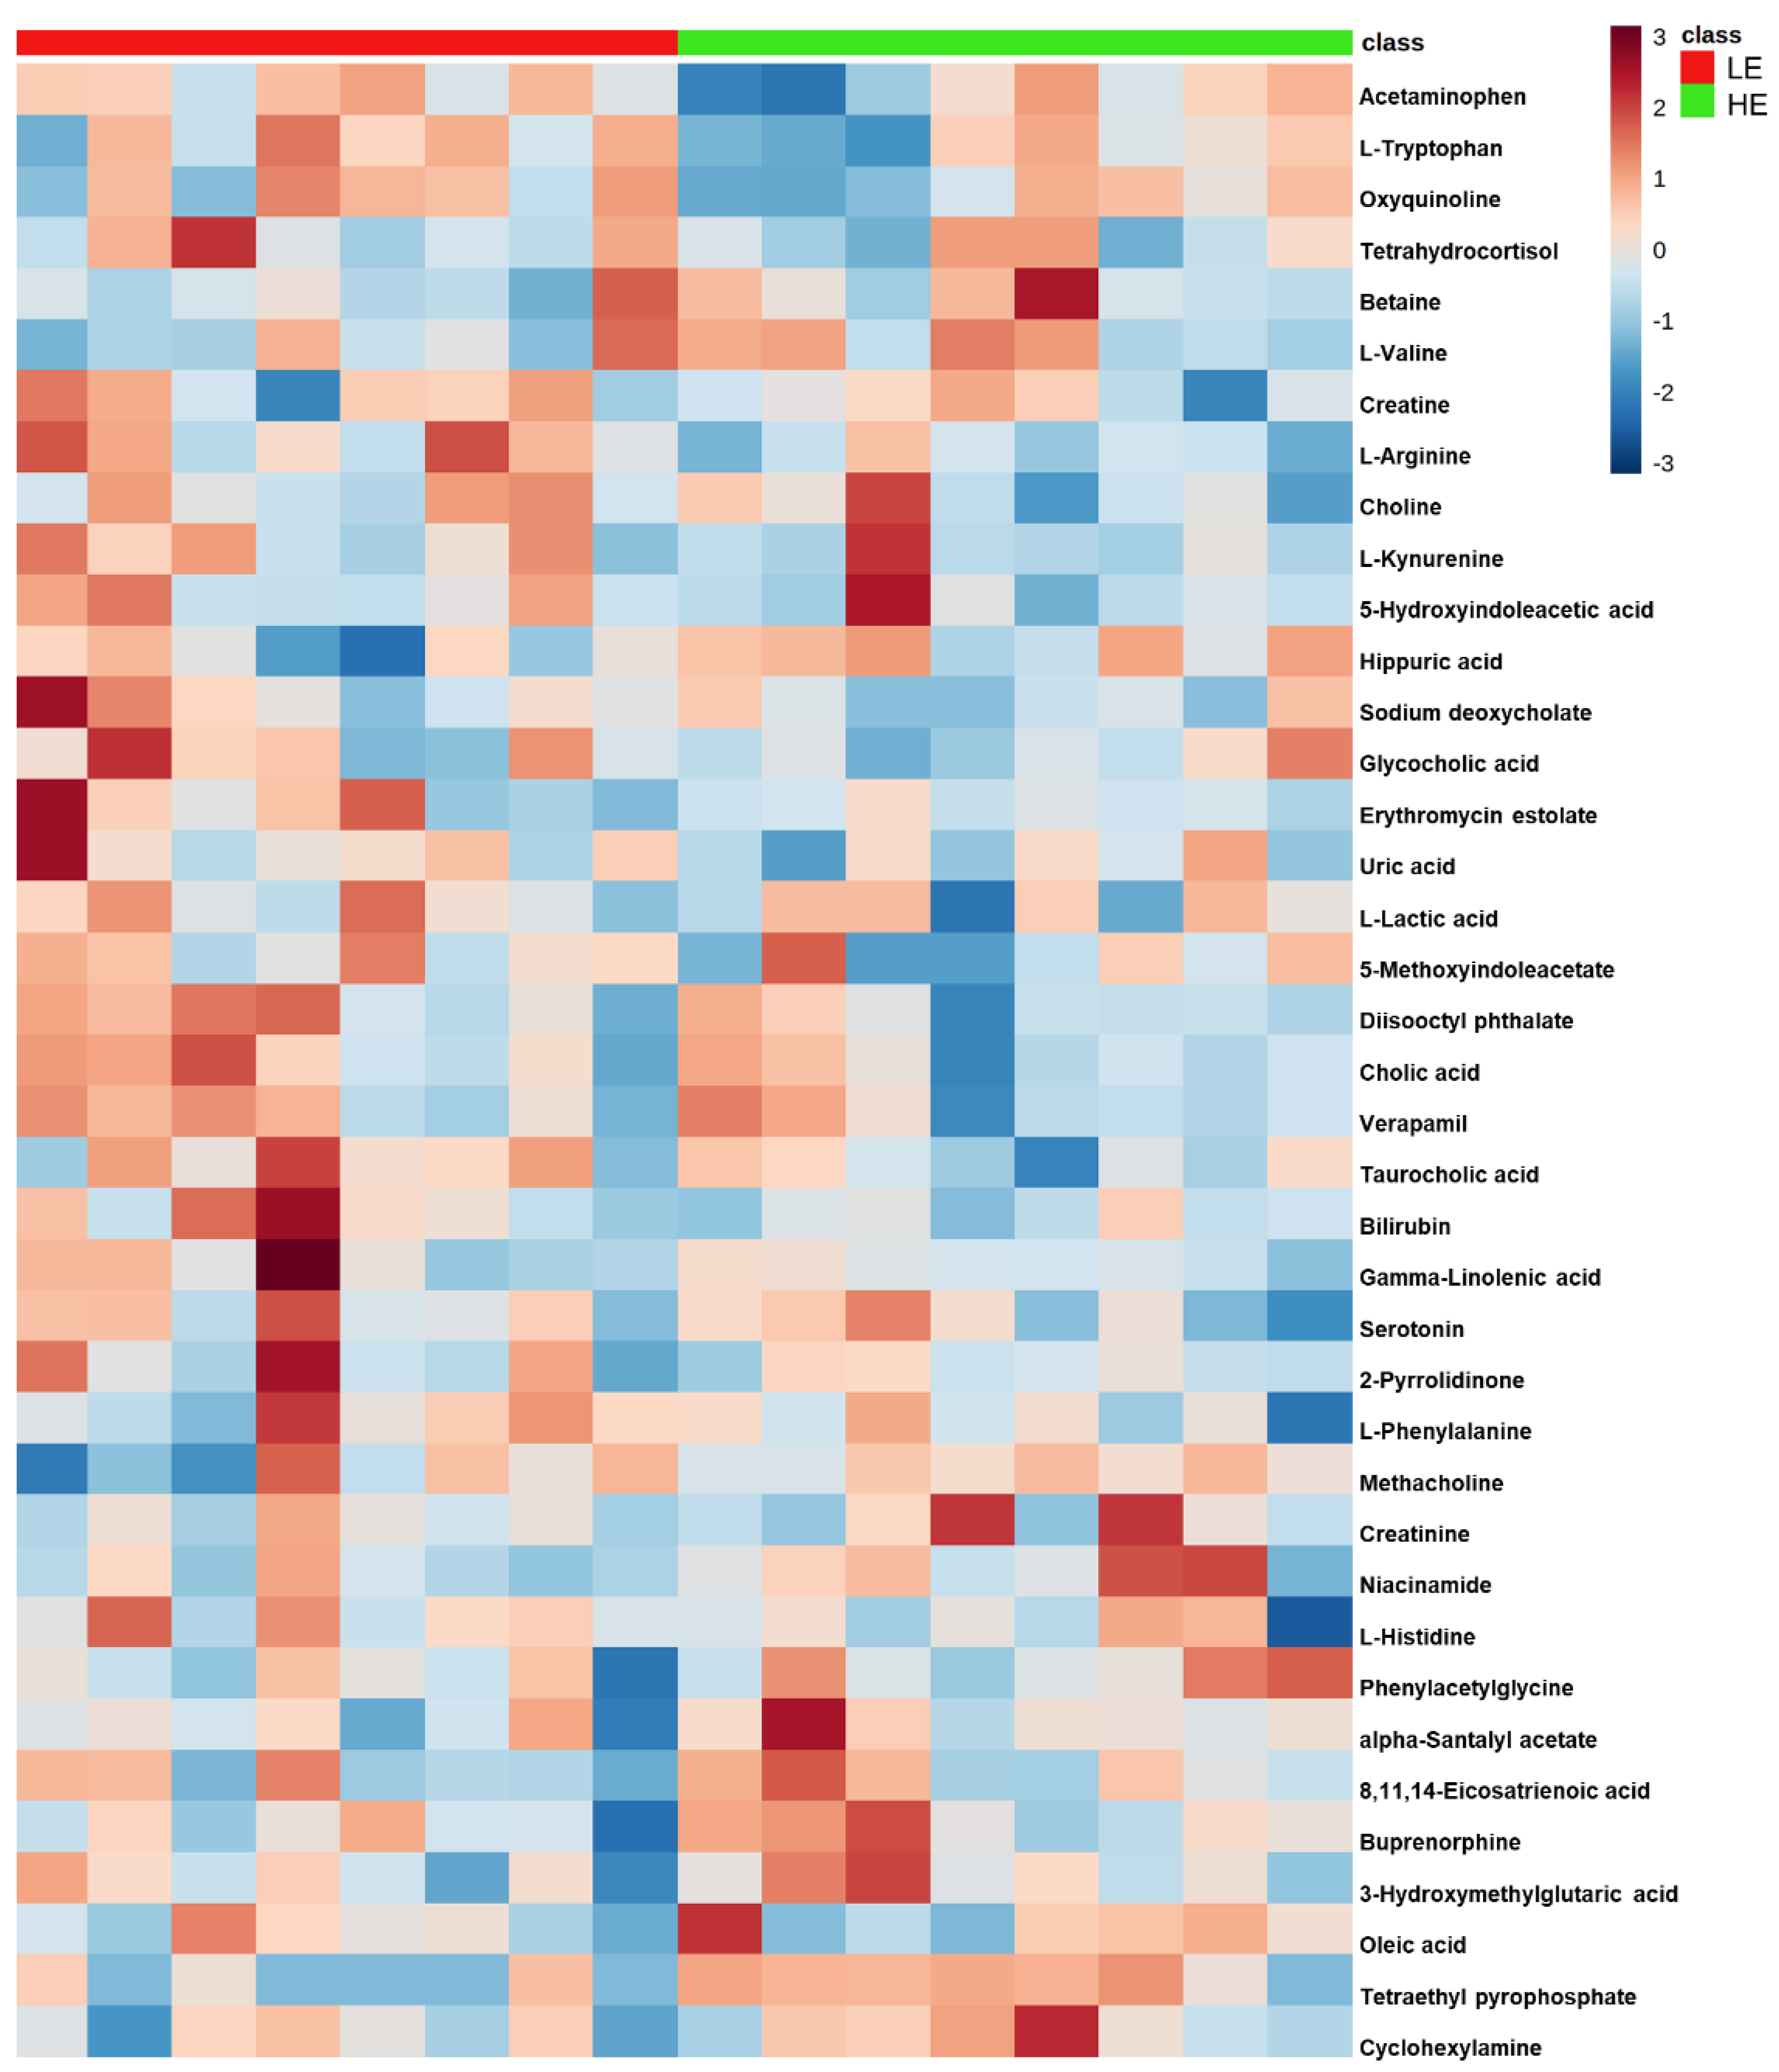
2. Results
2.1. Blood Metabolites
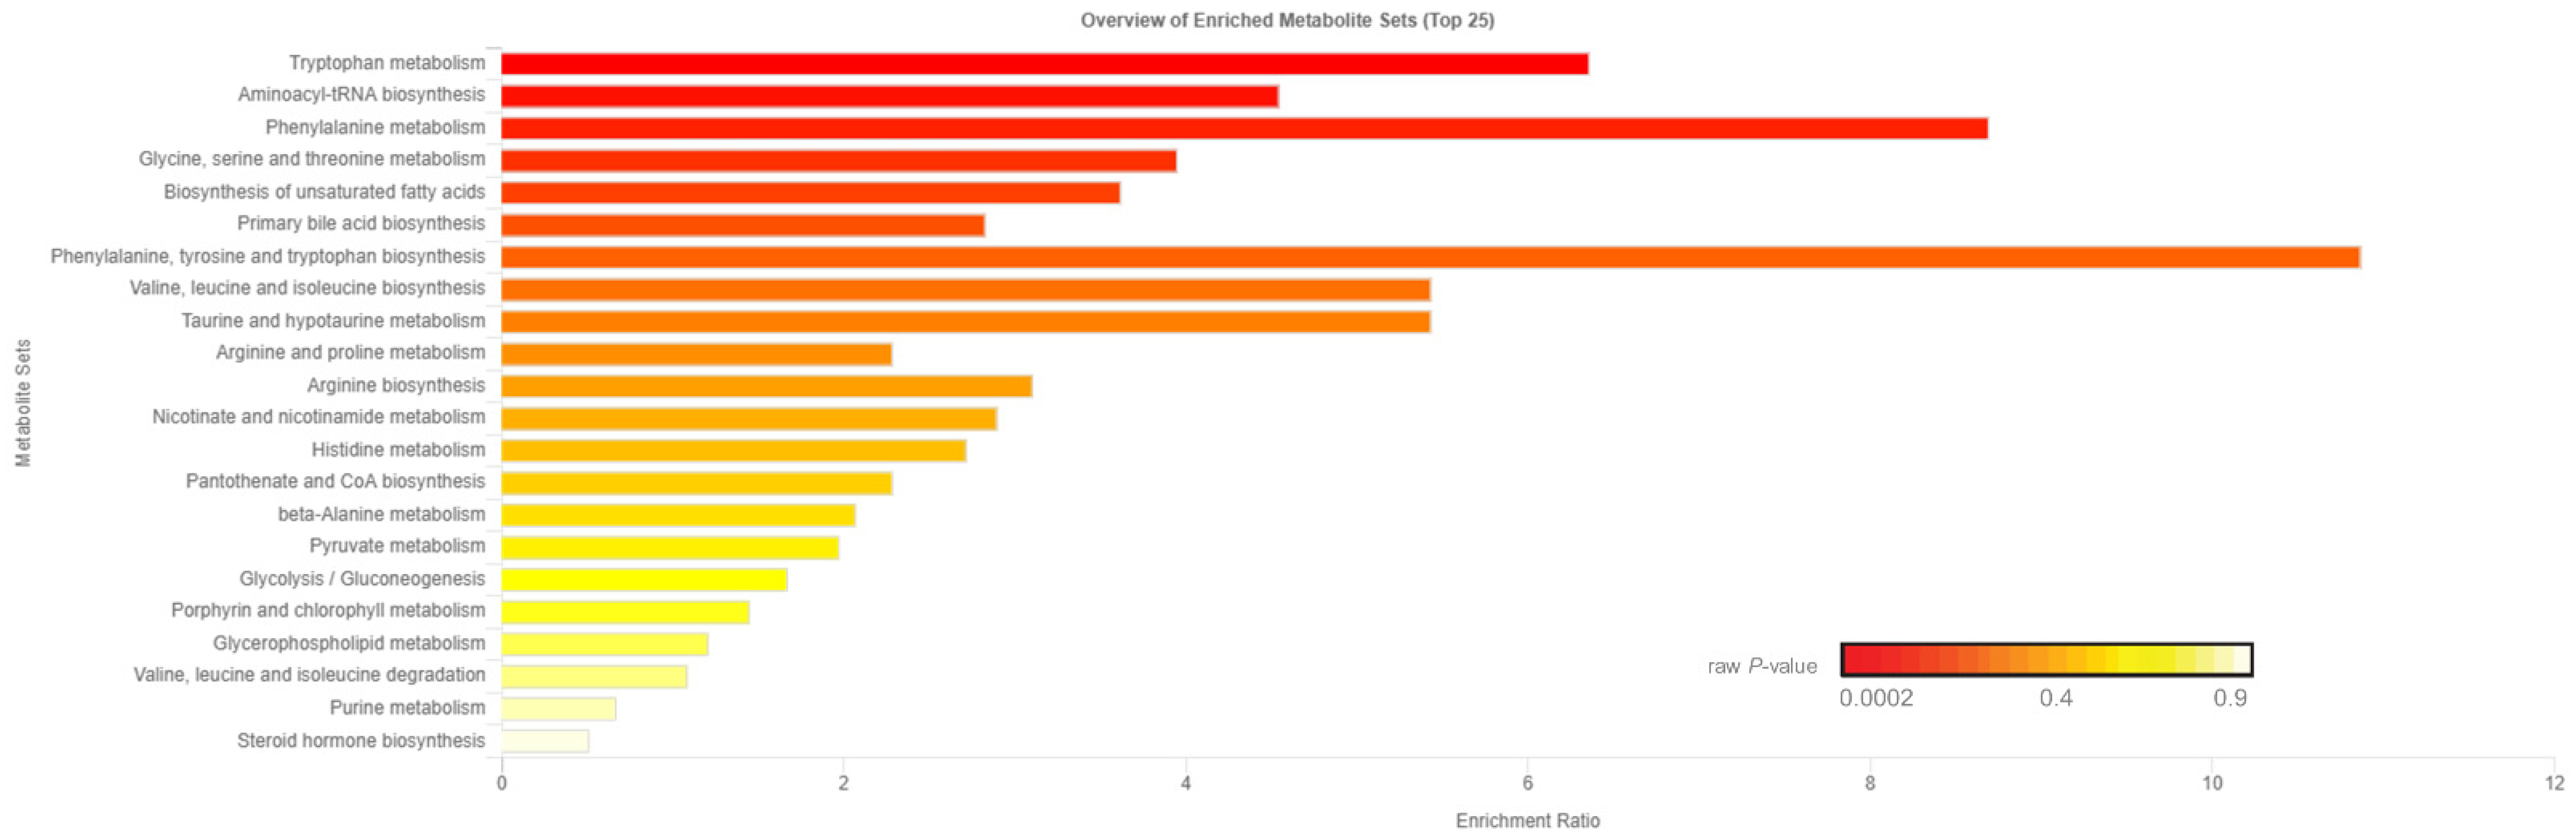
2.2. Untargeted Metabolomics
3. Discussion
4. Materials and Methods
4.1. Animals and Diets
4.2. Sample Collection and Anlaysis
4.2.1. Blood Metabolites
4.2.2. Untargeted Metabolomics
4.3. Statistical Analysis
4.3.1. RFI Determination
4.3.2. Production Variables and Blood Metabolite Analysis
Supplementary Materials
Author Contributions
Funding
Institutional Review Board Statement
Informed Consent Statement
Data Availability Statement
Acknowledgments
Conflicts of Interest
References
- US Department of Agriculture-Economic Research Service Milk Cost of Production Estimates. Available online: http://www.ers.usda.gov/data-products/milk-cost-of-production-estimates/ (accessed on 20 September 2021).
- VandeHaar, M.J.; Armentano, L.E.; Weigel, K.; Spurlock, D.M.; Tempelman, R.J.; Veerkamp, R. Harnessing the genetics of the modern dairy cow to continue improvements in feed efficiency. J. Dairy Sci. 2016, 99, 4941–4954. [Google Scholar] [CrossRef] [Green Version]
- Li, B.; Vanraden, P.M.; Guduk, E.; O’Connell, J.R.; Null, D.J.; Connor, E.E.; VandeHaar, M.J.; Tempelman, R.J.; Weigel, K.A.; Cole, J.B. Genomic prediction of residual feed intake in US Holstein dairy cattle. J. Dairy Sci. 2020, 103, 2477–2486. [Google Scholar] [CrossRef] [PubMed]
- VanRaden, P.; O’Connell, J.; Connor, E.; VandeHaar, M.; Tempelman, R.; Weigel, K. Including feed intake data from U.S. Holsteins in genomic prediction. Proc. World Congr. Genet. Appl. to Livest. Prod. 2018, 1, 125. [Google Scholar]
- Manzanilla-Pech, C.I.V.; Veerkamp, R.F.; Tempelman, R.J.; van Pelt, M.L.; Weigel, K.A.; VandeHaar, M.; Lawlor, T.J.; Spurlock, D.M.; Armentano, L.E.; Staples, C.R.; et al. Genetic parameters between feed-intake-related traits and conformation in 2 separate dairy populations-the Netherlands and United States. J. Dairy Sci. 2016, 99, 443–457. [Google Scholar] [CrossRef] [PubMed] [Green Version]
- Tempelman, R.J.; Spurlock, D.M.; Coffey, M.; Veerkamp, R.F.; Armentano, L.E.; Weigel, K.A.; de Haas, Y.; Staples, C.R.; Connor, E.E.; Lu, Y.; et al. Heterogeneity in genetic and nongenetic variation and energy sink relationships for residual feed intake across research stations and countries. J. Dairy Sci. 2015, 98, 2013–2026. [Google Scholar] [CrossRef] [Green Version]
- Fischer, A.; Delagarde, R.; Faverdin, P. Identification of biological traits associated with differences in residual energy intake among lactating Holstein cows. J. Dairy Sci. 2018, 101, 4193–4211. [Google Scholar] [CrossRef] [PubMed] [Green Version]
- Kennedy, K.M.; Becker, F.; Hammon, H.M.; Kuhla, B. Differences in net fat oxidation, heat production, and liver mitochondrial DNA copy numbers between high and low feed-efficient dairy cows. J. Dairy Sci. 2021. [Google Scholar] [CrossRef]
- Makrecka-kuka, M.; Sevostjanovs, E.; Vilks, K.; Volska, K.; Antone, U.; Kuka, J.; Makarova, E.; Pugovics, O.; Dambrova, M. Plasma acylcarnitine concentrations reflect the acylcarnitine profile in cardiac tissues. Sci. Rep. 2017, 7, 1–11. [Google Scholar] [CrossRef] [Green Version]
- Holtenius, P.; Holtenius, K. A model to estimate insulin sensitivity in dairy cows. Acta Vet. Scand. 2007, 49, 29. [Google Scholar] [CrossRef] [Green Version]
- Xie, Y.; Wu, Z.; Wang, D.; Liu, J. Nitrogen partitioning and microbial protein synthesis in lactating dairy cows with different phenotypic residual feed intake. J. Anim. Sci. Biotechnol. 2019, 10, 1–8. [Google Scholar] [CrossRef] [PubMed]
- Martin, M.J.; Dórea, J.R.R.; Borchers, M.R.; Wallace, R.L.; Bertics, S.J.; DeNise, S.K.; Weigel, K.A.; White, H.M. Comparison of methods to predict feed intake and residual feed intake using behavioral and metabolite data in addition to classical performance variables. J. Dairy Sci. 2021, 104, 8765–8782. [Google Scholar] [CrossRef] [PubMed]
- Herd, R.M.; Arthur, P.F. Physiological basis for residual feed intake. J. Anim. Sci. 2009, 87, 64–71. [Google Scholar] [CrossRef] [PubMed]
- Olijhoek, D.W.; Løvendahl, P.; Lassen, J.; Hellwing, A.L.F.; Höglund, J.K.; Weisbjerg, M.R.; Noel, S.J. Methane production, rumen fermentation, and diet digestibility of Holstein and Jersey dairy cows being divergent in residual feed intake and fed at 2 forage-to-concentrate ratios. J. Dairy Sci. 2018, 101, 9926–9940. [Google Scholar] [CrossRef] [PubMed] [Green Version]
- Kohlmeier, M. Amino Acids and Nitrogen Compounds. In Nutrient Metabolism; Elsevier: Amsterdam, The Netherlands, 2015; pp. 455–458. [Google Scholar]
- Koves, T.R.; Ussher, J.R.; Noland, R.C.; Slentz, D.; Mosedale, M.; Ilkayeva, O.; Bain, J.; Stevens, R.; Dyck, J.R.B.; Newgard, C.B.; et al. Mitochondrial Overload and Incomplete Fatty Acid Oxidation Contribute to Skeletal Muscle Insulin Resistance. Cell Metab. 2008, 7, 45–56. [Google Scholar] [CrossRef] [PubMed] [Green Version]
- Gucciardi, A.; Zaramella, P.; Costa, I.; Pirillo, P.; Nardo, D.; Naturale, M.; Chiandetti, L.; Giordano, G. Analysis and interpretation of acylcarnitine profiles in dried blood spot and plasma of preterm and full-term newborns. Pediatr. Res. 2015, 77, 36–47. [Google Scholar] [CrossRef]
- Merritt II, J.L.; Norris, M.; Kanungo, S. Fatty Acid Oxidation disorders. Ann. Transl. Med. 2018, 6, 473. [Google Scholar] [CrossRef]
- Schooneman, M.G.; Houten, S.M.; Soeters, M.R. Acylcarnitines Reflecting or Inflicting Insulin Resistance? Diabetes 2013, 62, 1–8. [Google Scholar] [CrossRef] [Green Version]
- Schooneman, M.G.; Achterkamp, N.; Argmann, C.A.; Soeters, M.R.; Houten, S.M. Plasma acylcarnitines inadequately reflect tissue acylcarnitine metabolism. Biochim. Biophys. Acta—Mol. Cell Biol. Lipids 2014, 1841, 987–994. [Google Scholar] [CrossRef]
- Pinotti, L.; Baldi, A.; Dell’Orto, V. Comparative mammalian choline metabolism with emphasis on the high-yielding dairy cow. Nutr. Res. Rev. 2002, 15, 315–332. [Google Scholar] [CrossRef] [Green Version]
- McFadden, J.W.; Girard, C.L.; Tao, S.; Zhou, Z.; Bernard, J.K.; Duplessis, M.; White, H.M. Symposium review: One-carbon metabolism and methyl donor nutrition in the dairy cow. J. Dairy Sci. 2020, 103, 5668–5683. [Google Scholar] [CrossRef]
- Wu, G. Amino Acids: Biochemistry and Nutrition, 1st ed.; CRC Press: Boca Raton, FL, USA, 2013. [Google Scholar] [CrossRef]
- National Research Council. Nutrient Requirements of Dairy Cattle, 7th ed.; National Academies Press: Washington, DC, USA, 2001. [Google Scholar]
- Edmonson, A.J.; Lean, I.J.; Weaver, L.D.; Farver, T.; Webster, G. A Body Condition Scoring Chart for Holstein Dairy Cows. J. Dairy Sci. 1989, 72, 68–78. [Google Scholar] [CrossRef]
- Caputo Oliveira, R.; Erb, S.J.; Pralle, R.S.; Holdorf, H.T.; Seely, C.R.; White, H.M. Postpartum supplementation with fermented ammoniated condensed whey altered nutrient partitioning to support hepatic metabolism. J. Dairy Sci. 2020, 103, 7055–7067. [Google Scholar] [CrossRef]
- Pralle, R.S.; Erb, S.J.; Holdorf, H.T.; White, H.M. Greater liver PNPLA3 protein abundance in vivo and in vitro supports lower triglyceride accumulation in dairy cows. Sci. Rep. 2021, 11, 1–16. [Google Scholar] [CrossRef] [PubMed]
- Abuelo, Á.; De Koster, J.; Hernández, J.; Opsomer, G.; Grufman, L.; Castillo, C. Quantifying bovine insulin: Conversion of units. Vet. Clin. Pathol. 2012, 41, 308–310. [Google Scholar] [CrossRef] [PubMed] [Green Version]
- An, J.; Muoio, D.M.; Shiota, M.; Fujimoto, Y.; Cline, G.W.; Shulman, G.I.; Koves, T.R.; Stevens, R.; Millington, D.; Newgard, C.B. Hepatic expression of malonyl-CoA decarboxylase reverses muscle, liver and whole-animal insulin resistance. Nat. Med. 2004, 10, 268–274. [Google Scholar] [CrossRef]


| RFI Group 2 | Parity 3 | p-Value 4 | |||||
|---|---|---|---|---|---|---|---|
| Item 1 | HE | LE | Primiparous | Multiparous | RFI Group | Parity | Interaction |
| Intake and body composition | |||||||
| DMI, kg/day | 25.1 [24.1, 26.0] | 29.1 [28.2, 30.0] | 24.0 [22.9, 25.0] | 30.2 [29.4, 31.0] | <0.0001 | <0.0001 | 0.35 |
| DIM | 115 [95, 134] | 115 [95, 135] | 111 [92, 130] | 119 [97, 140] | 0.97 | 0.27 | 0.40 |
| BCS | 3.4 [3.2, 3.5] | 3.3 [3.2, 3.4] | 3.4 [3.2, 3.6] | 3.3 [3.2, 3.4] | 0.39 | 0.08 | 0.85 |
| Body weight, kg | 686 [662, 710] | 693 [669, 717] | 636 [608, 662] | 744 [724, 764] | 0.68 | <0.0001 | 0.92 |
| Body weight change, kg/day | 0.60 [0.27, 0.93] | 0.57 [0.24, 0.90] | 0.51 [0.18, 0.83] | 0.66 [0.29, 1.03] | 0.80 | 0.20 | 0.61 |
| Milk production | |||||||
| Milk yield, kg/day | 44.5 [38.9, 50.0] | 42.6 [37.0, 48.1] | 35.9 [28.4, 43.5] | 51.1 [45.9, 56.3] | 0.29 | <0.0001 | 0.81 |
| Milk energy output, Mcal/day | 30.0 [28.4, 31.5] | 30.0 [28.1, 31.2] | 26.0 [24.2, 27.8] | 33.6 [32.3, 34.9] | 0.79 | <0.0001 | 0.96 |
| Milk fat concentration, % | 3.4 [2.6, 4.2] | 3.7 [2.9, 4.7] | 3.8 [3.1, 4.5] | 3.3 [2.5, 4.1] | 0.08 | 0.01 | 0.72 |
| Milk fat yield, kg/day | 1.48 [1.38, 1.58] | 1.50 [1.41, 1.60] | 1.36 [1.25, 1.47] | 1.63 [1.54, 1.71] | 0.72 | 0.0002 | 0.84 |
| Milk protein concentration, % | 3.05 [2.97, 3.14] | 3.16 [3.07, 3.24] | 3.23 [3.13, 3.32] | 2.98 [2.91, 3.05] | 0.08 | <0.0001 | 0.28 |
| Milk protein yield, kg/day | 1.35 [1.15, 1.54] | 1.32 [1.13, 1.52] | 1.16 [0.93, 1.38] | 1.51 [1.33, 1.69] | 0.64 | <0.0001 | 0.83 |
| Blood metabolites | |||||||
| Glucose, mg/dL | 70.8 [62.2, 79.4] | 71.3 [62.6, 79.9] | 70.9 [62.6, 79.2] | 71.2 [62.1, 80.2] | 0.68 | 0.85 | 0.54 |
| NEFA, mmol/L | 0.14 [0.12, 0.15] | 0.13 [0.12, 0.15] | 0.14 [0.12, 0.15] | 0.13 [0.12, 0.15] | 0.47 | 0.79 | 0.12 |
| Triglyceride, mg/dL | 11.2 [10.3, 12.0] | 10.8 [9.9, 11.7] | 10.7 [9.8, 11.6] | 11.3 [10.3, 12.2] | 0.55 | 0.37 | 0.78 |
| BHB, mmol/L | 0.64 [0.58, 0.70] | 0.62 [0.55, 0.68] | 0.65 [0.58, 0.72] | 0.60 [0.54, 0.67] | 0.60 | 0.28 | 0.14 |
| RFI Group 3 | |||
|---|---|---|---|
| Item 1 | HE | LE | p-Value |
| Energy and liver function markers | |||
| BUN, mg/dL | 18.4 [13.8, 22.9] | 18.1 [13.5, 22.6] | 0.72 |
| Lactate, mg/dL | 6.3 [5.3, 7.7] | 7.0 [5.8, 8.8] | 0.44 |
| Albumin, g/dL | 4.4 [3.9, 4.6] | 4.3 [3.9, 4.7] | 0.62 |
| Insulin, µ/L | 0.42 [0.33, 0.51] | 0.48 [0.32, 0.63] | 0.50 |
| AST, U/L | 151.5 [110.6, 192.3] | 142.9 [100.6, 185.1] | 0.55 |
| ALT, U/L | 29.6 [26.3, 33.0] | 32.2 [30.1, 34.3] | 0.18 |
| AST:ALT | 5.1 [3.2, 6.9] | 4.4 [2.8, 6.0] | 0.13 |
| RQUICKI 2 | 0.52 [0.45, 0.60] | 0.53 [0.45, 0.60] | 0.84 |
| Acylcarnitines, µM | |||
| Free carnitine | 5.6 [3.5, 7.6] | 6.2 [4.1, 8.3] | 0.26 |
| C2-aclycarnitine | 2.2 [0.5, 3.9] | 2.3 [1.0, 3.7] | 0.54 |
| C3-aclycarnitine | 0.9 [0.7,1.1] | 1.3 [1.0, 1.6] | 0.01 |
| C4-aclycarnitine | 0.24 [0.21, 0.27] | 0.33 [0.28, 0.38] | 0.01 |
| C5-aclycarnitine | 0.08 [0.02, 0.14] | 0.07 [0.03, 0.12] | 0.70 |
| C16-aclycarnitine | 0.002 [0.001, 0.005] | 0.002 [0.001, 0.005] | 0.86 |
| C18-aclycarnitine | 2.4 [1.2, 6.3] | 2.3 [1.2, 5.9] | 0.88 |
| C18:1-aclycarnitine | 0.24 [0.11, 0.75] | 0.17 [0.09, 0.43] | 0.16 |
| C5-DC-acylcarnitine | 1.0 [0.6, 2.6] | 1.2 [0.6, 3.2] | 0.47 |
| C4-OH-acylcarnitine | 0.23 [0.003, 0.80] | 0.26 [0.01, 0.86] | 0.11 |
Publisher’s Note: MDPI stays neutral with regard to jurisdictional claims in published maps and institutional affiliations. |
© 2021 by the authors. Licensee MDPI, Basel, Switzerland. This article is an open access article distributed under the terms and conditions of the Creative Commons Attribution (CC BY) license (https://creativecommons.org/licenses/by/4.0/).
Share and Cite
Martin, M.J.; Pralle, R.S.; Bernstein, I.R.; VandeHaar, M.J.; Weigel, K.A.; Zhou, Z.; White, H.M. Circulating Metabolites Indicate Differences in High and Low Residual Feed Intake Holstein Dairy Cows. Metabolites 2021, 11, 868. https://0-doi-org.brum.beds.ac.uk/10.3390/metabo11120868
Martin MJ, Pralle RS, Bernstein IR, VandeHaar MJ, Weigel KA, Zhou Z, White HM. Circulating Metabolites Indicate Differences in High and Low Residual Feed Intake Holstein Dairy Cows. Metabolites. 2021; 11(12):868. https://0-doi-org.brum.beds.ac.uk/10.3390/metabo11120868
Chicago/Turabian StyleMartin, Malia J., Ryan S. Pralle, Isabelle R. Bernstein, Michael J. VandeHaar, Kent A. Weigel, Zheng Zhou, and Heather M. White. 2021. "Circulating Metabolites Indicate Differences in High and Low Residual Feed Intake Holstein Dairy Cows" Metabolites 11, no. 12: 868. https://0-doi-org.brum.beds.ac.uk/10.3390/metabo11120868