
Distribution and Associated Factors of Hepatic Iron—A Population-Based Imaging Study

 , , , , and
Abstract
:
1. Introduction
2. Results
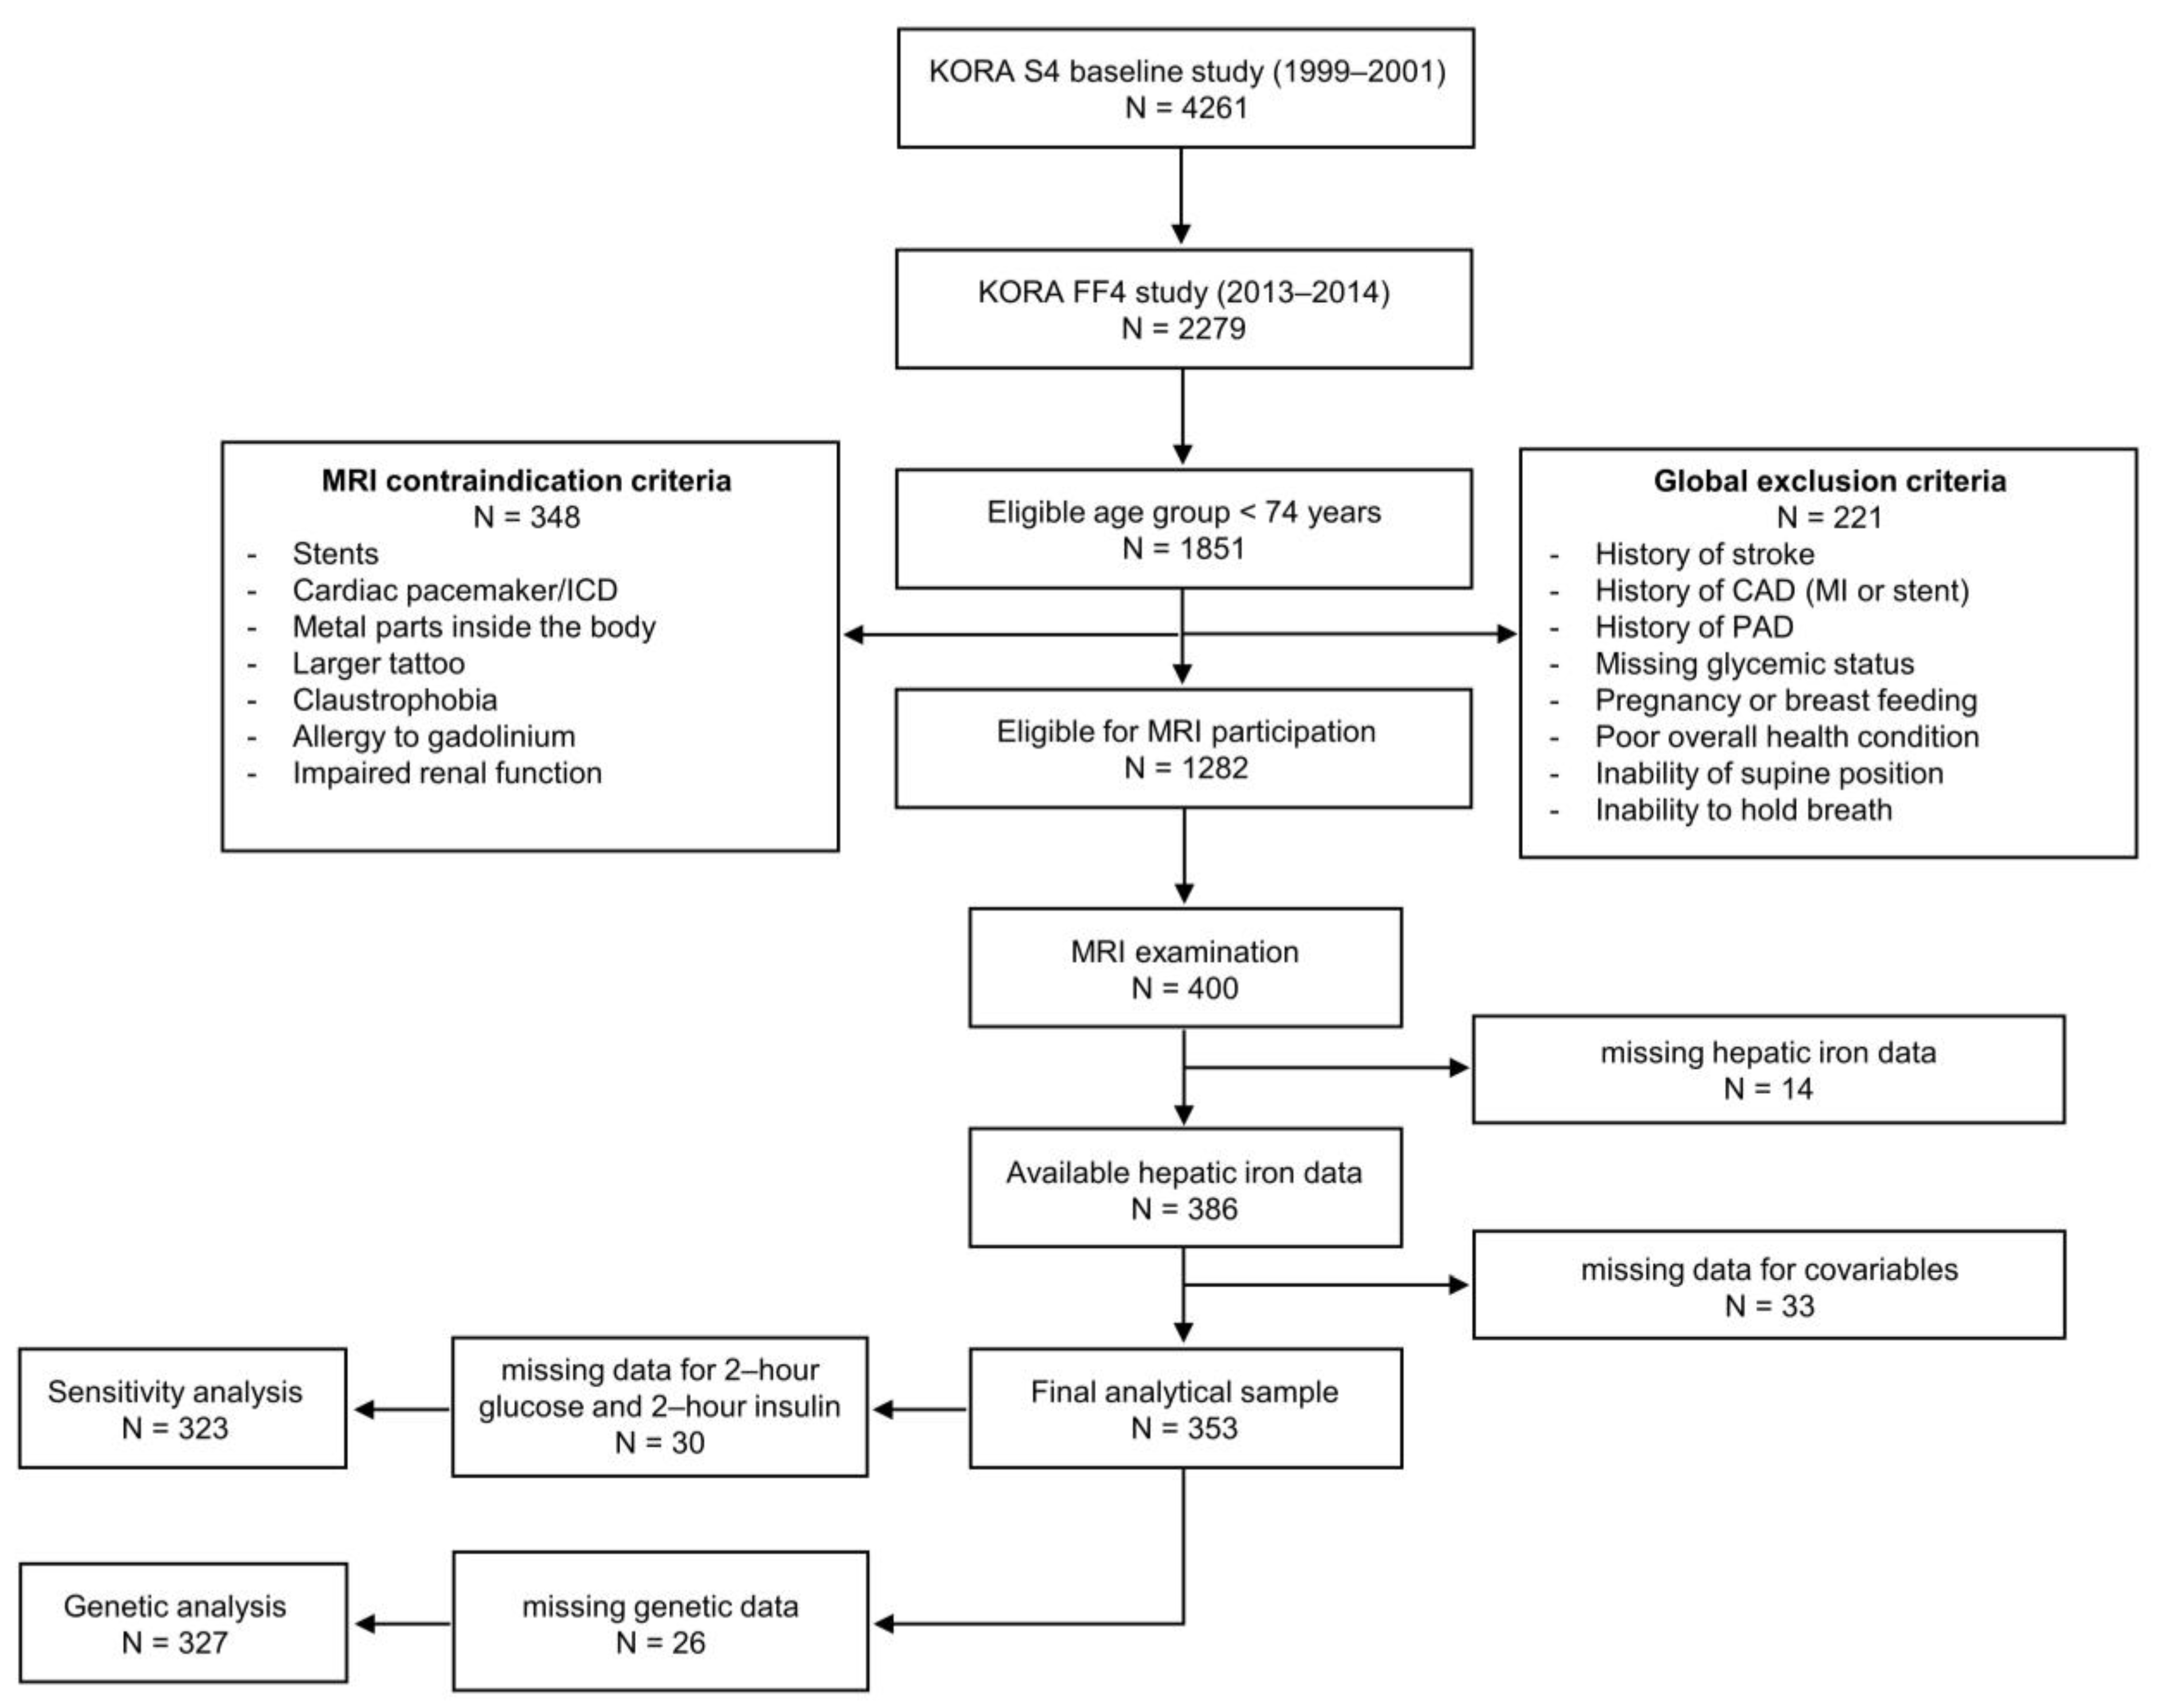
2.1. Study Sample
2.2. Distribution of HIC and Correlation with Age, HFF, and Genetic Risk Score
2.3. Identification of Relevant Associated Variables
2.4. Strength of Effects
3. Discussion
3.1. Distribution of HIC and Effect of Age
3.2. Body Composition and Blood Lipid Markers
3.3. Genetic Effects
3.4. Markers of Glucose Metabolism
3.5. Alcohol Consumption
3.6. Renal Function Parameters and Diuretics
3.7. Complete Blood Count
3.8. Electrolyte Panel and Medication
3.9. Strengths and Limitations
4. Materials and Methods
4.1. Study Design and Participants
4.2. Outcome and Exposure Assessment
4.2.1. MRI Examination: Hepatic Iron and Fat Content
4.2.2. Covariates
4.3. Statistical Analysis
5. Conclusions
Supplementary Materials
Author Contributions
Funding
Institutional Review Board Statement
Informed Consent Statement
Data Availability Statement
Acknowledgments
Conflicts of Interest
References
- Fleming, R.E.; Ponka, P. Iron Overload in Human Disease. N. Engl. J. Med. 2012, 366, 348–359. [Google Scholar] [CrossRef] [Green Version]
- Papanikolaou, G.; Tzilianos, M.; Christakis, J.I.; Bogdanos, D.; Tsimirika, K.; Macfarlane, J.; Goldberg, Y.P.; Sakellaropoulos, N.; Ganz, T.; Nemeth, E. Hepcidin in iron overload disorders. Blood 2005, 105, 4103–4105. [Google Scholar] [CrossRef]
- Pietrangelo, A. Iron and the liver. Liver Int. 2016, 36 (Suppl. 1), 116–123. [Google Scholar] [CrossRef] [PubMed]
- Hernando, D.; Levin, Y.S.; Sirlin, C.B.; Reeder, S.B. Quantification of liver iron with MRI: State of the art and remaining challenges. J. Magn. Reson. Imaging 2014, 40, 1003–1021. [Google Scholar] [CrossRef] [PubMed] [Green Version]
- Mehta, K.J.; Farnaud, S.J.; Sharp, P.A. Iron and liver fibrosis: Mechanistic and clinical aspects. World J. Gastroenterol. 2019, 25, 521–538. [Google Scholar] [CrossRef] [PubMed]
- Mendler, M.-H.; Turlin, B.; Moirand, R.; Jouanolle, A.-M.; Sapey, T.; Guyader, D.; le Gall, J.-Y.; Brissot, P.; David, V.; Deugnier, Y. Insulin resistance–associated hepatic iron overload. Gastroenterology 1999, 117, 1155–1163. [Google Scholar] [CrossRef]
- Seravalle, G.; Dell’Oro, R.; Quarti-Trevano, F.; Spaziani, D.; Bertoli, S.; Airoldi, F.; Mancia, G.; Grassi, G. Sympathetic Overactivation in Patients with Essential Hypertension and Hepatic Iron Overload. Hypertensionaha 2020, 76, 1444–1450. [Google Scholar] [CrossRef] [PubMed]
- Karlsson, M.; Ekstedt, M.; Dahlström, N.; Forsgren, M.F.; Ignatova, S.; Norén, B.; Leinhard, O.D.; Kechagias, S.; Lundberg, P. Liver R2* is affected by both iron and fat: A dual biopsy-validated study of chronic liver disease. J. Magn. Reson. Imaging 2019, 50, 325–333. [Google Scholar] [CrossRef]
- Radford-Smith, D.E.; Powell, E.E.; Powell, L.W. Haemochromatosis: A clinical update for the practising physician. Intern. Med. J. 2018, 48, 509–516. [Google Scholar] [CrossRef] [PubMed] [Green Version]
- Britton, L.; Bridle, K.; Reiling, J.; Santrampurwala, N.; Wockner, L.; Ching, H.; Stuart, K.; Subramaniam, V.N.; Jeffrey, G.; Pierre, T.S.; et al. Hepatic iron concentration correlates with insulin sensitivity in nonalcoholic fatty liver disease. Hepatol. Commun. 2018, 2, 644–653. [Google Scholar] [CrossRef]
- Castiella, A.; Urreta, I.; Zapata, E.; Zubiaurre, L.; Alústiza, J.M.; Otazua, P.; Salvador, E.; Letamendi, G.; Arrizabalaga, B.; Rincón, M.L.; et al. Liver iron concentration in dysmetabolic hyperferritinemia: Results from a prospective cohort of 276 patients. Ann. Hepatol. 2020, 19, 31–35. [Google Scholar] [CrossRef] [PubMed]
- Liu, Y.; Song, J.; Tian, H.; Chen, T.; Gao, Y.; Yu, H.; Zhang, X.; Ren, Y. Association of serum ferritin concentrations with prevalence of prediabetes, type 2 diabetes mellitus, and metabolic syndrome in a Chinese population from Sichuan. Int. J. Diabetes Dev. Ctries. 2015, 35, 522–528. [Google Scholar] [CrossRef]
- Wrede, C.E.; Buettner, R.; Bollheimer, L.C.; Schölmerich, J.; Palitzsch, K.-D.; Hellerbrand, C. Association between serum ferritin and the insulin resistance syndrome in a representative population. Eur. J. Endocrinol. 2006, 154, 333–340. [Google Scholar] [CrossRef]
- Daru, J.; Colman, K.; Stanworth, S.J.; De La Salle, B.; Wood, E.; Pasricha, S.-R. Serum ferritin as an indicator of iron status: What do we need to know? Am. J. Clin. Nutr. 2017, 106, 1634S–1639S. [Google Scholar] [CrossRef] [PubMed]
- Ernst, O.; Sergent, G.; Bonvarlet, P.; Canva-Delcambre, V.; Paris, J.C.; L’Herminé, C. Hepatic iron overload: Diagnosis and quantification with MR imaging. Am. J. Roentgenol. 1997, 168, 1205–1208. [Google Scholar] [CrossRef] [PubMed]
- Lawrence, S.P.; Caminer, S.J.; Yavorski, R.T.; Borosky, B.D.; Rak, K.M.; Merenich, J.A.; McDermott, M.T.; McNally, P.R. Correlation of Liver Density by Magnetic Resonance Imaging and Hepatic Iron Levels: A Noninvasive Means to Exclude Homozygous Hemochromatosis. J. Clin. Gastroenterol. 1996, 23, 113–117. [Google Scholar] [CrossRef] [PubMed]
- Kühn, J.-P.; Meffert, P.; Heske, C.; Kromrey, M.-L.; Schmidt, C.O.; Mensel, B.; Völzke, H.; Lerch, M.M.; Hernando, D.; Mayerle, J.; et al. Prevalence of Fatty Liver Disease and Hepatic Iron Overload in a Northeastern German Population by Using Quantitative MR Imaging. Radiology 2017, 284, 706–716. [Google Scholar] [CrossRef] [PubMed] [Green Version]
- McKay, A.; Wilman, H.; Dennis, A.; Kelly, M.; Gyngell, M.L.; Neubauer, S.; Bell, J.D.; Banerjee, R.; Thomas, E.L. Measurement of liver iron by magnetic resonance imaging in the UK Biobank population. PLoS ONE 2018, 13, e0209340. [Google Scholar] [CrossRef]
- Guo, W.; Bachman, E.; Li, M.; Roy, C.N.; Blusztajn, J.; Wong, S.; Chan, S.Y.; Serra, C.; Jasuja, R.; Travison, T.G.; et al. Testosterone administration inhibits hepcidin transcription and is associated with increased iron incorporation into red blood cells. Aging Cell 2013, 12, 280–291. [Google Scholar] [CrossRef] [PubMed] [Green Version]
- Obrzut, M.; Atamaniuk, V.; Glaser, K.J.; Chen, J.; Ehman, R.L.; Obrzut, B.; Cholewa, M.; Gutkowski, K. Value of liver iron concentration in healthy volunteers assessed by MRI. Sci. Rep. 2020, 10, 17887. [Google Scholar] [CrossRef]
- Bashir, M.R.; Wolfson, T.; Gamst, A.C.; Fowler, K.J.; Ohliger, M.; Shah, S.N.; Alazraki, A.; Trout, A.T.; Behling, C.; Allende, D.S.; et al. Hepatic R2* is more strongly associated with proton density fat fraction than histologic liver iron scores in patients with nonalcoholic fatty liver disease. J. Magn. Reson. Imaging 2019, 49, 1456–1466. [Google Scholar] [CrossRef]
- Bekri, S.; Gual, P.; Anty, R.; Luciani, N.; Dahman, M.; Ramesh, B.; Iannelli, A.; Staccini–Myx, A.; Casanova, D.; Ben Amor, I.; et al. Increased Adipose Tissue Expression of Hepcidin in Severe Obesity Is Independent from Diabetes and NASH. Gastroenterology 2006, 131, 788–796. [Google Scholar] [CrossRef]
- Jehn, M.; Clark, J.M.; Guallar, E. Serum Ferritin and Risk of the Metabolic Syndrome in U.S. Adults. Diabetes Care 2004, 27, 2422–2428. [Google Scholar] [CrossRef] [Green Version]
- Seeßle, J.; Gan-Schreier, H.; Kirchner, M.; Stremmel, W.; Chamulitrat, W.; Merle, U. Plasma Lipidome, PNPLA3 polymorphism and hepatic steatosis in hereditary hemochromatosis. BMC Gastroenterol. 2020, 20, 230. [Google Scholar] [CrossRef]
- Wilman, H.R.; Parisinos, C.A.; Atabaki-Pasdar, N.; Kelly, M.; Thomas, E.L.; Neubauer, S.; Mahajan, A.; Hingorani, A.D.; Patel, R.S.; Hemingway, H.; et al. Genetic studies of abdominal MRI data identify genes regulating hepcidin as major determinants of liver iron concentration. J. Hepatol. 2019, 71, 594–602. [Google Scholar] [CrossRef] [PubMed] [Green Version]
- Yuan, S.; Carter, P.; Vithayathil, M.; Kar, S.P.; Giovannucci, E.; Mason, A.M.; Burgess, S.; Larsson, S.C. Iron Status and Cancer Risk in UK Biobank: A Two-Sample Mendelian Randomization Study. Nutrients 2020, 12, 526. [Google Scholar] [CrossRef] [PubMed] [Green Version]
- Meidtner, K.; Podmore, C.; Kröger, J.; van der Schouw, Y.T.; Bendinelli, B.; Agnoli, C.; Arriola, L.; Barricarte, A.; Boeing, H.; Cross, A.J.; et al. Interaction of Dietary and Genetic Factors Influencing Body Iron Status and Risk of Type 2 Diabetes Within the EPIC-InterAct Study. Diabetes Care 2017, 41, 277–285. [Google Scholar] [CrossRef] [PubMed] [Green Version]
- Raffield, L.M.; Louie, T.; Sofer, T.; Jain, D.; Ipp, E.; Taylor, K.D.; Papanicolaou, G.J.; Aviles-Santa, M.L.; Lange, L.A.; Laurie, C.C.; et al. Genome-wide association study of iron traits and relation to diabetes in the Hispanic Community Health Study/Study of Latinos (HCHS/SOL): Potential genomic intersection of iron and glucose regulation? Hum. Mol. Genet. 2017, 26, 1966–1978. [Google Scholar] [CrossRef]
- De Tayrac, M.; Roth, M.-P.; Jouanolle, A.-M.; Coppin, H.; le Gac, G.; Piperno, A.; Férec, C.; Pelucchi, S.; Scotet, V.; Bardou-Jacquet, E.; et al. Genome-wide association study identifies TF as a significant modifier gene of iron metabolism in HFE hemochromatosis. J. Hepatol. 2015, 62, 664–672. [Google Scholar] [CrossRef]
- Pitchika, A.; Kühn, J.; Schipf, S.; Nauck, M.; Dörr, M.; Lerch, M.M.; Kromrey, M.; Felix, S.B.; Markus, M.R.P.; Rathmann, W.; et al. Hepatic steatosis and hepatic iron overload modify the association of iron markers with glucose metabolism disorders and metabolic syndrome. Liver Int. 2021, 41, 1841–1852. [Google Scholar] [CrossRef]
- Sharifi, F.; Nasab, N.M.; Zadeh, H.J. Elevated serum ferritin concentrations in prediabetic subjects. Diabetes Vasc. Dis. Res. 2008, 5, 15–18. [Google Scholar] [CrossRef] [PubMed] [Green Version]
- Fillebeen, C.; Lam, N.H.; Chow, S.; Botta, A.; Sweeney, G.; Pantopoulos, K. Regulatory Connections between Iron and Glucose Metabolism. Int. J. Mol. Sci. 2020, 21, 7773. [Google Scholar] [CrossRef]
- Simcox, J.A.; McClain, D.A. Iron and Diabetes Risk. Cell Metab. 2013, 17, 329–341. [Google Scholar] [CrossRef] [PubMed] [Green Version]
- Haap, M.; Machann, J.; Von Friedeburg, C.; Schick, F.; Stefan, N.; Schwenzer, N.F.; Fritsche, A.; Häring, H.U.; Thamer, C. Insulin Sensitivity and Liver Fat: Role of Iron Load. J. Clin. Endocrinol. Metab. 2011, 96, E958–E961. [Google Scholar] [CrossRef] [PubMed] [Green Version]
- Bayerl, C.; Lorbeer, R.; Heier, M.; Meisinger, C.; Rospleszcz, S.; Schafnitzel, A.; Patscheider, H.; Auweter, S.; Peters, A.; Ertl-Wagner, B.; et al. Alcohol consumption, but not smoking is associated with higher MR-derived liver fat in an asymptomatic study population. PLoS ONE 2018, 13, e0192448. [Google Scholar] [CrossRef] [PubMed] [Green Version]
- Whitfield, J.B.; Zhu, G.; Heath, A.C.; Powell, L.W.; Martin, N.G. Effects of alcohol consumption on indices of iron stores and of iron stores on alcohol intake markers. Alcohol. Clin. Exp. Res. 2001, 25, 1037–1045. [Google Scholar] [CrossRef]
- Bridle, K.R.; Cheung, T.-K.; Murphy, T.L.; Walters, M.M.; Anderson, G.J.; Crawford, D.H.G.; Fletcher, L.M. Hepcidin Is Down-regulated in Alcoholic Liver Injury: Implications for the Pathogenesis of Alcoholic Liver Disease. Alcohol. Clin. Exp. Res. 2006, 30, 106–112. [Google Scholar] [CrossRef]
- Li, X.; He, T.; Yu, K.; Lu, Q.; Alkasir, R.; Guo, G.; Xue, Y. Markers of Iron Status Are Associated with Risk of Hyperuricemia among Chinese Adults: Nationwide Population-Based Study. Nutrients 2018, 10, 191. [Google Scholar] [CrossRef] [Green Version]
- Mainous, A.G.; Knoll, M.E.; Everett, C.J.; Matheson, E.M.; Hulihan, M.M.; Grant, A.M. Uric Acid as a Potential Cue to Screen for Iron Overload. J. Am. Board Fam. Med. 2011, 24, 415–421. [Google Scholar] [CrossRef] [Green Version]
- Rospleszcz, S.; Dermyshi, D.; Müller-Peltzer, K.; Strauch, K.; Bamberg, F.; Peters, A. Association of serum uric acid with visceral, subcutaneous and hepatic fat quantified by magnetic resonance imaging. Sci. Rep. 2020, 10, 442. [Google Scholar] [CrossRef] [PubMed] [Green Version]
- Kim, B.J.; Kim, B.S.; Kang, J.H. The association between serum ferritin level, microalbuminuria and non-alcoholic fatty liver disease in non-diabetic, non-hypertensive men. Clin. Exp. Hypertens. 2013, 36, 380–385. [Google Scholar] [CrossRef]
- Małyszko, J.; Koc-Żórawska, E.; Levin-Iaina, N.; Małyszko, J.; Koźmiński, P.; Kobus, G.; Myśliwiec, M. New parameters in iron metabolism and functional iron deficiency in patients on maintenance hemodialysis. Pol. Arch. Intern. Med. Wewn 2012, 122, 537–542. [Google Scholar] [CrossRef] [Green Version]
- Pietrangelo, A.; Dierssen, U.; Valli, L.; Garuti, C.; Rump, A.; Corradini, E.; Ernst, M.; Klein, C.; Trautwein, C. STAT3 Is Required for IL-6-gp130–Dependent Activation of Hepcidin In Vivo. Gastroenterology 2007, 132, 294–300. [Google Scholar] [CrossRef]
- Muckenthaler, M.U.; Rivella, S.; Hentze, M.W.; Galy, B. A Red Carpet for Iron Metabolism. Cell 2017, 168, 344–361. [Google Scholar] [CrossRef] [Green Version]
- Cheong, J.-W.; Kim, H.-J.; Lee, K.-H.; Yoon, S.-S.; Lee, J.H.; Park, H.-S.; Kim, H.Y.; Shim, H.; Seong, C.-M.; Kim, C.S.; et al. Deferasirox improves hematologic and hepatic function with effective reduction of serum ferritin and liver iron concentration in transfusional iron overload patients with myelodysplastic syndrome or aplastic anemia. Transfusion 2013, 54, 1542–1551. [Google Scholar] [CrossRef] [PubMed]
- Chatterjee, R.; Yeh, H.-C.; Edelman, D.; Brancati, F. Potassium and risk of Type 2 diabetes. Expert Rev. Endocrinol. Metab. 2011, 6, 665–672. [Google Scholar] [CrossRef] [PubMed] [Green Version]
- Angeli, P.; Wong, F.; Watson, H.; Ginès, P. CAPPS Investigators Hyponatremia in cirrhosis: Results of a patient population survey. Hepatology 2006, 44, 1535–1542. [Google Scholar] [CrossRef] [PubMed]
- Mainous, A.G.; Weinberg, E.D.; Diaz, V.A.; Johnson, S.P.; Hulihan, M.M.; Grant, A.M. Calcium channel blocker use and serum ferritin in adults with hypertension. Biometals 2012, 25, 563–568. [Google Scholar] [CrossRef]
- Zhang, Y.; Zhao, X.; Chang, Y.; Zhang, Y.; Chu, X.; Zhang, X.; Liu, Z.; Guo, H.; Wang, N.; Gao, Y.; et al. Calcium channel blockers ameliorate iron overload-associated hepatic fibrosis by altering iron transport and stellate cell apoptosis. Toxicol. Appl. Pharmacol. 2016, 301, 50–60. [Google Scholar] [CrossRef]
- Holle, R.; Happich, M.; Löwel, H.; Wichmann, H.E. KORA—A Research Platform for Population Based Health Research. Das Gesundheitswesen 2005, 67, 19–25. [Google Scholar] [CrossRef] [Green Version]
- Bamberg, F.; Hetterich, H.; Rospleszcz, S.; Lorbeer, R.; Auweter, S.D.; Schlett, C.L.; Schafnitzel, A.; Bayerl, C.; Schindler, A.; Saam, T.; et al. Subclinical Disease Burden as Assessed by Whole-Body MRI in Subjects With Prediabetes, Subjects With Diabetes, and Normal Control Subjects From the General Population: The KORA-MRI Study. Diabetes 2016, 66, 158–169. [Google Scholar] [CrossRef] [PubMed] [Green Version]
- Hetterich, H.; Bayerl, C.; Peters, A.; Heier, M.; Linkohr, B.; Meisinger, C.; Auweter, S.; Kannengießer, S.A.R.; Kramer, H.; Ertl-Wagner, B.; et al. Feasibility of a three-step magnetic resonance imaging approach for the assessment of hepatic steatosis in an asymptomatic study population. Eur. Radiol. 2015, 26, 1895–1904. [Google Scholar] [CrossRef] [PubMed]
- Storz, C.; Heber, S.D.; Rospleszcz, S.; Machann, J.; Sellner, S.; Nikolaou, K.; Lorbeer, R.; Gatidis, S.; Elser, S.; Peters, A.; et al. The role of visceral and subcutaneous adipose tissue measurements and their ratio by magnetic resonance imaging in subjects with prediabetes, diabetes and healthy controls from a general population without cardiovascular disease. Br. J. Radiol. 2018, 91, 20170808. [Google Scholar] [CrossRef] [PubMed]
- Suhre, K.; Arnold, M.; Bhagwat, A.M.; Cotton, R.J.; Engelke, R.; Raffler, J.; Sarwath, H.; Thareja, G.; Wahl, A.; DeLisle, R.K.; et al. Connecting genetic risk to disease end points through the human blood plasma proteome. Nat. Commun. 2017, 8, 14357. [Google Scholar] [CrossRef] [PubMed] [Green Version]
- Schaapman, J.J.; Tushuizen, M.E.; Coenraad, M.J.; Lamb, H.J. Multiparametric MRI in Patients with Nonalcoholic Fatty Liver Disease. J. Magn. Reson. Imaging 2021, 53, 1623–1631. [Google Scholar] [CrossRef] [PubMed]
- Tibshirani, R. Regression Shrinkage and Selection Via the Lasso. J. R. Stat. Soc. Ser. B 1996, 58, 267–288. [Google Scholar] [CrossRef]
- De Bin, R.; Janitza, S.; Sauerbrei, W.; Boulesteix, A.-L. Subsampling versus bootstrapping in resampling-based model selection for multivariable regression. Biometrics 2016, 72, 272–280. [Google Scholar] [CrossRef] [PubMed] [Green Version]
- Rabel, M.; Meisinger, C.; Peters, A.; Holle, R.; Laxy, M. The longitudinal association between change in physical activity, weight, and health-related quality of life: Results from the population-based KORA S4/F4/FF4 cohort study. PLoS ONE 2017, 12, e0185205. [Google Scholar] [CrossRef] [Green Version]
- Teuner, C.M.; Menn, P.; Heier, M.; Holle, R.; John, J.; Wolfenstetter, S.B. Impact of BMI and BMI change on future drug expenditures in adults: Results from the MONICA/KORA cohort study. BMC Health Serv. Res. 2013, 13, 424. [Google Scholar] [CrossRef] [Green Version]
- McLaren, C.E.; Garner, C.P.; Constantine, C.C.; McLachlan, S.; Vulpe, C.D.; Snively, B.M.; Gordeuk, V.R.; Nickerson, D.A.; Cook, J.D.; Leiendecker-Foster, C.; et al. Genome-Wide Association Study Identifies Genetic Loci Associated with Iron Deficiency. PLoS ONE 2011, 6, e17390. [Google Scholar] [CrossRef]
- Liao, M.; Shi, J.; Huang, L.; Gao, Y.; Tan, A.; Wu, C.; Lü, Z.; Yang, X.; Zhang, S.; Hu, Y.; et al. Genome-Wide Association Study Identifies Variants in PMS1 Associated with Serum Ferritin in a Chinese Population. PLoS ONE 2014, 9, e105844. [Google Scholar] [CrossRef] [PubMed]
- He, M.; Workalemahu, T.; Manson, J.E.; Hu, F.B.; Qi, L. Genetic Determinants for Body Iron Store and Type 2 Diabetes Risk in US Men and Women. PLoS ONE 2012, 7, e40919. [Google Scholar] [CrossRef] [Green Version]
- Traglia, M.; Girelli, D.; Biino, G.; Campostrini, N.; Corbella, M.; Sala, C.; Masciullo, C.; Viganò, F.; Buetti, I.; Pistis, G.; et al. Association of HFE and TMPRSS6 genetic variants with iron and erythrocyte parameters is only in part dependent on serum hepcidin concentrations. J. Med. Genet. 2011, 48, 629–634. [Google Scholar] [CrossRef]
- Oexle, K.; Ried, J.S.; Hicks, A.A.; Tanaka, T.; Hayward, C.; Bruegel, M.; Gögele, M.; Lichtner, P.; Müller-Myhsok, B.; Döring, A.; et al. Novel association to the proprotein convertase PCSK7 gene locus revealed by analysing soluble transferrin receptor (sTfR) levels. Hum. Mol. Genet. 2010, 20, 1042–1047. [Google Scholar] [CrossRef]
- Nai, A.; Pagani, A.; Silvestri, L.; Campostrini, N.; Corbella, M.; Girelli, M.; Traglia, M.; Toniolo, D.; Camaschella, C. TMPRSS6 rs855791 modulates hepcidin transcription in vitro and serum hepcidin levels in normal individuals. Blood 2011, 118, 4459–4462. [Google Scholar] [CrossRef] [Green Version]
- Gichohi-Wainaina, W.N.; Towers, G.W.; Swinkels, R.W.; Zimmermann, M.B.; Feskens, E.J.; Melse-Boonstra, A. Inter-ethnic differences in genetic variants within the transmembrane protease, serine 6 (TMPRSS6) gene associated with iron status indicators: A systematic review with meta-analyses. Genes Nutr. 2014, 10, 442. [Google Scholar] [CrossRef] [PubMed] [Green Version]
- McLaren, C.E.; McLachlan, S.; Garner, C.P.; Vulpe, C.; Gordeuk, V.R.; Eckfeldt, J.H.; Adams, P.C.; Acton, R.T.; Murray, J.; Leiendecker-Foster, C.; et al. Associations between Single Nucleotide Polymorphisms in Iron-Related Genes and Iron Status in Multiethnic Populations. PLoS ONE 2012, 7, e38339. [Google Scholar] [CrossRef] [Green Version]
- Hotta, K.; Yoneda, M.; Hyogo, H.; Ochi, H.; Mizusawa, S.; Ueno, T.; Chayama, K.; Nakajima, A.; Nakao, K.; Sekine, A. Association of the rs738409 polymorphism in PNPLA3 with liver damage and the development of nonalcoholic fatty liver disease. BMC Med. Genet. 2010, 11, 172. [Google Scholar] [CrossRef] [PubMed] [Green Version]
- Kohse, K.P. Taschenlehrbuch Klinische Chemie und Hämatologie, 9th ed.; Thieme: Stuttgart, Germany, 2019. [Google Scholar]
- Hahn, J.M. Checkliste Innere Medizin, 5th ed.; Thieme: Stuttgart, Germany, 2007. [Google Scholar]
- Arbeitsgemeinschaft der Wissenschaftlichen Medizinischen Fachgesellschaften (AWMF)- Ständige Kommission Leitlinien. AWMF-Regelwerk “Nationale Versorgungsleitlinie Typ-2-Diabetes”. Available online: https://dev.leitlinien.de/themen/diabetes/archiv/pdf/diabetes-fusskomplikationen/dm2-fuss-kurz-2-0.pdf (accessed on 12 August 2020).
- Levey, A.S.; Stevens, L.A.; Schmid, C.H.; Zhang, Y.L.; Castro, A.F., 3rd; Feldman, H.I.; Kusek, J.W.; Eggers, P.; Van Lente, F.; Greene, T.; et al. A New Equation to Estimate Glomerular Filtration Rate. Ann. Intern. Med. 2009, 150, 604–612. [Google Scholar] [CrossRef]
- Charité. Albumin. Available online: https://www.charite.de/fileadmin/user_upload/microsites/m_cc05/ilp/referenzdb/28820.htm (accessed on 13 June 2021).
- Charité. Kreatinin. Available online: https://www.charite.de/fileadmin/user_upload/microsites/m_cc05/ilp/referenzdb/30738.htm (accessed on 13 June 2021).
- Robert-Koch-Institut. Wie Wird der Vitamin-D-Status Bestimmt und Beurteilt? Available online: https://www.rki.de/SharedDocs/FAQ/Vitamin_D/FAQ07.html (accessed on 13 June 2021).
- Berlin, I. Troponin T High Sensitive (TroponinThs). Available online: https://www.imd-berlin.de/fachinformationen/diagnostikinformationen/troponin-t-high-sensitive-troponinths (accessed on 13 June 2021).


| Men (N = 206) | Women (N = 147) | Total (N = 353) | p-Value a | |
|---|---|---|---|---|
| Age (years) | 56.0 ± 9.3 | 56.1 ± 9.0 | 56.0 ± 9.1 | 0.928 |
| Body Composition | ||||
| Body weight (kg) | 89.2 ± 13.4 | 72.4 ± 14.1 | 82.2 ± 16.0 | <0.001 |
| Height (cm) | 178.01 ± 6.66 | 163.68 ± 6.58 | 172.04 ± 9.68 | <0.001 |
| BMI (kg/m2) | 28.2 ± 4.1 | 27.1 ± 5.2 | 27.7 ± 4.7 | 0.026 |
| Waist circumference (cm) | 102.7 ± 11.6 | 90.5 ± 13.4 | 97.6 ± 13.7 | <0.001 |
| Hip circumference (cm) | 106.5 ± 7.1 | 105.9 ± 10.0 | 106.3 ± 8.5 | 0.483 |
| Subcutaneous fat (L) | 7.36 ± 3.23 | 8.72 ± 3.90 | 7.93 ± 3.58 | <0.001 |
| Visceral fat (L) | 5.56 ± 2.56 | 2.79 ± 1.97 | 4.41 ± 2.70 | <0.001 |
| Total fat (L) | 12.92 ± 5.26 | 11.51 ± 5.43 | 12.34 ± 5.37 | 0.015 |
| Blood Lipids | ||||
| Total cholesterol (mg/dL) | 217.5 ± 38.1 | 218.9 ± 34.7 | 218.1 ± 36.7 | 0.728 |
| HDL-C (mg/dL) | 55.7 ± 14.8 | 71.1 ± 17.7 | 62.1 ± 17.7 | <0.001 |
| LDL-C (mg/dL) | 142.2 ± 33.9 | 136.3 ± 32.2 | 139.7 ± 33.3 | 0.103 |
| TG (mg/dL) | 123.0 (100.5) | 89.4 (51.0) | 105.0 (76.9) | <0.001 |
| Markers of Glucose Metabolism | ||||
| Fasting glucose (mg/dL) | 106.9 ± 23.5 | 98.1 ± 16.5 | 103.2 ± 21.3 | <0.001 |
| Fasting insulin (mU/mL) | 11.8 (7.8) | 9.3 (5.4) | 8.8 (7.4) | <0.001 |
| HbA1c (%) | 5.56 ± 0.83 | 5.51 ± 0.49 | 5.54 ± 0.71 | 0.540 |
| 2 h insulin (µU/mL) | 46.0 (70.5) b | 42.0 (39.5) c | 44.0 (51.8) d | 0.412 |
| 2 h glucose (mg/dL) | 117.4 ± 44.5 b | 104.0 ± 32.9 c | 111.6 ± 40.4 d | 0.003 |
| Diabetes status | 0.002 | |||
| Diabetes | 16.0% (33) | 6.8% (10) | 12.2% (43) | |
| Prediabetes | 26.7% (55) | 19.0% (28) | 23.5% (83) | |
| Normoglycemic | 57.3% (118) | 74.1% (109) | 64.3% (227) | |
| Markers of Renal Function | ||||
| Glomerular filtration rate (mL/min/1.73 m2) | 93.6 ± 16.7 | 91.2 ± 16.9 | 92.6 ± 16.8 | 0.195 |
| Uric acid (mg/dL) | 6.33 ± 1.32 | 4.57 ± 1.11 | 5.60 ± 1.51 | <0.001 |
| Creatinine (mg(dL) | 0.96 ± 0.13 | 0.77 ± 0.12 | 0.88 ± 0.16 | 0.001 |
| Albumin (g/dL) | 4.41 ± 0.29 | 4.28 ± 0.27 | 4.35 ± 0.29 | <0.001 |
| Cystatin C (mg/L) | 0.89 ± 0.14 | 0.85 ± 0.17 | 0.88 ± 0.16 | 0.029 |
| Urine albumin (mg/L) | 6.48 (10.52) | 6.22 (8.47) | 6.32 (8.85) | 0.431 |
| Urine creatinine (g/L) | 1.75 ± 0.74 | 1.39 ± 0.82 | 1.60 ± 0.79 | <0.001 |
| Complete Blood Count | ||||
| Hematocrit (L/L) | 0.43 ± 0.03 | 0.39 ± 0.03 | 0.42 ± 0.03 | <0.001 |
| Thrombocytes (/nL) | 221.1 ± 51.6 | 244.5 ± 52.2 | 230.9 ± 53.1 | <0.001 |
| Erythrocytes (/pL) | 4.87 ± 0.37 | 4.45 ± 0.37 | 4.70 ± 0.40 | <0.001 |
| Leucocytes (/nL) | 5.61 (1.93) | 5.66 (1.98) | 5.65 (1.91) | 0.576 |
| Hemoglobin (g/L) | 150.4 ± 10.1 | 134.8 ± 9.8 | 143.9 ± 12.6 | <0.001 |
| Electrolyte Panel | ||||
| Potassium (mmol/L) | 4.32 ± 0.31 | 4.22 ± 0.22 | 4.28 ± 0.28 | 0.001 |
| Sodium (mmol/L) | 139.0 (4.0) | 139.0 (3.5) | 139.0 (4.0) | 0.448 |
| Magnesium (mmol/L) | 0.85 ± 0.08 | 0.87 ± 0.08 | 0.86 ± 0.07 | 0.062 |
| Phosphate (mmol/L) | 0.98 ± 0.13 | 1.12 ± 0.14 | 1.04 ± 0.15 | <0.001 |
| Blood Pressure Parameters | ||||
| SBP (mmHg) | 125.5 ± 16.0 | 113.0 ± 14.9 | 120.3 ± 16.4 | <0.001 |
| DBP (mmHg) | 77.6 ± 10.3 | 71.8 ± 8.2 | 75.3 ± 9.9 | <0.001 |
| Hypertension | 37.4% (77) | 25.9% (38) | 32.6% (115) | 0.025 |
| Liver Parameters | ||||
| GGT (U/L) | 35.3 (33.9) | 19.6 (17.5) | 27.0 (28.0) | <0.001 |
| AST (U/L) | 24.5 (9.0) | 20.0 (8.0) | 23.0 (9.0) | <0.001 |
| ALT (U/L) | 31.0 (15.8) | 21.00 (12.0) | 27.0 (17.0) | <0.001 |
| Hepatic iron (s−1) | 41.8 ± 4.7 | 39.2 ± 4.1 | 40.7 ± 4.6 | <0.001 |
| Right liver lobe (s−1) | 42.4 ± 5.4 | 39.7 ± 4.3 | 41.3 ± 5.2 | <0.001 |
| Left liver lobe (s−1) | 41.1 ± 5.4 | 38.7 ± 4.7 | 40.1 ± 5.2 | <0.001 |
| Hepatic fat fraction (%) | 7.02 (10.08) | 3.53 (4.28) | 5.38 (7.92) | <0.001 |
| Right liver lobe (%) | 7.78 (9.99) | 3.96 (4.72) | 6.10 (8.99) | <0.001 |
| Left liver lobe (%) | 6.39 (10.62) | 3.16 (4.34) | 4.53 (7.63) | <0.001 |
| Further Laboratory Values | ||||
| Alkaline phosphatase (U/L) | 65.9 ± 17.9 | 67.6 ± 23.6 | 66.6 ± 20.5 | 0.448 |
| CRP (mg/L) | 1.09 (1.70) | 1.26 (2.00) | 1.12 (1.78) | 0.349 |
| Vitamin D (ng/mL) | 24.3 ± 11.8 | 22.2 ± 11.3 | 23.4 ± 11.6 | 0.094 |
| Troponin T (pg/mL) | 3.55 (5.20) | 1.50 (0.77) | 1.50 (3.82) | <0.001 |
| Behavioral Risk Factors | ||||
| Alcohol consumption (g/day) | 20.1 (36.5) | 3.1 (12.8) | 8.6 (25.9) | <0.001 |
| Smoking status | 0.243 | |||
| Smoker | 19.9% (41) | 22.4% (33) | 21.0% (74) | |
| Ex-smoker | 46.1% (95) | 35.4% (52) | 41.6% (147) | |
| Never-smoker | 34.0% (70) | 42.2% (62) | 37.4% (132) | |
| Pack years | 17.8 (28.7) e | 10.9 (17.0) f | 15.2 (23.2) g | <0.001 |
| Physical activity | 0.046 | |||
| Active | 55.3% (114) | 66.0% (97) | 59.8% (211) | |
| Inactive | 44.% (92) | 34.0% (50) | 40.2% (142) | |
| Medication Intake | ||||
| Beta blockers | 11.7% (24) | 11.6% (17) | 11.6% (41) | 1.000 |
| ACE inhibitors | 8.7% (18) | 13.6% (20) | 10.8% (38) | 0.169 |
| Calcium antagonists | 6.8% (14) | 7.5% (11) | 7.1% (25) | 0.822 |
| Diuretics | 11.7% (24) | 13.6% (20) | 12.5% (44) | 0.620 |
| Antihypertensives | 23.3% (48) | 25.2% (37) | 24.1% (85) | 0.709 |
| Lipid-lowering agents | 10.2% (21) | 10.2% (15) | 10.2% (36) | 1.000 |
| Treatment of hyperuricemia | 4.4% (9) | 0% (0) | 2.5% (9) | 0.012 |
| Adjustment | β | 95% CI | p-Value | Adjusted R2 | |
|---|---|---|---|---|---|
| Blood Lipids | |||||
| (log) trigylcerides (mg/dL) | Age + HFF | 0.25 | −0.94; 1.44 | 0.68 | 0.08 |
| Age | 1.11 | −0.01; 2.22 | 0.05 | 0.03 | |
| Markers of Glucose Metabolism | |||||
| (log) fasting insulin (mU/mL) | Age + HFF | −0.42 | −1.73; 0.9 | 0.53 | 0.08 |
| Age | 0.97 | −0.14; 2.07 | 0.09 | 0.02 | |
| HbA1c (%) | Age + HFF | −1.44 | −2.17; −0.71 | 0.00 | 0.14 |
| Age | −1.11 | −1.87; −0.36 | 0.00 | 0.05 | |
| Prediabetes | Age + HFF | 0.92 | −0.67; 2.5 | 0.25 | 0.11 |
| Age | 2.13 | 0.64; 3.63 | 0.01 | 0.05 | |
| Markers of Renal Function | |||||
| Uric acid (mg/dL) | Age + HFF | 0.23 | −0.27; 0.72 | 0.37 | 0.08 |
| Age | 0.49 | 0.01; 0.97 | 0.05 | 0.03 | |
| (log) urine albumin (mg/L) | Age + HFF | −0.80 | −1.29; −0.31 | 0.00 | 0.12 |
| Age | −0.69 | −1.2; −0.19 | 0.01 | 0.04 | |
| Complete Blood Count | |||||
| Thrombocytes (/nL) | Age + HFF | −0.01 | −0.02; 0.01 | 0.38 | 0.08 |
| Age | −0.01 | −0.02; 0 | 0.20 | 0.02 | |
| Erythrocytes (/pL) | Age + HFF | −1.35 | −3.05; 0.35 | 0.12 | 0.09 |
| Age | −1.03 | −2.79; 0.73 | 0.25 | 0.02 | |
| Blood Pressure | |||||
| Systolic blood pressure (mmHg) | Age + HFF | 0.01 | −0.03; 0.06 | 0.48 | 0.08 |
| Age | 0.04 | 0; 0.08 | 0.05 | 0.03 | |
| Diastolic blood pressure (mmHg) | Age + HFF | 0.04 | −0.02; 0.11 | 0.17 | 0.09 |
| Age | 0.08 | 0.02; 0.14 | 0.01 | 0.04 | |
| Liver Parameters | |||||
| (log) hepatic fat fraction (%) | Age | 1.46 | 0.74; 2.19 | 0.00 | 0.08 |
| Behavioral Risk Factors | |||||
| Alcohol consumption (g/day) | Age + HFF | 0.02 | 0; 0.05 | 0.04 | 0.10 |
| Age | 0.03 | 0.01; 0.05 | 0.01 | 0.04 | |
| Medication Intake | |||||
| ACE inhibitors | Age + HFF | −3.61 | −5.79; −1.43 | 0.00 | 0.12 |
| Age | −2.78 | −5.03; −0.53 | 0.02 | 0.04 | |
| Diuretics | Age + HFF | −2.50 | −4.44; −0.56 | 0.01 | 0.11 |
| Age | −1.97 | −3.97; 0.04 | 0.05 | 0.03 | |
| Genetic Analyses (N = 195) | |||||
| Genetic risk score, continuous | Age + HFF | 0.64 | 0.16; 1.12 | 0.01 | 0.12 |
| Adjustment | β | 95% CI | p-Value | Adjusted R2 | |
|---|---|---|---|---|---|
| Body Composition | |||||
| Height (cm) | Age + HFF | −0.04 | −0.13; 0.05 | 0.40 | 0.36 |
| Age | −0.05 | −0.15; 0.05 | 0.29 | 0.21 | |
| Visceral fat (L) | Age + HFF | 0.01 | −0.12; 0.14 | 0.91 | 0.35 |
| Age | 0.81 | 0.5; 1.13 | 0.00 | 0.33 | |
| Blood Lipid Markers | |||||
| (log) trigylcerides (mg/dL) | Age + HFF | −0.20 | −1.8; 1.4 | 0.81 | 0.35 |
| Age | 1.70 | 0.14; 3.26 | 0.03 | 0.23 | |
| Markers of Glucose Metabolism | |||||
| Fasting glucose (mg/dL) | Age + HFF | 0.01 | −0.02; 0.05 | 0.47 | 0.36 |
| Age | 0.05 | 0.01; 0.09 | 0.01 | 0.24 | |
| Markers of Renal Function | |||||
| Urine creatinine (g/L) | Age + HFF | −0.47 | −1.14; 0.21 | 0.17 | 0.36 |
| Age | −0.14 | −0.89; 0.6 | 0.70 | 0.21 | |
| Complete Blood Count | |||||
| Thrombocytes (/nL) | Age + HFF | 0.01 | −0.01; 0.02 | 0.34 | 0.36 |
| Age | 0.00 | −0.01; 0.01 | 0.71 | 0.21 | |
| Erythrocytes (/pL) | Age + HFF | −1.24 | −3.02; 0.55 | 0.17 | 0.36 |
| Age | −0.91 | −2.9; 1.07 | 0.36 | 0.21 | |
| Electrolyte Panel | |||||
| Potassium (mmol/L) | Age + HFF | −2.74 | −5.13; −0.34 | 0.03 | 0.38 |
| Age | −2.44 | −5.11; 0.22 | 0.07 | 0.22 | |
| (log) sodium (mmol/L) | Age + HFF | −19.63 | −45.67; 6.4 | 0.14 | 0.36 |
| Age | −40.47 | −67.31; −13.63 | 0.00 | 0.25 | |
| Phosphate (mmol/L) | Age + HFF | 2.62 | −1.51; 6.76 | 0.21 | 0.36 |
| Age | 0.61 | −3.94; 5.15 | 0.79 | 0.21 | |
| Liver Parameters | |||||
| (log) hepatic fat fraction (%) | Age | 2.08 | 1.38; 2.79 | 0.00 | 0.36 |
| Further Laboratory Values | |||||
| Vitamin D (ng/mL) | Age + HFF | −0.02 | −0.07; 0.03 | 0.46 | 0.36 |
| Age | −0.04 | −0.1; 0.01 | 0.10 | 0.22 | |
| Behavioral Risk Factors | |||||
| Alcohol consumption (g/day) | Age + HFF | 0.05 | 0.02; 0.09 | 0.00 | 0.39 |
| Age | 0.07 | 0.03; 0.11 | 0.00 | 0.26 | |
| Medication Intake | |||||
| Beta blockers | Age + HFF | 0.31 | −1.53; 2.15 | 0.74 | 0.35 |
| Age | 1.69 | −0.26; 3.63 | 0.09 | 0.22 | |
| Calcium antagonists | Age + HFF | −2.24 | −4.29; −0.19 | 0.03 | 0.37 |
| Age | −2.35 | −4.63; −0.07 | 0.04 | 0.23 | |
| Lipid-lowering agents | Age + HFF | 1.19 | −0.67; 3.06 | 0.21 | 0.36 |
| Age | 1.89 | −0.14; 3.93 | 0.07 | 0.22 | |
| Genetic Analyses (N = 132) | |||||
| Genetic risk score, continuous | Age + HFF | 0.65 | 0.16; 1.14 | 0.01 | 0.39 |
Publisher’s Note: MDPI stays neutral with regard to jurisdictional claims in published maps and institutional affiliations. |
© 2021 by the authors. Licensee MDPI, Basel, Switzerland. This article is an open access article distributed under the terms and conditions of the Creative Commons Attribution (CC BY) license (https://creativecommons.org/licenses/by/4.0/).
Share and Cite
Maier, L.; von Krüchten, R.; Lorbeer, R.; Filler, J.; Nattenmüller, J.; Thorand, B.; Koenig, W.; Rathmann, W.; Bamberg, F.; Schlett, C.L.; et al. Distribution and Associated Factors of Hepatic Iron—A Population-Based Imaging Study. Metabolites 2021, 11, 871. https://0-doi-org.brum.beds.ac.uk/10.3390/metabo11120871
Maier L, von Krüchten R, Lorbeer R, Filler J, Nattenmüller J, Thorand B, Koenig W, Rathmann W, Bamberg F, Schlett CL, et al. Distribution and Associated Factors of Hepatic Iron—A Population-Based Imaging Study. Metabolites. 2021; 11(12):871. https://0-doi-org.brum.beds.ac.uk/10.3390/metabo11120871
Chicago/Turabian StyleMaier, Lisa, Ricarda von Krüchten, Roberto Lorbeer, Jule Filler, Johanna Nattenmüller, Barbara Thorand, Wolfgang Koenig, Wolfgang Rathmann, Fabian Bamberg, Christopher L. Schlett, and et al. 2021. "Distribution and Associated Factors of Hepatic Iron—A Population-Based Imaging Study" Metabolites 11, no. 12: 871. https://0-doi-org.brum.beds.ac.uk/10.3390/metabo11120871