
1H-Nuclear Magnetic Resonance Analysis of Urine as Diagnostic Tool for Organic Acidemias and Aminoacidopathies

 , , , and
Abstract
:1. Introduction
2. Results
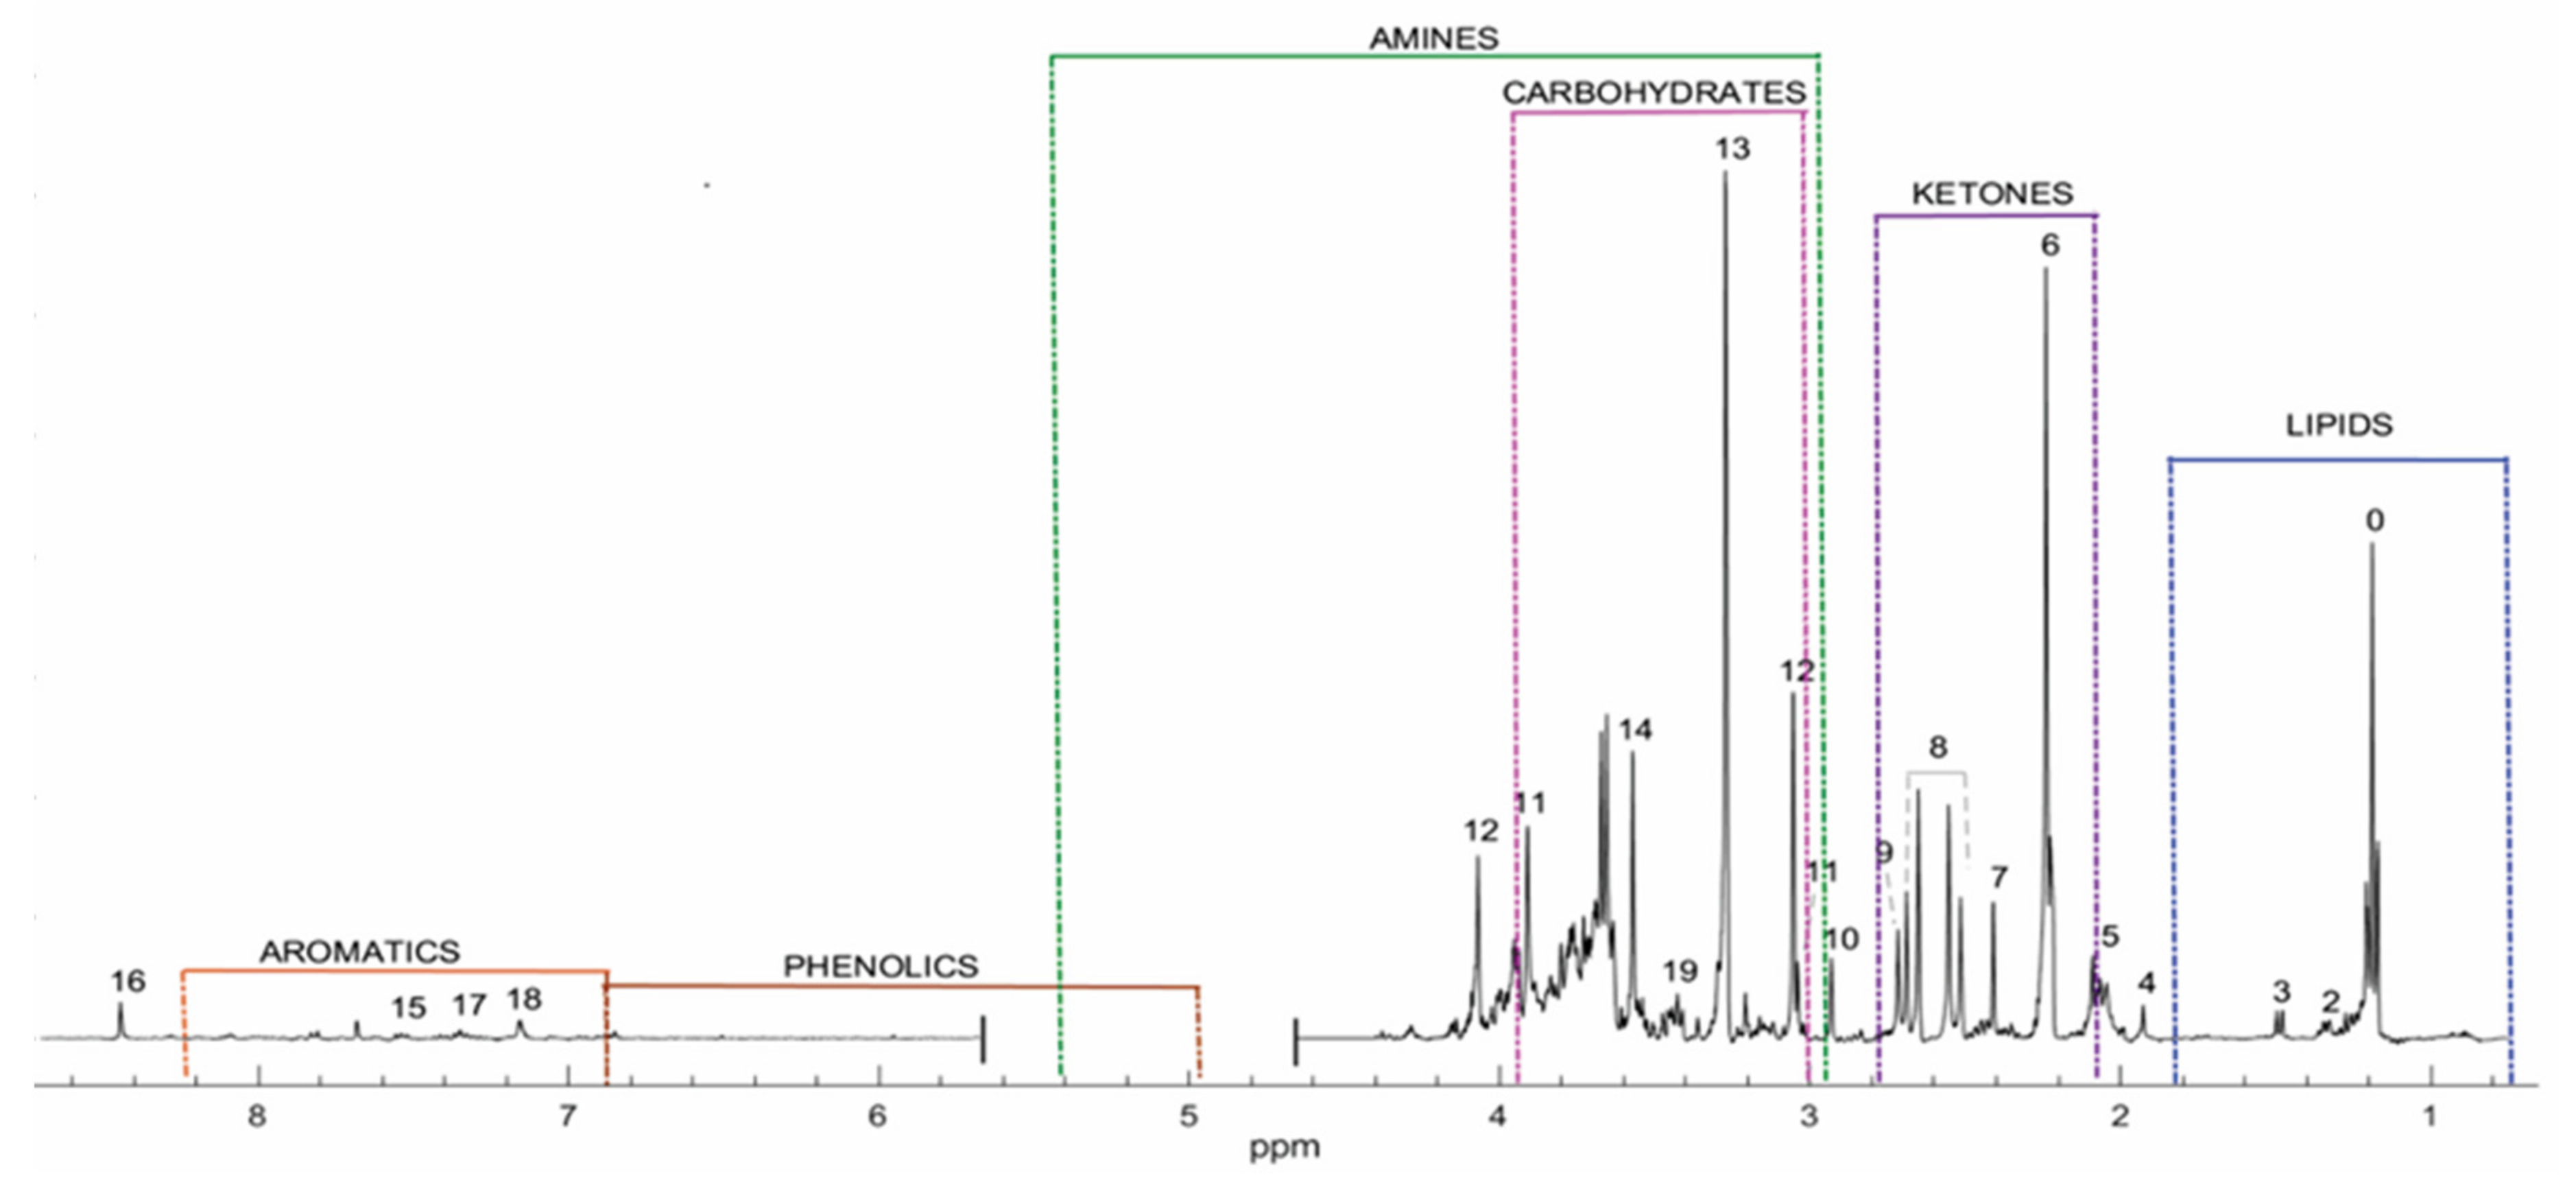
2.1. Profile for Healthy Population
2.2. smIEM Profiles
2.3. Propionic Acidemia
2.4. Isovaleric Acidemia
2.5. 3-Methylglutaconic Acidemia
2.6. Glutaric Acidemia Type I
2.7. Medium Chain Acyl-CoA Dehydrogenase Deficiency
2.8. Lactic Aciduria
2.9. Maple Syrup Urine Disease (MSUD)
2.10. Phenylalanine Metabolism Disorders
2.11. Holocarboxylase Synthetase Deficiency
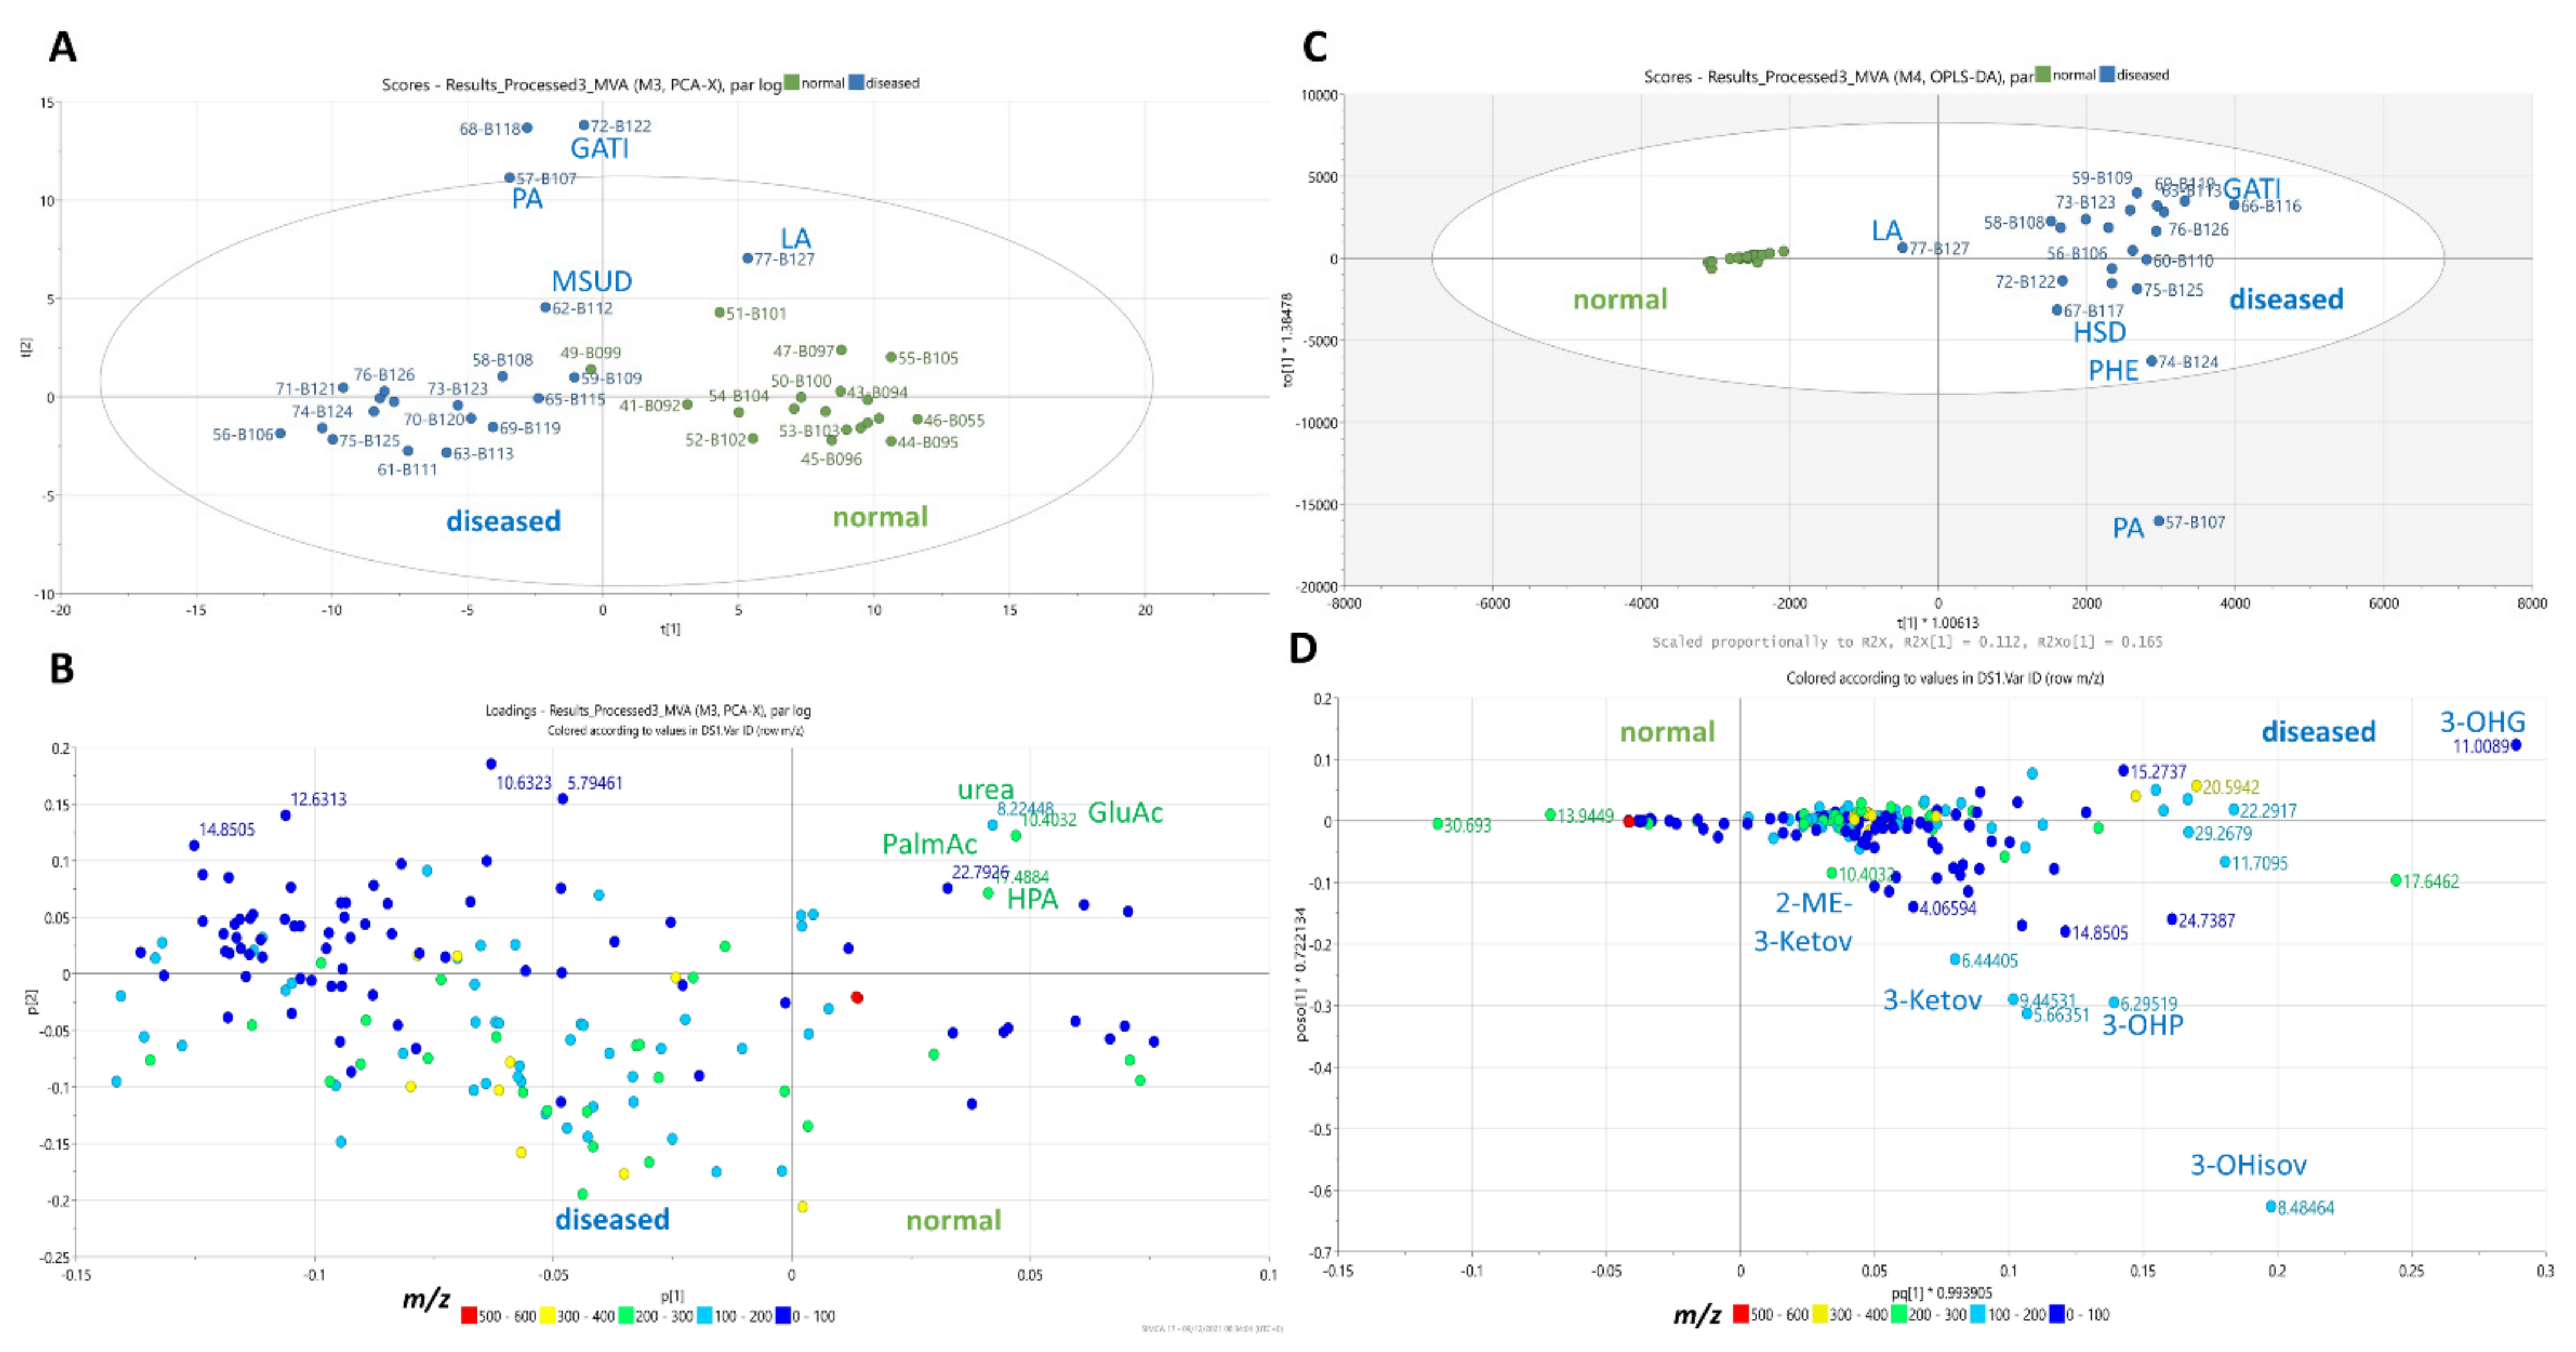
2.12. Multivariate Statistical Analysis (MVA)
3. Discussion
4. Materials and Methods
4.1. Subjects
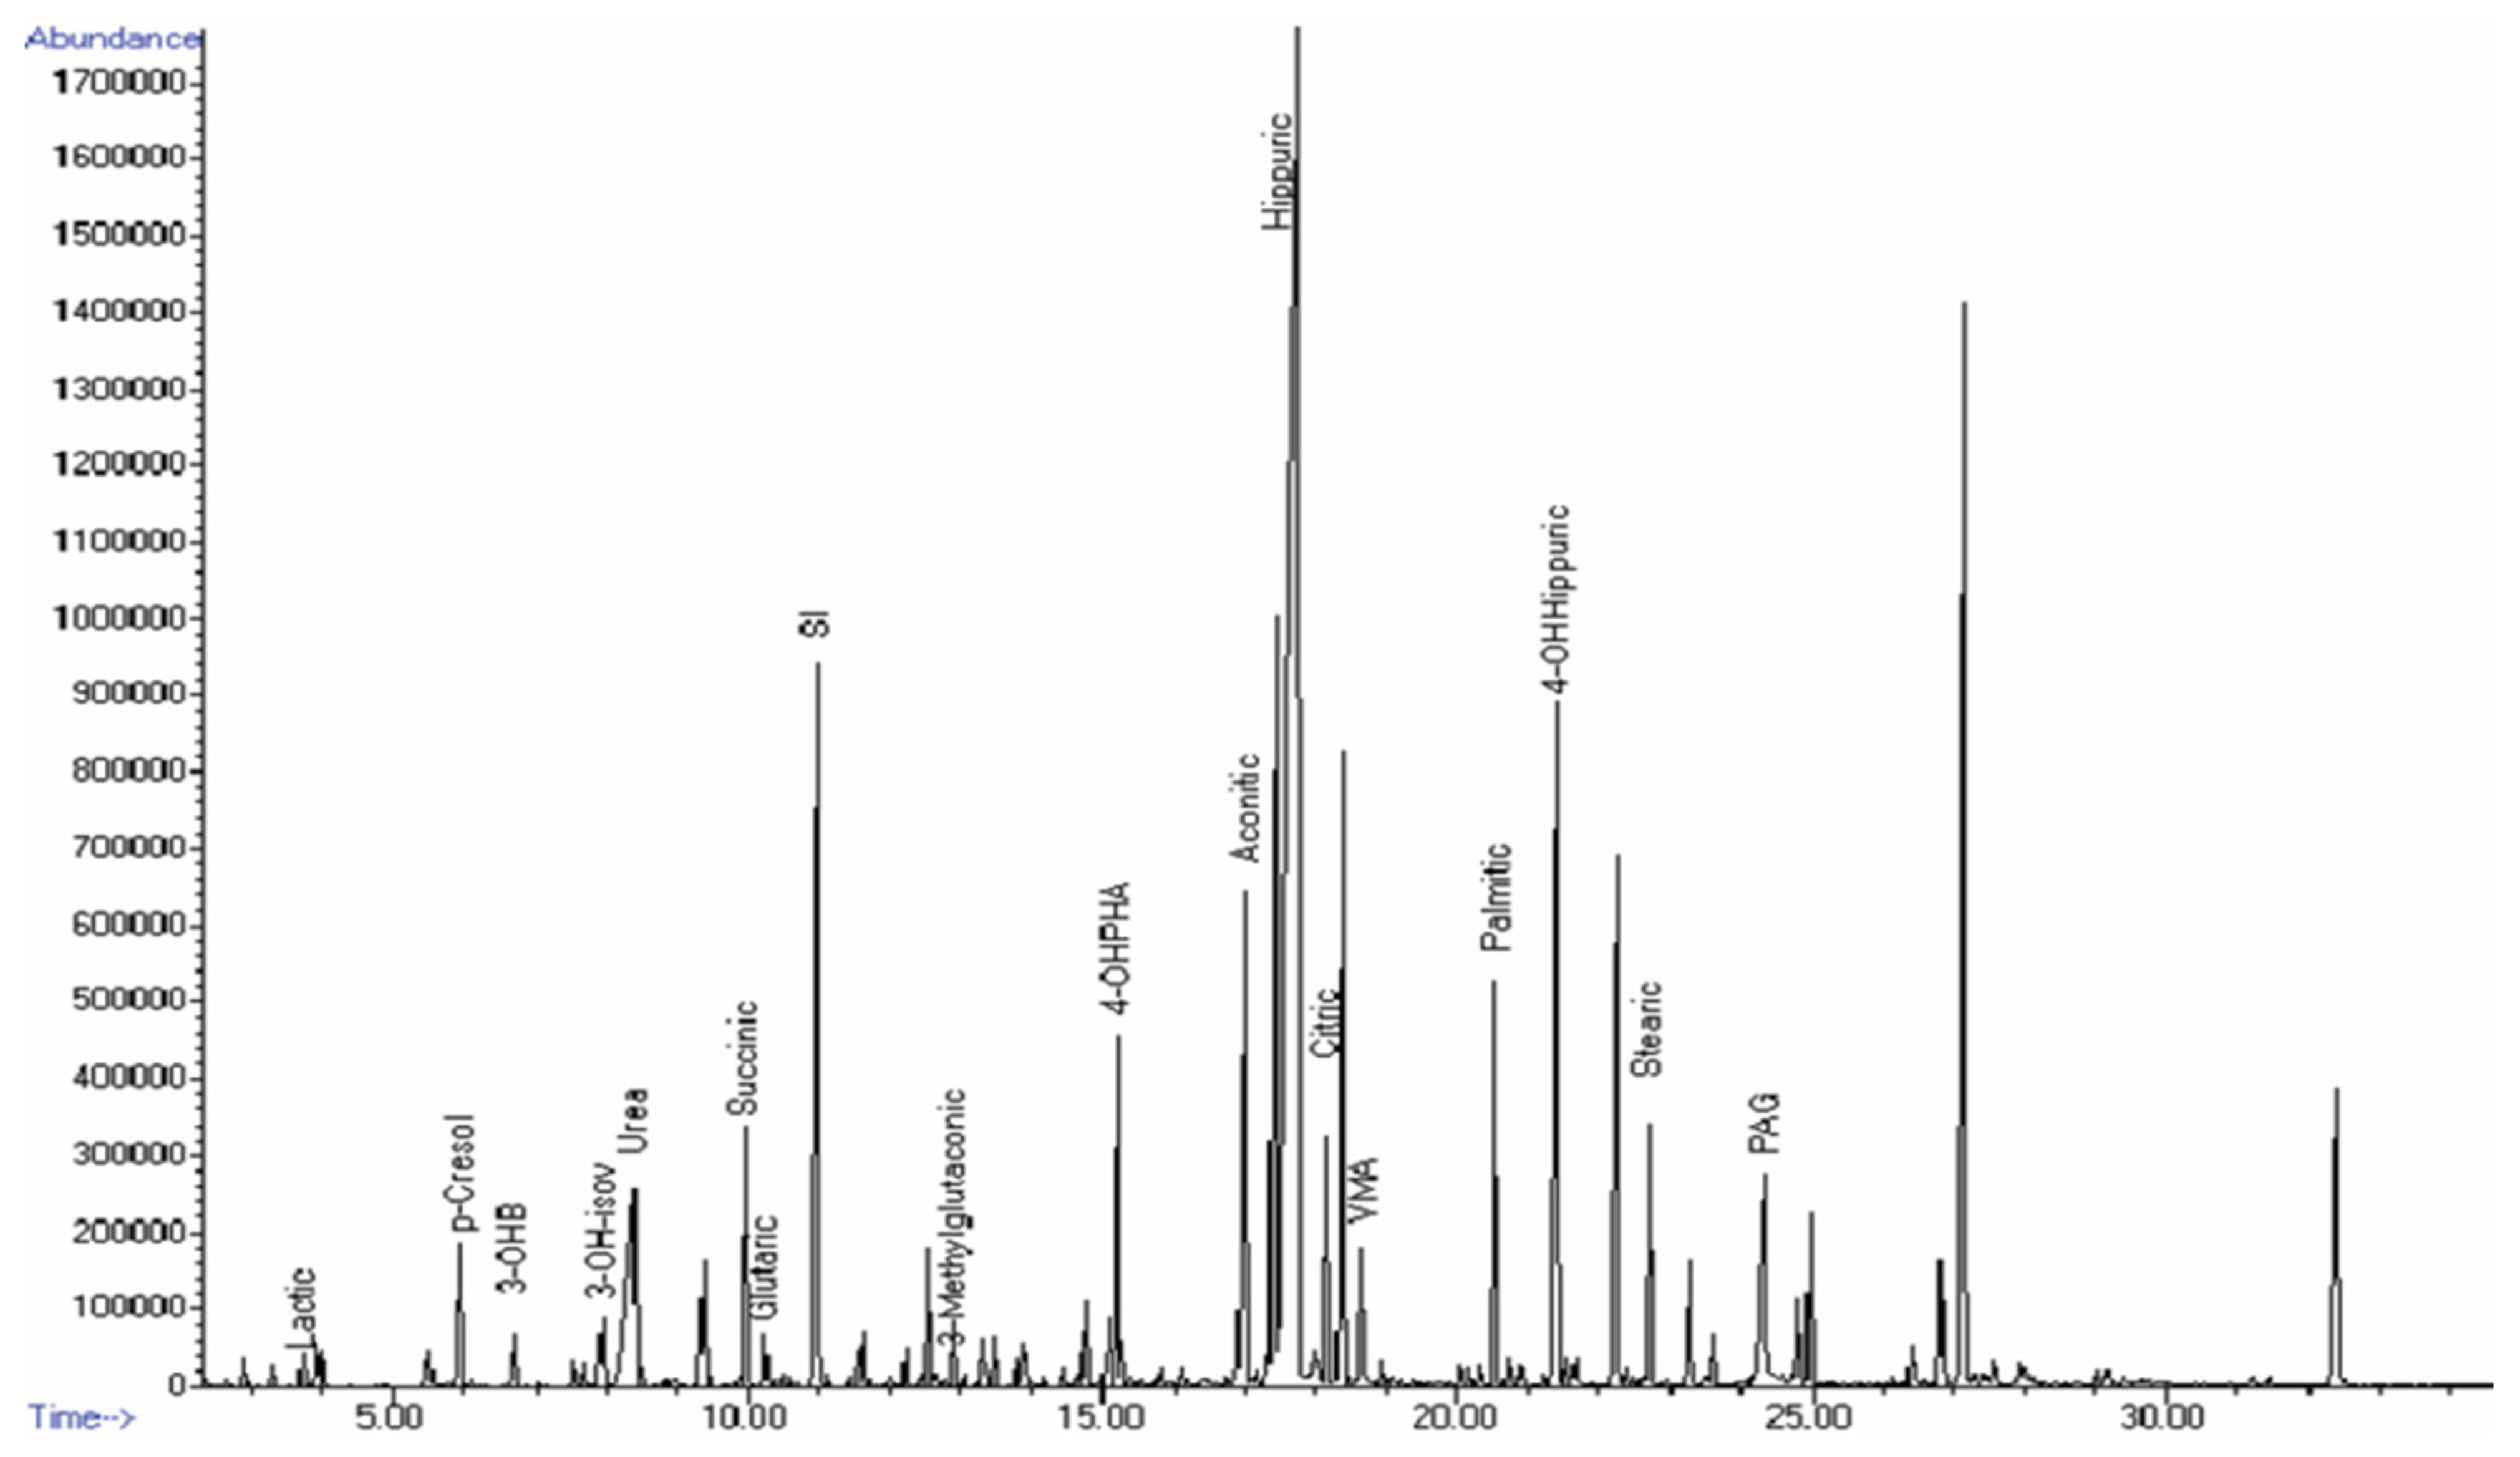
4.2. GC–MS
4.3. GC–MS Data Analysis
4.4. 1H-NMR Sample Preparation
4.5. 1H-NMR Data Acquisition and Processing
4.6. Qualitative Profile Identification
4.7. Multivariate Analysis (MVA)
5. Conclusions
Supplementary Materials
Author Contributions
Funding
Institutional Review Board Statement
Informed Consent Statement
Data Availability Statement
Conflicts of Interest
References
- Ferreira, C.R.; van Karnebeek, C.D.; Vockley, J.; Blau, N. A proposed nosology of inborn errors of metabolism. Genet. Med. 2019, 21, 102–106. [Google Scholar] [CrossRef] [Green Version]
- Morava, E.; Rahman, S.; Peters, V.; Baumgartner, M.R.; Patterson, M.; Zschocke, J. Quo Vadis: The Re-Definition of “Inborn Metabolic Diseases”; Springer: Berlin/Heidelberg, Germany, 2015; Volume 38, pp. 1003–1006. [Google Scholar]
- Saudubray, J.M.; Mochel, F.; Lamari, F.; Garcia-Cazorla, A. Proposal for a simplified classification of IMD based on a pathophysiological approach: A practical guide for clinicians. J. Inherit. Metab. Dis. 2019, 42, 706–727. [Google Scholar] [CrossRef]
- Saudubray, J.M.; Sedel, F.; Walter, J. Clinical approach to treatable inborn metabolic diseases: An introduction. J. Inherit. Metab. Dis. 2006, 29, 261–274. [Google Scholar] [CrossRef]
- Guerrero, R.B.; Salazar, D.; Tanpaiboon, P. Laboratory diagnostic approaches in metabolic disorders. Ann. Transl. Med. 2018, 6, 470. [Google Scholar] [CrossRef]
- Phipps, W.S.; Jones, P.M.; Patel, K. Amino and organic acid analysis: Essential tools in the diagnosis of inborn errors of metabolism. Adv. Clin. Chem. 2019, 92, 59–103. [Google Scholar]
- Vernon, H.J. Inborn errors of metabolism: Advances in diagnosis and therapy. JAMA Pediatr. 2015, 169, 778–782. [Google Scholar] [CrossRef]
- Gebregiworgis, T.; Powers, R. Application of NMR metabolomics to search for human disease biomarkers. Comb. Chem. High Throughput Screen. 2012, 15, 595–610. [Google Scholar] [CrossRef] [PubMed]
- Ismail, I.T.; Showalter, M.R.; Fiehn, O. Inborn errors of metabolism in the era of untargeted metabolomics and lipidomics. Metabolites 2019, 9, 242. [Google Scholar] [CrossRef] [Green Version]
- Markley, J.L.; Brüschweiler, R.; Edison, A.S.; Eghbalnia, H.R.; Powers, R.; Raftery, D.; Wishart, D.S. The future of NMR-based metabolomics. Curr. Opin. Biotechnol. 2017, 43, 34–40. [Google Scholar] [CrossRef] [Green Version]
- Miller, M.J.; Kennedy, A.D.; Eckhart, A.D.; Burrage, L.C.; Wulff, J.E.; Miller, L.A.; Milburn, M.V.; Ryals, J.A.; Beaudet, A.L.; Sun, Q. Untargeted metabolomic analysis for the clinical screening of inborn errors of metabolism. J. Inherit. Metab. Dis. 2015, 38, 1029–1039. [Google Scholar] [CrossRef] [Green Version]
- Aygen, S.; Dürr, U.; Hegele, P.; Kunig, J.; Spraul, M.; Schäfer, H.; Krings, D.; Cannet, C.; Fang, F.; Schütz, B.; et al. NMR-Based Screening for Inborn Errors of Metabolism: Initial Results from a Study on Turkish Neonates. JIMD Rep. 2014, 16, 101–111. [Google Scholar] [CrossRef] [Green Version]
- Embade, N.; Cannet, C.; Diercks, T.; Gil-Redondo, R.; Bruzzone, C.; Ansó, S.; Echevarría, L.R.; Ayucar, M.M.M.; Collazos, L.; Lodoso, B. NMR-based newborn urine screening for optimized detection of inherited errors of metabolism. Sci. Rep. 2019, 9, 1–9. [Google Scholar] [CrossRef]
- Engelke, U.F.; Kremer, B.; Kluijtmans, L.A.; van der Graaf, M.; Morava, E.; Loupatty, F.J.; Wanders, R.J.; Moskau, D.; Loss, S.; van den Bergh, E. NMR spectroscopic studies on the late onset form of 3-methylglutaconic aciduria type I and other defects in leucine metabolism. NMR Biomed. Int. J. Devoted Dev. Appl. Magn. Reson. Vivo 2006, 19, 271–278. [Google Scholar] [CrossRef]
- Engelke, U.F.; Liebrand-van Sambeek, M.L.; De Jong, J.G.; Leroy, J.G.; Morava, É.; Smeitink, J.A.; Wevers, R.A. N-acetylated Metabolites in Urine: Proton Nuclear Magnetic Resonance Spectroscopic Study on Patients with Inborn Errors of Metabolism. Clin. Chem. 2004, 50, 58–66. [Google Scholar] [CrossRef] [Green Version]
- Holmes, E.; Foxall, P.J.; Spraul, M.; Farrant, R.D.; Nicholson, J.K.; Lindon, J.C. 750 MHz 1H NMR spectroscopy characterisation of the complex metabolic pattern of urine from patients with inborn errors of metabolism: 2-hydroxyglutaric aciduria and maple syrup urine disease. J. Pharm. Biomed. Anal. 1997, 15, 1647–1659. [Google Scholar] [CrossRef]
- Roland, D.; Jissendi-Tchofo, P.; Briand, G.; Vamecq, J.; Fontaine, M.; Ultré, V.; Acquaviva-Bourdain, C.; Mention, K.; Dobbelaere, D. Coupled brain and urine spectroscopy-in vivo metabolomic characterization of HMG-CoA lyase deficiency in 5 patients. Mol. Genet. Metab. 2017, 121, 111–118. [Google Scholar] [CrossRef]
- Triba, M.N.; Le Moyec, L.; Amathieu, R.; Goossens, C.; Bouchemal, N.; Nahon, P.; Rutledge, D.N.; Savarin, P. PLS/OPLS models in metabolomics: The impact of permutation of dataset rows on the K-fold cross-validation quality parameters. Mol. BioSyst. 2015, 11, 13–19. [Google Scholar] [CrossRef]
- Moolenaar, S.; Engelke, U.; Wevers, R. Proton Nuclear Magnetic Resonance Spectroscopy of Body Fluids in the Field of Inborn Errors of Metabolism. Ann. Clin. Biochem. 2003, 40, 16–24. [Google Scholar] [CrossRef]
- Beale, D.J.; Pinu, F.R.; Kouremenos, K.A.; Poojary, M.M.; Narayana, V.K.; Boughton, B.A.; Kanojia, K.; Dayalan, S.; Jones, O.A.; Dias, D.A. Review of recent developments in GC–MS approaches to metabolomics-based research. Metabolomics 2018, 14, 1–31. [Google Scholar] [CrossRef]
- Blasco, H.; Garrigue, M.-A.; De Vos, A.; Antar, C.; Labarthe, F.; Maillot, F.; Andres, C.R.; Nadal-Desbarats, L. Filter paper saturated by urine sample in metabolic disorders detection by proton magnetic resonance spectroscopy. Anal. Bioanal. Chem. 2010, 396, 1205–1211. [Google Scholar] [CrossRef]
- Emwas, A.-H.; Roy, R.; McKay, R.T.; Tenori, L.; Saccenti, E.; Gowda, G.; Raftery, D.; Alahmari, F.; Jaremko, L.; Jaremko, M. NMR spectroscopy for metabolomics research. Metabolites 2019, 9, 123. [Google Scholar] [CrossRef] [Green Version]
- Bamforth, F.; Dorian, V.; Vallance, H.; Wishart, D. Diagnosis of inborn errors of metabolism using 1H NMR spectroscopic analysis of urine. J. Inherit. Metab. Dis. 1999, 22, 297–301. [Google Scholar] [CrossRef]
- Gryff-Keller, A.; Kraska-Dziadecka, A.; Kubica, D. Detection of acylglycines in urine by 1H and 13C NMR for the diagnosis of inborn metabolic diseases. Acta Biochim. Pol. 2012, 59. [Google Scholar] [CrossRef] [Green Version]
- Kumps, A.; Duez, P.; Mardens, Y. Metabolic, nutritional, iatrogenic, and artifactual sources of urinary organic acids: A comprehensive table. Clin. Chem. 2002, 48, 708–717. [Google Scholar]
- Vaidyanathan, K.; Narayanan, M.; Vasudevan, D. Organic acidurias: An updated review. Indian J. Clin. Biochem. 2011, 26, 319–325. [Google Scholar] [CrossRef] [Green Version]
- Villani, G.R.; Gallo, G.; Scolamiero, E.; Salvatore, F.; Ruoppolo, M. “Classical organic acidurias”: Diagnosis and pathogenesis. Clin. Exp. Med. 2017, 17, 305–323. [Google Scholar] [CrossRef] [Green Version]
- Wishart, D.S.; Feunang, Y.D.; Marcu, A.; Guo, A.C.; Liang, K.; Vázquez-Fresno, R.; Sajed, T.; Johnson, D.; Li, C.; Karu, N. HMDB 4.0: The human metabolome database for 2018. Nucleic Acids Res. 2018, 46, D608–D617. [Google Scholar] [CrossRef]
- Cowart, S.L.; Stachura, M.E. Glucosuria. In Clinical Methods: The History, Physical, and Laboratory Examinations, 3rd ed.; Butterworths: Boston, MA, USA, 1990. [Google Scholar]
- Dercksen, M.; Koekemoer, G.; Duran, M.; Wanders, R.J.; Mienie, L.J.; Reinecke, C.J. Organic acid profile of isovaleric acidemia: A comprehensive metabolomics approach. Metabolomics 2013, 9, 765–777. [Google Scholar] [CrossRef]
- Lehnert, W. N-Isovalerylalanine and N-isovalerylsarcosine: Two new minor metabolites in isovaleric acidemia. Clin. Chim. Acta 1983, 134, 207–212. [Google Scholar] [CrossRef]
- Wortmann, S.B.; Kluijtmans, L.A.; Engelke, U.F.; Wevers, R.A.; Morava, E. The 3-methylglutaconic acidurias: What’s new? J. Inherit. Metab. Dis. 2012, 35, 13–22. [Google Scholar] [CrossRef] [Green Version]
- Merritt, J.L., II; Chang, I.J. Medium-Chain Acyl-Coenzyme a Dehydrogenase Deficiency; University of Washington: Seattle, WA, USA, 2019. [Google Scholar]
- Rafter, J.E.; Chalmers, R.A.; Iles, R.A. Medium-Chain acyl-CoA Dehydrogenase Deficiency: A 1H-nmr Spectroscopic Study; Portland Press Ltd.: London, UK, 1990. [Google Scholar]
- Soler-Alfonso, C.; Bennett, M.J.; Ficicioglu, C. Screening for medium-chain acyl CoA dehydrogenase deficiency: Current perspectives. Res. Rep. Neonatol. 2016, 6, 1. [Google Scholar]
- Van Hove, J.; Zhang, W.; Kahler, S.G.; Roe, C.R.; Chen, Y.-T.; Terada, N.; Chace, D.; Iafolla, A.; Ding, J.; Millington, D. Medium-chain acyl-CoA dehydrogenase (MCAD) deficiency: Diagnosis by acylcarnitine analysis in blood. Am. J. Hum. Genet. 1993, 52, 958. [Google Scholar] [PubMed]
- Miller, M.J.; Cusmano-Ozog, K.; Oglesbee, D.; Young, S. Laboratory analysis of acylcarnitines, 2020 update: A technical standard of the American College of Medical Genetics and Genomics (ACMG). Genet. Med. 2021, 23, 249–258. [Google Scholar] [CrossRef] [PubMed]
- Rinaldo, P.; Cowan, T.M.; Matern, D. Acylcarnitine profile analysis. Genet. Med. 2008, 10, 151–156. [Google Scholar] [CrossRef] [Green Version]
- Kobayashi, H.; Hasegawa, Y.; Endo, M.; Purevsuren, J.; Yamaguchi, S. ESI–MS/MS study of acylcarnitine profiles in urine from patients with organic acidemias and fatty acid oxidation disorders. J. Chromatogr. B 2007, 855, 80–87. [Google Scholar] [CrossRef]
- Schmidt-Sommerfeld, E.; Penn, D.; Rinaldo, P.; Kossak, B.D.; Li, B.; Huang, Z.-H.; Gage, D.A. Urinary medium-chain acylcarnitines in medium-chain acyl-CoA dehydrogenase deficiency, medium-chain triglyceride feeding and valproic acid therapy: Sensitivity and specificity of the radioisotopic exchange/high performance liquid chromatography method. Pediatr. Res. 1992, 31, 545–551. [Google Scholar] [CrossRef] [PubMed] [Green Version]
- Carragher, F.; Bonham, J.; Smith, J. Pitfalls in the measurement of some intermediary metabolites. Ann. Clin. Biochem. 2003, 40, 313–320. [Google Scholar] [CrossRef]
- Gunnerson, K.J.; Sharma, S. Lactic acidosis. Medscape Ref. 2011. Available online: https://emedicine.medscape.com/article/167027-print (accessed on 1 December 2020).
- Yamada, K.; Toribe, Y.; Yanagihara, K.; Mano, T.; Akagi, M.; Suzuki, Y. Diagnostic accuracy of blood and CSF lactate in identifying children with mitochondrial diseases affecting the central nervous system. Brain Dev. 2012, 34, 92–97. [Google Scholar] [CrossRef] [PubMed]
- Vaidyanathan, K.; Gopalakrishnan, S. Novel Biomarkers for Inborn Errors of Metabolism in the Metabolomics Era. 2018. Available online: http://nopr.niscair.res.in/handle/123456789/45081 (accessed on 1 December 2020).
- Sgaravatti, A.M.; Rosa, R.B.; Schuck, P.F.; Ribeiro, C.A.; Wannmacher, C.M.; Wyse, A.T.; Dutra-Filho, C.S.; Wajner, M. Inhibition of brain energy metabolism by the α-keto acids accumulating in maple syrup urine disease. Biochim. Et Biophys. Acta (BBA)-Mol. Basis Dis. 2003, 1639, 232–238. [Google Scholar] [CrossRef] [Green Version]
- Procopio, D.; Mascaro, I.; Ferraro, S.; Ceravolo, F.; Moricca, M.T.; Salpietro, V.; Polizzi, A.; Ruggieri, M.; Bonapace, G.; Concolino, D. Hyperphenylalaninemia: From Diagnosis to Therapy. J. Pediatr. Biochem. 2016, 6, 011–018. [Google Scholar] [CrossRef]
- Van Wegberg, A.; MacDonald, A.; Ahring, K.; Bélanger-Quintana, A.; Blau, N.; Bosch, A.; Burlina, A.; Campistol, J.; Feillet, F.; Giżewska, M. The complete European guidelines on phenylketonuria: Diagnosis and treatment. Orphanet J. Rare Dis. 2017, 12, 1–56. [Google Scholar] [CrossRef] [PubMed] [Green Version]
- Moolenaar, S.; Engelke, U.; Hoenderop, S.; Sewell, A.; Wagner, L.; Wevers, R. Heilbronn SHS Handbook of 1H-NMR spectroscopy in inborn errors of metabolism. Heilbronn SHS Int. 2002. Available online: https://www.worldcat.org/title/handbook-of-1h-nmr-spectroscopy-in-inborn-errors-of-metabolism/oclc/76334299 (accessed on 1 December 2020).
- Lehnert, W.; Hunkler, D. Possibilities of selective screening for inborn errors of metabolism using high-resolution 1 H-FT-NMR spectrometry. Eur. J. Pediatri. 1986, 145, 260–266. [Google Scholar] [CrossRef]
- Wolf, B. Biotinidase Deficiency. 2016. Available online: https://europepmc.org/article/nbk/nbk1322 (accessed on 1 December 2020).
- Baumgartner, M.R.; Suormala, T. Biotin-responsive disorders. In Inborn Metabolic Diseases; Springer: Berlin/Heidelberg, Germany, 2012; pp. 375–384. [Google Scholar]
- Strovel, E.T.; Cowan, T.M.; Scott, A.I.; Wolf, B. Laboratory diagnosis of biotinidase deficiency, 2017 update: A technical standard and guideline of the American College of Medical Genetics and Genomics. Genet. Med. 2017, 19, 1079. [Google Scholar] [CrossRef] [Green Version]
- De Castro, M.; Zand, D.J.; Lichter-Konecki, U.; Kirmse, B. Severe neonatal holocarboxylase synthetase deficiency in west african siblings. In JIMD Reports; Springer: Berlin/Heidelberg, Germany, 2014; Volume 20, pp. 1–4. [Google Scholar]
- Donti, T.R.; Blackburn, P.R.; Atwal, P.S. Holocarboxylase synthetase deficiency pre and post newborn screening. Mol. Genet. Metab. Rep. 2016, 7, 40–44. [Google Scholar] [CrossRef]
- Garg, U.; Smith, L.D. Biomarkers in Inborn Errors of Metabolism: Clinical Aspects and Laboratory Determination; Elsevier: Amsterdam, The Netherlands, 2017. [Google Scholar]
- Mardhiah, M.; Azize, N.A.A.; Yakob, Y.; Affandi, O.; Hock, N.L.; Rowani, M.; Habib, A. Clinical, biochemical and mutational findings in biotinidase deficiency among Malaysian population. Mol. Genet. Metab. Rep. 2020, 22, 100548. [Google Scholar] [CrossRef] [PubMed]
- Morrone, A.; Malvagia, S.; Donati, M.; Funghini, S.; Ciani, F.; Pela, I.; Boneh, A.; Peters, H.; Pasquini, E.; Zammarchi, E. Clinical findings and biochemical and molecular analysis of four patients with holocarboxylase synthetase deficiency. Am. J. Med. Genet. 2002, 111, 10–18. [Google Scholar] [CrossRef] [PubMed]
- Waters, D.; Adeloye, D.; Woolham, D.; Wastnedge, E.; Patel, S.; Rudan, I. Global birth prevalence and mortality from inborn errors of metabolism: A systematic analysis of the evidence. J. Glob. Health 2018, 8, 021102. [Google Scholar] [CrossRef]
- Chalmers, R.A.; Healy, M.; Lawson, A.M.; Watts, R. Urinary organic acids in man. II. Effects of individual variation and diet on the urinary excretion of acidic metabolites. Clin. Chem. 1976, 22, 1288–1291. [Google Scholar] [CrossRef] [PubMed]
- Lawson, A.M.; Chalmers, R.A.; Watts, R. Urinary organic acids in man. I. Normal patterns. Clin. Chem. 1976, 22, 1283–1287. [Google Scholar] [CrossRef]
- Kind, T.; Wohlgemuth, G.; Lee, D.Y.; Lu, Y.; Palazoglu, M.; Shahbaz, S.; Fiehn, O. FiehnLib: Mass spectral and retention index libraries for metabolomics based on quadrupole and time-of-flight gas chromatography/mass spectrometry. Anal. Chem. 2009, 81, 10038–10048. [Google Scholar] [CrossRef] [Green Version]
- Xiao, C.; Hao, F.; Qin, X.; Wang, Y.; Tang, H. An optimized buffer system for NMR-based urinary metabonomics with effective pH control, chemical shift consistency and dilution minimization. Analyst 2009, 134, 916–925. [Google Scholar] [CrossRef]
- Shoemaker, R. MestReNova-Mestrelab Research; Royal Society of Chemistry: Cambridge, UK, 2008; Volume 5, p. 66. [Google Scholar]
- Savorani, F.; Tomasi, G.; Engelsen, S.B. icoshift: A versatile tool for the rapid alignment of 1D NMR spectra. J. Magn. Reson. 2010, 202, 190–202. [Google Scholar] [CrossRef] [PubMed]
- Iles, R.A.; Hind, A.J.; Chalmers, R.A. Use of proton nuclear magnetic resonance spectroscopy in detection and study of organic acidurias. Clin. Chem. 1985, 31, 1795–1801. [Google Scholar] [CrossRef] [PubMed]
- Kodama, S.; Sugiura, M.; Nakao, H.; Kobayashi, K.; Miyoshi, M.; Yoshii, K.; Komatsu, M.; Sakurai, T. 1H-NMR studies of urine in propionic acidemia and methylmalonic acidemia. Acta Paediatr. Jpn. 1991, 33, 139–145. [Google Scholar] [CrossRef]
- Ulrich, E.L.; Akutsu, H.; Doreleijers, J.F.; Harano, Y.; Ioannidis, Y.E.; Lin, J.; Livny, M.; Mading, S.; Maziuk, D.; Miller, Z.; et al. “BioMagResBank” Biological Magnetic Resonance Data Bank. Nucleic Acids Res. 2008, 36, D402–D408. [Google Scholar] [CrossRef] [Green Version]
- Banfi, D.; Patiny, L. www. nmrdb. org: Resurrecting and Processing NMR Spectra On-line. CHIMIA Int. J. Chem. 2008, 62, 280–281. [Google Scholar] [CrossRef]
- Bales, J.R.; Higham, D.P.; Howe, I.; Nicholson, J.K.; Sadler, P.J. Use of high-resolution proton nuclear magnetic resonance spectroscopy for rapid multi-component analysis of urine. Clin. Chem. 1984, 30, 426–432. [Google Scholar] [CrossRef] [PubMed]
- Bouatra, S.; Aziat, F.; Mandal, R.; Guo, A.C.; Wilson, M.R.; Knox, C.; Bjorndahl, T.C.; Krishnamurthy, R.; Saleem, F.; Liu, P. The human urine metabolome. PLoS ONE 2013, 8, e73076. [Google Scholar] [CrossRef] [PubMed] [Green Version]
- Eduardo, S.P.d.N. Análise Metabolômica Via RMN: Amostras de Urina e Látex; Universidad Federal de San Carlos: San Carlos, CA, USA, 2011. [Google Scholar]
- Foxall, P.; Bewley, S.; Neild, G.; Rodeck, C.; Nicholson, J. Analysis of fetal and neonatal urine using proton nuclear magnetic resonance spectroscopy. Arch. Dis. Child. -Fetal Neonatal Ed. 1995, 73, F153–F157. [Google Scholar] [CrossRef] [PubMed] [Green Version]
- Kang, S.-M.; Park, J.-C.; Shin, M.-J.; Lee, H.; Oh, J.; Hwang, G.-S.; Chung, J.H. 1H nuclear magnetic resonance based metabolic urinary profiling of patients with ischemic heart failure. Clin. Biochem. 2011, 44, 293–299. [Google Scholar] [CrossRef]
- Nadal-Desbarats, L.; Aïdoud, N.; Emond, P.; Blasco, H.; Filipiak, I.; Sarda, P.; Bonnet-Brilhault, F.; Mavel, S.; Andres, C.R. Combined 1 H-NMR and 1 H–13 C HSQC-NMR to Improve Urinary Screening in Autism Spectrum Disorders. Analyst 2014, 139, 3460–3468. [Google Scholar] [CrossRef]
- Norusis, M.J. PASW Statistics 18 Guide to Data Analysis; Prentice Hall Press: Hoboken, NJ, USA, 2010. [Google Scholar]
- Sachse, D.; Solevåg, A.L.; Berg, J.P.; Nakstad, B. The role of plasma and urine metabolomics in identifying new biomarkers in severe newborn asphyxia: A study of asphyxiated newborn pigs following cardiopulmonary resuscitation. PLoS ONE 2016, 11, e0161123. [Google Scholar] [CrossRef] [PubMed]
- Watanabe, M.; Sheriff, S.; Lewis, K.B.; Cho, J.; Tinch, S.L.; Balasubramaniam, A.; Kennedy, M.A. Metabolic profiling comparison of human pancreatic ductal epithelial cells and three pancreatic cancer cell lines using NMR based metabonomics. J. Mol. Biomark. Diagn. 2012, 3, 2. [Google Scholar] [CrossRef] [PubMed] [Green Version]
- Wu, Z.; Li, D.; Meng, J.; Wang, H. Introduction to SIMCA-P and its application. In Handbook of Partial Least Squares; Springer: Berlin/Heidelberg, Germany, 2010; pp. 757–774. [Google Scholar]
- Zuppi, C.; Messana, I.; Forni, F.; Rossi, C.; Pennacchietti, L.; Ferrari, F.; Giardina, B. 1H NMR spectra of normal urines: Reference ranges of the major metabolites. Clin. Chim. Acta 1997, 265, 85–97. [Google Scholar] [CrossRef]
- Eriksson, L.; Antti, H.; Gottfries, J.; Holmes, E.; Johansson, E.; Lindgren, F.; Long, I.; Lundstedt, T.; Trygg, J.; Wold, S. Using chemometrics for navigating in the large data sets of genomics, proteomics, and metabonomics (gpm). Anal. Bioanal. Chem. 2004, 380, 419–429. [Google Scholar] [CrossRef]
- Eriksson, L.; Johansson, E.; Lindgren, F.; Sjöström, M.; Wold, S. Megavariate analysis of hierarchical QSAR data. J. Comput. -Aided Mol. Des. 2002, 16, 711–726. [Google Scholar] [CrossRef]
- Benjamini, Y.; Hochberg, Y. Controlling the False Discovery Rate: A Practical and Powerful Approach to Multiple Testing. J. R. Stat. Society. Ser. B (Methodol.) 1995, 57, 289–300. [Google Scholar] [CrossRef]
- Holm, S. A Simple Sequentially Rejective Multiple Test Procedure. Scand. J. Stat. 1979, 6, 65–70. [Google Scholar]
- Šidák, Z. Rectangular Confidence Regions for the Means of Multivariate Normal Distributions. J. Am. Stat. Assoc. 1967, 62, 626–633. [Google Scholar] [CrossRef]
- Benjamini, Y.; Krieger, A.M.; Yekutieli, D. Adaptive linear step-up procedures that control the false discovery rate. Biometrika 2006, 93, 491–507. [Google Scholar] [CrossRef]
- Benjamini, Y.; Yekutieli, D. False Discovery Rate–Adjusted Multiple Confidence Intervals for Selected Parameters. J. Am. Stat. Assoc. 2005, 100, 71–81. [Google Scholar] [CrossRef]


| Abnormal Metabolites Detected by GC–MS | Abnormal Metabolites Detected by 1H-NMR | ||||
|---|---|---|---|---|---|
| IEM | Metabolite | Retention Time (min) | Metabolite | ppm | Peak Feature |
| Propionic Aciduria | 3-Hydroxypropionic Acid | 6.316 | Propionic Acid | 1.038 | triplet |
| 2.286 | quartet | ||||
| 3-Hydroxypropionic Acid | 2.429 | triplet | |||
| 3-Hydroxyvaleric Acid | 8.084 | Propionylglycine | 1.119 | triplet | |
| Propionylglycine | 12.132 | 2.301 | quartet | ||
| Tiglylglycine | 14.104 | 3.75 | quartet | ||
| Methylcitric Acid | 18.513 | 3-Hydroxypropionic Acid | 2.429 | triplet | |
| 3.787 | triplet | ||||
| 3-Hydroxybutyric Acid | 4.103 | multiplet | |||
| Isovaleric Aciduria | 3-Hydroxyisovaleric Acid | 8.145 | 3-Hydroxyisovaleric Acid | 1.275 | singlet |
| 2.35 | singlet | ||||
| Isovalerylglycine | 12.903 | Isovalerylglycine | 0.9332 | doublet | |
| 1.975 | multiplet | ||||
| 2.372 | doublet | ||||
| Isovalerylglutamate | 19.447 | Isovalerylalanine† | 1.33 | doublet | |
| 4.12 | multiplet | ||||
| β-oxidation defect | Octanoic Acid (Dehydrosuberic Acid) | 15.944 | Butyrylglycine | 2.27 | triplet |
| Isovalerylglycine | 1.975 | multiplet | |||
| Adipic Acid | 13.415 | Butyrylglycine—Suberylglycine (convergent signals) | 1.860–1.983 | multiplet | |
| Suberic Acid | 16.22 | ||||
| Tiglylglycine | 14.265 | ||||
| 2-Methylbutyrylglycine | 13.289 | 2-Methylbutyrylglycine | 1.19 | doublet | |
| 2-Methylbutyrylglycine | 2.26 | triplet | |||
| Hexanoylglycine | 15.013 | Hexanoylglycine; 2-Methylbutyrylglycine (convergent signals) | 1.983–2.119 | multiplet | |
| Hexanoylglycine | 0.8689 | triplet | |||
| Hexanoylglycine | 2.24 | multiplet | |||
| Octanoylglycine | 15.447 | Hexanoylcarnitine—Octanoylglycine (convergent signals) | 5.77–5.85 | multiplet | |
| Isobutyrylglycine | 16.006 | Isobutyrylglycine | 1.239 | doublet | |
| 3-Methylglutaconic aciduria | 3-Methylglutaric Acid | 12.132 | 3-Methylglutaric Acid | 1.139 | doublet |
| 3-Methylglutaconic Acid | 13.327 | ||||
| Holocarboxylase Synthetase Deficiency | 3-Hydroxypropionic Acid | 6.326 | Propionylglycine—2-Methyl-3-hydroxybutyric Acid | 1.119 | doublet |
| 3-Hydroxyisovaleric Acid | 8.729 | 2-Methyl-3-hydroxybutyric Acid | 2.09 | doublet | |
| Propionylglycine | 12.132 | 1.198 | doublet | ||
| Isobutyrylglycine TMS II | 12.176 | Acetoacetic Acid | 2.28 | singlet | |
| 3-Methylcrotonylglycine | Tiglylglycine | 3.456 | singlet | ||
| 14.849 | 1.77 | singlet | |||
| Methylcitric Acid | 18.466 | 3-Methylcrotonylglycine | 5.77 | multiplet | |
| Glutaric Aciduria Type I | Glutaric Acid | 11.485 | Glutaric Acid | 1.752 | multiplet |
| Glutaconic Acid | 11.535 | 2.172 | triplet | ||
| 3-Hydroxyglutaric Acid | 14.366 | ||||
| Phenylalanine Metabolism Disorders | 2-Hydroxyphenylacetic Acid | 14.415 | 3-Phenyllactic Acid | 2.861 | doublet doublet |
| 3-Phenyllactic Acid | 14.825 | 7.33 | multiplet | ||
| 4-Hydroxyphenylpyruvic Acid | 16.482 | N-acetyl-phenylalanine | 1.928 | singlet | |
| 7.32 | multiplet | ||||
| 4-Hydroxyphenyllactic Acid | 19.085 | ||||
| Lactic Aciduria | Lactic Acid | 3.671 | Lactic Acid | 1.33 | doublet |
| 2-Hydroxyisobutyric Acid | 5.408 | 4.102 | quartet | ||
| 4-Hydroxyphenyllactic Acid | 18.614 | Acetic Acid | 1.93 | singlet | |
| Glucose | 3.241 | multiplet | |||
| 3.396 | multiplet | ||||
| 3.458 | multiplet | ||||
| 3.536 | doublet doublet | ||||
| 3.61 | multiplet | ||||
| 3.702 | multiplet | ||||
| 3.895 | doublet | ||||
| 4.655 | doublet | ||||
| 5.24 | doublet | ||||
| Maple Syrup Urine Disease (MSUD) | 2-Hydroxyisovaleric Acid | 7.375 | 3-Hydroxybutyric Acid | 2.3 | multiplet |
| 4.103 | multiplet | ||||
| 3-Methyl-2-oxovaleric Acid | 1.2 | doublet | |||
| 3-Methyl-2-oxovaleric Acid | 8 | 1.42 | multiplet | ||
| 3-Hydroxyisovaleric Acid | 8.084 | 2-Hydroxyisovaleric Acid | 0.92 | doublet | |
| 2-Oxoisocaproic Acid (Ketoleucine) | 8.75 | 0.98 | doublet | ||
| Alloisoleucine | 12.116 | Alloisoleucine | 0.94 | multiplet | |
| Isoleucine | 0.926 | triplet | |||
| 1.42 | multiplet | ||||
| 2-Oxoisocaproic Acid (Ketoleucine) | 0.92 | doublet | |||
| 1.99 | multiplet | ||||
| 2.6 | doublet | ||||
| No | COMPOUND | ᵟ1H (pH = 7.0) |
|---|---|---|
| 0 | Unidentified (found in the area corresponding to lipids). | 1.170 (t) |
| 1 | 3-Aminoisobutyric Acid | 1.187–1.212 (d) |
| 2 | Lactic Acid | 1.33–1.347 (d) |
| 3 | Alanine | 1.475–1.499 (d) |
| 4 | Acetic Acid | 1.93 (s) |
| 5 | N-Acetyl region | 1.991–2.027–2.044–2.066–2.09 (s) |
| 6 | Acetone | 2.24 (s) |
| 7 | Succinic Acid | 2.412 (s) |
| 8 | Citric Acid | 2.509–2.56–2.651–2.70 (d,d) |
| 9 | Dimethylamine (DMA) | 2.717 (s) |
| 10 | Trimethylamine (TMA) | 2.931 (s) |
| 11 | Creatine | 3.03–3.939 (s,s) |
| 12 | Creatinine | 3.05–4.071 (s,s) |
| 13 | Betaine | 3.27 (s)–3.91 (s) |
| 14 | Glycine | 3.57 (s) |
| 15 | Hippuric Acid | 3.96–7.52–7.61–7.82 (d,t,t,d) |
| 16 | Formic Acid | 8.44 (s) |
| 17 | ɑ-N-Phenylacetyl-L-glutamine | 7.328–7.391 (t) |
| 18 | L-Histidine | 7.156 (s) |
| 19 | L-Taurine | 3.426 (t) |
| smIEM Disorder | Metabolite | Coeffcs | %FC (SD) | FDR | p-Value | n |
|---|---|---|---|---|---|---|
| Propionic acidemia | Propionic acid | 0.007 | 72% (±0.70) | 0.028 | 0.180 | 17 |
| 3-hydroxy propionic acid | 0.0017 | 26% (±0.46) | 0.012 | 0.013 * | 22 | |
| Isovaleric acidemia | Isovalerylalanine | 0.002 | 81% (±0.89) | 0.033 | 0.290 | 18 |
| 3-methyl glutaconic acidemia | 3-methylglutaric acid | 0.009 | 58% (±0.86) | 0.020 | 0.043 * | 21 |
| Glutaric acidemia Type I | Glutaric acid | 0.007 | 59% (±0.80) | 0.020 | 0.071 | 17 |
| β-oxidation defect | Hexanoyl/octanoyl carnitine | 0.020 | 80% (±0.58) | 0.026 | 0.153 | 7 |
| Lactic acidemia | Glucose | 0.020 | 38% (±0.53) | 0.007 | 0.005 ** | 20 |
| Lactic acid | 0.002 | 81% (±0.71) | 0.037 | 0.310 | 16 | |
| Maple syrup urine disease | Alloisoleucine | 0.017 | 65% (±0.72) | 0.028 | 0.160 | 17 |
| Ketoleucine | 0.002 | 65% (±0.53) | 0.022 | 0.075 | 18 | |
| Phenylalanine metabolism | N-acetyl-phenylalanine | 0.029 | 50% (±0.72) | 0.011 | 0.015 * | 16 |
| 3-phenyllactic acid | 0.024 | 67% (±0.76) | 0.019 | 0.033 * | 13 | |
| Holocarboxylase synthetase deficiency | 2-methyl-3-hydroxy butyric acid | 0.021 | 32% (±0.72) | 0.003 | 0.0006 ** | 22 |
| Propionylglycine | 0.011 | 37% (±0.46) | 0.014 | 0.012 * | 18 | |
| Methylcrotonylglycine | 0.021 | 77% (±0.65) | 0.027 | 0.220 | 5 |
| No | ID | Gender | Age (Month) | Condition * | Biochemical Diagnosis | Classification |
|---|---|---|---|---|---|---|
| 1 | 56SV929436PA | M | 9 | Follow up | Propionic aciduria | Organic acidurias |
| 2 | 57PA | M | 0.52 | Diagnosis | ||
| 3 | 58IVA | F | 1 | Diagnosis | Isovaleric aciduria | |
| 4 | 59IVA | NA | 1 | Diagnosis | ||
| 5 | 60IVA | F | 168 | Follow up | ||
| 6 | 64MGA | F | 2 | Diagnosis | 3-Methylglutaconic aciduria ** | |
| 7 | 65MGA | F | 0.79 | Diagnosis | ||
| 8 | 68GATI | M | 36 | Follow up | Glutaric aciduria type I | |
| 9 | 69GATI | F | 48 | Follow up | ||
| 10 | 70GATI | M | 72 | Follow up | ||
| 11 | 72GATI | F | 72 | Follow up | ||
| 12 | 61 β-oxidation defect; | F | 36 | Follow up | β-oxidation defect | Fatty Acid Oxidation Disorder |
| 13 | 67HSD | F | 0.72 | Diagnosis | Holocarboxylase synthetase deficiency | Amino Aciduria |
| 14 | 77LA | M | 0.23 | Diagnosis | Lactic aciduria | Mitochondrial disorder |
| 15 | 62MSUD | M | 24 | Follow up | Maple syrup urine disease | Aminoacidopathies |
| 16 | 71MSUD | F | NA | Follow up | ||
| 17 | 74PHE | F | 144 | Follow up | Disorders of phenylalanine metabolism |
Publisher’s Note: MDPI stays neutral with regard to jurisdictional claims in published maps and institutional affiliations. |
© 2021 by the authors. Licensee MDPI, Basel, Switzerland. This article is an open access article distributed under the terms and conditions of the Creative Commons Attribution (CC BY) license (https://creativecommons.org/licenses/by/4.0/).
Share and Cite
Pulido, N.; Guevara-Morales, J.M.; Rodriguez-López, A.; Pulido, Á.; Díaz, J.; Edrada-Ebel, R.A.; Echeverri-Peña, O.Y. 1H-Nuclear Magnetic Resonance Analysis of Urine as Diagnostic Tool for Organic Acidemias and Aminoacidopathies. Metabolites 2021, 11, 891. https://0-doi-org.brum.beds.ac.uk/10.3390/metabo11120891
Pulido N, Guevara-Morales JM, Rodriguez-López A, Pulido Á, Díaz J, Edrada-Ebel RA, Echeverri-Peña OY. 1H-Nuclear Magnetic Resonance Analysis of Urine as Diagnostic Tool for Organic Acidemias and Aminoacidopathies. Metabolites. 2021; 11(12):891. https://0-doi-org.brum.beds.ac.uk/10.3390/metabo11120891
Chicago/Turabian StylePulido, Ninna, Johana M. Guevara-Morales, Alexander Rodriguez-López, Álvaro Pulido, Jhon Díaz, Ru Angelie Edrada-Ebel, and Olga Y. Echeverri-Peña. 2021. "1H-Nuclear Magnetic Resonance Analysis of Urine as Diagnostic Tool for Organic Acidemias and Aminoacidopathies" Metabolites 11, no. 12: 891. https://0-doi-org.brum.beds.ac.uk/10.3390/metabo11120891