Article

Metabolomics of Pigmented Rice Coproducts Applying Conventional or Deep Eutectic Extraction Solvents Reveal a Potential Antioxidant Source for Human Nutrition

by
Millena Cristina Barros Santos
1,2,
Nathalie Barouh
3,4,
Erwann Durand
3,4,
Bruno Baréa
3,4,
Mélina Robert
3,4,
Valérie Micard
4,
Valérie Lullien-Pellerin
4,
Pierre Villeneuve
3,4,
Luiz Claudio Cameron
2,
Elizabeth P. Ryan
5,
Mariana Simões Larraz Ferreira
1,2,* and
Claire Bourlieu-Lacanal
3,4,*
1
LabBio, Laboratory of Bioactives, Food and Nutrition Graduate Program, PPGAN, Federal University of State of Rio de Janeiro, UNIRIO, Rio de Janeiro 22290-240, Brazil
2
IMasS-LBP, Center of Innovation in MS-Laboratory of Protein Biochemistry, UNIRIO, Rio de Janeiro 22290-240, Brazil
3
CIRAD, UMR IATE, 34398 Montpellier, France
4
IATE, Univ Montpellier, INRAE, Institut Agro, 34000 Montpellier, France
5
Department of Environmental and Radiological Health Sciences, Colorado State University, Fort Collins, CO 80523, USA
*
Authors to whom correspondence should be addressed.
Submission received: 14 December 2020 / Revised: 5 February 2021 / Accepted: 5 February 2021 / Published: 15 February 2021
(This article belongs to the Special Issue Analysis and Metabolism of Bioactive Compounds)

Abstract

:
Rice bran (RB) corresponds to the outer layers of whole grain rice and contains several phenolic compounds (PCs) that make it an interesting functional food ingredient. PC richness is enhanced in pigmented RB varieties and requires effective ways of extraction of these compounds. Therefore, we investigated conventional and deep eutectic solvents (DES) extraction methods to recover a wide array of PCs from red and black RB. The RB were extracted with ethanol/water (60:40, v/v) and two DES (choline chloride/1.2-propanediol/water, 1:1:1 and choline chloride/lactic acid, 1:10, mole ratios), based on Generally Recognized as Safe (GRAS) components. Besides the quantification of the most typical phenolic acids of cereals, nontargeted metabolomic approaches were applied to PCs profiling in the extracts. Globally, metabolomics revealed 89 PCs belonging to flavonoids (52%), phenolic acids (33%), other polyphenols (8%), lignans (6%) and stilbenes (1%) classes. All extracts, whatever the solvents, were highly concentrated in the main phenolic acids found in cereals (37–66 mg/100 g in black RB extracts vs. 6–20 mg/100 g in red RB extracts). However, the PC profile was highly dependent on the extraction solvent and specific PCs were extracted using the acidic DES. The PC-enriched DES extracts demonstrated interesting DPPH scavenging activity, which makes them candidates for novel antioxidant formulations.

Graphical Abstract

1. Introduction

Health-promoting properties of rice bran (RB) (Oryza sativa L.) have supported its application in food products for human consumption over the last decade. RB has been tested in the formulation of functional foods for human studies involving children and adults [1,2]. Indeed, RB nutritional profile is well diversified in essential and nonessential nutrients, and contains lysine-rich proteins [3], lipids [4], fibers and phytochemicals [5]. Additionally, RB consumption can positively modulate intestinal microbiota, contribute to the production of novel primary and secondary metabolites, to the regulation of intestinal immunity for the protection against bacterial infection with Salmonella [6,7] and to colon cancer prevention [8].
RB bioactivity is enhanced in pigmented rice varieties [9], very likely because of the higher levels and diversity of phenolic compounds (PCs). These pigmented rice gather usual phenolic acids found in nonpigmented varieties such as p-coumaric, syringic, vanillic, caffeic, sinapic, p-hydroxybenzoic, isoferulic and protocatechuic acids [9,10,11,12], but owe their color to flavonoids. For instance, anthocyanins such as cyanidin-3-O-glucoside and peonidin-3-O-glucoside and proanthocyanidins have already been identified in pigmented RB [13,14,15]. These pigmented-rice flavonoids and phenolic acids play an essential role against oxidative stress and inflammation. Such protective role was demonstrated in mouse [16,17] or human cell assays [18]. This antioxidant activity is reported to be even enhanced in black rice grains [10]. Among the wide range of bioactivity for pigmented RB potentially linked to its high PCs load, antiaging properties have been evidenced by Sunthonkun, et al. [19]. These authors have shown increased viability of yeast Saccharomyces cerevisiae when exposed to medium enriched in pigmented RB extracts. In addition, Khammanit, et al. [20] provided evidence for the antiproliferative properties of pigmented RB on HEK-293 cells. These antiproliferative effects were mediated by a reduction in ROS production, as well as an enhancement of antioxidant enzymes production.
Considering the high bioactivity of pigmented RB, it is an important and relevant scientific challenge to better examine their complex chemical PCs composition. Due to the wide range of PCs’ polarity, effective extraction is a key issue to properly elucidate the components of the pigmented RB extracts. This is generally handled by combining mixtures of organic solvents (e.g., methanol, isopropanol, chloroform, acetone) with water, but their efficiency is sometimes limited due to the low diversity of compounds extracted [21]. In addition, physically-assisted solvent extraction techniques have also been proposed to increase bioactive compounds extraction efficiency [22].
In this context, the application of a novel class of green solvents, called deep eutectic solvents (DES), has been proposed as a promising strategy to improve the extraction efficiency of bioactive compounds from coproducts [23]. DES show similar physical properties to the well-known ionic liquids (e.g., low vapor pressure, chemical and thermal stability, no flammability, high conductivity, high solubilizing capacity and low volatility) but with lower toxicity and better beneficial cost, accessibility and sustainability. What makes DES interesting is their unpredictable and strong solubilization capacity that was intensively used to provide enriched extracts with high phytochemical concentration and/or specificity [23]. For instance, Huang, et al. [24] successfully extracted the low soluble rutin reaching 95% recovery from buckwheat hull. In addition, DES can stabilize and protect molecules from degradation, mostly due to the supramolecular network of tightly interconnected molecules [25,26]. Depending on the DES composition, they may offer all characteristics to design atom economy, efficient, low cost and sustainable development for ready-to-use formulation, fully compatible with food and feed applications [23].
To resolve the complexity of DES extracts, “foodomics” can be applied since it represents a high-throughput approach able to elucidate the food chemical complexity by using chromatography as a separation method coupled with high-resolution mass spectrometry. Foodomics ensures simultaneously the coverage of diverse chemical specimens (e.g., amino acids, lipids, carbohydrates, phytochemicals) [27,28]. These tools are used to identify and quantify chemical species in their ionized forms by measuring their mass/charge (m/z). In this study, we have investigated the potential of DES to extract PCs from pigmented RB in comparison to conventional ethanol/water solvent.
The chemometrics tools were applied for the chemical data generate characterization of the obtained extracts. Typical phenolic acids of cereals were also quantified with a high-performance liquid chromatography (HPLC) fitted with a diode-array detector (DAD).
The DPPH (2,2-diphenyl-1-picrylhydrazyl) test is based on the antioxidant activity of a hydrogen donor that will allow the reduction of DPPH [29]. Indeed, antioxidant activity is defined as the ability of an organism to protect itself against free radicals. This assay was performed to assess the capacity of extracts to stabilize radicals.

2. Results and Discussion

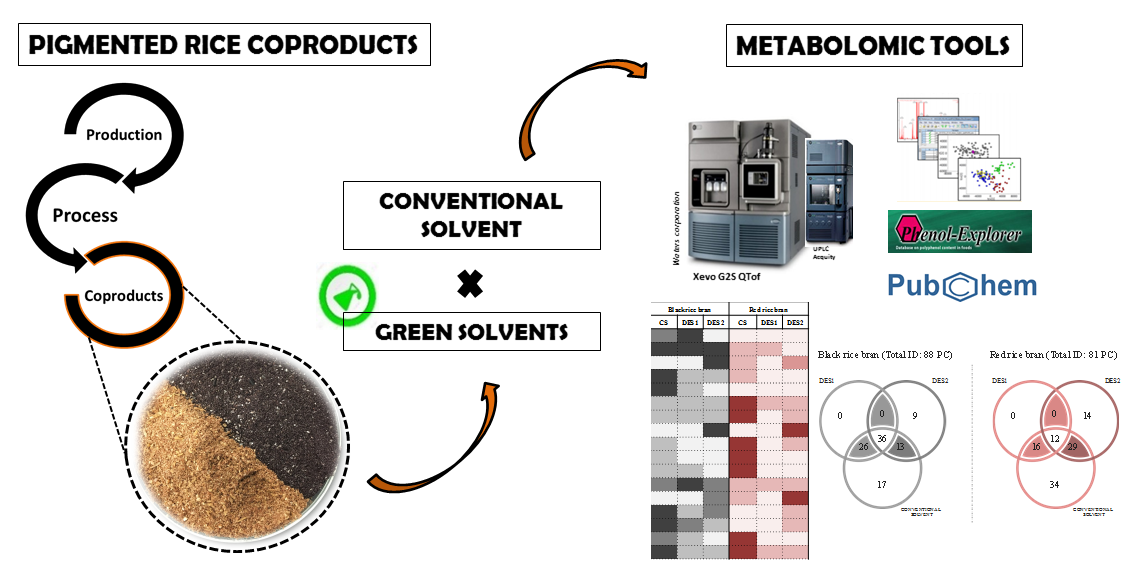
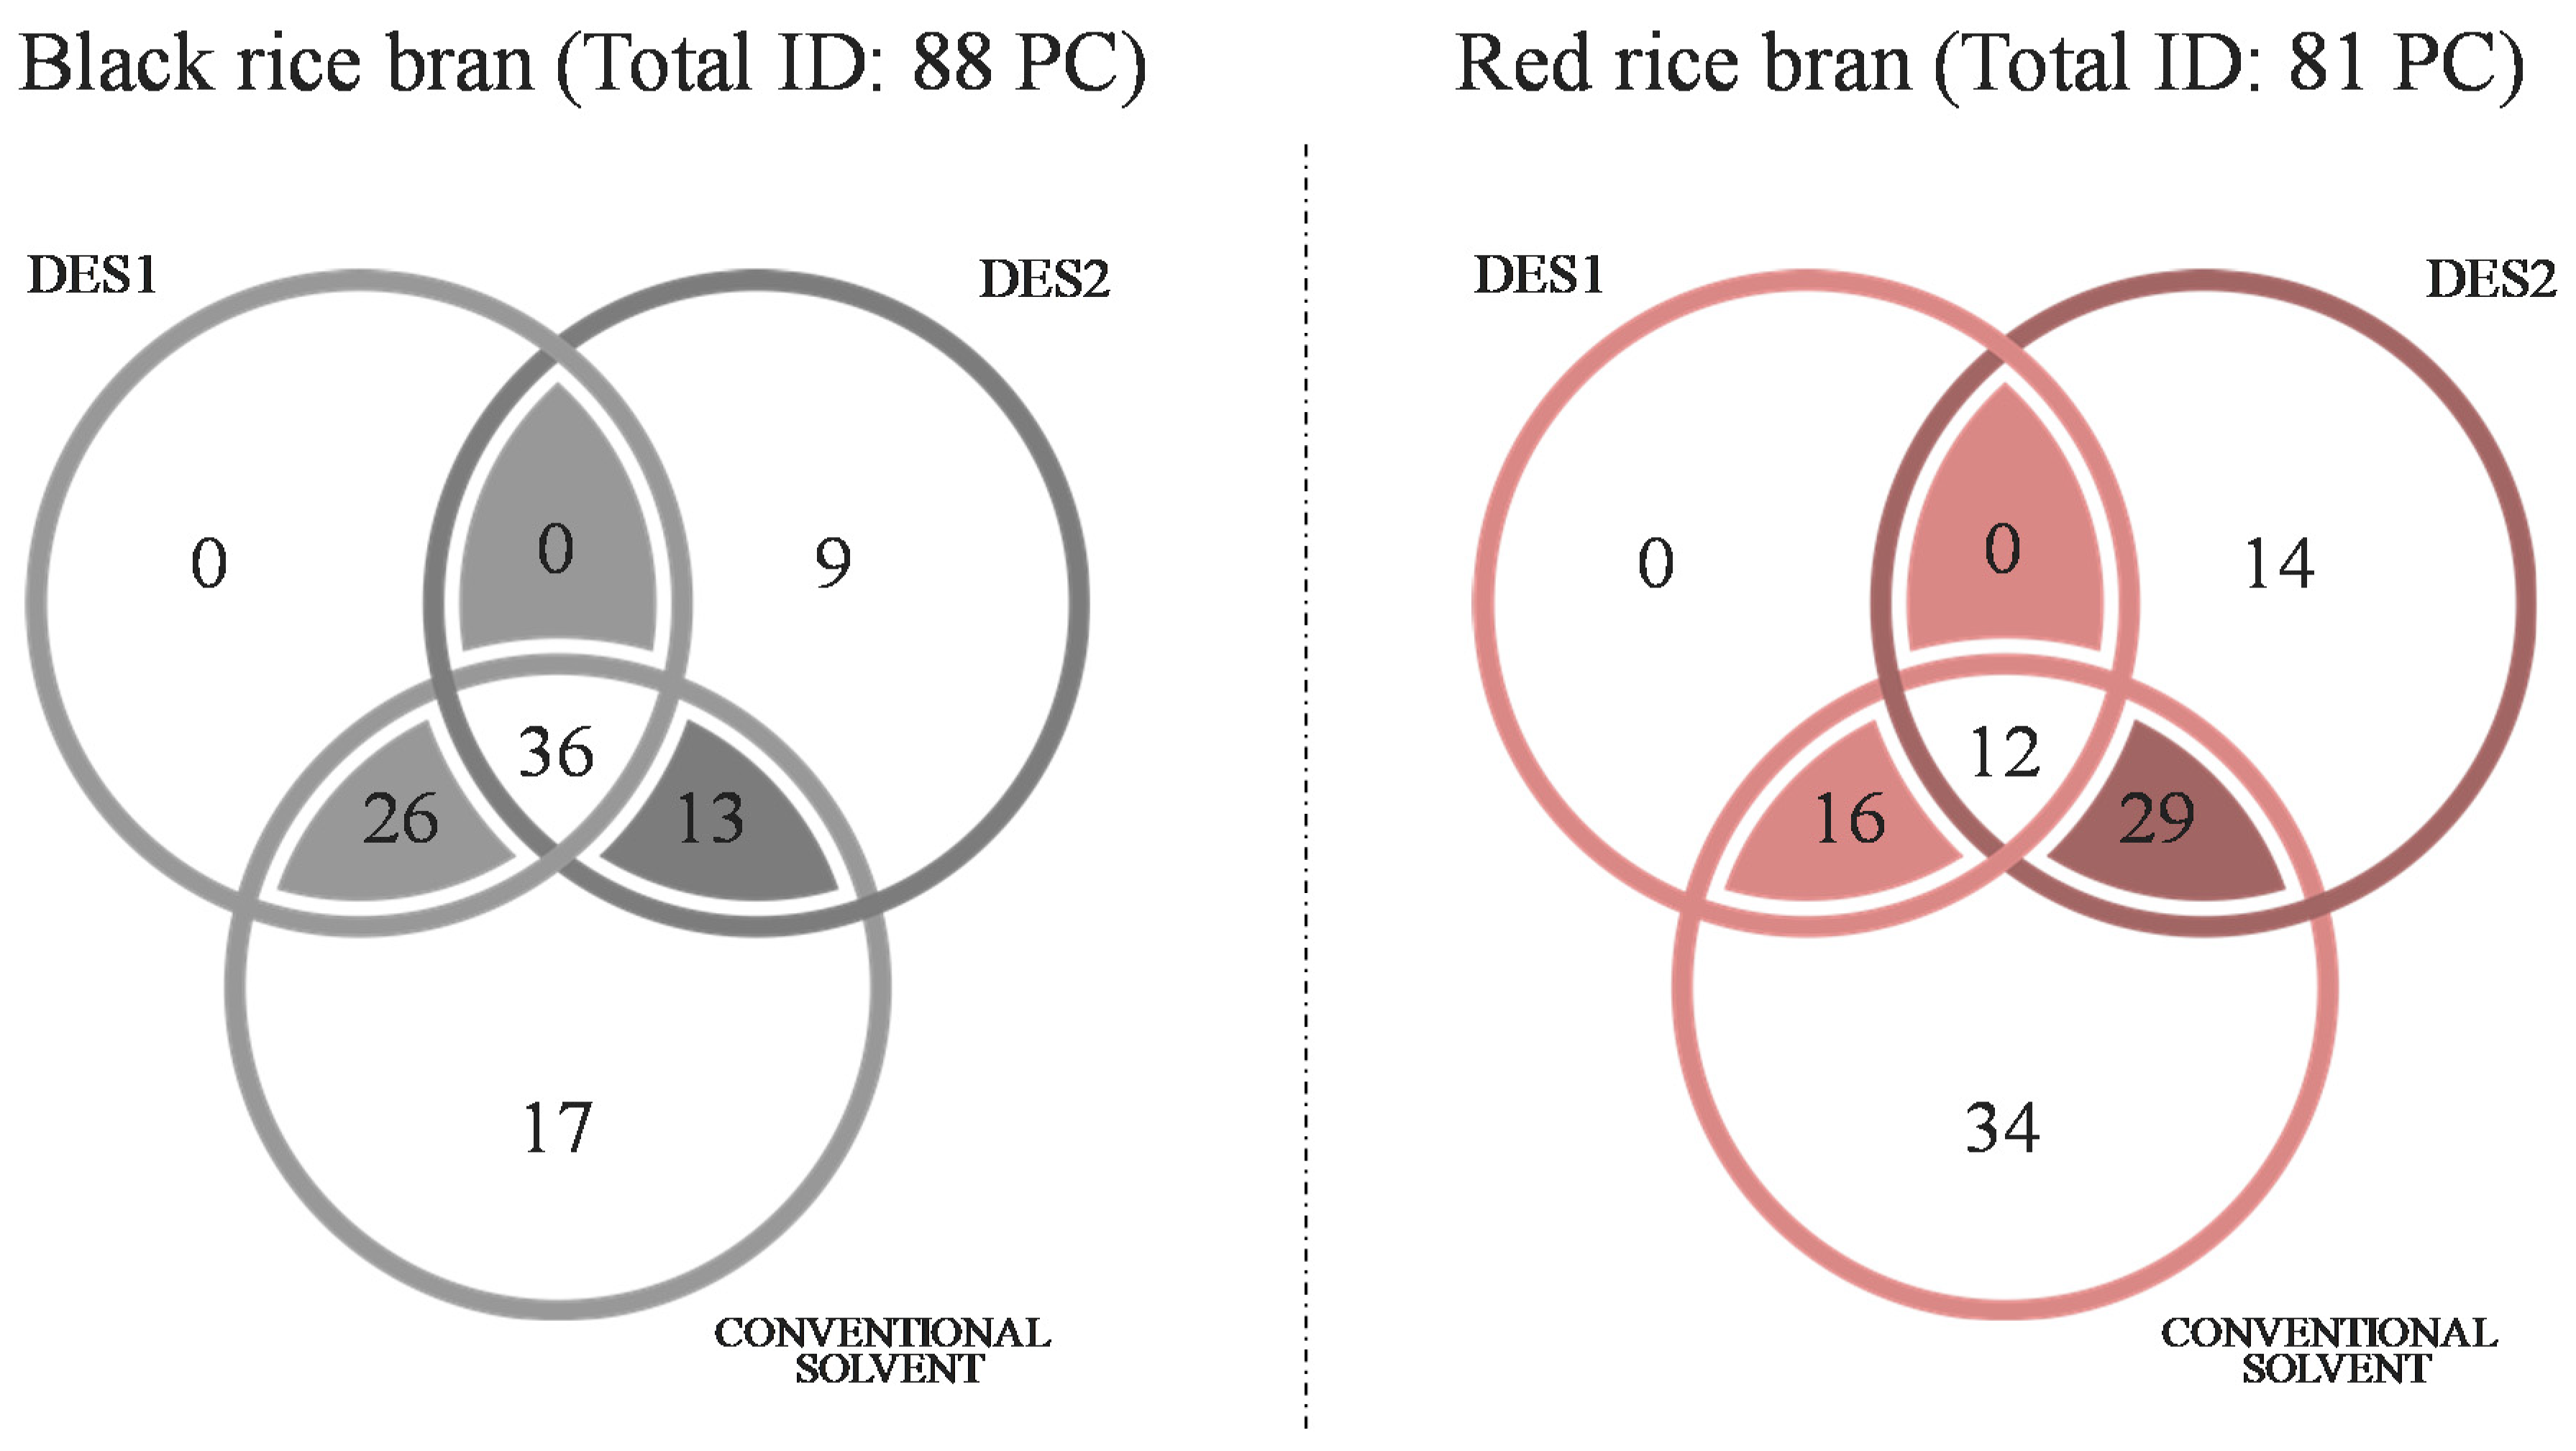
2.1. UPLC-MSE Analyses to Unveil the Chemical Complexity and Diversity of PCs in Rice Bran Extracts

Considering the molecular complexity found in RB extracts, a putative identification of PCs and comparison between conventional and DES extracts with advanced UPLC-MS-MS tools was performed. Globally, a total of 89 PCs were tentatively identified in both extracts, including all extraction conditions. The putative PCs were identified following the recommendations of level 1 and 2 according to Sumner, et al. [30,31] considering mass to charge (m/z), retention time, isotopic similarity, precursor mass error, as well as the score and the fragmentation score for each identification attempt. These putative compounds are listed in the order of their retention time in Table 1. When all the parameters for the identification were equal, it was not possible to distinguish the compound and a multiple identification was proposed. In addition, compounds with the same m/z but with different retention times, were identified as isomers and were listed in the order of their retention time. In this work, 35 isomers of PCs were identified and 20 multiple identifications occurred.
The PCs identified in this study belonged to different chemical classes that were listed by decreasing number of occurrences in the extracts (Figure 1). Regardless of the RB types and conditions of extraction, the flavonoids were the most representative class of PCs with 52% of occurrences, followed by the phenolic acids (33%), other polyphenols (8%), lignans (6%) and stilbenes (1%).
As expected for pigmented rice, the flavonoids were the most abundant compounds present in the extracts, however only one anthocyanin (cyanidin 3-O-beta-D-sambubioside) was unambiguously identified. Considering the influence of the type of RB, a higher number of PCs was identified in the black rice RB (88) than in the red rice RB (81), which is in agreement with the literature [11]. Our results were in line with Pereira-Caro, et al. [32] who applied HPLC-PDA-MS2 to identify and quantify compounds in pigmented rice Camargue grains (black rice cultivar Artemide and red rice cultivar Tam Tam). They registered the presence of 34 PCs (34 present in black rice vs. 20 in red rice). In addition, these authors also pointed out that black rice was 14 times richer in PCs than red rice. Among the identified PCs, the most abundant class were flavonoids (subclasses: anthocyanins, flavones, flavonols, and flavan-3-ols) corresponding to 60% of the total. More recently, a metabolomic study with 17 RB cultivars originated from 11 countries identified 23 PCs [5]. Among them, seven were also identified in the present study and are highlighted in Table 1. The presence of chlorogenic acids corroborates the results found by Pang, Ahmed, Xu, Beta, Zhu, Shao and Bao [10] who identified two isomers of feruloylquinic acids. However, they did not detect the presence of caffeoylquinic acid and coumaroylquinic acid. In the present work, we could identify the presence of two isomers of feruloylquinic acids (m/z 367.1023 [M–H]) and two isomers of coumaroylquinic acid (m/z 337.0916 [M–H]) among the discriminant PCs. In addition, one isomer of caffeoylquinic acid (m/z 353.0863 [M–H]) and one isomer of dicaffeoylquinic acid (m/z 515.1221 [M–H]) were also identified (Table 1).
Although the presence of various anthocyanins has not been evidenced, PCs closely related to anthocyanins metabolism [33] have been identified such as dihydroquercetin, quercetin (the fourth most abundant PC identified in this study) and myricetin.

2.2. Focus on the Tentative Identification of Phenolic Compounds by Solvent

To better visualize common and unique PCs within the different extracts, PCs were displayed under the form of a Venn diagram (Figure 2). When looking at PCs in common in the three types of extracts either for black RB or for red RB, 36 common PCs out of 88 were identified in black RB versus 12 only out of 81 in red RB. This limited common pool of PCs underlines the specificity of extraction of each type of extract.
Focusing on unique compounds this time, the Venn diagram indicated some pools of unique compounds for conventional and DES2 (choline chloride/lactic acid, 1:10) extracts only. Unique PCs extracted with conventional solvents and identified by MS will not be discussed further since they have already been evidenced in the literature [5,11,32]. Considering DES2 solvent, it allowed the extraction of additional and unique compounds as follows, nine unique PCs were obtained from black RB and 14 from red RB. The acidity of the DES2 is probably effective in triggering bound phenolic acid hydrolysis and their release in the extract, as already pointed out by Ruesgas-Ramón et al. [23]. Loypimai, et al. [34] compared different solvents and showed that acidified solvents (with added HCl) led to better yields of PCs extraction. In our study, we also observe that DES2 is able to extract glycosylated or ester cyclic molecules. In comparison, no unique PC was identified in DES1 extracts which had a pool of PCs in common with conventional extracts (respectively 26 for the Black RB and 16 for red RB).
If we try to identify these unique PCs in DES2, some of these PCs had already been described in the literature for their bioactivities. For instance, dihydroresveratrol (m/z 229.0871 [M–H]), rosmarinic acid (m/z 359.0775 [M–H]), and the paeonol (m/z 165.0545 [M–H]) are known to be biomarkers of inflammation pathways, protecting the nervous and cardiovascular system [35,36], as well as inducer of apoptosis and proliferative inhibitor in liver and kidney [37]. Syringaresinol (m/z 417.1560 [M–H]) is a lignin compound that also plays a key role in inhibiting the proliferation of cancer cells [38], but it can also play an important biotechnological role.
Indeed, Janvier, et al. [39] has shown that it can be an interesting substitute to the synthetic bisphenol A (BPA) compound in the polymer production. Eriodictyol (m/z 287.0567 [M–H]), being one of the precursors of anthocyanins [40], is a flavonoid of a great importance. It is one of the main PCs present in citrus fruits, and exhibited antioxidant, antimicrobial, anti-inflammatory and antidiabetic activity [41,42]. It is used to mask bitter taste in beverages and in pharmaceutical industries [43]. Therefore, we have evidenced that DES2 is a good medium to extract specific RB PCs known for their biological activities. However, this specificity will very likely be dependent on the matrix [23].
To conclude the comparison of extraction potentials between conventional and DES solvents, although the conventional solvent extracted a higher number of PCs compared to DES, the possibility to extract different and unique PCs in DES2 offers an interesting alternative for both, the biomass characterization and the valorization of biomass-derived bioactive molecules.

2.3. Multivariate Analysis from the Measured Relative Abundance of Phenolic Compounds

The application of the multiplexed UPLC-MSE method has enabled to quantify the relative abundance of identified compounds from the total ion counting. In Table 1, the relative abundance was summarized by color considering the percentage of each identified compound calculated from the total relative abundance (abundance higher than 75%, between 75% and 50% and lower than 50%).
Two isomers of dihydroxybenzoic acids were the most abundant and prevalent compounds in this study. According to the literature, one may suppose that these isomers were protocatechuic and gentisic acids [10,44]. Indeed, Zarei, Luna, Leach, McClung, Vilchez, Koita and Ryan [5] evidenced that protocatechuic acid was the most abundant PCs of the pigmented RB varieties and was even present in larger quantities in black rice.
To analyze the interrelations between the samples, the data were submitted to multivariate analysis by principal components analysis (Figure 3). The relative ion abundance of each putative identified PC was considered as a variable and the score of each sample was calculated (Figure 3A). The principal component 1 (PC1) accounted for 56% and the PC2 for 25% of the total variation in the dataset. It is possible to distinguish black and red RB and to highlight the differences in the PCs profile between the extraction conditions. Indeed, the red RB extraction profiles obtained with the two DES stayed close when projected on PC1 and PC2, while PC1 axis helped separating the black RB from the red RB extracts. It was marked by a high concentration in flavonoids or phenolic acids derived from hydroxybenzoic acids and chlorogenic acids. Conversely, extracts with a low score on PC1 gathered the RB extracts and were marked with lignans and phenolic acids derived from hydroxycinnamic and hydroxyphenylacetic acids. PC2 resumed less variability but separated conventional extracts, on the superior quadrant presenting high scores, from DES extracts (inferior quadrant).
The covariance p(1) and correlation p(corr)(1) loadings from a two-class Orthogonal Partial Least Squares Discriminant Analysis (OPLS-DA) model (conventional solvent vs. DES) are displayed in a S-plot format (Figure 3B), where the variables (squares) are represented by the putative PCs. The upper right quadrant of the S-plot showed the PCs, which were elevated in DES extracts, while the lower left quadrant presented the PCs which were elevated in conventional solvent extracts. The measured intensities and factor of changes were based on the average of the measured values for each PCs in the group. To ease the reading of such an S-plot, we must specify: the further away from the x-axis the compound is, the greater the contribution to the variation between the groups, while the further away from the y-axis, the greater the reliability of the analytical result, thus the significance. The two most important PCs that explained differences between DES and conventional extracts were the coumaric acid (−0.44; −0.95) and the syringaldehyde (−0.26; −1).

2.4. Further Characterization of Extracts

2.4.1. Quantitative Examination of the Typical Phenolic Acids Found in Cereals

The quantification of five typical phenolic acids (gallic, vanillic, p-coumaric, sinapic and ferulic acids) in the different extracts of black and red RB was carried out and is displayed in Figure 4. These phenolic acids were selected because they had already been found in the pigmented RB [9,11,45,46]. The quantification profile of those phenolic acids was different and dependent of the extraction conditions. In this work, conventional solvent and DES1 resulted in extracts with higher content of these five phenolic acids in comparison with DES2. This study points out that some DES solvents can have high extraction capacity leading to broad profile of extracted PCs and can thus be good substitutes for conventional solvents while other DES formulations can lead to narrower and more specific PC extraction profiles.
Moreover, such quantification of phenolic acids allowed strongly differentiating red and black RB extracts (Figure 4). Indeed, whatever the solvent used for extraction, red RB extracts were less concentrated in phenolic acids than the black RB extracts. These results were coherent with literature which has already demonstrated that among colored rice, black rice outer layers contains more phenolics than red rice [46]. Black RB extracts contained sixfold more phenolic acids than red RB, with a total ranging between 37–66 mg/100 g in black RB extracts vs. 6–20 mg/100 g in red RB extracts. These contents were in agreement with other authors in literature [45]. Among these compounds (Figure 4), the ferulic acid was the most abundant in most cases (26–34 mg/100 g of black RB vs. 2–8 mg/100 g of red RB). Ferulic acid was indeed reported to be the main phenolic acid in cereals, especially in the bound fraction [12]. The second most concentrated phenolic acid quantified was vanillic acid in red RB, and p-coumaric/sinapic acid in black RB. These concentrations differed depending on the combination of solvent type (conventional solvent vs. DES1 vs. DES2) and of the type of matrix. Our results showed lower levels in vanillic acid in red RB compared with black RB in conventional extracts. Such result contrasted from the ones of Shao, Xu, Sun, Bao and Beta [44] who reported that vanillic acid was found only in black rice. Gallic acid was the least concentrated phenolic acid among the five quantified compounds, being more concentrated in black RB than in red RB, in agreement with Shao, Xu, Sun, Bao and Beta [11].

2.4.2. Scavenging Ability of Rice Bran Extracts Assessed by the DPPH Radical Assay

DPPH assay was conducted to assess the reducing power of the RB extracts by different solvents. The EC50 was expressed as equivalent of RB extract in mg/mL.
EC50 of 0.26 and 0.18 mg/mL were obtained for black RB DES1 and DES2 extracts respectively (p < 0.01). In comparison, higher EC50 of 0.46 and 0.36 mg/mL were obtained for red RB DES1 and DES2 extracts, respectively (p < 0.01).
Two conclusions can be drawn from these results:
(1) Whatever the DES, black RB extracts have higher capacity to reduce the DPPH radical, i.e., lower EC50, in comparison with red RB extracts (p < 0.01). Such higher reducing capacity is coherent with black RB highest load in PCs [47]. We must precise that at concentrations of black RB extracts of 0.50 mg/mL, total reduction of DPPH was already reached and very likely explained by the high PC content of the extract. A review conducted by Goufo and Trindade [48] has similarly shown that the EC50 of pigmented RB was 16 times lower than of nonpigmented RB extracts. Other studies have shown that the highest antioxidant capacity of pigmented rice compared to nonpigmented rice [16] was due to the presence of proanthocyanidins and anthocyanins. Such compounds would be abundant in red rice [49] but even more in black rice [50,51].
(2) Whatever the type of RB, DES1 RB extracts showed the best results in comparison to DES2 RB extracts. Control experiments were also conducted using DES only to determine their individual contribution to DPPH reduction. These control experiments pointed out that DES solvent on their own were responsible for 16% and 37%, DES1 and DES2 respectively, of the reducing capacity in these extracts.

3. Materials and Methods

3.1. Chemicals

Choline chloride (≥99%), lactic acid (∼90%), 1.2-propanediol (≥99%), ethanol (reagent), methanol (CHROMASOLV®  ≥ 99.9%), water (CHROMASOLV® Plus grade HPLC), 2,2,1-diphenyl-1-picrylhydrazyl (DPPH), 6-hydroxy-2,5,7,8-tetramethylchroman-2-carboxylic acid (Trolox) gallic, ferulic, p-coumaric, sinapic and vanillic acids were obtained from Sigma-Aldrich (St. Louis, MO, USA).

3.2. Pigmented Rice Brans

Red (cv. TamTam) and black (cv. Artemide) rice grains cultivated in Camargue were provided by the “Centre Français du Riz” (Arles, France). Grains (5 kg) were subject to dry abrasion using a DMS 500 huller (Electra, Poudenas, France) to obtain a fine bran fraction corresponding to between 4–7% of the grain mass. Acronyms were used to identify the analyzed rice bran extracts throughout the document: red rice conventional (RRC), red rice DES1 (RRDES1), red rice DES2 (RRDES2), black rice conventional (BRC), black rice DES1 (BRDES1), black rice DES2 (BRDES2).

3.3. Preparation of Deep Eutectic Solvents

Two choline-chloride based DES in combination with lactic acid or 1.2-propanediol were selected based on GRAS components and according to the previous study from Ruesgas-Ramón et al., 2017. DES were prepared by heating (60 °C), agitating (400 rpm) (IKA KS 4000 I control, Staufen, Germany) and mixing the components at the corresponding mole ratios (Table 1) in a closed bottle for 45 min until a clear liquid is formed [23]. The water content (Coulometer Karl Fisher GRS 2000, KF TITRATOR, Bioblock scientific, France), water activity (aw) (Aqualab, Decagon Devices Inc., Pullman, WA, USA) and pH (EcoScan pH 5 Palmtop pH-meter, Legallais, Montferrier-sur-Lez, France) were determined (Table 2).

3.4. Extraction of Phenolic Compounds from Rice Brans

One hundred mg of pigmented RB were extracted in triplicate with 2 mL of DES1 or DES2 or conventional solvent (ethanol/water, 60:40 v/v) in a closed amber glass flask in an orbital agitation (400 rpm, 40 °C, 25 min) (Cimarec Thermo Scientific Poly 15, Legallais, Montferrier-sur-Lez, France). The samples were cooled to room temperature (~20 °C) and centrifuged for 5 min at 4000 rpm (CR412 centrifuge; Jouan, Winchester, VA, USA). The supernatant was filtered with a cellulose filter (0.45 µm) (Minisart Legallais, Montferrier-sur-Lez, France), dried under nitrogen stream and then dried extracts were stored at −20 °C.

3.5. HPLC-DAD Characterization

The obtained extracts were analyzed in triplicate in a HPLC (LC-20AD with oven: CTO-10ASvp and detector DAD SPO-M20, Shimadzu, Noisiel, France) at 280 nm. Conventional solvent extracts were dissolved in a MeOH/water (2:1, v/v) and filtered on 0.45 μm cellulose filter (Minisart Legallais, Montferrier-sur-Lez, France). Those obtained by DES were diluted five times in water and then injected. The separation was carried out on a C18 column (Kinetex High purity, 5 µm, 100 A, 250 × 4.6 mm, Thermo Electron, Burlington, MA, USA) with the mobile phase A (MeOH, 0.1% acetic acid) and B (water, 0.1% acetic acid), flow rate of 1 mL/min and gradient method: 0–5 min: isocratic at 10% of B; 5–20 min: linear gradient up to 100% B; 20–30 min isocratic at 100% B; 30–35 min linear gradient up to 10% B; 35–42 min: equilibration at 10% B. Quantification of phenolic acids was performed by using a standard calibration curve made with different concentrations (0.01–3 mg/mL) of pure ferulic, p-coumaric, sinapic, vanillic and gallic acids.

3.6. Metabolomic Analysis and Data Processing

Analyses were performed by UPLC Acquity (Waters, Milford, CT, USA) coupled to the Xevo G2-S Q-Tof (Waters, Manchester, UK) equipped with an electrospray ionization source and acquired using a multiplexed MS/MS acquisition with alternating low and high energy acquisition (MSE). Data were processed by Progenesis QI (NonLinear Dynamics, Waters) with the PubChem and Phenol Explorer online database according to Santos, et al. [52].

3.7. DPPH Assessment of the Reducing Power of Extracts

The DPPH scavenging antioxidant activity was estimated according to the traditional method [29] but adapted to microplate assay (TECAN, Infinite M1000 PRO, Gröedig, Austria). Briefly, 20 μL of the samples and 180 μL of a methanolic solution of DPPH (final concentration in well 150 µM) were added on microplates (ThermoFischer, Courtaboeuf, France) and the absorbance was immediately read at 515 nm, every 5 min for the first 20 min, and then every 20 min for 1 h. Blanks with DES or ethanol/water 60:40 v/v were carried out to evaluate and to subtract the reducing activity of solvents. EC50 corresponds to the concentration of rice bran extracts (mg/mL) able to reduce 50% of the initial DPPH. Assay was performed at 37 °C in triplicate for each sample.

3.8. Statistics Analysis

EZInfo v. 3.0.3 (Umetrics, Sweden) was used for the analysis of metabolomics multivariate data. Principal Component Analysis (PCA) using pareto-scaling [53] and S-plot by Orthogonal Partial Least Squares Discriminant Analysis (OPLS-DA) were generated from UPLC-MSE data. Matrices of data gathered all compounds’ abundances for each type of solvent and the type of pigmented rice. The HPLC and DPPH data were submitted to one-way ANOVA (Tukey, p < 0.05) by using R statistics (v 4.0.2).

4. Conclusions

In the present study, complementary techniques were applied to characterize pigmented RB extracts obtained either with conventional or DES extraction procedures. Use of modern analytical tools allowed the quantification of the most typical phenolic acids in rice as well as the description of the PC present in the different extracts. This approach underlined the high extraction capacity of DES, and most importantly, the extraction specificity of acidic DES for certain PCs. Whatever the solvent (conventional or DES), black RB remained the most enriched in PCs, and the source of RB with the highest potential for applications in human nutrition. To the best of our knowledge, this work was the first omics approach to characterize PCs in the pigmented RB DES extracts. In addition, a DPPH assay revealed that these pigmented RB extracts in DES presented an interesting reducing power, which opens the way to conceive new-pigmented RB formulations with these innovative liquid mixtures. This approach of extraction and omic characterization of extracts should be repeated on other pigmented rice varieties including purple, black-purple, orange or brown variants, known for their high load in flavonoids, anthocyanin and proanthocyanidin [14]. Therefore, more extensive works are currently under investigation to develop dietary or pharmaceutical formulations to improve the health benefits associated with the presence of these bioactive compounds.

Author Contributions

Conceptualization, M.C.B.S., N.B., V.L.-P., M.S.L.F. and C.B.-L.; data curation, M.C.B.S., N.B. and M.R.; formal analysis, M.C.B.S., B.B. and M.R.; funding acquisition, L.C.C., M.S.L.F. and C.B.-L.; investigation, M.C.B.S., N.B., B.B. and M.R.; methodology, M.C.B.S., B.B. and M.R.; project administration, M.S.L.F. and C.B.-L.; resources, V.M., V.L.-P., P.V., L.C.C., M.S.L.F. and C.B.-L.; supervision, E.D., P.V., M.S.L.F. and C.B.-L.; validation, M.C.B.S., E.D., B.B., V.M., V.L.-P., P.V., L.C.C., E.P.R., M.S.L.F. and C.B.-L.; visualization, M.C.B.S., N.B., M.S.L.F. and C.B.-L.; writing—original draft, M.C.B.S.; writing—review and editing, M.C.B.S., N.B., E.D., V.M., V.L.-P., P.V., E.P.R., M.S.L.F. and C.B.-L. All authors have read and agreed to the published version of the manuscript.

Funding

This research was financed by the Foundation for Research Support of State of Rio de Janeiro (FAPERJ) (26/010.100.988/2018; 26/202.709/2018; 26/201.848/2019), National Council for Scientific and Technological Development (CNPq) (427.116/2018; 310.34/2019-4) and supported by UNIRIO, Coordination for Improvement of Personnel with Higher Education (CAPES) (financial code 001). This work was also financed by a cofunding from TRANSFORM INRAE (FRANCE) department.

Institutional Review Board Statement

Not applicable.

Informed Consent Statement

Not applicable.

Data Availability Statement

No new data were created or analyzed in this study. Data sharing is no applicable to this article.

Acknowledgments

The authors are grateful to the Centre Français du Riz (Arles, France) for providing rice grains and to G. Cros (IBMM, UMR CNRS 5247, Faculté de Pharmacie Montpellier) for its gift of collected and collecting samples. The authors are also grateful to L. Ollier (now in UMR QualiSud, CIRAD, Montpellier) for her help in preparation of bran samples. The authors thank the Coordenação de Aperfeiçoamento de Pessoal de Nível Superior (CAPES, code 001), Fundação de Amparo à Pesquisa do Estado do Rio de Janeiro (FAPERJ, 26/010.100988/2018; 26/202/709–2018; 26/201.848/2019) and National Council for Scientific Technological Development (CNPq) (310343/2019-4) for the financial support.

Conflicts of Interest

The authors declare no conflict of interest.

References

  1. Borresen, E.C.; Ryan, E.P. Chapter 22—Rice Bran: A Food Ingredient with Global Public Health Opportunities. In Wheat and Rice in Disease Prevention and Health; Watson, R.R., Preedy, V.R., Zibadi, S., Eds.; Academic Press: San Diego, CA, USA, 2014; pp. 301–310. [Google Scholar]
  2. Li, K.J.; Borresen, E.C.; Jenkins-Puccetti, N.; Luckasen, G.; Ryan, E.P. Navy Bean and Rice Bran Intake Alters the Plasma Metabolome of Children at Risk for Cardiovascular Disease. Front. Nutr. 2018, 4, 71. [Google Scholar] [CrossRef]
  3. Khir, R.; Pan, Z. Chapter 2—Rice. In Integrated Processing Technologies for Food and Agricultural By-Products; Pan, Z., Zhang, R., Zicari, S., Eds.; Academic Press: Cambridge, MA, USA, 2019; pp. 21–58. [Google Scholar]
  4. Tong, C.; Bao, J. Rice lipids and rice bran oil. In Rice; Elsevier: Amsterdam, The Netherlands, 2019; pp. 131–168. [Google Scholar]
  5. Zarei, I.; Luna, E.; Leach, J.E.; McClung, A.; Vilchez, S.; Koita, O.; Ryan, E.P. Comparative Rice Bran Metabolomics across Diverse Cultivars and Functional Rice Gene–Bran Metabolite Relationships. Metabolites 2018, 8, 63. [Google Scholar] [CrossRef] [Green Version]
  6. Goodyear, A.; Kumar, A.; Ehrhart, E.; Swanson, K.S.; Grusak, M.A.; Leach, J.E.; Dow, S.W.; McClung, A.; Ryan, E.P. Dietary rice bran supplementation prevents Salmonella colonization differentially across varieties and by priming intestinal immunity. J. Funct. Foods 2015, 18, 653–664. [Google Scholar] [CrossRef] [Green Version]
  7. Nealon, N.; Worcester, C.; Ryan, E.P. Lactobacillus paracaseimetabolism of rice bran reveals metabolome associated withSalmonellaTyphimurium growth reduction. J. Appl. Microbiol. 2017, 122, 1639–1656. [Google Scholar] [CrossRef]
  8. Zarei, I.; Oppel, R.C.; Borresen, E.C.; Brown, R.J.; Ryan, E.P. Modulation of plasma and urine metabolome in colorectal cancer survivors consuming rice bran. Integr. Food Nutr. Metab. 2019, 6. [Google Scholar] [CrossRef] [Green Version]
  9. Zaupa, M.; Calani, L.; Del Rio, D.; Brighenti, F.; Pellegrini, N. Characterization of total antioxidant capacity and (poly)phenolic compounds of differently pigmented rice varieties and their changes during domestic cooking. Food Chem. 2015, 187, 338–347. [Google Scholar] [CrossRef] [PubMed]
  10. Pang, Y.; Ahmed, S.; Xu, Y.; Beta, T.; Zhu, Z.; Shao, Y.; Bao, J. Bound phenolic compounds and antioxidant properties of whole grain and bran of white, red and black rice. Food Chem. 2018, 240, 212–221. [Google Scholar] [CrossRef]
  11. Shao, Y.; Xu, F.; Sun, X.; Bao, J.; Beta, T. Identification and quantification of phenolic acids and anthocyanins as antioxidants in bran, embryo and endosperm of white, red and black rice kernels (Oryza sativa L.). J. Cereal Sci. 2014, 59, 211–218. [Google Scholar] [CrossRef]
  12. Zhang, H.; Shao, Y.; Bao, J.; Beta, T. Phenolic compounds and antioxidant properties of breeding lines between the white and black rice. Food Chem. 2015, 172, 630–639. [Google Scholar] [CrossRef] [PubMed]
  13. Deng, G.-F.; Xu, X.-R.; Zhang, Y.; Li, D.; Gan, R.-Y.; Li, H.-B. Phenolic Compounds and Bioactivities of Pigmented Rice. Crit. Rev. Food Sci. Nutr. 2013, 53, 296–306. [Google Scholar] [CrossRef] [PubMed]
  14. Mbanjo, E.G.N.; Kretzschmar, T.; Jones, H.; Ereful, N.; Blanchard, C.; Boyd, L.A.; Sreenivasulu, N. The Genetic Basis and Nutritional Benefits of Pigmented Rice Grain. Front. Genet. 2020, 11, 229. [Google Scholar] [CrossRef] [Green Version]
  15. Zhang, M.W.; Zhang, R.F.; Zhang, F.X.; Liu, R.H. Phenolic Profiles and Antioxidant Activity of Black Rice Bran of Different Commercially Available Varieties. J. Agric. Food Chem. 2010, 58, 7580–7587. [Google Scholar] [CrossRef]
  16. Chakuton, K.; Puangpronp, D.; Nakornriab, M. Phytochemical Content and Antioxidant Activity of Colored and Non-colored Thai Rice Cultivars. Asian J. Plant. Sci. 2012, 11, 285–293. [Google Scholar] [CrossRef]
  17. Petroni, K.; Landoni, M.; Tomay, F.; Calvenzani, V.; Simonelli, C.; Cormegna, M. Proximate Composition, Polyphenol Content and Anti-inflammatory Properties of White and Pigmented Italian Rice Varieties. Univers. J. Agric. Res. 2017, 5, 312–321. [Google Scholar] [CrossRef] [Green Version]
  18. Hansakul, P.; Junmarkho, K. Thai pigmented rice bran extracts inhibit production of superoxide, nitric oxide radicals and inducible nitric oxide synthase in cellular models. Asian Pac. J. Trop. Biomed. 2019, 9, 291. [Google Scholar] [CrossRef]
  19. Sunthonkun, P.; Palajai, R.; Somboon, P.; Chua, L.S.; Ungsurangsri, M.; Soontorngun, N. Life-span extension by pigmented rice bran in the model yeast Saccharomyces cerevisiae. Sci. Rep. 2019, 9, 1–16. [Google Scholar] [CrossRef] [Green Version]
  20. Khammanit, R.; Lomarat, P.; Anantachoke, N.; Sato, V.H.; Ungsurungsie, M.; Mangmool, S. Inhibition of Oxidative Stress through the Induction of Antioxidant Enzymes of Pigmented Rice Bran in HEK-293 Cells. Nat. Prod. Commun. 2017, 12, 1934578X1701200727. [Google Scholar] [CrossRef] [Green Version]
  21. Peanparkdee, M.; Patrawart, J.; Iwamoto, S. Effect of extraction conditions on phenolic content, anthocyanin content and antioxidant activity of bran extracts from Thai rice cultivars. J. Cereal Sci. 2019, 86, 86–91. [Google Scholar] [CrossRef]
  22. Ghasemzadeh, A.; Jaafar, H.Z.; Juraimi, A.S.; Tayebi-Meigooni, A. Comparative Evaluation of Different Extraction Techniques and Solvents for the Assay of Phytochemicals and Antioxidant Activity of Hashemi Rice Bran. Molecules 2015, 20, 10822–10838. [Google Scholar] [CrossRef] [Green Version]
  23. Ramon, B.M.R.; Figueroa-Espinoza, M.C.; Durand, E. Application of Deep Eutectic Solvents (DES) for Phenolic Compounds Extraction: Overview, Challenges, and Opportunities. J. Agric. Food Chem. 2017, 65, 3591–3601. [Google Scholar] [CrossRef]
  24. Huang, Y.; Feng, F.; Jiang, J.; Qiao, Y.; Wu, T.; Voglmeir, J.; Chen, Z.-G. Green and efficient extraction of rutin from tartary buckwheat hull by using natural deep eutectic solvents. Food Chem. 2017, 221, 1400–1405. [Google Scholar] [CrossRef]
  25. Dai, Y.; Rozema, E.; Verpoorte, R.; Choi, Y.H. Application of natural deep eutectic solvents to the extraction of anthocyanins from Catharanthus roseus with high extractability and stability replacing conventional organic solvents. J. Chromatogr. A 2016, 1434, 50–56. [Google Scholar] [CrossRef]
  26. Dai, Y.; Verpoorte, R.; Choi, Y.H. Natural deep eutectic solvents providing enhanced stability of natural colorants from safflower (Carthamus tinctorius). Food Chem. 2014, 159, 116–121. [Google Scholar] [CrossRef]
  27. Cifuentes, A. Food analysis and Foodomics. J. Chromatogr. A 2009, 1216, 7109. [Google Scholar] [CrossRef] [Green Version]
  28. Herrero, M.; Simó, C.; García-Cañas, V.; Ibáñez, E.; Cifuentes, A. Foodomics: MS-based strategies in modern food science and nutrition. Mass Spectrom. Rev. 2011, 31, 49–69. [Google Scholar] [CrossRef] [Green Version]
  29. Brand-Williams, W.; Cuvelier, M.; Berset, C. Use of a free radical method to evaluate antioxidant activity. LWT 1995, 28, 25–30. [Google Scholar] [CrossRef]
  30. Sumner, L.W.; Amberg, A.; Barrett, D.; Beale, M.; Beger, R.; Daykin, C.A.; Fan, T.W.M.; Fiehn, O.; Goodacre, R.; Griffin, J.L.; et al. Proposed minimum reporting standards for chemical analysis. Chemical Analysis Working Group (CAWG). Metabolomics Standards Initiative (MSI). Metabolomics 2007, 3, 211–221. [Google Scholar] [CrossRef] [PubMed] [Green Version]
  31. Schymanski, E.L.; Jeon, J.; Gulde, R.; Fenner, K.; Ruff, M.; Singer, H.P.; Hollender, J. Identifying Small Molecules via High Resolution Mass Spectrometry: Communicating Confidence. Environ. Sci. Technol. 2014, 48, 2097–2098. [Google Scholar] [CrossRef]
  32. Pereira-Caro, G.; Cros, G.; Yokota, T.; Crozier, A. Phytochemical Profiles of Black, Red, Brown, and White Rice from the Camargue Region of France. J. Agric. Food Chem. 2013, 61, 7976–7986. [Google Scholar] [CrossRef] [PubMed]
  33. Chen, L.-J.; Hrazdina, G. Structural aspects of anthocyanin-flavonoid complex formation and its role in plant color. Phytochemistry 1981, 20, 297–303. [Google Scholar] [CrossRef]
  34. Loypimai, P.; Moongngarm, A.; Chottanom, P. Extraction solvents affecting phytochemicals in food colorant prepared from purple glutinous rice bran. Appl. Biol. Chem. 2017, 60, 181–189. [Google Scholar] [CrossRef]
  35. Gakh, A.A.; Anisimova, N.Y.; Kiselevsky, M.V.; Sadovnikov, S.V.; Stankov, I.N.; Yudin, M.V.; Rufanov, K.A.; Krasavin, M.Y.; Sosnov, A.V. Dihydro-resveratrol—A potent dietary polyphenol. Bioorg. Med. Chem. Lett. 2010, 20, 6149–6151. [Google Scholar] [CrossRef]
  36. Luo, C.; Zou, L.; Sun, H.; Peng, J.; Gao, C.; Bao, L.; Ji, R.; Jin, Y.; Sun, S. A Review of the Anti-Inflammatory Effects of Rosmarinic Acid on Inflammatory Diseases. Front. Pharmacol. 2020, 11, 153. [Google Scholar] [CrossRef]
  37. Tang, B.; Peng, C.-Y.; Darko, K.O.; Tao, T.; Huang, Y.; Su, Q.; Yang, X. Paeonol, a Powerful Natural Product with Broad Biological Spectra by Inhibiting Inflammatory Pathway. Curr. Tradit. Med. 2016, 2, 72–79. [Google Scholar] [CrossRef]
  38. Park, B.-Y.; Oh, S.-R.; Ahn, K.-S.; Kwon, O.-K.; Lee, H.-K. (–)-Syringaresinol inhibits proliferation of human promyelocytic HL-60 leukemia cells via G1 arrest and apoptosis. Int. Immunopharmacol. 2008, 8, 967–973. [Google Scholar] [CrossRef] [PubMed]
  39. Janvier, M.; Hollande, L.; Jaufurally, A.S.; Pernes, M.; Ménard, R.; Grimaldi, M.; Beaugrand, J.; Balaguer, P.; Ducrot, P.-H.; Allais, F. Syringaresinol: A Renewable and Safer Alternative to Bisphenol A for Epoxy-Amine Resins. ChemSusChem 2017, 10, 738–746. [Google Scholar] [CrossRef] [PubMed]
  40. Zha, J.; Koffas, M.A. Production of anthocyanins in metabolically engineered microorganisms: Current status and perspectives. Synth. Syst. Biotechnol. 2017, 2, 259–266. [Google Scholar] [CrossRef]
  41. Lv, P.; Yu, J.; Xu, X.; Lu, T.; Xu, F. Eriodictyol inhibits high glucose-induced oxidative stress and inflammation in retinal ganglial cells. J. Cell. Biochem. 2019, 120, 5644–5651. [Google Scholar] [CrossRef]
  42. Li, C.-Z.; Jin, H.-H.; Sun, H.-X.; Zhang, Z.-Z.; Zheng, J.-X.; Li, S.-H.; Han, S.-H. Eriodictyol attenuates cisplatin-induced kidney injury by inhibiting oxidative stress and inflammation. Eur. J. Pharmacol. 2016, 772, 124–130. [Google Scholar] [CrossRef]
  43. Rajan, V.K.; Muraleedharan, K.; Hussan, K.P.S. Chapter 5—Structural Evaluation and Toxicological Study of a Bitter Masking Bioactive Flavanone, ‘Eriodictyol’. In Polyphenols: Prevention and Treatment of Human Disease, 2nd ed.; Watson, R.R., Preedy, V.R., Zibadi, S., Eds.; Academic Press: Cambridge, MA, USA, 2018; pp. 45–60. [Google Scholar]
  44. Shao, Y.; Xu, F.; Sun, X.; Bao, J.; Beta, T. Phenolic acids, anthocyanins, and antioxidant capacity in rice (Oryza sativa L.) grains at four stages of development after flowering. Food Chem. 2014, 143, 90–96. [Google Scholar] [CrossRef]
  45. Sumczynski, D.; Kotásková, E.; Družbíková, H.; Mlček, J. Determination of contents and antioxidant activity of free and bound phenolics compounds and in vitro digestibility of commercial black and red rice (Oryza sativa L.) varieties. Food Chem. 2016, 211, 339–346. [Google Scholar] [CrossRef]
  46. Irakli, M.; Samanidou, V.F.; Biliaderis, C.G.; Papadoyannis, I.N. Simultaneous determination of phenolic acids and flavonoids in rice using solid-phase extraction and RP-HPLC with photodiode array detection. J. Sep. Sci. 2012, 35, 1603–1611. [Google Scholar] [CrossRef]
  47. Goufo, P.; Trindade, H. Factors influencing antioxidant compounds in rice. Crit. Rev. Food Sci. Nutr. 2016, 57, 893–922. [Google Scholar] [CrossRef]
  48. Goufo, P.; Trindade, H. Rice antioxidants: Phenolic acids, flavonoids, anthocyanins, proanthocyanidins, tocopherols, tocotrienols, γ -oryzanol, and phytic acid. Food Sci. Nutr. 2014, 2, 75–104. [Google Scholar] [CrossRef]
  49. Sabir, A.; Rafi, M.; Darusman, L.K. Discrimination of red and white rice bran from Indonesia using HPLC fingerprint analysis combined with chemometrics. Food Chem. 2017, 221, 1717–1722. [Google Scholar] [CrossRef]
  50. Chen, X.Q.; Nagao, N.; Itani, T.; Irifune, K. Anti-oxidative analysis, and identification and quantification of anthocyanin pigments in different coloured rice. Food Chem. 2012, 135, 2783–2788. [Google Scholar] [CrossRef] [PubMed]
  51. Min, B.; McClung, A.M.; Chen, M.-H. Phytochemicals and Antioxidant Capacities in Rice Brans of Different Color. J. Food Sci. 2010, 76, C117–C126. [Google Scholar] [CrossRef]
  52. Santos, M.C.B.; Lima, L.R.D.S.; Nascimento, F.R.; Nascimento, T.P.D.; Cameron, L.C.; Ferreira, M.S.L. Metabolomic approach for characterization of phenolic compounds in different wheat genotypes during grain development. Food Res. Int. 2019, 124, 118–128. [Google Scholar] [CrossRef]
  53. van den Berg, R.A.; Hoefsloot, H.C.J.; Westerhuis, J.A.; Smilde, A.K.; Van Der Werf, M.J. Centering, scaling, and transformations: Improving the biological information content of metabolomics data. BMC Genom. 2006, 7, 142. [Google Scholar] [CrossRef] [Green Version]
Figure 1. Percentage of number of tentatively identifications by class of phenolic compounds in all types of extracts whatever the RB.
Metabolites 11 00110 g001
Figure 2. Venn diagrams of identified phenolic compounds by pigmented RB in the different extracts.
Metabolites 11 00110 g002
Figure 3. (A) Principal components analysis of PCs of pigmented RB extracted with conventional and deep eutectic solvents (DES) methods; (B) S-plots from Orthogonal Partial Least Squares Discriminant Analysis (OPLS-DA) modeling of conventional solvent (CS) extracts versus DES extracts. The loadings are represented by the respective numbers to each putative phenolic compound described in Table 2. Abbreviations: red rice conventional (RRC), red rice DES1 (RRDES1), red rice DES2 (RRDES2), black rice conventional (BRC), black rice DES1 (BRDES1), black rice DES2 (BRDES2).
Metabolites 11 00110 g003
Figure 4. Concentration (mg/100 g) of RB extracts in five typical phenolic acids found in cereals. (Figure on the top) Cumulated concentration of the five phenolic acids quantified in this study. Different lowercase letters between extracts indicate significant differences in cumulated concentration of the amount of the five phenolic acids (p < 0.05). An extract with "ab" means that this concentration doesn’t have a significant statistical difference with the compared concentrations which have the same letter (a and b). (Figure at the bottom) Quantification of gallic, vanillic, ferulic and p-coumaric/sinapic acids in RB extracts. Different lowercase letters indicate significant differences between red RB extracts for a given phenolic acid. Different uppercase letters: indicate significant differences between black RB extracts for a given phenolic acid (p < 0.05). Abbreviations: red rice conventional (RRC), red rice DES1 (RRDES1), red rice DES2 (RRDES2), black rice conventional (BRC), black rice DES1 (BRDES1), black rice DES2 (BRDES2).
Metabolites 11 00110 g004
Table 1. Putative identification of phenolic compounds (PCs) in pigmented rice bran (RB) extracts by UPLC-MSE.
Putative Compound[M – H]RT (min)Molecular FormulaScoreFSFragments /IntensityMEISBlack Rice BranRed Rice Bran
CSDES1DES2CSDES1DES2
1Gallic acid *169.01311.26C7H6O537.30Nd−6.8994.40
2Dihydroxybenzoic acid isomer I *153.01811.41C7H6O437.10Nd−8.2594.68
34-Hydroxymandelic acid/Vanillic acid isomer I167.03341.46C8H8O436.10Nd−9.5990.85
4Dihydroxybenzoic acid isomer II153.01801.48C7H6O437.10Nd−8.4694.67
5Caffeoylquinic acid isomer I353.08631.54C16H18O935.50Nd−4.1982.23
64-Hydroxymandelic acid/Vanillic acid isomer II167.03371.64C8H8O437.80Nd−7.8597.57
7Dihydroxybenzoic acid isomer III153.01791.64C7H6O436.70Nd−9.2593.70
8Apigenin 7-O-glucoside419.13511.73C21H24O936.20Nd0.7781.93
9Isorhamnetin/Rhamnetin/Nepetin315.04981.74C16H12O737.70Nd−3.9593.23
10Irilone297.03921.75C16H10O635.60Nd−4.2082.89
11Dihydro-p-coumaric acid/Methoxyphenylacetic acid165.05451.81C9H10O336.30Nd−7.4190.07
12Dihydroxybenzoic acid isomer IV153.01801.85C7H6O4380Nd−8.4699.40
13Eriodictyol isomer I287.05671.90C15H12O638.611.7165.0543 (19%)2.0583.77
14Esculetin177.01801.91C9H6O437.40Nd−7.5495.53
15Quercetin 3-O-glucoside isomer I463.08701.94C21H20O1237.40Nd−2.6990.16
16Syringic acid/Gallic acid ethyl ester/3,4-Dihydroxyphenyllactic acid197.04442.09C9H10O536.50Nd−6.0089.58
17Homovanillic acid/Dihydrocaffeic acid181.04942.13C9H10O437.60Nd−6.8595.91
18Myricetin317.02902.16C15H10O838.95.13124.0146 (17%), 123.0076 (11%)−4.0494.33
19Coumaroylquinic acid isomer I337.09162.27C16H18O843.220.7119.0488 (100%), 191.0549 (5%), 20111.0434 (2%)−3.7099.55
204-Hydroxymandelic acid/Vanillic acid isomer III167.03352.29C8H8O436.20Nd−9.0190.85
21Cyanidin 3-O-beta-D-sambubioside580.14882.38C26H29O15+36.20.631115.0401 (2%)9.4190.56
22Methylgallic acid183.02892.42C8H8O538.60Nd−5.2898.86
23Feruloylquinic acid isomer I367.10232.45C17H20O957.391134.0359 (100%), 193.0494 (29%), 200.0442 (25%), 117.0333 (14%), 123.0436 (7%), 155.0335 (2%)−3.1899.18
24Dihydroresveratrol229.08782.54C14H14O336.20Nd3.4385.26
25Scopoletin191.03322.54C10H8O4370Nd−9.0495.14
264-Hydroxymandelic acid/Vanillic acid isomer IV167.03372.56C8H8O436.50Nd−7.5390.85
274′-O-Methylepigallocatechin319.08092.58C16H16O735.50Nd−4.5482.64
28Feruloyl glucose355.10162.58C16H20O940.715.9177.0545 (41%)−5.0893.62
29Bergapten/Xanthoxin215.03352.60C12H8O444.936.8191.0333 (100%)−6.7895.46
30Psoralen185.02332.60C11H6O336.20Nd−6.2488.21
31(+)-Catechin *289.07052.67C15H14O635.70Nd−4.3883.74
32Kaempferide298.04652.69C16H11O6-39.420.9175.0388 (76%), 134.0360 (27%), 193.0127 (13%), 117.0330 (1%)−6.0182.88
33Caffeic acid *179.03352.72C9H8O4380Nd−7.9798.69
34Trihydroxyisoflavone269.04432.73C15H10O538.60Nd−4.6398.27
35Isorhamnetin 3-O-glucoside/Isorhamnetin 3-O-galactoside477.10212.75C22H22O1240.816.2429.0818 (1%), 59.0113 (1%)−3.6892.19
36Hydroxymatairesinol isomer I373.13032.77C20H22O743.228.9205.0494 (100%),223.0601 (62%), 179.0700 (12%), 221.0805 (6%), 181.0491 (4%), 193.0854 (1%), 105.0331 (1%)2.6790.02
37Syringaresinol isomer I417.15602.80C22H26O837.70Nd1.1789.93
38Dicaffeoylquinic acid515.12212.83C25H24O1238.45.72307.0909 (3%)4.9492.15
39Coumaroylquinic acid isomer II337.09172.84C16H18O845.232.1245.0803 (50%), 119.0486 (15%), 93.0327 (13%), 243.0651 (11%)−3.5698.01
40(-)-Epicatechin289.07002.84C15H14O646.948.8257.0438 (100%), 243.0651 (11%)−6.2392.53
414-Hydroxymandelic acid/Vanillic acid isomer V167.03372.90C8H8O451.675.8151.0385 (100%), 123.0437 (14%), 135.0435 (4%), 105.0332 (1%)−7.7990.85
423,4-Dihydroxyphenyllactic acid197.04412.98C9H10O544.234.6134.0357 (90%)−7.1894.67
43Feruloylquinic acid isomer II367.10232.99C17H20O942.717.5134.0357 (100%), 173.0443 (76%), 191.0546 (31%), 117.0330 (10%), 111.0436 (10%), 155.0332 (7%), 75.0065 (5%)−3.0399.41
44Rosmarinic acid359.07753.02C18H16O835.90Nd0.8580.69
45Quercetin 3-O-rutinoside/Kaempferol 3-O-sophoroside/Quercetin 3-O-rhamnosyl-galactoside/Kaempferol 3,7-O-diglucoside isomer I609.14463.21C27H30O16380Nd−2.4492.86
46Tetrahydroxyisoflavone isomer I285.03913.27C15H10O647.152.9151.0386 (100%)−4.7088.27
47Eriodictyol 7-O-glucoside449.10753.30C21H22O1145.734.3103.0386 (100%), 181.0498 (22%), 122.0359 (16%), 311.0760 (10%), 99.0075 (7%)−3.2497.82
48Dihydroxybenzoic acid isomer V153.01813.31C7H6O4380Nd−8.2299.29
49Quercetin 3-O-rutinoside/Kaempferol 3-O-sophoroside/Quercetin 3-O-rhamnosyl-galactoside/Kaempferol 3,7-O-diglucoside isomer II609.14543.38C27H30O1642.716.9300.0264 (8%)−1.1698.00
50Luteolin 7-O-rutinoside/Kaempferol 3-O-rutinoside/Chrysoeriol 7-O-apiosyl-glucoside593.14953.39C27H30O1537.11.66103.0387 (7%), 175.0600 (2%)−2.8187.33
51Didymin/Poncirin593.18843.40C28H34O1436.72.47103.0387 (100%), 175.0600 (23%)1.4182.63
52Salvianolic acid D237.03953.44C11H10O638.20Nd−3.8895.39
53p-coumaric acid *163.03893.47C9H8O340.812.3163.0388 (28%), 119.0488 (21%)−6.9799.39
54Phloridzin435.12773.48C21H24O1037.27.68103.0387 (100%)−4.4783.45
55Schisandrin B399.18353.51C23H28O637.30Nd5.3992.86
56Tectoridin461.10803.54C22H22O1141.816.4341.0654 (4%), 146.0341 (1%)−2.0095.23
57Glycitin445.11293.59C22H22O1044.329.7326.0777 (29%), 283.0593 (22%), 379.0769 (16%)−2.5194.59
58Isorhamnetin 3-O-rutinoside461.10673.63C22H22O1150.669.8324.0255 (100%), 279.0288 (29%), 99.0070 (7%), 73.0274 (5%)−4.8288.73
59Ferulic acid *193.04953.64C10H10O44010.6137.0590 (13%)−5.6896.05
60Paeoniflorin479.15493.66C23H28O1138.10Nd−2.0992.84
61Tetrahydroxyisoflavone isomer II285.03923.73C15H10O639.85.06117.0331 (9%), 105.0330 (4%), 132.0206 (3%)−4.3899.00
62Violanone315.08603.75C17H16O643.223.3165.0543 (32%)−4.4598.07
633,7-Dimethylquercetin/Jaceosidin/Tricin isomer I329.06543.80C17H14O737.40Nd−3.9791.62
64Diosmin607.16563.81C28H32O1538.61.8389.0229 (100%)−2.0493.78
65Tetrahydroxyisoflavone isomer III285.03933.88C15H10O638.40.795123.0074 (1%)−4.0395.99
66Schisantherin A535.20123.90C30H32O934.90.218191.0701 (1%)7.1482.26
67Gardenin B357.09683.91C19H18O747.451.3209.0445 (100%), 315.0861 (45%), 239.0552 (32%), 327.0860 (22%), 345.0952 (17%), 251.0550 (13%), 177.0547 (14%), 181.0491 (12%)−3.2489.72
68Hesperidin609.18203.93C28H34O15360.274161.0596 (4%)−0.7880.56
69Syringaldehyde181.04954.29C9H10O438.40Nd−6.1899.23
70Eriodictyol isomer II287.05494.34C15H12O638.13.22147.0071 (16%), 119.0123 (12%), 123.0075 (2%)−4.1992.29
713,7-Dimethylquercetin/Jaceosidin/Tricin isomer II329.06554.38C17H14O738.35.77122.0355 (3%), 146.0350 (3%)−3.7090.18
72Nobiletin401.12294.52C21H22O837.40Nd−3.1490.76
73Hydroxymatairesinol isomer II373.12814.62C20H22O738.12.26146.0343 (10%)−3.2391.85
74Syringaresinol isomer II417.15604.74C22H26O836.60Nd1.3284.73
75Isorhamnetin isomer I315.04954.79C16H12O749.459.6175.3038 (100%), 160.0152 (20%)−4.7592.69
76Tetrahydroxyisoflavone isomer V285.03935.01C15H10O642.721.6133.0280 (100%), 132.0207 (9%), 179.0343 (4%)−4.2196.95
773,7-Dimethylquercetin/Jaceosidin/Tricin isomer II329.06485.04C17H14O74010.8121.0281 (35%), 139.0387 (4%), 147.0434 (3%), 119.0121 (2%)−5.7896.01
78Quercetin301.03425.06C15H10O749.653.2151.0023 (100%), 121.0181 (35%), 178.9973 (19%)−3.8099.43
79Dihydroquercetin *303.04995.16C15H12O738.20Nd−3.6795.13
80Trihydroxyisoflavanone isomer II271.05955.38C15H12O537.40Nd−6.0994.02
81Isorhamnetin isomer II315.04985.56C16H12O740.16.44117.0334 (13%)−3.7398.49
826-Hydroxyluteolin/Morin301.03385.56C15H10O737.50Nd−5.3393.63
83Urolithin A227.03375.56C13H8O439.819183.0435 (100%), 182.0360 (24%), 167.0486 (7%)−5.4286.04
84Trihydroxyisoflavanone isomer III271.05985.64C15H12O5409.09119.0487 (100%)−4.9896.67
85Hesperetin/Homoeriodictyol301.07045.73C16H14O642.821.1193.0492 (23%), 134.0358 (19%), 164.0097 (7%), 149.0591 (6%)−4.4197.88
86Dihydroxykaempferol317.02905.75C15H10O84223.2271.0234 (100%), 107.0124 (11%)−4.1091.65
87Hispidulin299.05455.80C16H12O637.60Nd−5.5194.43
88Paeonol165.05456.71C9H10O336.40Nd−7.1490.07
89Rosmanol345.16886.72C20H26O537.40Nd−5.7493.66
Number of identifications# 79# 49# 58# 67# 16# 43
Metabolites 11 00110 i001
RT: retention time; FS: fragmentation score; ME: mass error; IS: isotope similarity; Nd: Not detected. Bold: reference standards; CS: conventional solvent. * identified by Zarei, Luna, Leach, McClung, Vilchez, Koita and Ryan [5].
Table 2. Composition of DES and measurement results Aw, Karl Fisher water content and pH.
Name# 1# 2# 3Molar RatioaWWater ContentpH
DES1Choline chloride1.2-propanediolWater1:1:10.51 ± 0.037.2 ± 0.55.42
DES2Choline chlorideLactic acid-1:100.29 ± 0.006.3 ± 0.25--
Abbreviations. aW = water activity, # = component, --: negative values linked to very acidic and specific medium.
Publisher’s Note: MDPI stays neutral with regard to jurisdictional claims in published maps and institutional affiliations.

