
Extracellular Vesicle Analysis by Paper Spray Ionization Mass Spectrometry


Department of Pathology, Immunology and Laboratory Medicine, University of Florida, Gainesville, FL 32610, USA
*
Author to whom correspondence should be addressed.
†
Current Affiliation: Department of Chemistry, Washington University in St. Louis, St. Louis, MO 63130, USA.
Metabolites 2021, 11(5), 308; https://0-doi-org.brum.beds.ac.uk/10.3390/metabo11050308
Submission received: 9 March 2021
/
Revised: 23 April 2021
/
Accepted: 6 May 2021
/
Published: 11 May 2021
(This article belongs to the Special Issue Reviews and Advances in Microbial Metabolomics)
Abstract
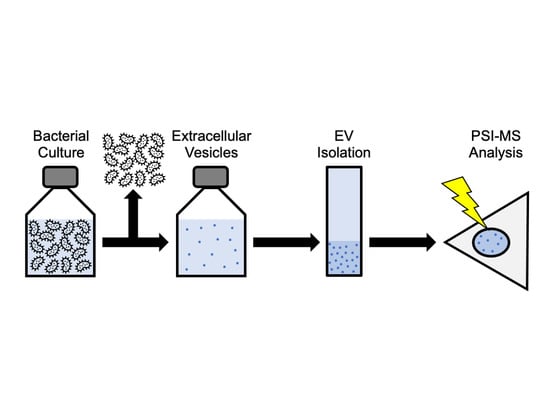
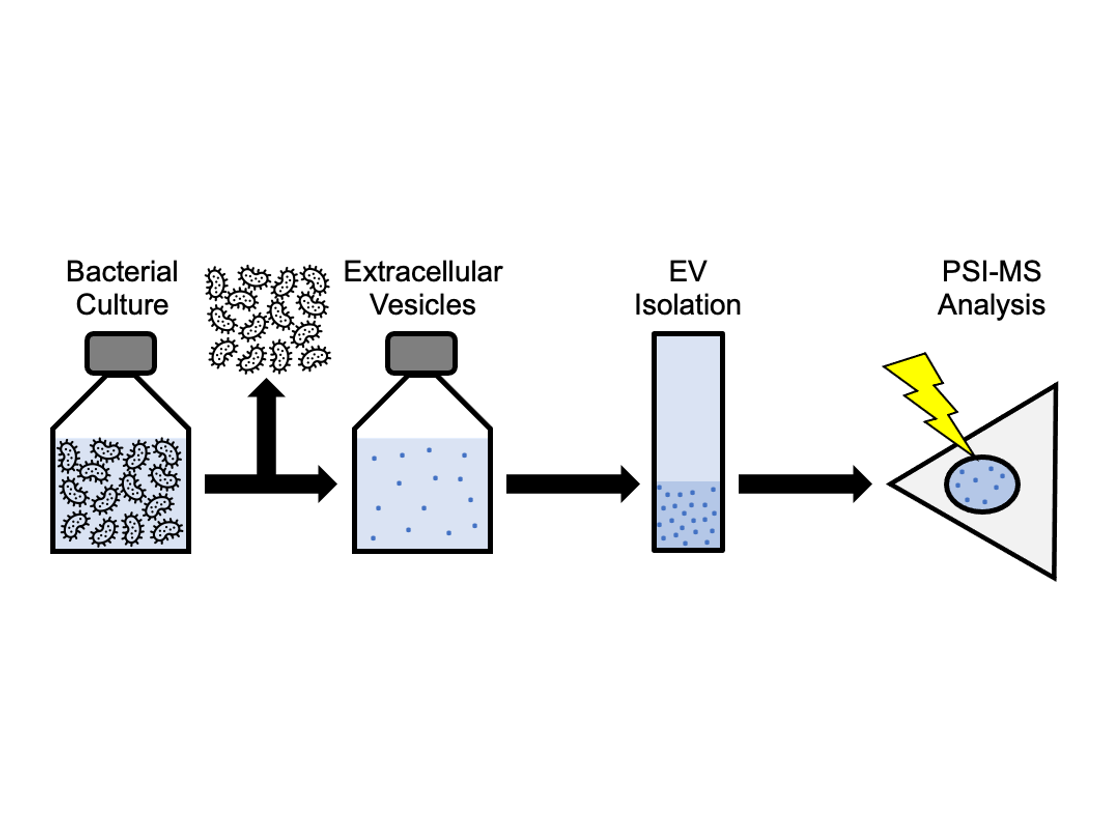
:Paper spray ionization mass spectrometry (PSI-MS) is a direct MS analysis technique with several reported bacterial metabolomics applications. As with most MS-based bacterial studies, all currently reported PSI-MS bacterial analyses have focused on the chemical signatures of the cellular unit. One dimension of the bacterial metabolome that is often lost in such analyses is the exometabolome (extracellular metabolome), including secreted metabolites, lipids, and peptides. A key component of the bacterial exometabolome that is gaining increased attention in the microbiology and biomedical communities is extracellular vesicles (EVs). These excreted structures, produced by cells in all domains of life, contain a variety of biomolecules responsible for a wide array of cellular functions, thus representing a core component of the bacterial secreted metabolome. Although previously examined using other MS approaches, no reports currently exist for a PSI-MS analysis of bacterial EVs, nor EVs from any other organism (exosomes, ectosomes, etc.). PSI-MS holds unique analytical strengths over other commonly used MS platforms and could thus provide an advantageous approach to EV metabolomics. To address this, we report a novel application representing, to our knowledge, the first PSI-MS analysis of EVs from any organism (using the human gut resident Oxalobacter formigenes as the experimental model, a bacterium whose EVs were never previously investigated). In this report, we show how we isolated and purified EVs from bacterial culture supernatant by EV-specific affinity chromatography, confirmed and characterized these vesicles by nanoparticle tracking analysis, analyzed the EV isolate by PSI-MS, and identified a panel of EV-derived metabolites, lipids, and peptides. This work serves as a pioneering study in the field of MS-based EV analysis and provides a new, rapid, sensitive, and economical approach to EV metabolomics.
1. Introduction
1.1. Paper Spray Ionization and Bacterial Metabolomics
Paper spray ionization mass spectrometry (PSI-MS) is an ambient MS approach that typically involves the direct analysis of a relatively small volume of unextracted biological sample deposited onto paper [1]. PSI-MS offers several advantages over conventional liquid chromatography (LC)-MS approaches, including minimal sample volume, reduced or eliminated dependence on extraction or other sample preparation, and shortened analysis time [2]. Due to these analytical advantages, PSI-MS has been applied as a novel tool in a variety of fields of research, including medicine [3], homeland security [4,5], microbiology [6], environmental management [7], quality control [8], toxicology [9], and many more. One PSI-MS application of increasing interest is the analysis of bacteria [6,10,11]. Over the years, a wide variety of MS technologies have been used for bacterial analysis [12,13,14,15,16,17,18], with PSI-MS emerging with an initial demonstration of genus and species-level analytical differentiation [6], and more recently, strain-level differentiation [10]. In most microbiology-focused metabolomics experiments, bacterial cells are often separated from their conditioned medium matrix and washed prior to MS analysis [19,20]. Such experiments provide a chemical characterization of the cellular unit, but information regarding the secreted metabolome, including all extracellular bacterium-derived metabolites, lipids, and peptides, is lost. This dimension of the molecular profile, often referred to as the metabolic footprint [21], is valuable to a bacterial metabolomics experiment as many microbes produce compounds that are predominantly secreted that may not be detected and identified in a strictly cellular analysis [22]. Secreted metabolites, together with free metabolites in the extracellular environment acted upon by bacteria, are cumulatively referred to as the exometabolome [23]. In vivo, the bacterial exometabolome is a major factor of the microbiome-derived exposome [24], making its characterization imperative to understand both the bacterium itself and its host-microbe biochemical relationship.
1.2. Bacterial Extracellular Vesicles
A primary component of the bacterial exometabolome is extracellular vesicles (EVs), membranous structures produced and secreted by cells in all three domains of life (Prokarya, Eukarya, and Archaea) [25]. EVs are believed to be ubiquitously produced among bacteria and have been characterized in many different species, including both Gram-negatives and Gram-positives [26], as well as in certain “atypical” bacteria not described by the widely used Gram’s method classification [27]. For the purpose of this discussion, we focus on bacteria that fit the conventional categorization as “Gram-positive” and “Gram-negative” by the presence of one or two lipid bilayer membranes in the cell envelope, respectively. Both classes possess a plasma membrane enclosing the cytoplasm, but Gram-negatives have an additional lipid membrane, known as the outer membrane, which lies beyond the peptidoglycan layer and encloses the periplasm [28]. Bacterial EVs are produced by budding from these lipid membranes and are described by the specific membranes from which they form. Gram-negatives produce two distinct types of EVs: outer membrane vesicles (OMVs) and outer-inner membrane vesicles (O-IMVs) [29]. OMVs consist of periplasmic contents coated in an external lipid membrane layer resembling the outer bacterial membrane from which these vesicles bud from the cell [30]. O-IMVs have two membranes, first originating from the cytoplasm with a plasma membrane-like coat, and then gathering a second layer from the periplasm and outer lipid membrane [29]. It was originally believed that only Gram-negatives produced EVs, but three decades later, it was discovered that Gram-positives also produce secreted vesicles, simply termed EVs; however, the mechanism by which they pass through the relatively thick peptidoglycan layer outside the plasma membrane to be secreted from the cell remains poorly understood [26,31,32]. EVs are rich in metabolites, lipids, and proteins and serve as a core mechanism of bacterial extracellular biochemical transport, communication, defense, and survival [33]. There is significant biomedical interest in the analysis of EVs as it has recently been shown that bacteria use them, among many other functions, to transfer genetic material and enzymes providing antibiotic resistance to other microorganisms [34,35]. Hence, these vesicles represent an important and medically relevant dimension of the exometabolome.
1.3. PSI-MS: A New Platform for Extracellular Vesicle Analysis
Despite strong literature representation of MS studies focused on eukaryotic EVs, particularly exosomes [36,37,38,39,40,41], MS applications to bacterial EVs are relatively limited. Among the reported MS bacterial EV analyses, nearly all are LC-MS-based proteomics studies [42,43]. Consequently, the field of bacterial EV metabolomics, as well as the application of direct MS analysis to bacterial EVs, is scarcely investigated. Among the few studies that have used direct MS analysis to study bacterial EVs, most have used matrix-assisted laser desorption ionization (MALDI) [42,44,45]. As described earlier, PSI-MS offers key analytical advantages over other analysis platforms. In comparison to LC-MS, PSI-MS offers reduced analysis time, lack of sample preparation, and minimal solvent consumption [1,2]. Although MALDI shares these qualities of expedited analysis and solvent conservation over LC-MS, reproducibility in its performance is dependent on proper pre-analytical application of a matrix to the sample [46], an additional step in sample handling and potential source of technical error that is not required in PSI-MS. Despite its analytical advantages over other commonly used approaches, the use of PSI-MS to analyze bacterial EVs, or EVs from any organism for that matter, has never been reported. A PSI-MS-based methodology for the analysis of bacterial EVs could provide a new, rapid, sensitive, and economical approach to analyzing the bacterial exometabolome. Hence, in this report, we describe the first PSI-MS application to bacterial exometabolomics by demonstrating the generation, isolation, confirmation, and PSI-MS analysis of bacterial EVs. The experimental model for our study was Oxalobacter formigenes (O. formigenes), a commensal, Gram-negative resident of the human intestinal microbiome with significant interest in the impact of its secreted metabolome on human health [47,48,49,50,51]. O. formigenes has been suggested to produce and expel a secretagogue compound that potentially curtails the risk of calcium oxalate kidney stone disease by stimulating a net intestinal secretion of oxalate, a precursor and risk factor for stone formation, which theoretically reduces its concentration in circulation and renal excretion [47,48,52,53,54]. A secreted bioactive compound of this nature could be expected to be contained in and expelled via EVs, so investigating vesicles produced by O. formigenes is of potentially notable importance. Until now, vesicles derived from O. formigenes had never been previously confirmed nor investigated in any manner, making this the initial reporting on EVs from this microorganism. This report details how we isolated EVs from O. formigenes culture supernatant by EV-specific affinity chromatography, confirmed and characterized these vesicles by nanoparticle tracking analysis (NTA), and analyzed the resulting EV isolate by PSI-MS using the Prosolia Velox 360 PSI source coupled to a Q Exactive Orbitrap MS. The novelty of this work is three-fold in that it demonstrates, to our knowledge, the first (1) PSI-MS analysis of EVs from any organism, (2) application of PSI-MS to bacterial exometabolomics, and (3) confirmation and investigation of EVs produced by O. formigenes. We believe this novel application of PSI-MS will serve the fields of metabolomics, exposomics, and analytical microbiology by providing a new platform for examining the chemical profile of EVs and the bacterial exometabolome.
2. Results and Discussion
2.1. Nanoparticle Tracking Analysis Confirms O. formigenes Extracellular Vesicles
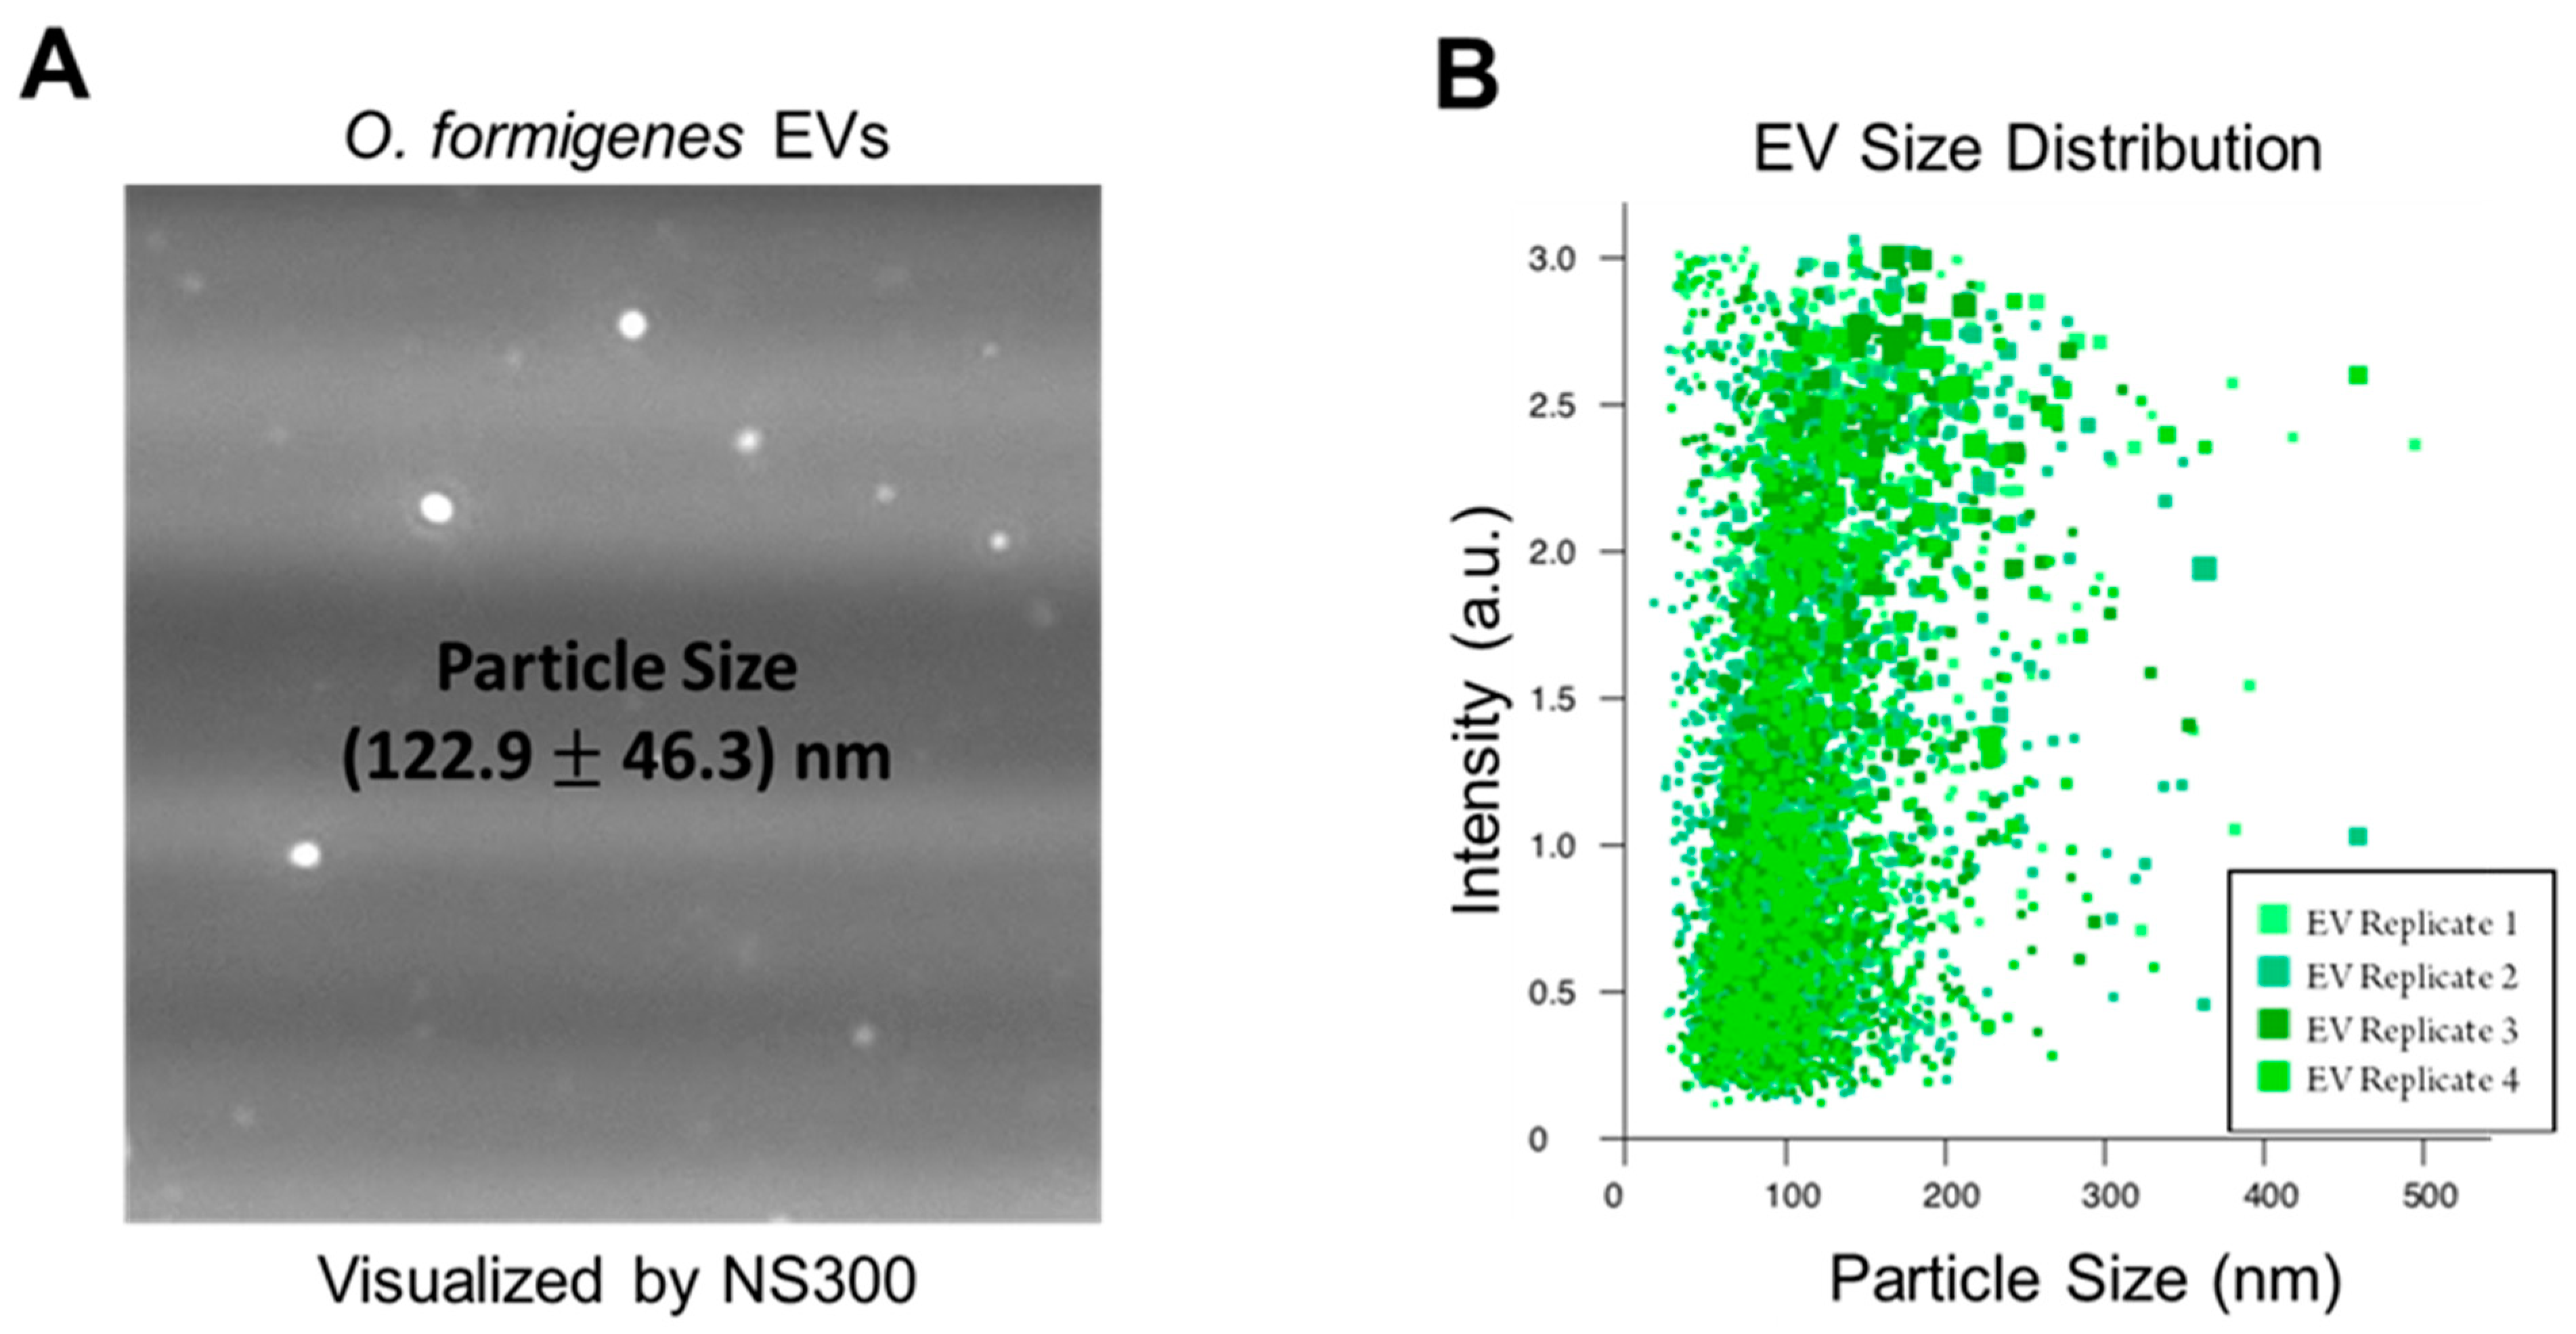
The production of EVs by O. formigenes in vitro was confirmed by NTA of our EV isolate from the bacterium’s culture supernatant. Figure 1A depicts an image of EVs from the O. formigenes isolate captured by the NanoSight NS300 (Malvern Panalytical, Malvern, United Kingdom). Vesicle size (average ± standard error) was measured as (122.9 ± 46.3) nm, which is consistent with the reported range for bacterial EVs [29,33], with D10 = 80.4 nm (meaning 10% of detected vesicles measured <80.4 nm), D50 = 111.5 nm, and D90 = 182.6 nm (Figure 1B). It is important to note that due to the fact that EVs are secreted for a variety of functions, their contents and characteristics, including particle size, could possibly be dependent on the specific environmental conditions the bacteria are experiencing and to which they are responding [55]. Therefore, the EV particle size (and size distribution) reported in this work should be taken only as a general reference as the effect of different media conditions, biotic and abiotic stressors, and other factors on the O. formigenes EV profile have not been investigated. Nevertheless, this serves as the first confirmation that O. formigenes produces these vesicles, and further work is needed to understand the specifics of their biological nature.
2.2. Extracellular Vesicle Metabolomics by PSI-MS
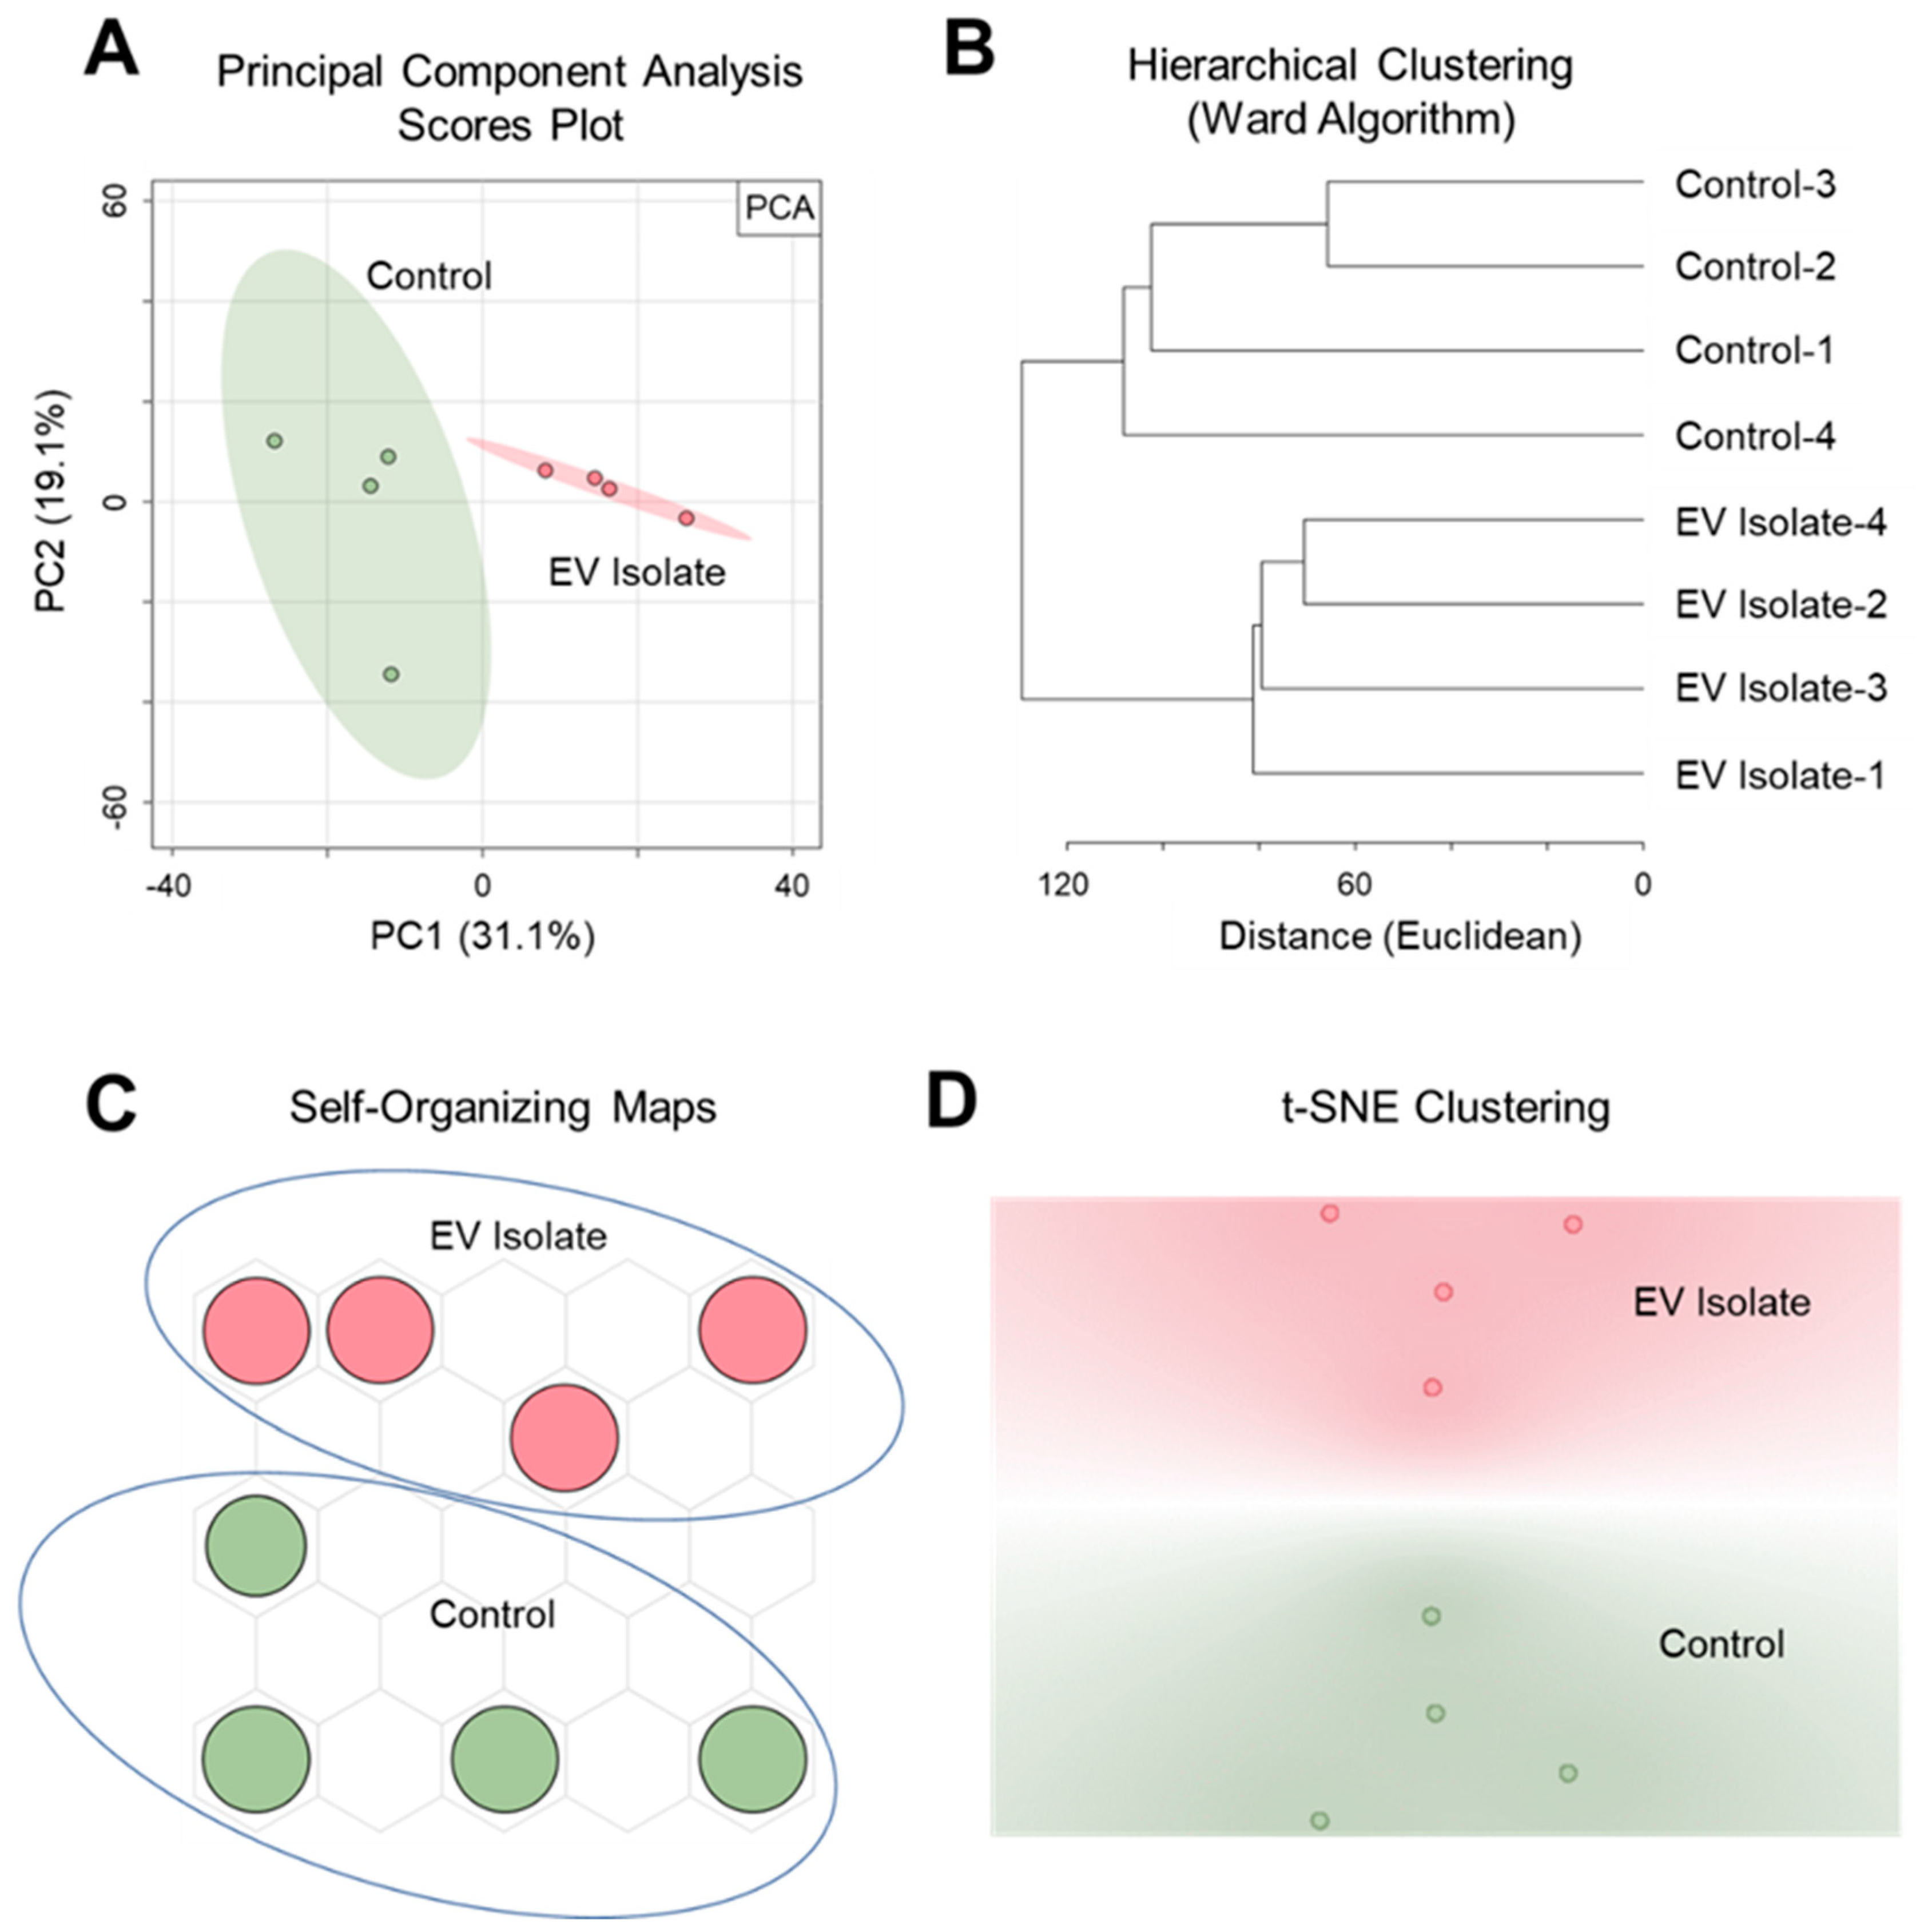
PSI-MS analysis was successful both in distinguishing the EV isolate from an EV-free control as well as detecting a profile of vesicle-derived biochemical features. Here, we show our findings at the level of both general trends and specific metabolites. Our discussion focuses mainly on features that were exclusively detected in the EV isolate since this report is a demonstration of the ability of PSI-MS to detect vesicle metabolites rather than a comprehensive profiling of the EV metabolome. To exhibit the capability of PSI-MS to analytically differentiate the EV isolate from an EV-free control, we performed four different unsupervised statistical clustering analyses on the whole-metabolome dataset. Using four independent multivariate statistical approaches—principal component analysis (PCA) (Figure 2A), hierarchical clustering (Figure 2B), self-organizing maps (Figure 2C), and t-distributed stochastic neighbor embedding (Figure 2D)—the global metabolomes of the EV isolate and control were clearly separated due to significant metabolomic differences in their detected chemical profiles, indicating the presence of EV-derived features. From this point, these EV features became the primary focus of our analysis. The data were filtered for features that were exclusively detected in the EV isolate and absent in the EV-free control. In total, we detected and putatively identified 50 EV-derived features, details for which are provided in Table 1. Identifications, all of which we report as Level 2 in accordance with the metabolomics standards initiative (MSI) [56], were made by MS1 accurate m/z matching (≤5 ppm) to the METLIN database [57], focusing search results on expected ions/adducts (e.g. [M + H]+, [M + H − H2O]+, [M + Na]+) of known and biologically relevant compounds. The returned database matches show a high level of diversity in the detected O. formigenes EV chemical profile with metabolite, lipid, and peptide representation. Here we discuss the potential biological implications of a selection of these EV features. Most of the EV features were identified as lipids and small peptides. This was somewhat expected since a major contributor to the signal from this sample would likely be from the vesicle membrane, which would represent the bacterial membrane (rich in lipids and proteins) from which it originated [30].
Regarding lipids, we detected representative species from several major classes, including (among others) phosphatidylethanolamines (PE (37:5)), PE (38:1)), phosphatidylglycerols (PG (28:2), PG (36:5), PG (37:5)), phosphatidic acid (PA (41:7)), phosphatidylinositol (PI (35:0)), and phosphatidylserine (PS (41:0)). Detection of these specific lipids is supported by the fact that the membranes of Gram-negative bacteria are largely composed of various phospholipids, particularly PEs [58]. Furthermore, our previous work profiling the lipidome of O. formigenes HC1 corroborates these results by showing detection of most of these same lipid classes [59]. Nearly 50% of the EV features we detected were small peptides, mostly of 2–4 amino acid residues. As with lipids, significant detection of peptides is expected since many will originate from the bacterial membrane [30]. Small peptides, particularly dipeptides, have been shown to play important roles in cell signaling [60,61,62], meaning the peptides detected in this study could serve in various capacities in cellular communication and metabolism. One example is polyglutamic acid, which has been reported to be produced outside the cell by several species of bacteria, including both Gram-negatives and Gram-positives, and is believed to have multiple potential functions ranging from survival to virulence [63].
A variety of small molecule metabolites (non-lipid, non-peptide) were also detected in the EV isolate. While many of the metabolites we detected are expected components of conventional metabolism, our discussion will focus on two that are known to be primarily associated with bacteria and have suggested connections to human health: phenylacetylglutamine (PAG) and violacein. PAG is a gut microbiome-derived metabolite formed from the conjugation of glutamine and phenylacetate primarily by colonic microbial metabolism [64]. It has been proposed to serve as a biomarker for the progression of chronic kidney disease (CKD) due to the association observed between increased serum PAG levels and advanced-stage CKD [65]. Violacein is a pigment compound known to be produced by a variety of Gram-negative bacteria [66,67]. It is associated with a wide scope of biological functions, including having antibiotic [68], antiviral [69], anti-inflammatory [70], antifungal [66], and antitumor [67] properties, among many others [71]. Hence, there is significant interest in bacteria that produce this compound due to its potential impact on human health. While O. formigenes, to our knowledge, has not been shown to exhibit the purple hue typically seen in bacteria that produce violacein at appreciable levels [66], it is possible that it is expressed in low abundance sufficient to deliver its intended biological effects but without producing a visible purple tint in culture. The presence of PAG and violacein in O. formigenes EVs supports the notion that vesicles from this microorganism delivered in the gut could influence the health of the human host as part of the microbiome-derived exposome. Hence, further work is needed to confirm the identification and biological function of these secreted biochemicals to clarify the EV-mediated host-microbe relationship.
3. Materials and Methods
3.1. Isolation of O. formigenes Extracellular Vesicles from Culture Supernatant
EV isolation from O. formigenes supernatant was performed using the ExoBacteria OMV Isolation Kit (System Biosciences, Palo Alto, CA, USA) using the following process. It is important to note that although the name of the kit suggests it is specific to OMVs, we confirmed with the manufacturer that it does not discriminate between specific subtypes of bacterial EVs in its isolation (in the case of this analysis, between OMVs and O-IMVs). Hence, it captures all bacterial EVs in the final purified isolate. The compositions of all reagents and buffers in the kit (EV binding resin, EV binding buffer, EV elution buffer) were proprietary and undisclosed by the manufacturer. O. formigenes (strain HC1, a human isolate) was cultured from frozen glycerol stock in modified Oxalobacter medium (containing 100 mM oxalate; derived from DSMZ-German Collection of Microorganisms and Cell Cultures Reference Medium 419) in 100 mL anaerobic bottles by combining 4 mL glycerol stock with 76 mL media for a 5% v/v inoculum. A control medium (uninoculated) was carried in-parallel and identically handled through all subsequent steps of this procedure for downstream comparative PSI-MS analysis. We refer to this as the “EV-free control.” After incubating at 37 °C for 24 h, a 5% v/v subculture was generated in the same manner and allowed to incubate for 24 h. From this subculture, 80 mL turbid O. formigenes culture was harvested, transferred to clean 50-mL PP vials (40 mL in each of 2 vials), and centrifuged at 5000× g for 20 min at 4 °C to remove bacterial cells. After pelleting the bacteria, supernatants were transferred to new 50-mL PP vials and again centrifuged at 5000× g for 20 min at 4 °C. Supernatants were removed, filtered using a 0.22 μm syringe filter to ensure complete removal of bacterial cells, and transferred into new 50-mL PP vials. An EV affinity chromatography binding column was prepared by adding 1 mL EV binding resin stationary phase and washing with 10 mL EV binding buffer for equilibration. After sufficient washing and allowing the binding buffer to completely flow through the column, the bottom of the column was sealed, and 20 mL supernatant was added. The top of the column was then sealed, and the unit was placed on a rotating rack for 30 min at 4 °C to allow for mixing and EV binding to the resin. After 30 min, the top and bottom of the column were unsealed, and the supernatant was allowed to flow through the resin. This was repeated 2 additional times so that a total of 60 mL of culture supernatant, in 3 rounds of 20 mL, was allowed to mix with the resin on the rotating rack for 30 min at 4 °C for enhanced EV binding. After the third round of EV binding, the supernatant was allowed to flow through the column, and the resin was flushed with 45 mL EV binding buffer. Following the flush, the bottom of the column was sealed, and 750 μL EV elution buffer was added. Columns were allowed to incubate at room temperature for 2 min with gentle agitation every 30 s, after which the bottom of the column was unsealed, and 750 μL eluent containing the EV isolate was collected in a 1.5 mL PP vial. Samples were aliquoted and frozen at −80 °C until needed for analysis.
3.2. Nanoparticle Tracking Analysis of O. formigenes Extracellular Vesicles
NTA is a commonly used analytical technique for the detection and measurement of EVs, which, among other functions, observes the rate of Brownian motion of nanoparticles in an aqueous solution and relates this information to particle size [72]. The EV isolate was analyzed by NTA using the NanoSight NS300 (Malvern Panalytical) by the University of Florida Interdisciplinary Center for Biotechnology Research Cytometry Core. Analysis parameters reported by the core are provided in Table S1.
3.3. PSI-MS Instrumentation, Methodology, and Analysis
Velox cartridges containing pre-cut triangular paper (Prosolia Inc., Indianapolis, IN, USA) were deposited with 15 µL of EV isolate or EV-free control (n = 4 replicates per group). For this purpose, a 3D-printed pipette stabilizer (Prosolia Inc.) was used to ensure reproducibility in sample loading. Samples were analyzed using the Prosolia Velox 360 PSI source connected to a Q Exactive Orbitrap MS (Thermo Scientific, Waltham, MA, USA). The wetting and spray solvent was 7:3 water:acetonitrile with 0.1% formic acid (v/v/v). To the backside of the cartridge, 80 µL was dispensed in 8 sequential applications of 10 µL to elute the sample to the tip of the paper. Then, to the tip of the paper, 15 µL was dispensed in 5 sequential applications of 3 µL. Analysis was performed in full scan positive ion mode at 140,000 mass resolution for 30 s after 9 s equilibration. Scan range was m/z 70–1000, spray voltage was 4 kV, and capillary temperature was 270 °C. The S-lens was set to 30% to reduce source fragmentation.
3.4. Data Processing, Statistics, and Feature Annotation
File conversion from the native .raw format to the open-source .mzXML format was performed using RawConverter [73]. MZmine 2 was used for data processing, including mass detection, alignment, smoothing, deconvolution, isotope grouping, join aligning, gap filling, duplicate peak filtering, and removing adducts and complexes [74]. The resulting data were exported as a feature list containing the signal intensity of each detected feature (defined as a unique m/z value) in each sample. Features were designated as EV-specific by meeting 2 criteria: (1) if they were detected with a signal intensity ≥ 1 × 10⁴ in all EV isolate samples, and (2) if they showed no detection (signal intensity = 0) in any of the control samples. For multivariate statistical analyses only, which we performed using MetaboAnalyst 4.0 [75] and Orange Data Mining [76], half the minimum signal intensity value in the dataset was used to replace non-detected signals [77], and the data were normalized to total ion signal and autoscaled [78]. Putative metabolite identifications (MSI Level 2) were assigned using the METLIN database [57] based on accurate m/z matching (≤5 ppm) focusing search results on expected ions/adducts (e.g. [M + H]+, [M + H – H2O]+, [M + Na]+) of known and biologically relevant compounds.
4. Conclusions and Future Directions
In this report, we demonstrated a novel application of PSI-MS to the analysis of EVs by examining a bacterial EV isolate from O. formigenes culture supernatant, a bacterium whose EVs had never previously been investigated nor confirmed. We detected and putatively identified a panel of features deemed to originate from EVs by comparison to an EV-free control and observed representation from various classes of biochemicals, including metabolites, lipids, and peptides. From this work, we conclude that PSI-MS can serve as a new, rapid, sensitive, and economical approach to EV analysis. Our future endeavors to build upon the results from this investigation will mainly focus on the following: (1) confirming putative identifications assigned to EV features, which will require use of MS2/MSn and comparison of fragmentation spectra to pure standards, and (2) broadening the scope of our analysis to a full characterization of the O. formigenes EV metabolome. Regarding the biological application of our results, we plan to evaluate EV-derived biochemicals for their potential impact on human health as part of the microbiome-derived exposome, particularly those that could participate in oxalate-regulating capacities (secretagogue candidates). Future work for the field in general should focus on optimization of PSI-MS parameters, particularly related to instrumentation, for analyzing EVs. A study examining the quantitative relationship between sample EV concentration and signal intensity and/or metabolome coverage to determine sufficient or optimal EV concentration for PSI-MS analysis would likely be of significant value. PSI-MS should be applied to a broad spectrum of EV experiments to examine the translatability of this analytical technique based on the unique types of EVs produced in different biological systems.
Supplementary Materials
The following are available online at https://0-www-mdpi-com.brum.beds.ac.uk/article/10.3390/metabo11050308/s1, Table S1. Parameters for Nanoparticle Tracking Analysis of O. formigenes EV Isolate.
Author Contributions
Conceptualization, C.A.C., M.H., and T.J.G.; methodology, C.A.C. and T.J.G.; formal analysis, C.A.C.; investigation, C.A.C.; resources, M.H. and T.J.G.; data curation, C.A.C.; writing—original draft preparation, C.A.C.; writing—review and editing, C.A.C., M.H., and T.J.G.; visualization, C.A.C.; supervision, T.J.G.; project administration, T.J.G.; funding acquisition, M.H. and T.J.G. All authors have read and agreed to the published version of the manuscript.
Funding
This research was funded by the National Institutes of Health (grant number 2R01DK088892–05A1).
Acknowledgments
The authors would like to acknowledge Vanessa Y. Rubio (Department of Chemistry, University of Florida) and Richard P. Dilworth (University of Florida) for their work in evaluating the performance of various solvents for our PSI-MS platform, as well as Shane R. Rambo and Morgan N. Jones (Department of Pathology, Immunology and Laboratory Medicine, University of Florida) for preparing the bacterial media used in this study.
Conflicts of Interest
The authors declare no conflict of interest.
References
- Liu, J.; Wang, H.; Manicke, N.E.; Lin, J.M.; Cooks, R.G.; Ouyang, Z. Development, characterization, and application of paper spray ionization. Anal. Chem. 2010, 82, 2463–2471. [Google Scholar] [CrossRef] [PubMed]
- Wang, H.; Liu, J.; Cooks, R.G.; Ouyang, Z. Paper spray for direct analysis of complex mixtures using mass spectrometry. Angew. Chem. Int. Ed. Engl. 2010, 49, 877–880. [Google Scholar] [CrossRef]
- Chiang, S.; Zhang, W.; Ouyang, Z. Paper spray ionization mass spectrometry: Recent advances and clinical applications. Expert Rev. Proteom. 2018, 15, 781–789. [Google Scholar] [CrossRef] [PubMed]
- Dhummakupt, E.S.; Mach, P.M.; Carmany, D.; Demond, P.S.; Moran, T.S.; Connell, T.; Wylie, H.S.; Manicke, N.E.; Nilles, J.M.; Glaros, T. Direct Analysis of Aerosolized Chemical Warfare Simulants Captured on a Modified Glass-Based Substrate by “Paper-Spray” Ionization. Anal. Chem. 2017, 89, 10866–10872. [Google Scholar] [CrossRef] [PubMed] [Green Version]
- Wichert, W.R.; Dhummakupt, E.S.; Zhang, C.; Mach, P.M.; Bernhards, R.C.; Glaros, T.; Manicke, N.E. Detection of Protein Toxin Simulants from Contaminated Surfaces by Paper Spray Mass Spectrometry. J. Am. Soc. Mass Spectrom. 2019, 30, 1406–1415. [Google Scholar] [CrossRef] [PubMed]
- Hamid, A.M.; Jarmusch, A.K.; Pirro, V.; Pincus, D.H.; Clay, B.G.; Gervasi, G.; Cooks, R.G. Rapid discrimination of bacteria by paper spray mass spectrometry. Anal. Chem. 2014, 86, 7500–7507. [Google Scholar] [CrossRef] [PubMed]
- Min, K.; Yang, Q.; Zhong, X.; Yan, D.; Luo, W.; Fang, Z.; Xiao, J.; Ma, M.; Chen, B. Rapid analysis of anionic and cationic surfactants in water by paper spray mass spectrometry. Anal. Methods 2021, 13, 986–995. [Google Scholar] [CrossRef] [PubMed]
- Chen, S.; Chang, Q.; Yin, K.; He, Q.; Deng, Y.; Chen, B.; Liu, C.; Wang, Y.; Wang, L. Rapid Analysis of Bisphenol A and Its Analogues in Food Packaging Products by Paper Spray Ionization Mass Spectrometry. J. Agric. Food Chem. 2017, 65, 4859–4865. [Google Scholar] [CrossRef] [PubMed]
- Linhares, A.; Yonamine, M. Analysis of biofluids by paper spray-MS in forensic toxicology. Bioanalysis 2020, 12, 1087–1102. [Google Scholar] [CrossRef] [PubMed]
- Chamberlain, C.A.; Rubio, V.Y.; Garrett, T.J. Strain-Level Differentiation of Bacteria by Paper Spray Ionization Mass Spectrometry. Anal. Chem. 2019, 91, 4964–4968. [Google Scholar] [CrossRef] [PubMed]
- Pulliam, C.J.; Wei, P.; Snyder, D.T.; Wang, X.; Ouyang, Z.; Pielak, R.M.; Graham Cooks, R. Rapid discrimination of bacteria using a miniature mass spectrometer. Analyst 2016, 141, 1633–1636. [Google Scholar] [CrossRef] [PubMed]
- Anhalt, J.; Fenselau, C. Identification of Bacteria Using Mass-Spectrometry. Anal. Chem. 1975, 47, 219–225. [Google Scholar] [CrossRef]
- Liu, S.; Zuo, J.; Lu, Y.; Gao, L.; Zhai, Y.; Xu, W. Direct bacteria analysis using laserspray ionization miniature mass spectrometry. Anal. Bioanal. Chem. 2018, 411, 4031–4040. [Google Scholar] [CrossRef]
- Watrous, J.; Roach, P.; Alexandrov, T.; Heath, B.S.; Yang, J.Y.; Kersten, R.D.; van der Voort, M.; Pogliano, K.; Gross, H.; Raaijmakers, J.M.; et al. Mass spectral molecular networking of living microbial colonies. Proc. Natl. Acad. Sci. USA 2012, 109, E1743–E1752. [Google Scholar] [CrossRef] [PubMed] [Green Version]
- Wei, P.; Bag, S.; Pulliam, C.; Snyder, D.; Pielak, R.; Cooks, R. Analysis of bacteria using zero volt paper spray. Anal. Methods 2016, 8, 1770–1773. [Google Scholar] [CrossRef]
- Hsu, C.C.; ElNaggar, M.S.; Peng, Y.; Fang, J.; Sanchez, L.M.; Mascuch, S.J.; Møller, K.A.; Alazzeh, E.K.; Pikula, J.; Quinn, R.A.; et al. Real-time metabolomics on living microorganisms using ambient electrospray ionization flow-probe. Anal. Chem. 2013, 85, 7014–7018. [Google Scholar] [CrossRef] [PubMed] [Green Version]
- Meetani, M.A.; Shin, Y.S.; Zhang, S.; Mayer, R.; Basile, F. Desorption electrospray ionization mass spectrometry of intact bacteria. J. Mass Spectrom. 2007, 42, 1186–1193. [Google Scholar] [CrossRef] [PubMed]
- Holland, R.D.; Wilkes, J.G.; Rafii, F.; Sutherland, J.B.; Persons, C.C.; Voorhees, K.J.; Lay, J.O. Rapid identification of intact whole bacteria based on spectral patterns using matrix-assisted laser desorption/ionization with time-of-flight mass spectrometry. Rapid Commun. Mass Spectrom. 1996, 10, 1227–1232. [Google Scholar] [CrossRef]
- Pinu, F.R.; Villas-Boas, S.G. Extracellular Microbial Metabolomics: The State of the Art. Metabolites 2017, 7, 43. [Google Scholar] [CrossRef]
- Chamberlain, C.A.; Hatch, M.; Garrett, T.J. Metabolomic profiling of oxalate-degrading probiotic Lactobacillus acidophilus and Lactobacillus gasseri. PLoS ONE 2019, 14, e0222393. [Google Scholar] [CrossRef]
- Behrends, V.; Williams, H.D.; Bundy, J.G. Metabolic footprinting: Extracellular metabolomic analysis. Methods Mol. Biol. 2014, 1149, 281–292. [Google Scholar] [CrossRef] [PubMed]
- Maffei, B.; Francetic, O.; Subtil, A. Tracking Proteins Secreted by Bacteria: What’s in the Toolbox? Front. Cell. Infect. Microbiol. 2017, 7, 221. [Google Scholar] [CrossRef] [PubMed] [Green Version]
- Mashego, M.R.; van Gulik, W.M.; Heijnen, J.J. Metabolome dynamic responses of Saccharomyces cerevisiae to simultaneous rapid perturbations in external electron acceptor and electron donor. FEMS Yeast Res. 2007, 7, 48–66. [Google Scholar] [CrossRef] [PubMed] [Green Version]
- Peisl, B.Y.L.; Schymanski, E.L.; Wilmes, P. Dark matter in host-microbiome metabolomics: Tackling the unknowns—A review. Anal. Chim. Acta 2018, 1037, 13–27. [Google Scholar] [CrossRef] [PubMed]
- Gill, S.; Catchpole, R.; Forterre, P. Extracellular membrane vesicles in the three domains of life and beyond. FEMS Microbiol. Rev. 2019, 43, 273–303. [Google Scholar] [CrossRef] [PubMed]
- Liu, Y.; Defourny, K.A.Y.; Smid, E.J.; Abee, T. Gram-Positive Bacterial Extracellular Vesicles and Their Impact on Health and Disease. Front. Microbiol. 2018, 9, 1502. [Google Scholar] [CrossRef] [PubMed] [Green Version]
- Gaurivaud, P.; Ganter, S.; Villard, A.; Manso-Silvan, L.; Chevret, D.; Boulé, C.; Monnet, V.; Tardy, F. Mycoplasmas are no exception to extracellular vesicles release: Revisiting old concepts. PLoS ONE 2018, 13, e0208160. [Google Scholar] [CrossRef] [PubMed] [Green Version]
- Silhavy, T.J.; Kahne, D.; Walker, S. The bacterial cell envelope. Cold Spring Harb. Perspect. Biol. 2010, 2, a000414. [Google Scholar] [CrossRef] [PubMed]
- Pérez-Cruz, C.; Delgado, L.; López-Iglesias, C.; Mercade, E. Outer-inner membrane vesicles naturally secreted by gram-negative pathogenic bacteria. PLoS ONE 2015, 10, e0116896. [Google Scholar] [CrossRef] [PubMed] [Green Version]
- Kulp, A.; Kuehn, M.J. Biological functions and biogenesis of secreted bacterial outer membrane vesicles. Annu. Rev. Microbiol. 2010, 64, 163–184. [Google Scholar] [CrossRef] [PubMed] [Green Version]
- Brown, L.; Wolf, J.M.; Prados-Rosales, R.; Casadevall, A. Through the wall: Extracellular vesicles in Gram-positive bacteria, mycobacteria and fungi. Nat. Rev. Microbiol. 2015, 13, 620–630. [Google Scholar] [CrossRef] [PubMed] [Green Version]
- Kim, J.H.; Lee, J.; Park, J.; Gho, Y.S. Gram-negative and Gram-positive bacterial extracellular vesicles. Semin. Cell Dev. Biol. 2015, 40, 97–104. [Google Scholar] [CrossRef] [PubMed]
- McBroom, A.J.; Johnson, A.P.; Vemulapalli, S.; Kuehn, M.J. Outer membrane vesicle production by Escherichia coli is independent of membrane instability. J. Bacteriol. 2006, 188, 5385–5392. [Google Scholar] [CrossRef] [PubMed] [Green Version]
- Dorward, D.W.; Garon, C.F.; Judd, R.C. Export and intercellular transfer of DNA via membrane blebs of Neisseria gonorrhoeae. J. Bacteriol. 1989, 171, 2499–2505. [Google Scholar] [CrossRef] [PubMed] [Green Version]
- Lee, J.; Lee, E.Y.; Kim, S.H.; Kim, D.K.; Park, K.S.; Kim, K.P.; Kim, Y.K.; Roh, T.Y.; Gho, Y.S. Staphylococcus aureus extracellular vesicles carry biologically active β-lactamase. Antimicrob. Agents Chemother. 2013, 57, 2589–2595. [Google Scholar] [CrossRef] [PubMed] [Green Version]
- Pocsfalvi, G.; Stanly, C.; Vilasi, A.; Fiume, I.; Capasso, G.; Turiák, L.; Buzas, E.I.; Vékey, K. Mass spectrometry of extracellular vesicles. Mass Spectrom. Rev. 2016, 35, 3–21. [Google Scholar] [CrossRef] [PubMed]
- Rody, W.J.; Chamberlain, C.A.; Emory-Carter, A.K.; McHugh, K.P.; Wallet, S.M.; Spicer, V.; Krokhin, O.; Holliday, L.S. The proteome of extracellular vesicles released by clastic cells differs based on their substrate. PLoS ONE 2019, 14, e0219602. [Google Scholar] [CrossRef] [PubMed] [Green Version]
- Bandu, R.; Oh, J.W.; Kim, K.P. Mass spectrometry-based proteome profiling of extracellular vesicles and their roles in cancer biology. Exp. Mol. Med. 2019, 51, 1–10. [Google Scholar] [CrossRef] [PubMed] [Green Version]
- Yang, C.; Guo, W.B.; Zhang, W.S.; Bian, J.; Yang, J.K.; Zhou, Q.Z.; Chen, M.K.; Peng, W.; Qi, T.; Wang, C.Y.; et al. Comprehensive proteomics analysis of exosomes derived from human seminal plasma. Andrology 2017, 5, 1007–1015. [Google Scholar] [CrossRef] [PubMed] [Green Version]
- Rody, W.J.; Krokhin, O.; Spicer, V.; Chamberlain, C.A.; Chamberlain, M.; McHugh, K.P.; Wallet, S.M.; Emory, A.K.; Crull, J.D.; Holliday, L.S. The use of cell culture platforms to identify novel markers of bone and dentin resorption. Orthod. Craniofac. Res. 2017, 20 (Suppl. 1), 89–94. [Google Scholar] [CrossRef] [PubMed]
- Choi, D.S.; Kim, D.K.; Kim, Y.K.; Gho, Y.S. Proteomics of extracellular vesicles: Exosomes and ectosomes. Mass Spectrom. Rev. 2015, 34, 474–490. [Google Scholar] [CrossRef] [PubMed]
- Lee, E.Y.; Choi, D.S.; Kim, K.P.; Gho, Y.S. Proteomics in gram-negative bacterial outer membrane vesicles. Mass Spectrom. Rev. 2008, 27, 535–555. [Google Scholar] [CrossRef] [PubMed]
- Lee, J.; Kim, O.Y.; Gho, Y.S. Proteomic profiling of Gram-negative bacterial outer membrane vesicles: Current perspectives. Proteom. Clin. Appl. 2016, 10, 897–909. [Google Scholar] [CrossRef] [PubMed]
- Olaya-Abril, A.; Prados-Rosales, R.; McConnell, M.J.; Martín-Peña, R.; González-Reyes, J.A.; Jiménez-Munguía, I.; Gómez-Gascón, L.; Fernández, J.; Luque-García, J.L.; García-Lidón, C.; et al. Characterization of protective extracellular membrane-derived vesicles produced by Streptococcus pneumoniae. J. Proteom. 2014, 106, 46–60. [Google Scholar] [CrossRef] [PubMed]
- Tsolakos, N.; Lie, K.; Bolstad, K.; Maslen, S.; Kristiansen, P.A.; Høiby, E.A.; Wallington, A.; Vipond, C.; Skehel, M.; Tang, C.M.; et al. Characterization of meningococcal serogroup B outer membrane vesicle vaccines from strain 44/76 after growth in different media. Vaccine 2010, 28, 3211–3218. [Google Scholar] [CrossRef] [PubMed]
- Murray, P. What Is New in Clinical Microbiology Microbial Identification by MALDI-TOF Mass Spectrometry A Paper from the 2011 William Beaumont Hospital Symposium on Molecular Pathology. J. Mol. Diagn. 2012, 14, 419–423. [Google Scholar] [CrossRef] [PubMed] [Green Version]
- Hatch, M. Gut microbiota and oxalate homeostasis. Ann. Transl. Med. 2017, 5, 36. [Google Scholar] [CrossRef] [PubMed]
- Whittamore, J.M.; Hatch, M. The role of intestinal oxalate transport in hyperoxaluria and the formation of kidney stones in animals and man. Urolithiasis 2017, 45, 89–108. [Google Scholar] [CrossRef] [PubMed] [Green Version]
- Chamberlain, C.A.; Hatch, M.; Garrett, T.J. Metabolomic Alteration in the Mouse Distal Colonic Mucosa after Oral Gavage with Oxalobacter formigenes. Metabolites 2020, 10, 405. [Google Scholar] [CrossRef] [PubMed]
- Chamberlain, C.A. Metabolomic Characterization of the Intestinal Bacterial Oxalobiome; University of Florida: Gainesville, FL, USA, 2019. [Google Scholar]
- Chamberlain, C.A.; Hatch, M.; Garrett, T.J. Oxalobacter formigenes produces metabolites and lipids undetectable in oxalotrophic Bifidobacterium animalis. Metabolomics 2020, 16, 122. [Google Scholar] [CrossRef] [PubMed]
- Hatch, M.; Cornelius, J.; Allison, M.; Sidhu, H.; Peck, A.; Freel, R.W. Oxalobacter sp. reduces urinary oxalate excretion by promoting enteric oxalate secretion. Kidney Int. 2006, 69, 691–698. [Google Scholar] [CrossRef] [PubMed] [Green Version]
- Hatch, M.; Gjymishka, A.; Salido, E.C.; Allison, M.J.; Freel, R.W. Enteric oxalate elimination is induced and oxalate is normalized in a mouse model of primary hyperoxaluria following intestinal colonization with Oxalobacter. Am. J. Physiol. Gastrointest. Liver Physiol. 2011, 300, G461–G469. [Google Scholar] [CrossRef] [PubMed] [Green Version]
- Hatch, M.; Freel, R.W. A human strain of Oxalobacter (HC-1) promotes enteric oxalate secretion in the small intestine of mice and reduces urinary oxalate excretion. Urolithiasis 2013, 41, 379–384. [Google Scholar] [CrossRef] [PubMed] [Green Version]
- Neven, K.Y.; Nawrot, T.S.; Bollati, V. Extracellular Vesicles: How the External and Internal Environment Can Shape Cell-To-Cell Communication. Curr. Environ. Health Rep. 2017, 4, 30–37. [Google Scholar] [CrossRef] [PubMed]
- Sumner, L.W.; Amberg, A.; Barrett, D.; Beale, M.H.; Beger, R.; Daykin, C.A.; Fan, T.W.; Fiehn, O.; Goodacre, R.; Griffin, J.L.; et al. Proposed minimum reporting standards for chemical analysis Chemical Analysis Working Group (CAWG) Metabolomics Standards Initiative (MSI). Metabolomics 2007, 3, 211–221. [Google Scholar] [CrossRef] [Green Version]
- Guijas, C.; Montenegro-Burke, J.R.; Domingo-Almenara, X.; Palermo, A.; Warth, B.; Hermann, G.; Koellensperger, G.; Huan, T.; Uritboonthai, W.; Aisporna, A.E.; et al. METLIN: A Technology Platform for Identifying Knowns and Unknowns. Anal. Chem. 2018, 90, 3156–3164. [Google Scholar] [CrossRef] [PubMed] [Green Version]
- Sohlenkamp, C.; Geiger, O. Bacterial membrane lipids: Diversity in structures and pathways. FEMS Microbiol. Rev. 2016, 40, 133–159. [Google Scholar] [CrossRef] [PubMed] [Green Version]
- Chamberlain, C.A.; Hatch, M.; Garrett, T.J. Metabolomic and lipidomic characterization of Oxalobacter formigenes strains HC1 and OxWR by UHPLC-HRMS. Anal. Bioanal. Chem. 2019. [Google Scholar] [CrossRef] [PubMed]
- Klose, K.E. Increased chatter: Cyclic dipeptides as molecules of chemical communication in Vibrio spp. J. Bacteriol. 2006, 188, 2025–2026. [Google Scholar] [CrossRef] [Green Version]
- Holden, M.T.; Ram Chhabra, S.; de Nys, R.; Stead, P.; Bainton, N.J.; Hill, P.J.; Manefield, M.; Kumar, N.; Labatte, M.; England, D.; et al. Quorum-sensing cross talk: Isolation and chemical characterization of cyclic dipeptides from Pseudomonas aeruginosa and other gram-negative bacteria. Mol. Microbiol. 1999, 33, 1254–1266. [Google Scholar] [CrossRef] [PubMed]
- Boyer, M.; Wisniewski-Dyé, F. Cell-cell signalling in bacteria: Not simply a matter of quorum. FEMS Microbiol. Ecol. 2009, 70, 1–19. [Google Scholar] [CrossRef] [PubMed]
- Candela, T.; Fouet, A. Poly-gamma-glutamate in bacteria. Mol. Microbiol. 2006, 60, 1091–1098. [Google Scholar] [CrossRef] [PubMed]
- Aronov, P.A.; Luo, F.J.; Plummer, N.S.; Quan, Z.; Holmes, S.; Hostetter, T.H.; Meyer, T.W. Colonic contribution to uremic solutes. J. Am. Soc. Nephrol. 2011, 22, 1769–1776. [Google Scholar] [CrossRef] [Green Version]
- Poesen, R.; Claes, K.; Evenepoel, P.; de Loor, H.; Augustijns, P.; Kuypers, D.; Meijers, B. Microbiota-Derived Phenylacetylglutamine Associates with Overall Mortality and Cardiovascular Disease in Patients with CKD. J. Am. Soc. Nephrol. 2016, 27, 3479–3487. [Google Scholar] [CrossRef] [PubMed] [Green Version]
- Duran, M.; Ponezi, A.N.; Faljoni-Alario, A.; Teixeira, M.F.S.; Justo, G.Z.; Duran, N. Potential applications of violacein: A microbial pigment. Med. Chem. Res. 2012, 21, 1524–1532. [Google Scholar] [CrossRef]
- Hoshino, T. Violacein and related tryptophan metabolites produced by Chromobacterium violaceum: Biosynthetic mechanism and pathway for construction of violacein core. Appl. Microbiol. Biotechnol. 2011, 91, 1463–1475. [Google Scholar] [CrossRef]
- Dodou, H.V.; de Morais Batista, A.H.; Sales, G.W.P.; de Medeiros, S.C.; Rodrigues, M.L.; Nogueira, P.C.N.; Silveira, E.R.; Nogueira, N.A.P. Violacein antimicrobial activity on Staphylococcus epidermidis and synergistic effect on commercially available antibiotics. J. Appl. Microbiol. 2017, 123, 853–860. [Google Scholar] [CrossRef] [PubMed] [Green Version]
- Andrighetti-Frohner, C.R.; Antonio, R.V.; Creczynski-Pasa, T.B.; Barardi, C.R.; Simoes, C.M. Cytotoxicity and potential antiviral evaluation of violacein produced by Chromobacterium violaceum. Memórias Inst. Oswaldo Cruz 2003, 98, 843–848. [Google Scholar] [CrossRef]
- Antonisamy, P.; Ignacimuthu, S. Immunomodulatory, analgesic and antipyretic effects of violacein isolated from Chromobacterium violaceum. Phytomedicine 2010, 17, 300–304. [Google Scholar] [CrossRef]
- Venegas, F.A.; Kollisch, G.; Mark, K.; Diederich, W.E.; Kaufmann, A.; Bauer, S.; Chavarria, M.; Araya, J.J.; Garcia-Pineres, A.J. The Bacterial Product Violacein Exerts an Immunostimulatory Effect via TLR8. Sci. Rep. 2019, 9, 13661. [Google Scholar] [CrossRef] [PubMed] [Green Version]
- Bachurski, D.; Schuldner, M.; Nguyen, P.H.; Malz, A.; Reiners, K.S.; Grenzi, P.C.; Babatz, F.; Schauss, A.C.; Hansen, H.P.; Hallek, M.; et al. Extracellular vesicle measurements with nanoparticle tracking analysis—An accuracy and repeatability comparison between NanoSight NS300 and ZetaView. J. Extracell Vesicles 2019, 8, 1596016. [Google Scholar] [CrossRef] [PubMed]
- He, L.; Diedrich, J.; Chu, Y.Y.; Yates, J.R. Extracting Accurate Precursor Information for Tandem Mass Spectra by RawConverter. Anal. Chem. 2015, 87, 11361–11367. [Google Scholar] [CrossRef] [PubMed] [Green Version]
- Pluskal, T.; Castillo, S.; Villar-Briones, A.; Oresic, M. MZmine 2: Modular framework for processing, visualizing, and analyzing mass spectrometry-based molecular profile data. BMC Bioinform. 2010, 11, 395. [Google Scholar] [CrossRef] [PubMed] [Green Version]
- Chong, J.; Soufan, O.; Li, C.; Caraus, I.; Li, S.; Bourque, G.; Wishart, D.S.; Xia, J. MetaboAnalyst 4.0: Towards more transparent and integrative metabolomics analysis. Nucleic Acids Res. 2018, 46, W486–W494. [Google Scholar] [CrossRef] [PubMed] [Green Version]
- Demsar, J.; Curk, T.; Erjavec, A.; Gorup, C.; Hocevar, T.; Milutinovic, M.; Mozina, M.; Polajnar, M.; Toplak, M.; Staric, A.; et al. Orange: Data Mining Toolbox in Python. J. Mach. Learn. Res. 2013, 14, 2349–2353. [Google Scholar]
- Wehrens, R.; Hageman, J.A.; van Eeuwijk, F.; Kooke, R.; Flood, P.J.; Wijnker, E.; Keurentjes, J.J.; Lommen, A.; van Eekelen, H.D.; Hall, R.D.; et al. Improved batch correction in untargeted MS-based metabolomics. Metabolomics 2016, 12, 88. [Google Scholar] [CrossRef] [PubMed] [Green Version]
- van den Berg, R.A.; Hoefsloot, H.C.; Westerhuis, J.A.; Smilde, A.K.; van der Werf, M.J. Centering, scaling, and transformations: Improving the biological information content of metabolomics data. BMC Genom. 2006, 7, 142. [Google Scholar] [CrossRef] [PubMed] [Green Version]
Figure 1.
Nanoparticle Tracking Analysis confirms EVs in vesicle isolate from O. formigenes culture supernatant. (A) Image of EVs in purified isolate derived from O. formigenes culture supernatant captured by nanoparticle tracking analysis. (B) Particle size distribution of EVs detected in O. formigenes culture medium supernatant. Particle size (average ± standard error): (122.9 ± 46.3) nm, Particle size distribution: D10 = 80.4 nm, D50 = 111.5 nm, and D90 = 182.6 nm.

Figure 2.
Unsupervised multivariate statistical clustering differentiates metabolomic profiles of the O. formigenes EV isolate and EV-free control. Clear separation and analytical distinction between the EV isolate and control was demonstrated using (A) principal component analysis (50.2% of the variance represented in 2 PCs), (B) hierarchical clustering (Euclidean distancing, Ward clustering), (C) self-organizing maps, and (D) t-stochastic neighbor embedding (initialized with PCA pre-processing).


Table 1.
Features detected exclusively in O. formigenes EV isolate compared to an EV-free control. Putative IDs (MSI Level 2) made by accurate m/z matching to METLIN database (≤5 ppm).
Table 1.
Features detected exclusively in O. formigenes EV isolate compared to an EV-free control. Putative IDs (MSI Level 2) made by accurate m/z matching to METLIN database (≤5 ppm).
| m/z | Annotation | Molecular Formula (M) | Ion/Adduct | Δppm | METLIN ID |
|---|---|---|---|---|---|
| 165.0153 a | Muconic Acid | C6H6O4 | [M + Na]+ | 3 | 45919 |
| 165.1016 | Kynuramine | C9H12N2O | [M + H]+ | 3 | 43923 |
| 183.0261 a | Oxoadipic Acid | C6H8O5 | [M + Na]+ | 1 | 322 |
| 185.1280 | Ala-Ile/Leu | C9H18N2O3 | [M + H – H2O]+ | 5 | 8560(6/7) |
| 196.0010 | 4-Phosphoaspartic Acid | C4H8NO7P | [M + H – H2O]+ | 0 | 360 |
| 205.1542 | 3-Hydroxy-N6,N6,N6-Trimethyl-L-Lysine | C9H20N2O3 | [M + H]+ | 2 | 6324 |
| 213.0364 a | 4-Hydroxy-4-methyl-2-Oxoadipic Acid | C7H10O6 | [M + Na]+ | 2 | 66102 |
| 213.1228 | Pro-Pro | C10H16N2O3 | [M + H]+ | 2 | 62027 |
| 218.1382 | Propionylcarnitine | C10H19NO4 | [M + H]+ | 2 | 965 |
| 227.1385 | Hydroxyprolyl-(Iso)Leucine | C11H20N2O4 | [M + H – H2O]+ | 4 | 8577(3/4) |
| 229.1180 | Prolylhydroxyproline | C10H16N2O4 | [M + H]+ | 1 | 58518 |
| 241.1177 | Gamma-Glutamyl-Pipecolic Acid | C11H18N2O5 | [M + H – H2O]+ | 4 | 93275 |
| 246.0731 a | Acetyltyrosine | C11H13NO4 | [M + Na]+ | 2 | 5827 |
| 251.0522 | Homocystine | C8H16N2O4S2 | [M + H – H2O]+ | 0 | 4189 |
| 254.1378 | 3-Indolecarboxylic Acid | C13H19NO4 | [M + H]+ | 3 | 6660 |
| 262.0851 | Ser-Ala-Cys | C9H17N3O5S | [M + H – H2O]+ | 4 | 15654 |
| 265.1168 | Phenylacetylglutamine | C13H16N2O4 | [M + H]+ | 5 | 58397 |
| 295.2238 a | Hydroxypalmitic Acid | C16H32O3 | [M + Na]+ | 1 | 35428 |
| 297.0483 | 5′-Phosphoribosyl-N-Formylglycinamide | C8H15N2O9P | [M + H – H2O]+ | 2 | 3443 |
| 311.1456 a | Arg-Asn | C10H20N6O4 | [M + Na]+ | 5 | 23959 |
| 317.1929 | Ala-Arg-Ala | C12H24N6O4 | [M + H]+ | 0 | 21376 |
| 326.0909 | Violacein | C20H13N3O3 | [M + H – H2O]+ | 5 | C21136 b |
| 337.1605 | Ala-Gln-His | C14H22N6O5 | [M + H – H2O]+ | 5 | 16023 |
| 345.1875 | Ser-Arg-Thr | C13H26N6O6 | [M + H – H2O]+ | 3 | 16028 |
| 359.1690 | Asp-Arg-Ser | C13H24N6O7 | [M + H – H2O]+ | 3 | 17672 |
| 361.1965 | Arg-Trp | C17H24N6O3 | [M + H]+ | 4 | 23686 |
| 367.1084 | Met-Cys-Asn | C12H22N4O5S2 | [M + H]+ | 5 | 15764 |
| 385.3061 | N-Palmitoyl Glutamine | C21H40N2O4 | [M + H]+ | 0 | 75509 |
| 407.2034 | Ser-Arg-Tyr | C18H28N6O6 | [M + H – H2O]+ | 2 | 15751 |
| 415.2289 | Gly-Lys-Asn-Pro | C17H30N6O6 | [M + H]+ | 2 | 146911 |
| 421.2315 | His-His-Lys | C18H28N8O4 | [M + H]+ | 2 | 18791 |
| 431.2394 | Phe-His-Lys | C21H30N6O4 | [M + H]+ | 1 | 18657 |
| 441.1496 | Cys-Met-Ser-Thr | C15H28N4O7S2 | [M + H]+ | 5 | 115796 |
| 445.1208 | Cys-Cys-Gly-Tyr | C17H24N4O6S2 | [M + H]+ | 0 | 111999 |
| 473.3075 | Ile/Leu-Lys-Asn-Val | C21H40N6O6 | [M + H]+ | 1 | 162916 |
| 475.2862 | Ala-Glu-Lys-Lys | C20H38N6O7 | [M + H]+ | 2 | 104848 |
| 479.1988 | Ala-Asp-His-His | C19H26N8O7 | [M + H]+ | 1 | 104406 |
| 501.1806 | Polyglutamic Acid | C20H30N4O12 | [M + H – H2O]+ | 5 | 58212 |
| 657.3238 | Gln-Arg-Trp-Trp | C33H42N10O6 | [M + H – H2O]+ | 3 | 213457 |
| 663.4264 | Phosphatidylglycerol (28:2) | C34H63O10P | [M + H]+ | 4 | 79745 |
| 670.5166 | Phosphatidylethanolamine (38:1) | C38H74NO7P | [M + H – H2O]+ | 1 | 60361 |
| 674.5555 | GlcCer(d18:0/14:0) | C38H75NO8 | [M + H]+ | 1 | 53987 |
| 734.5109 | Phosphatidylethanolamine (37:5) | C42H74NO8P | [M + H – H2O]+ | 2 | 60354 |
| 761.5136 | Phosphatidic Acid (41:7) | C44H73O8P | [M + H]+ | 2 | 81674 |
| 765.5086 | Phosphatidylglycerol (37:5) | C43H75O10P | [M + H – H2O]+ | 2 | 79015 |
| 769.5023 | Phosphatidylglycerol (36:5) | C42H73O10P | [M + H]+ | 1 | 61870 |
| 835.5720 | Phosphatidylinositol (35:0) | C44H85O13P | [M + H – H2O]+ | 2 | 80078 |
| 862.6525 | Phosphatidylserine (41:0) | C47H92NO10P | [M + H]+ | 0 | 78139 |
| 958.3124 | Pentaglutamyl Folic Acid | C39H47N11O18 | [M + H]+ | 5 | 58426 |
| 960.3109 | Tetradecanoyl-CoA | C35H62N7O17P3S | [M + H – H2O]+ | 0 | 3707 |
a Peaks corresponding to protonated ion [M + H]+ (Δppm ≤ 5) also detected for this species. b KEGG ID (not in METLIN database). Amino acid sequence orders of peptides should be regarded as interchangeable.
Publisher’s Note: MDPI stays neutral with regard to jurisdictional claims in published maps and institutional affiliations. |
© 2021 by the authors. Licensee MDPI, Basel, Switzerland. This article is an open access article distributed under the terms and conditions of the Creative Commons Attribution (CC BY) license (https://creativecommons.org/licenses/by/4.0/).
Share and Cite
MDPI and ACS Style
Chamberlain, C.A.; Hatch, M.; Garrett, T.J. Extracellular Vesicle Analysis by Paper Spray Ionization Mass Spectrometry. Metabolites 2021, 11, 308. https://0-doi-org.brum.beds.ac.uk/10.3390/metabo11050308
AMA Style
Chamberlain CA, Hatch M, Garrett TJ. Extracellular Vesicle Analysis by Paper Spray Ionization Mass Spectrometry. Metabolites. 2021; 11(5):308. https://0-doi-org.brum.beds.ac.uk/10.3390/metabo11050308
Chicago/Turabian StyleChamberlain, Casey A., Marguerite Hatch, and Timothy J. Garrett. 2021. "Extracellular Vesicle Analysis by Paper Spray Ionization Mass Spectrometry" Metabolites 11, no. 5: 308. https://0-doi-org.brum.beds.ac.uk/10.3390/metabo11050308
Note that from the first issue of 2016, this journal uses article numbers instead of page numbers. See further details here.