
Betatrophin Levels Are Related to the Early Histological Findings in Nonalcoholic Fatty Liver Disease

 ,
,  , , , and
Abstract
:1. Introduction
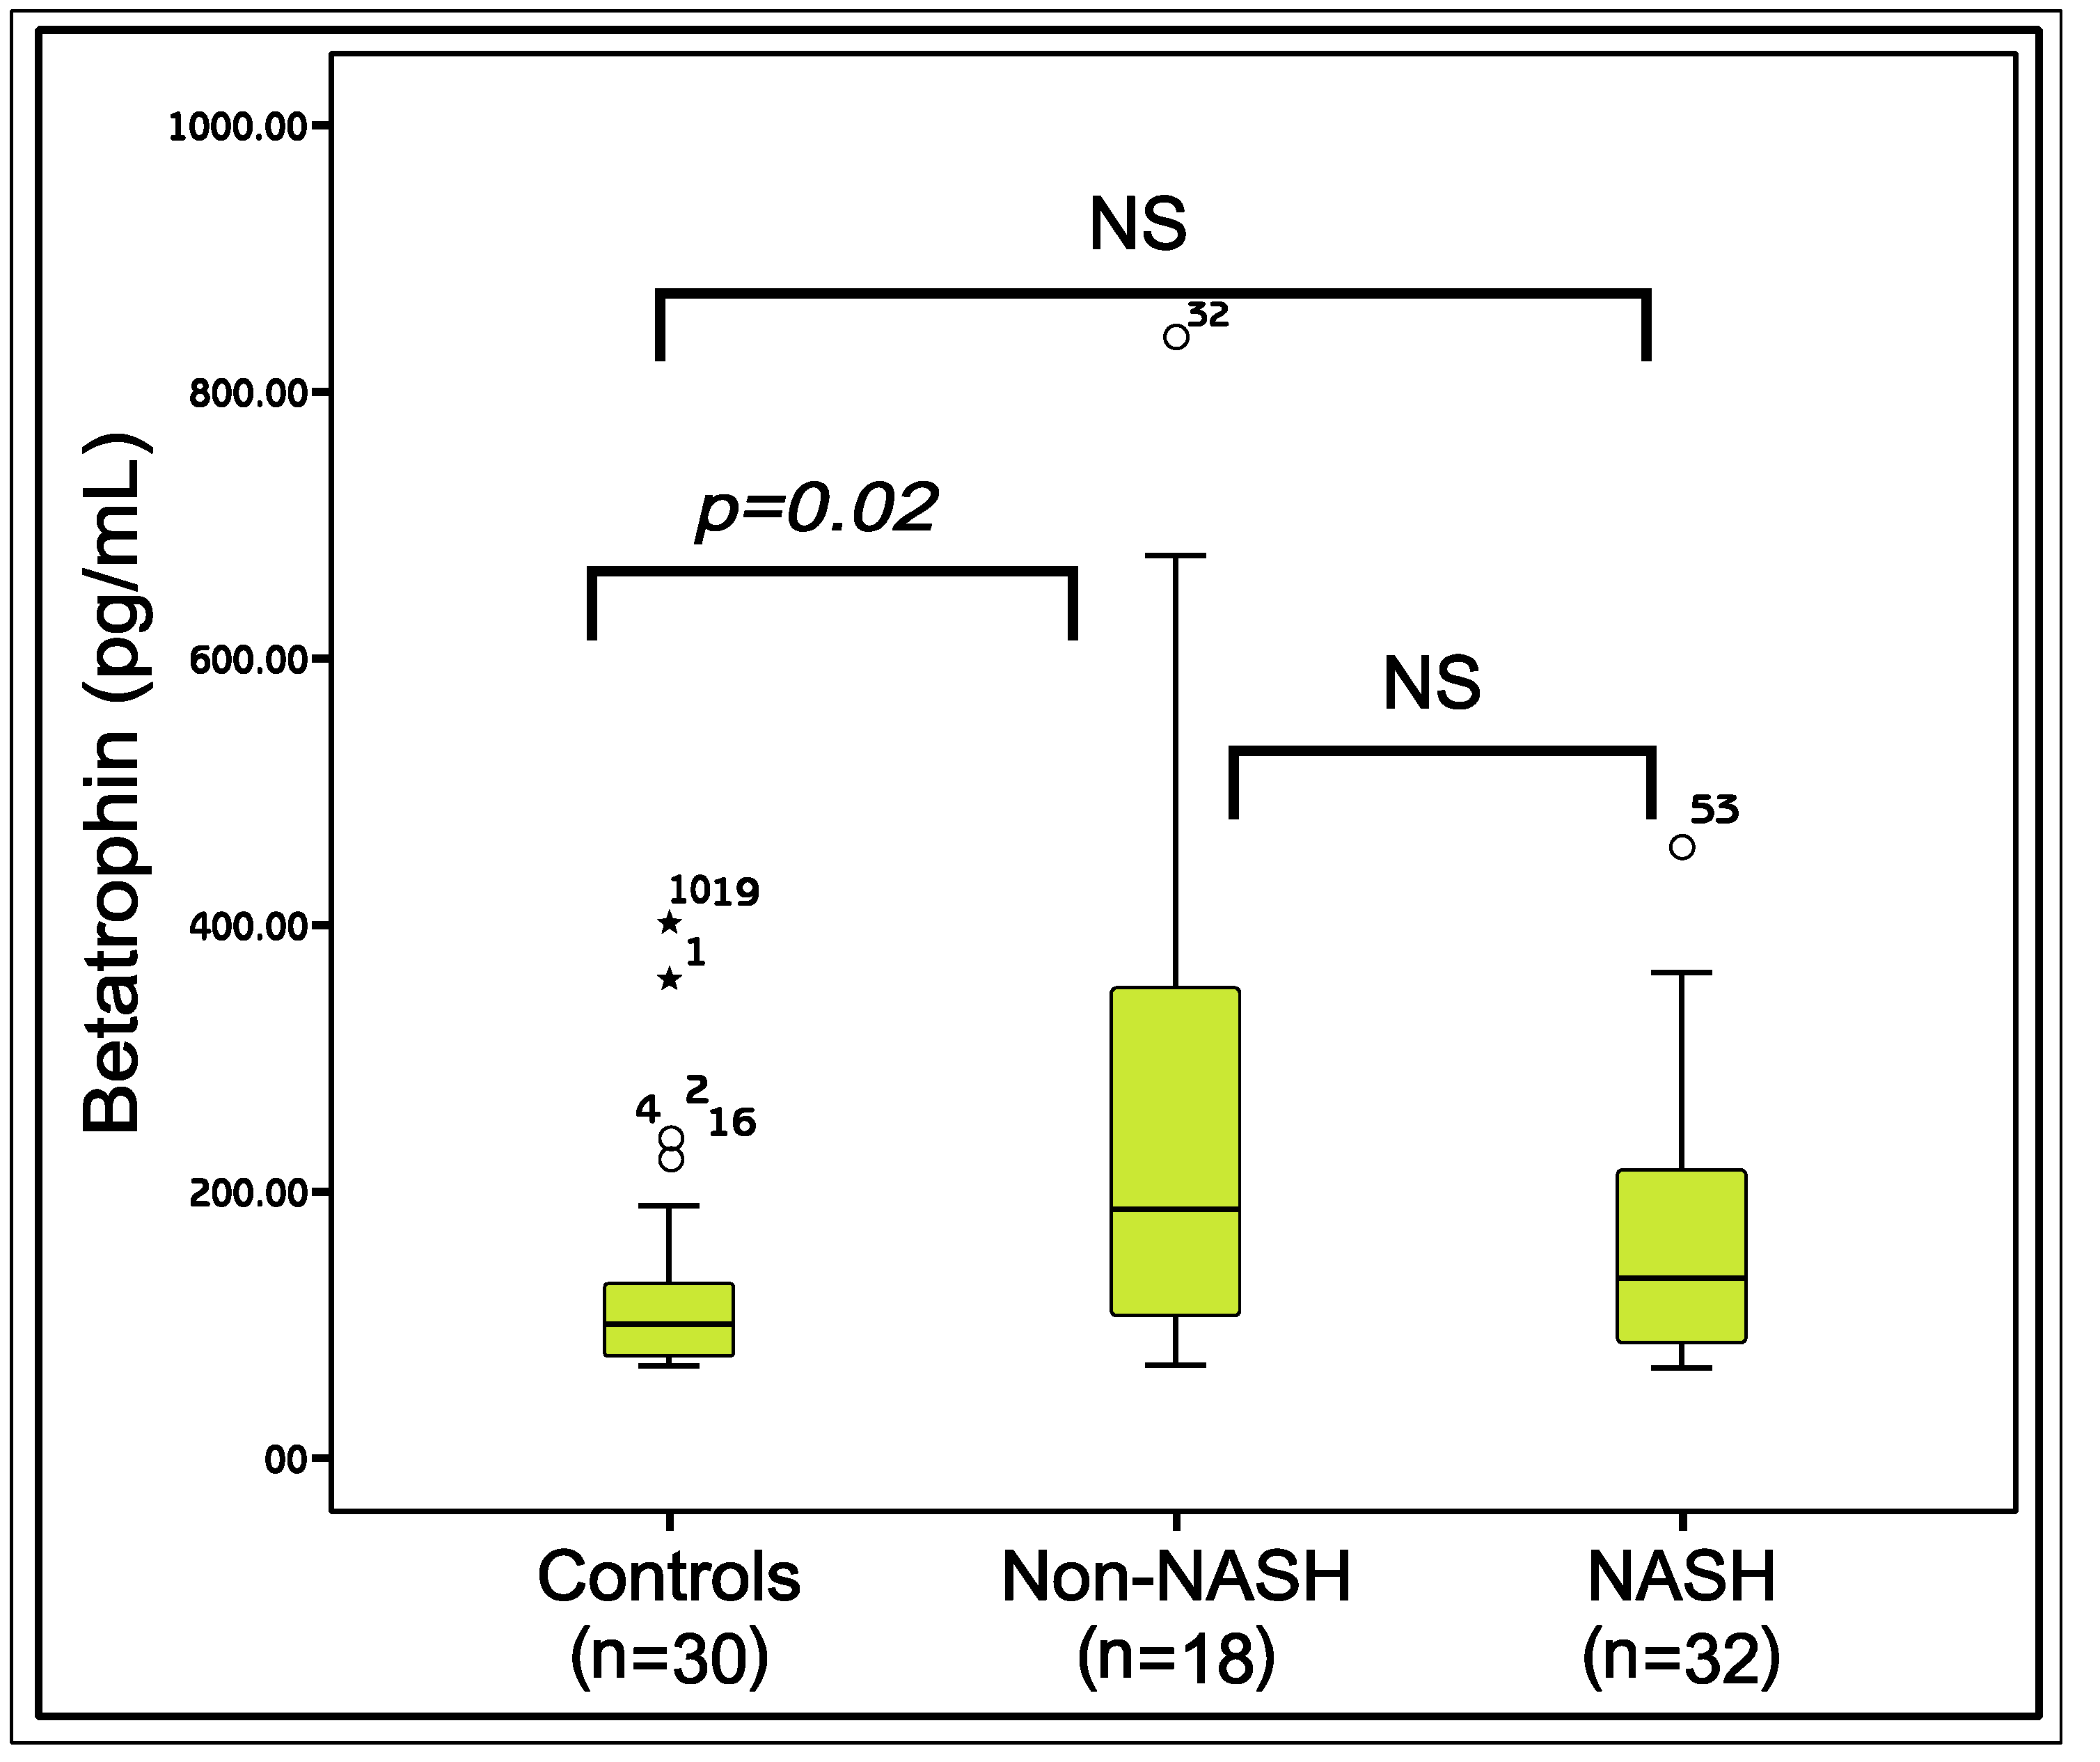
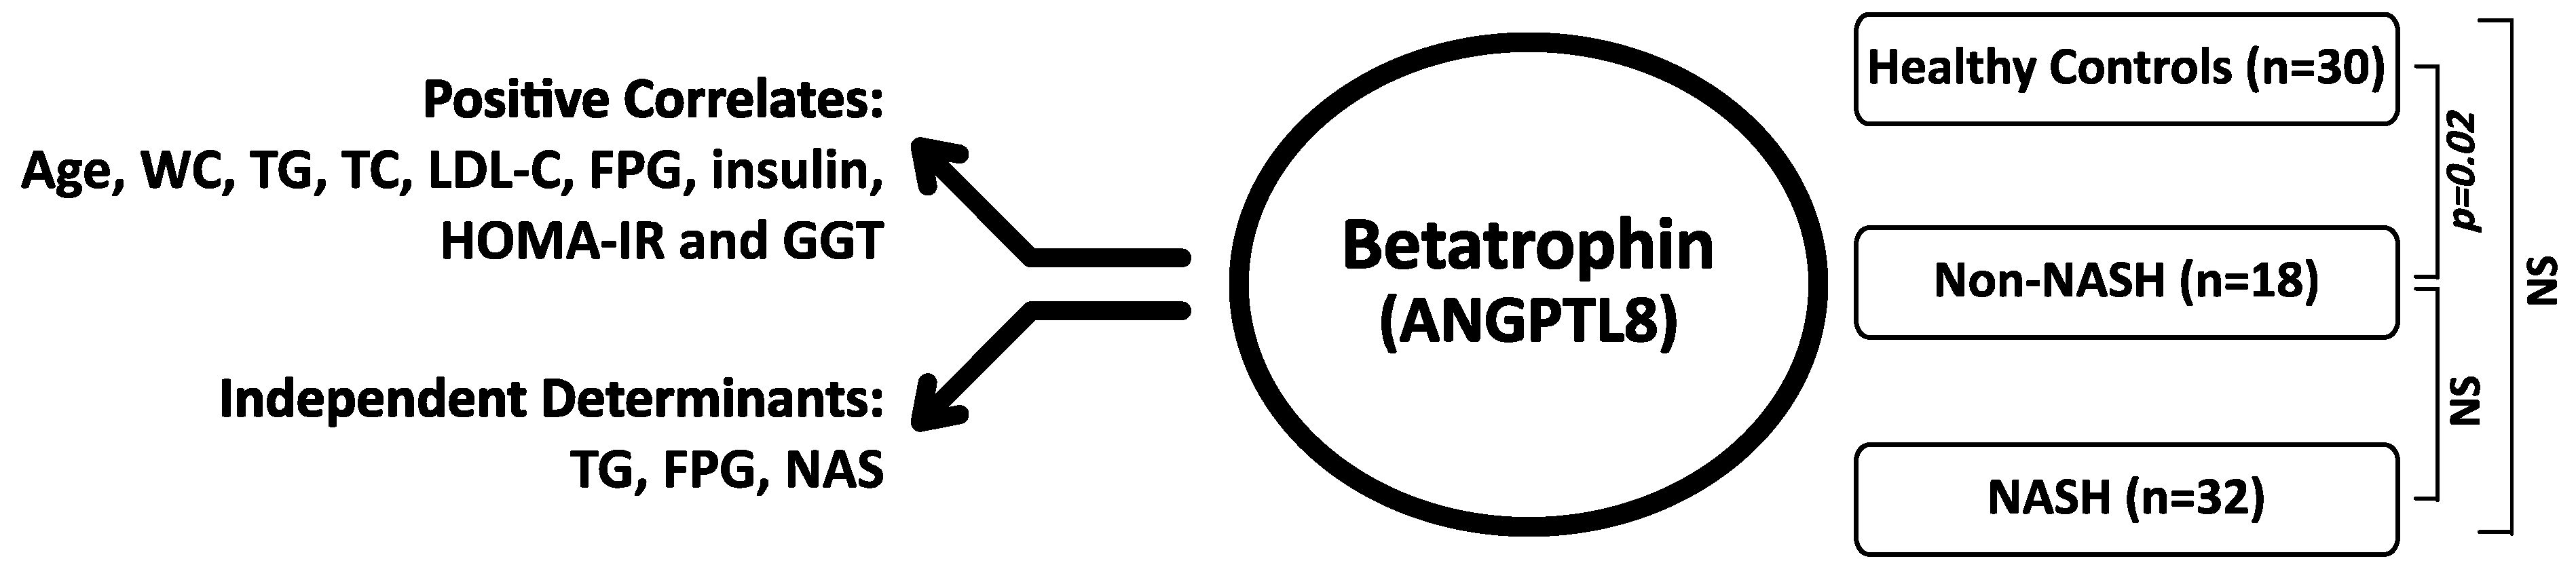
2. Results
3. Discussion
4. Materials and Methods
4.1. Study Design and Population
4.2. Clinical and Laboratory Data
4.3. Liver Histology
4.4. Statistical Analysis
5. Conclusions and Recommendations
Author Contributions
Funding
Institutional Review Board Statement
Informed Consent Statement
Data Availability Statement
Conflicts of Interest
References
- Yi, P.; Park, J.S.; Melton, D.A. Betatrophin: A hormone that controls pancreatic cell proliferation. Cell 2013, 53, 747–758. [Google Scholar] [CrossRef] [PubMed] [Green Version]
- Zhang, R. Lipasin, a novel nutritionally-regulated liver- enriched factor that regulates serum triglyceride levels. Biochem. Biophys. Res. Commun. 2012, 424, 786–792. [Google Scholar] [CrossRef] [PubMed]
- Ren, G.; Kim, J.Y.; Smas, C.M. Identification of RIFL, a novel adipocyte-enriched insulin target gene with a role in lipid metabolism. Am. J. Physiol. Endocrinol. Metab. 2012, 303, 334–351. [Google Scholar] [CrossRef] [PubMed] [Green Version]
- Wang, Y.; Quagliarini, F.; Gusarova, V.; Gromada, J.; Valenzuela, D.M.; Cohen, J.C.; Hobbs, H.H. Mice lacking ANGPTL8 (betatrophin) manifest disrupted triglyceride metabolism without impaired glucose homeostasis. Proc. Natl. Acad. Sci. USA 2013, 110, 16109–16114. [Google Scholar] [CrossRef] [Green Version]
- Gusarova, V.; Alexa, C.A.; Na, E.; Stevis, P.E.; Xin, Y.; Bonner-Weir, S.; Cohen, J.C.; Hobbs, H.H.; Murphy, A.J.; Yancopoulos, G.D.; et al. ANGPTL8/betatrophin does not control pancreatic beta cell expansion. Cell 2014, 159, 691–696. [Google Scholar] [CrossRef] [PubMed] [Green Version]
- Abu-Farha, M.; Ghosh, A.; Al-Khairi, I.; Madiraju, S.R.M.; Abubaker, J.; Prentki, M. The multi-faces of Angptl8 in health and disease: Novel functions beyond lipoprotein lipase modulation. Prog. Lipid. Res. 2020, 80, 101067. [Google Scholar] [CrossRef]
- Espes, D.; Lau, J.; Carlsson, P.O. Increased circulating levels of betatrophin in individuals with long-standing type 1 diabetes. Diabetologia 2014, 57, 50–53. [Google Scholar] [CrossRef] [Green Version]
- Espes, D.; Martinell, M.; Carlsson, P.O. Increased circulating betatrophin concentrations in patients with type 2 diabetes. Int. J. Endocrinol. 2014, 2014, 323407. [Google Scholar] [CrossRef]
- Fu, Z.; Berhane, F.; Fite, A.; Seyoum, B.; Abou-Samra, A.B.; Zhang, R. Elevated circulating lipasin/betatrophin in human type 2 diabetes and obesity. Sci. Rep. 2014, 4, 5013. [Google Scholar] [CrossRef] [Green Version]
- Hu, H.; Sun, W.; Yu, S.; Hong, X.; Qian, W.; Tang, B.; Wang, D.; Yang, L.; Wang, J.; Mao, C.; et al. Increased Circulating Levels of Betatrophin in Newly Diagnosed Type 2 Diabetic Patients. Diabetes Care 2014, 37, 2718–2722. [Google Scholar] [CrossRef] [Green Version]
- Chen, X.; Lu, P.; He, W.; Zhang, J.; Liu, L.; Yang, Y.; Liu, Z.; Xie, J.; Shao, S.; Du, T.; et al. Circulating betatrophin levels are increased in patients with type 2 diabetes and associated with insulin resistance. J. Clin. Endocrinol. Metab. 2015, 100, 96–100. [Google Scholar] [CrossRef]
- Fenzl, A.; Itariu, B.K.; Kosi, L.; Fritzer-Szekeres, M.; Kautzky-Willer, A.; Stulnig, T.M.; Kiefer, F.W. Circulating betatrophin correlates with atherogenic lipid profiles but not with glucose and insulin levels in insulin-resistant individuals. Diabetologia 2014, 57, 1204–1208. [Google Scholar] [CrossRef]
- Gómez-Ambrosi, J.; Pascual, E.; Catalán, V.; Rodríguez, A.; Ramírez, B.; Silva, C.; Gil, M.J.; Salvador, J.; Frühbeck, G. Circulating Betatrophin Concentrations Are Decreased in Human Obesity and Type 2 Diabetes. J. Clin. Endocrinol. Metab. 2014, 99, 2004–2009. [Google Scholar] [CrossRef] [PubMed] [Green Version]
- Firneisz, G. Non-alcoholic fatty liver disease and type 2 diabetes mellitus: The liver disease of our age? World J. Gastroenterol. 2014, 20, 9072–9089. [Google Scholar]
- Hübscher, S.G. Histological assessment of non-alcoholic fatty liver disease. Histopathology 2006, 49, 450–465. [Google Scholar] [CrossRef]
- Bedogni, G.; Miglioli, L.; Masutti, F.; Tiribell, C.; Marchesini, G.; Bellentani, S. Prevalence of and risk factors for nonalcoholic fatty liver disease: The Dionysos nutrition and liver study. Hepatology 2005, 42, 44–52. [Google Scholar] [CrossRef] [PubMed]
- Targher, G.; Byrne, C.D. Clinical Review: Nonalcoholic fatty liver disease: A novel cardiometabolic risk factor for type 2 diabetes and its complications. J. Clin. Endocrinol. Metab. 2013, 98, 483–495. [Google Scholar] [CrossRef] [PubMed] [Green Version]
- Hsieh, P.S.; Hsieh, Y.J. Impact of liver diseases on the development of type 2 diabetes mellitus. World J. Gastroenterol. 2011, 17, 5240–5245. [Google Scholar] [CrossRef]
- Arias-Loste, M.T.; García-Unzueta, M.T.; Llerena, S.; Iruzubieta, P.; Puente, A.; Cabezas, J.; Alonso, C.; Cuadrado, A.; Amado, J.A.; Crespo, J.; et al. Plasma betatrophin levels in patients with liver cirrhosis. World J. Gastroenterol. 2015, 21, 10662–10668. [Google Scholar] [CrossRef]
- Bechmann, L.P.; Hannivoort, R.A.; Gerken, G.; Hotamisligil, G.S.; Trauner, M.; Canbay, A. The interaction of hepatic lipid and glucose metabolism in liver diseases. J. Hepatol. 2012, 56, 952–964. [Google Scholar] [CrossRef] [Green Version]
- Zelber-Sagi, S.; Lotan, R.; Shibolet, O.; Webb, M.; Buch, A.; Nitzan-Kaluski, D.; Halpern, Z.; Santo, E.; Oren, R. Non-alcoholic fatty liver disease independently predicts prediabetes during a 7-year prospective follow-up. Liver Int. 2013, 33, 1406–1412. [Google Scholar] [CrossRef]
- Siddiqui, M.S.; Cheang, K.L.; Luketic, V.A.; Boyett, S.; Idowu, M.O.; Patidar, K.; Puri, P.; Matherly, S.; Stravitz, R.T.; Sterling, R.K.; et al. Nonalcoholic steatohepatitis (NASH) is associated with a decline in pancreatic beta cell (beta-cell) function. Dig. Dis. Sci. 2015, 60, 2529–2537. [Google Scholar] [CrossRef] [Green Version]
- Cengiz, M.; Ozenirler, S.; Kocabıyık, M. Serum β-trophin level as a new marker for noninvasive assessment of nonalcoholic fatty liver disease and liver fibrosis. Eur. J. Gastroenterol. Hepatol. 2016, 28, 57–63. [Google Scholar] [CrossRef] [PubMed]
- Kunutsor, S.K.; Apekey, T.A.; Khan, H. Liver enzymes and risk of cardiovascular disease in the general population: A meta-analysis of prospective cohort studies. Atherosclerosis 2014, 236, 7–17. [Google Scholar] [CrossRef]
- Eckel, R.H.; Cornier, M.A. Update on the NCEP ATP-III emerging cardiometabolic risk factors. BMC Med. 2014, 12, 115. [Google Scholar] [CrossRef] [Green Version]
- Fu, Z.; Abou-Samra, A.B.; Zhang, R. An explanation for recent discrepancies in levels of human circulating betatrophin. Diabetologia 2014, 57, 2232–2234. [Google Scholar] [CrossRef] [PubMed]
- Friedewald, W.T.; Levy, R.I.; Fredrickson, D.S. Estimation of the concentration of lowdensity lipoprotein cholesterol in plasma, without use of the preparative ultracentrifuge. Clinical Chemistry 1972, 18, 499–502. [Google Scholar] [CrossRef] [PubMed]
- American Diabetes Association. Standards of medical care in diabetes. Diabetes Care 2014, 37, 14–80. [Google Scholar]
- Kleiner, D.E.; Brunt, E.M.; Van Natta, M.; Behling, C.; Contos, M.J.; Cummings, O.W.; Ferrell, L.D.; Liu, Y.C.; Torbenson, M.S.; Unalp-Arida, A.; et al. Nonalcoholic Steatohepatitis Clinical Research Network. Design and validation of a histological scoring system for nonalcoholic fatty liver disease. Hepatology 2005, 41, 1313–1321. [Google Scholar] [CrossRef]


| Healthy Controls (n = 30) | Patients with NAFLD | p Value Between Three Groups | p Value Control vs. Non-NASH | p Value Control vs. NASH | p Value Non-NASH vs. NASH | ||
|---|---|---|---|---|---|---|---|
| non-NASH (n = 18) | NASH (n = 32) | ||||||
| Age (years) | 28.50 ± 3.91 | 33.38 ± 5.19 | 31.75 ± 5.6 | 0.003 | 0.001 | 0.01 | 0.31 |
| BMI (kg/m2) | 24.91 ± 1.44 | 29.26 ± 2.26 | 27.85 ± 2.03 | <0.001 | <0.001 | <0.001 | 0.03 |
| WC (cm) | 88.50 ± 5.33 | 101.13 ± 6.14 | 100.43 ± 5.68 | <0.001 | <0.001 | <0.001 | 0.52 |
| SBP (mmHg) | 114.66 ± 7.30 | 113.33 ± 7.66 | 114.68 ± 10.15 | 0.845 | 0.55 | 0.99 | 0.62 |
| DBP (mmHg) | 71.66 ± 7.91 | 70.55 ± 8.02 | 71.56 ± 6.77 | 0.870 | 0.64 | 0.96 | 0.64 |
| FPG (mg/dL) | 78.90 ± 8.46 | 94.61 ± 12.92 | 94.18 ± 9.36 | <0.001 | <0.001 | <0.001 | 0.89 |
| TC (mg/dL) | 184.75 ± 29.28 | 188.55 ± 39.95 | 194.53 ± 48.0 | 0.634 | 0.71 | 0.35 | 0.66 |
| TG (mg/dL) | 124 (55–290) | 146 (49–525) | 143 (26–472) | 0.182* | 0.10 | 0.03 | 0.74 |
| HDL-C (mg/dL) | 43.86 ± 6.16 | 43.05 ± 7.5 | 40.71 ± 7.36 | 0.204 | 0.70 | 0.08 | 0.30 |
| LDL-C (mg/dL) | 114.67 ± 28.38 | 117.76 ± 33.54 | 115.56 ± 37.16 | 0.955 | 0.74 | 0.92 | 0.84 |
| AST (IU/L) | 23.00 ± 4.46 | 43.44 ± 10.79 | 57.75 ± 21.42 | <0.001 | <0.001 | <0.001 | 0.01 |
| ALT (IU/L) | 22.03 ± 7.03 | 90.33 ± 30.79 | 123.72 ± 47.80 | <0.001 | <0.001 | <0.001 | 0.01 |
| GGT (IU/L) | 22.0 (20–30) | 50.5 (24–118) | 61.0 (20–455) | 0.002 * | <0.001 | 0.001 | 0.53 |
| Insulin (µU/mL) | 6.44 (2.2–10.9) | 15.25 (4.90–32.34) | 12.48 (2.57–45.13) | <0.001 * | <0.001 ** | <0.001 ** | 0.76 ** |
| HOMA-IR | 1.24 (0.41–2.5) | 3.68 (0.86–7.19) | 2.96 (0.53–11.03) | <0.001 * | <0.001 ** | <0.001 ** | 0.69 ** |
| Betatrophin (pg/mL) | 87.17 (60.1–131.2) | 175.12 (56.1–839.1) | 122.28 (53.1–450.1) | 0.05 * | 0.02 ** | 0.18 ** | 0.17 ** |
| MODEL 1* (R = 0.534) | MODEL 2* (R = 0.613) | MODEL 3* (R = 0.665) | ||||
|---|---|---|---|---|---|---|
| Beta ** | p | Beta ** | p | Beta ** | p | |
| Glucose | 0.308 | 0.017 | ||||
| NAS | −0.288 | 0.022 | −0.260 | 0.030 | ||
| WC | 0.111 | 0.393 | 0.148 | 228 | 0.107 | 0.370 |
| Age | 0.271 | 0.042 | 0.178 | 0.196 | 0.136 | 0.312 |
| TC | 0.093 | 0.615 | 0.071 | 0.685 | 0.071 | 0.670 |
| LDL-C | 0.234 | 0.139 | 0.225 | 0.134 | 0.188 | 0.193 |
| GGT | 0.126 | 0.336 | 0.067 | 0.599 | 0.089 | 0.467 |
| Insulin | 0.024 | 0.856 | −0.078 | 0.545 | −0.086 | 0.488 |
| HOMA-IR | 0.087 | 0.505 | −0.061 | 0.658 | −0.070 | 0.598 |
| Unstandardized Coefficients | Standardized Coefficients | p | ||
|---|---|---|---|---|
| B | Standard Error | Beta | ||
| Consant | −235.097 | 220.104 | ||
| TG | 0.668 | 0.173 | 0.457 | 0.000 |
| Glucose | 5.088 | 2.159 | 0.281 | 0.023 |
| NAS | −36.560 | 16.305 | −0.260 | 0.030 |
Publisher’s Note: MDPI stays neutral with regard to jurisdictional claims in published maps and institutional affiliations. |
© 2021 by the authors. Licensee MDPI, Basel, Switzerland. This article is an open access article distributed under the terms and conditions of the Creative Commons Attribution (CC BY) license (https://creativecommons.org/licenses/by/4.0/).
Share and Cite
Sonmez, A.; Dogru, T.; Ercin, C.N.; Genc, H.; Celebi, G.; Gurel, H.; Tapan, S.; Cicek, A.F.; Barcin, C.; Haymana, C.; et al. Betatrophin Levels Are Related to the Early Histological Findings in Nonalcoholic Fatty Liver Disease. Metabolites 2021, 11, 425. https://0-doi-org.brum.beds.ac.uk/10.3390/metabo11070425
Sonmez A, Dogru T, Ercin CN, Genc H, Celebi G, Gurel H, Tapan S, Cicek AF, Barcin C, Haymana C, et al. Betatrophin Levels Are Related to the Early Histological Findings in Nonalcoholic Fatty Liver Disease. Metabolites. 2021; 11(7):425. https://0-doi-org.brum.beds.ac.uk/10.3390/metabo11070425
Chicago/Turabian StyleSonmez, Alper, Teoman Dogru, Cemal Nuri Ercin, Halil Genc, Gurkan Celebi, Hasan Gurel, Serkan Tapan, Ali Fuat Cicek, Cem Barcin, Cem Haymana, and et al. 2021. "Betatrophin Levels Are Related to the Early Histological Findings in Nonalcoholic Fatty Liver Disease" Metabolites 11, no. 7: 425. https://0-doi-org.brum.beds.ac.uk/10.3390/metabo11070425