
High Throughput Procedure for Comparative Analysis of In Vivo Cardiac Glucose or Amino Acids Use in Cardiovascular Pathologies and Pharmacological Treatments


Abstract
:
1. Introduction
2. Results
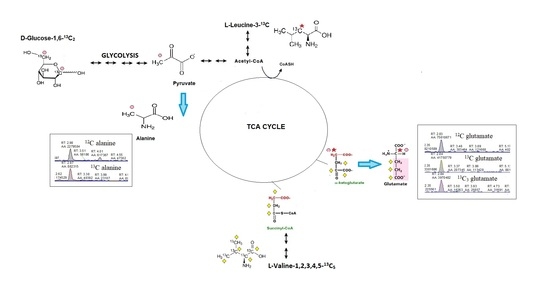
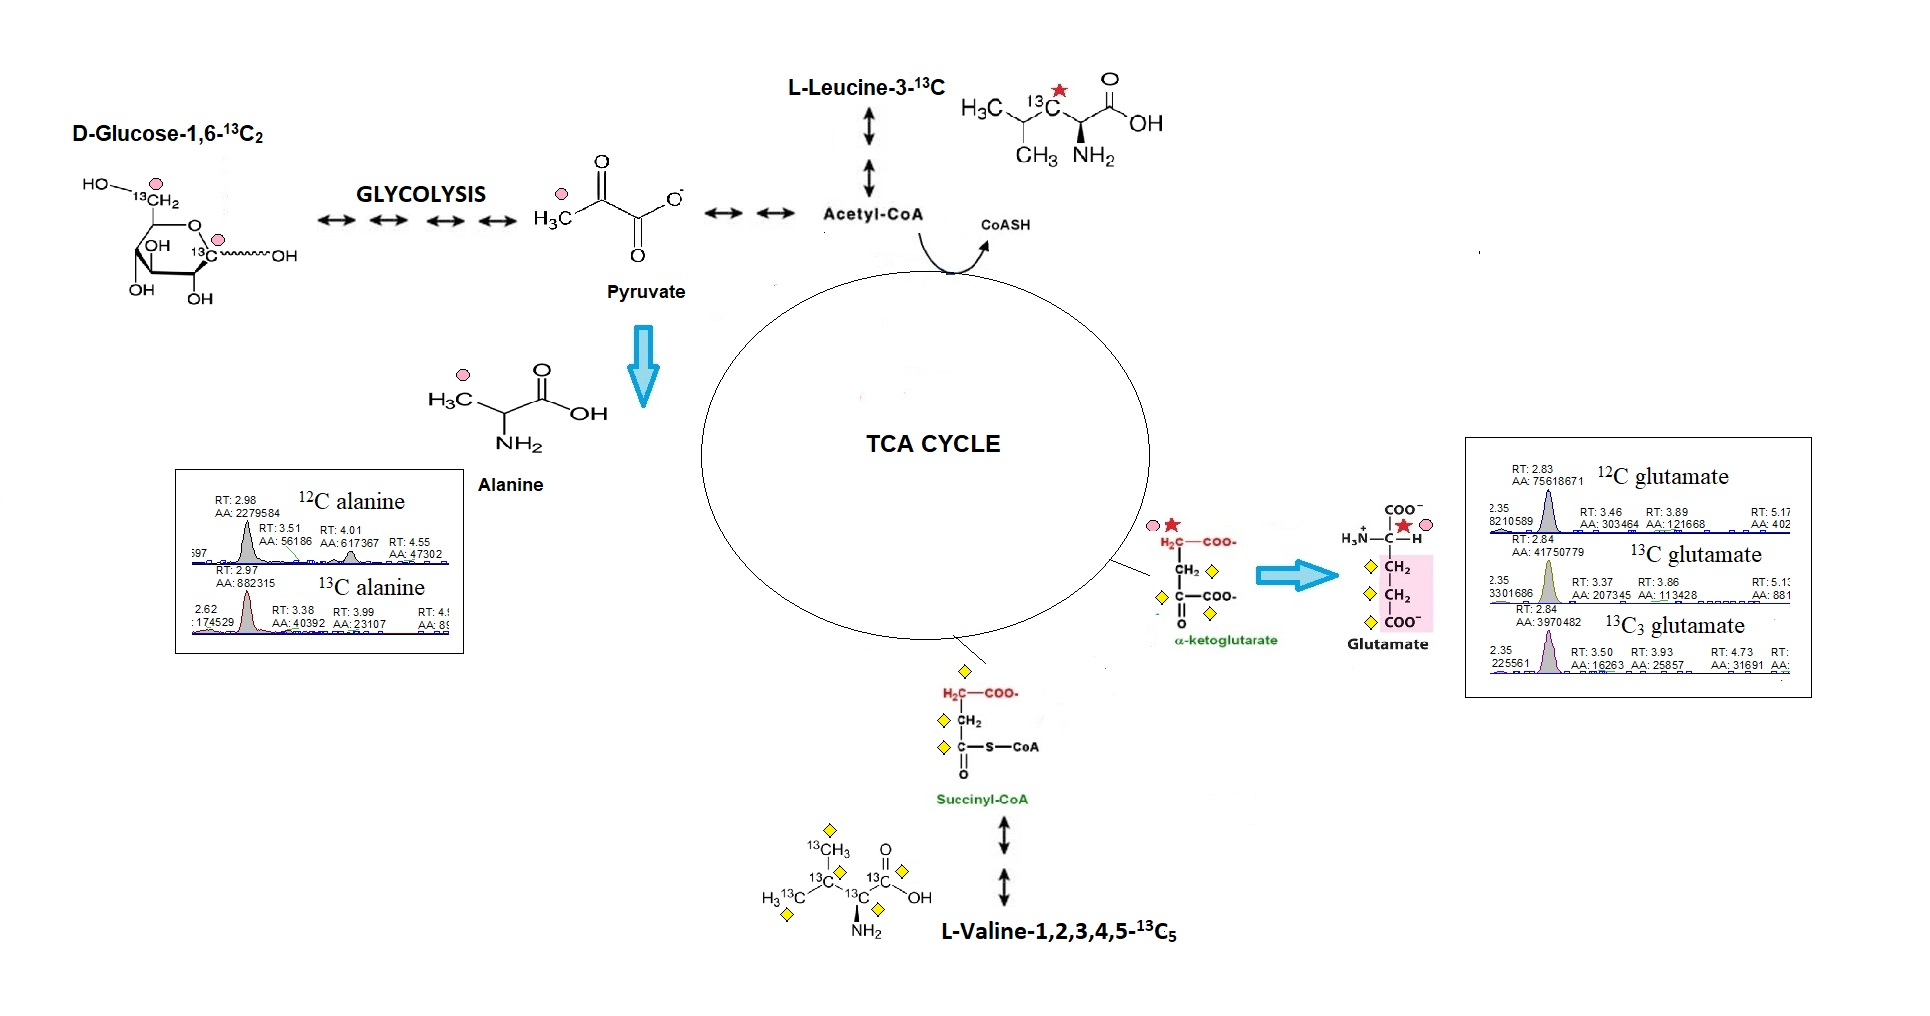
2.1. Cardiac Substrate Preference Methods Conditions
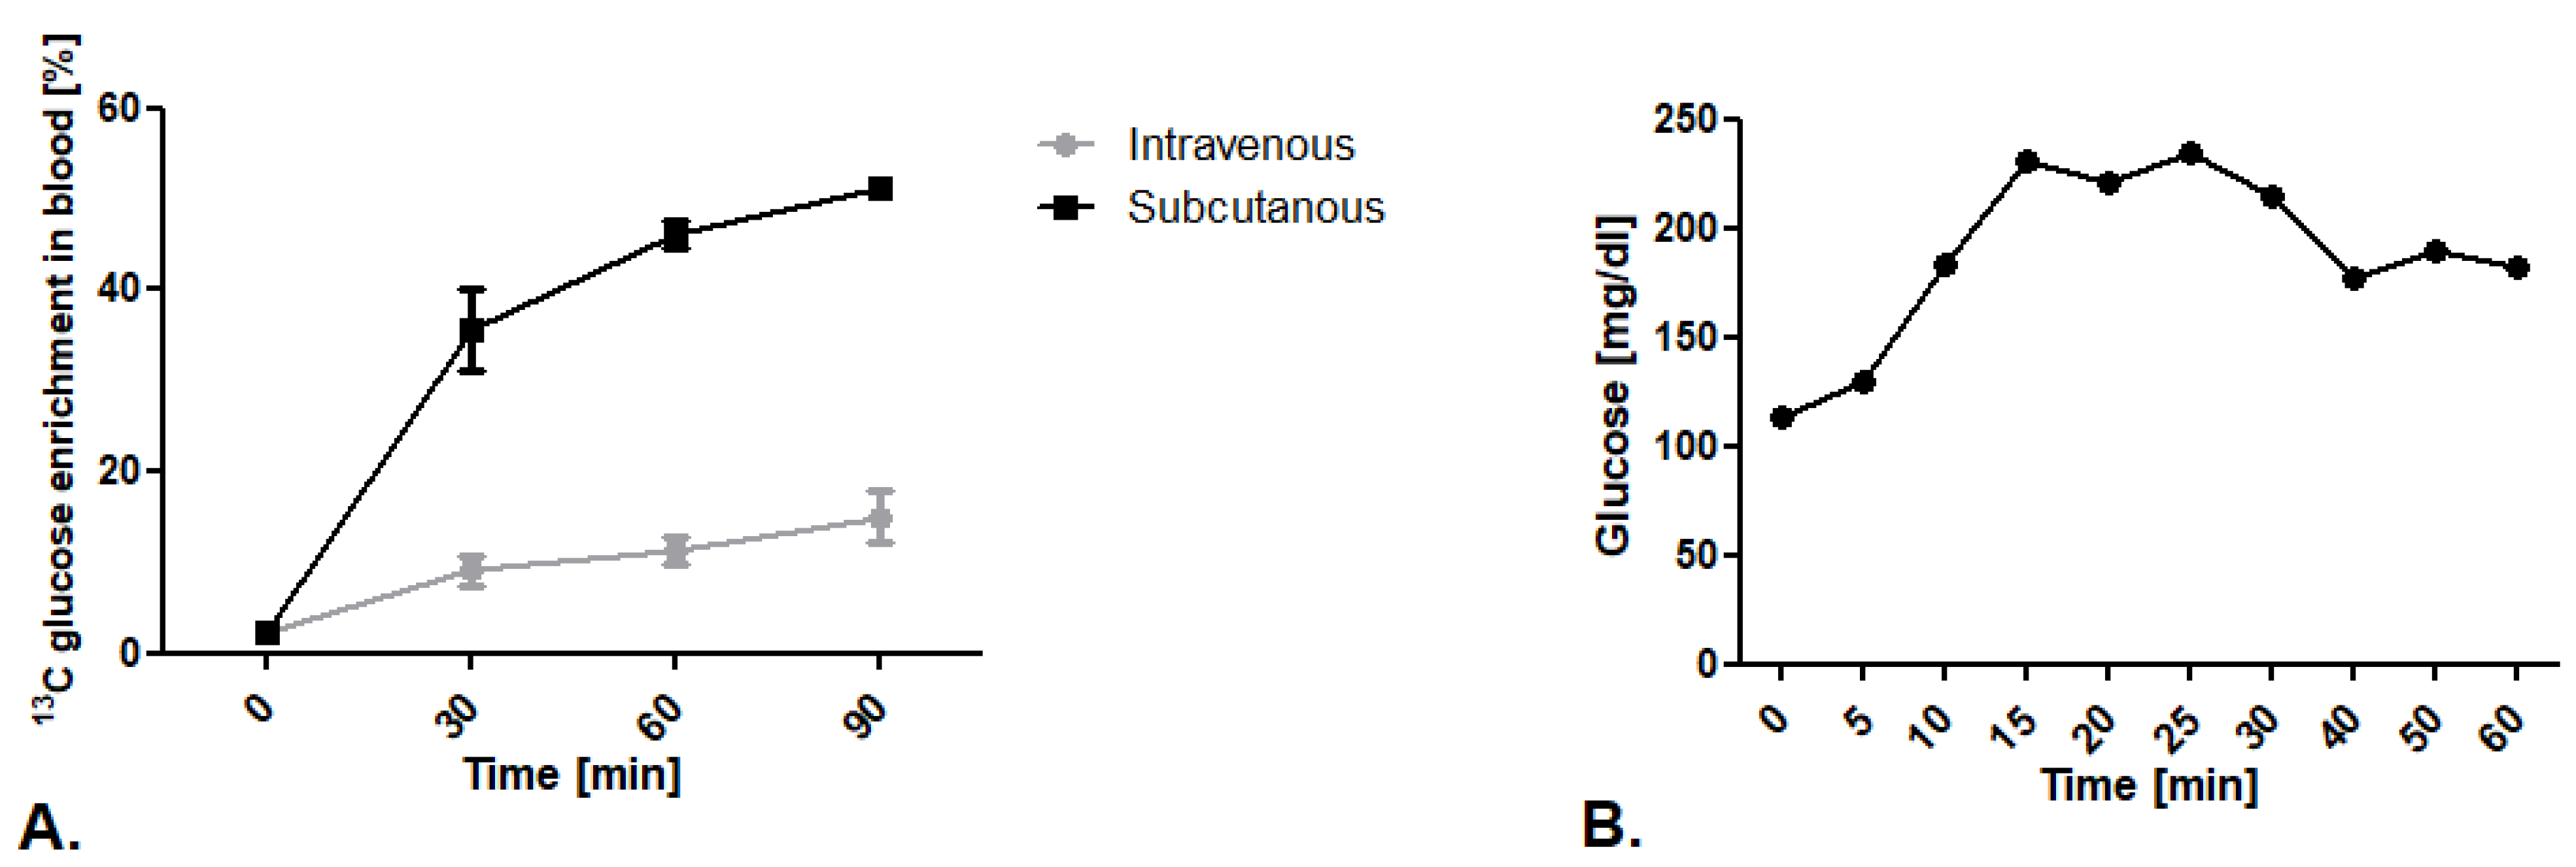
2.1.1. Comparison of 13C Glucose Intravenous Infusion and Subcutaneous Injection
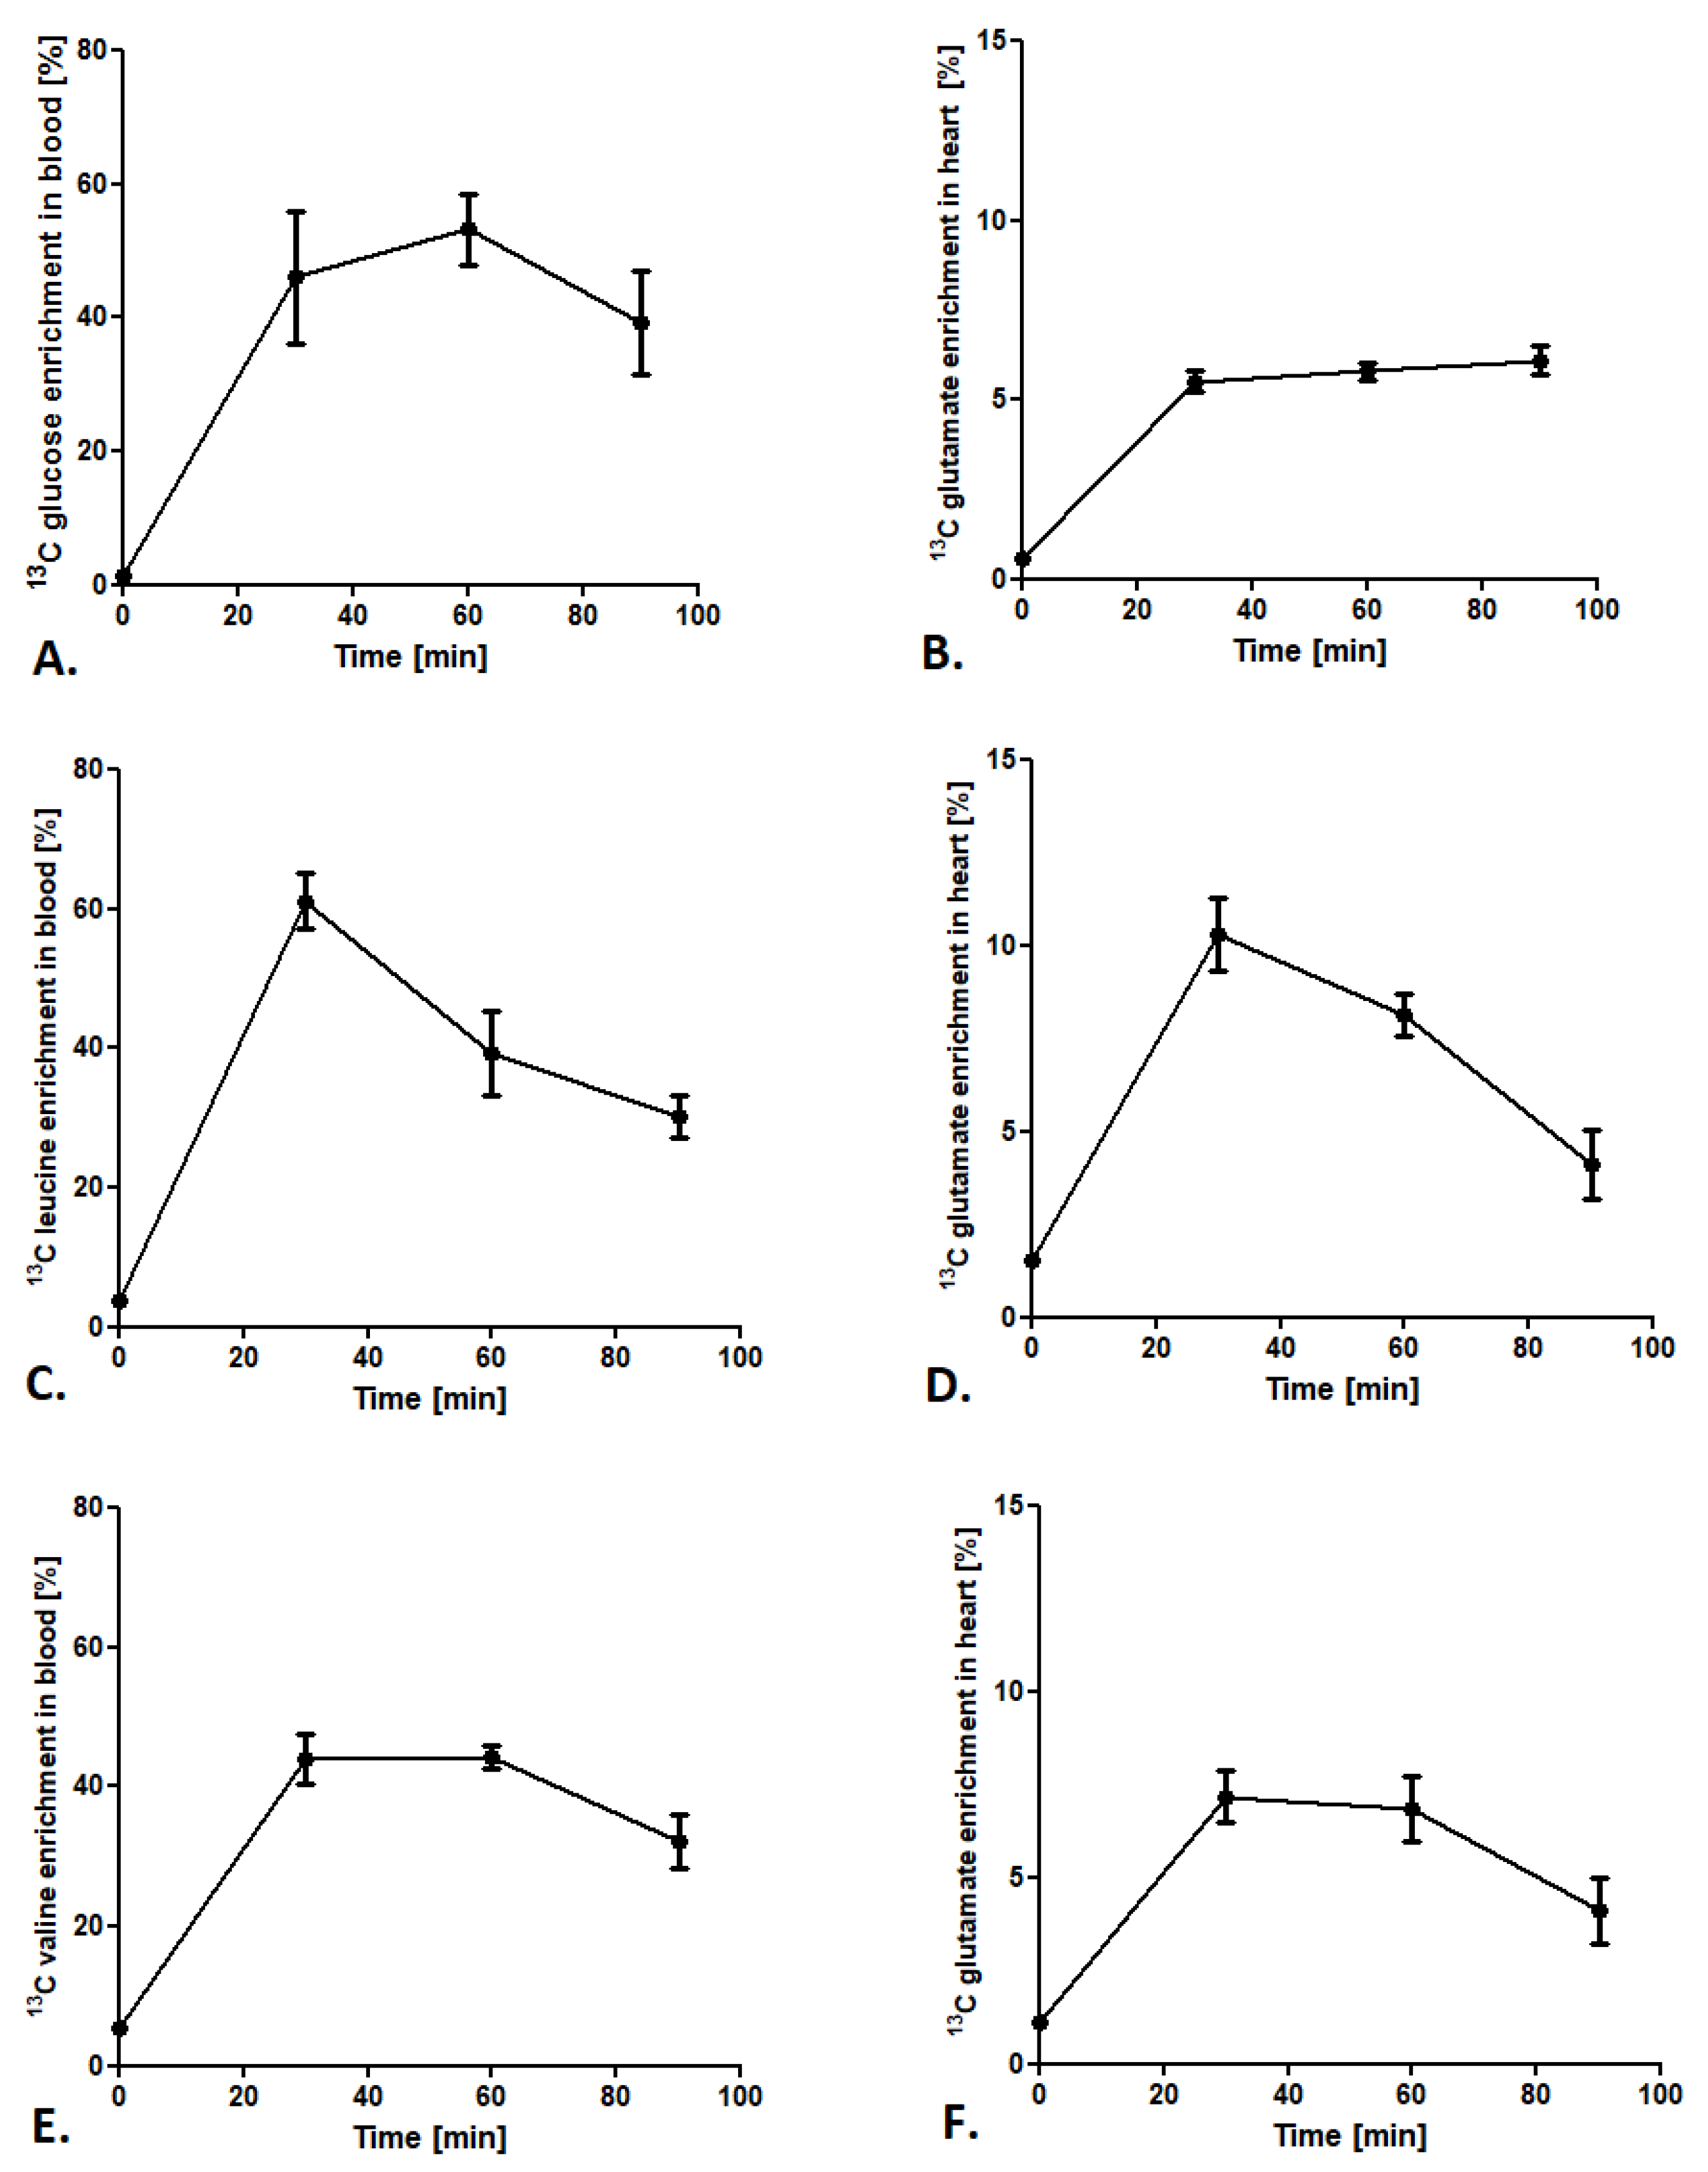
2.1.2. Optimization of Methods Conditions
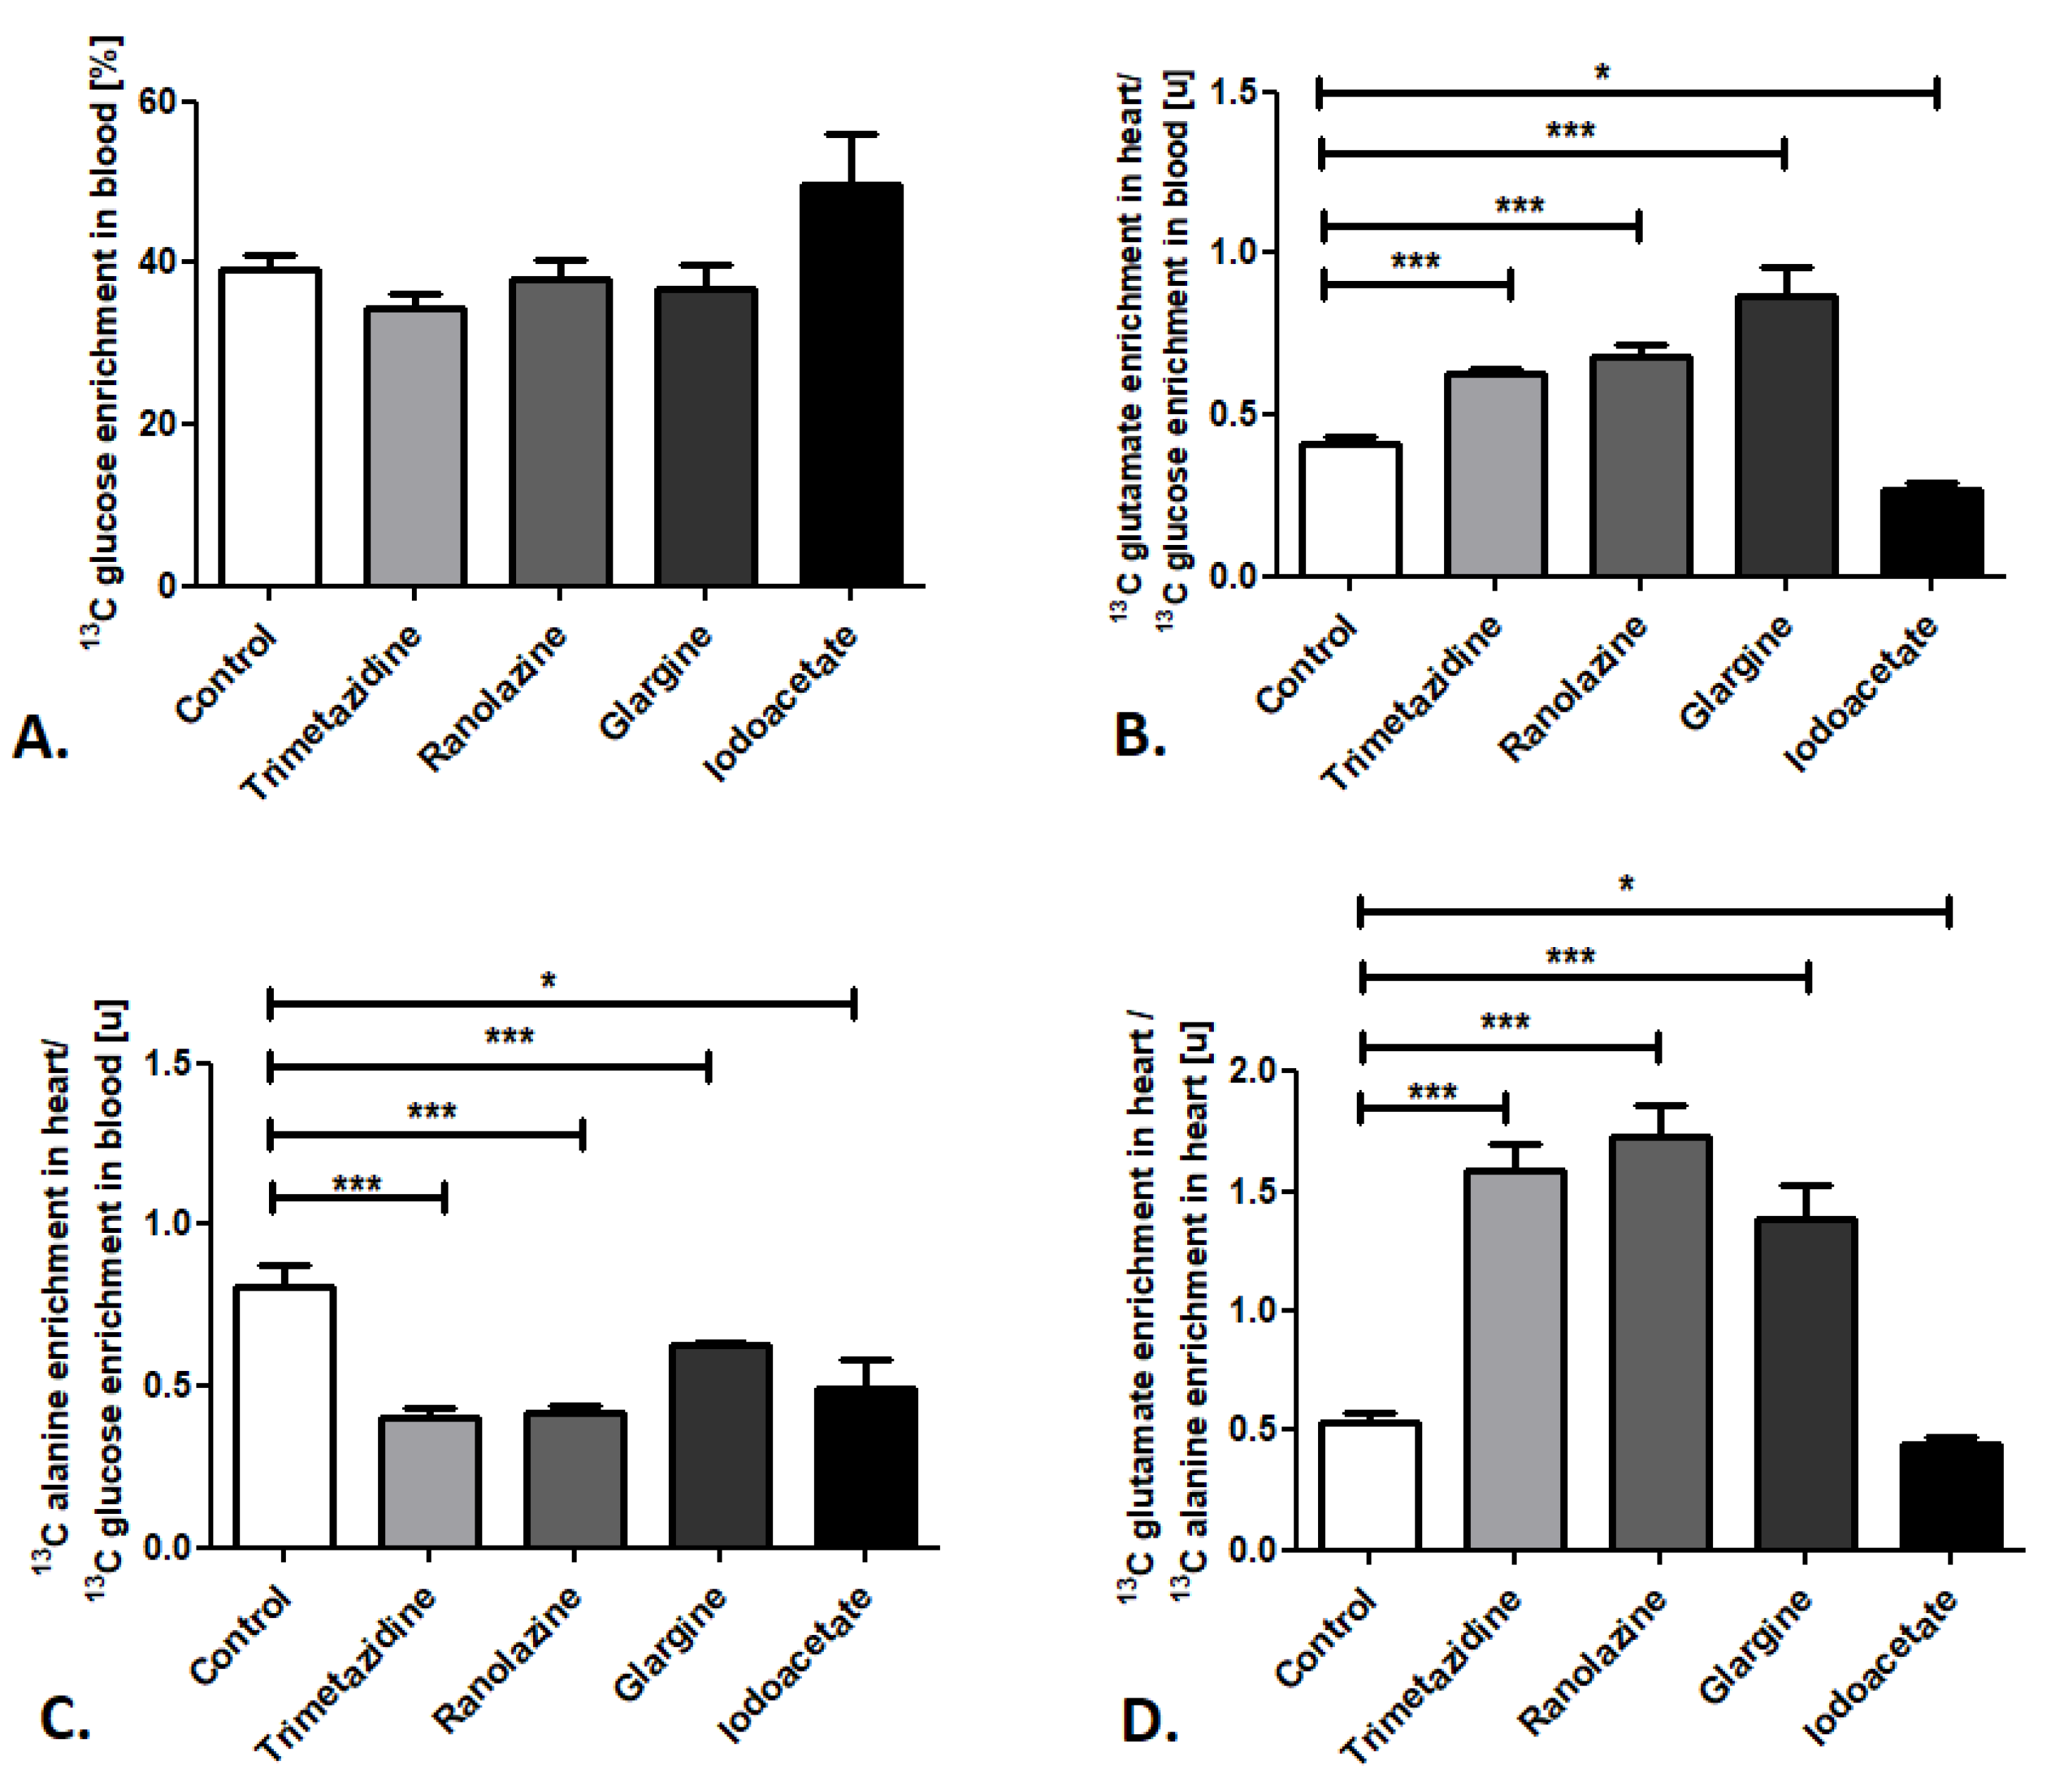
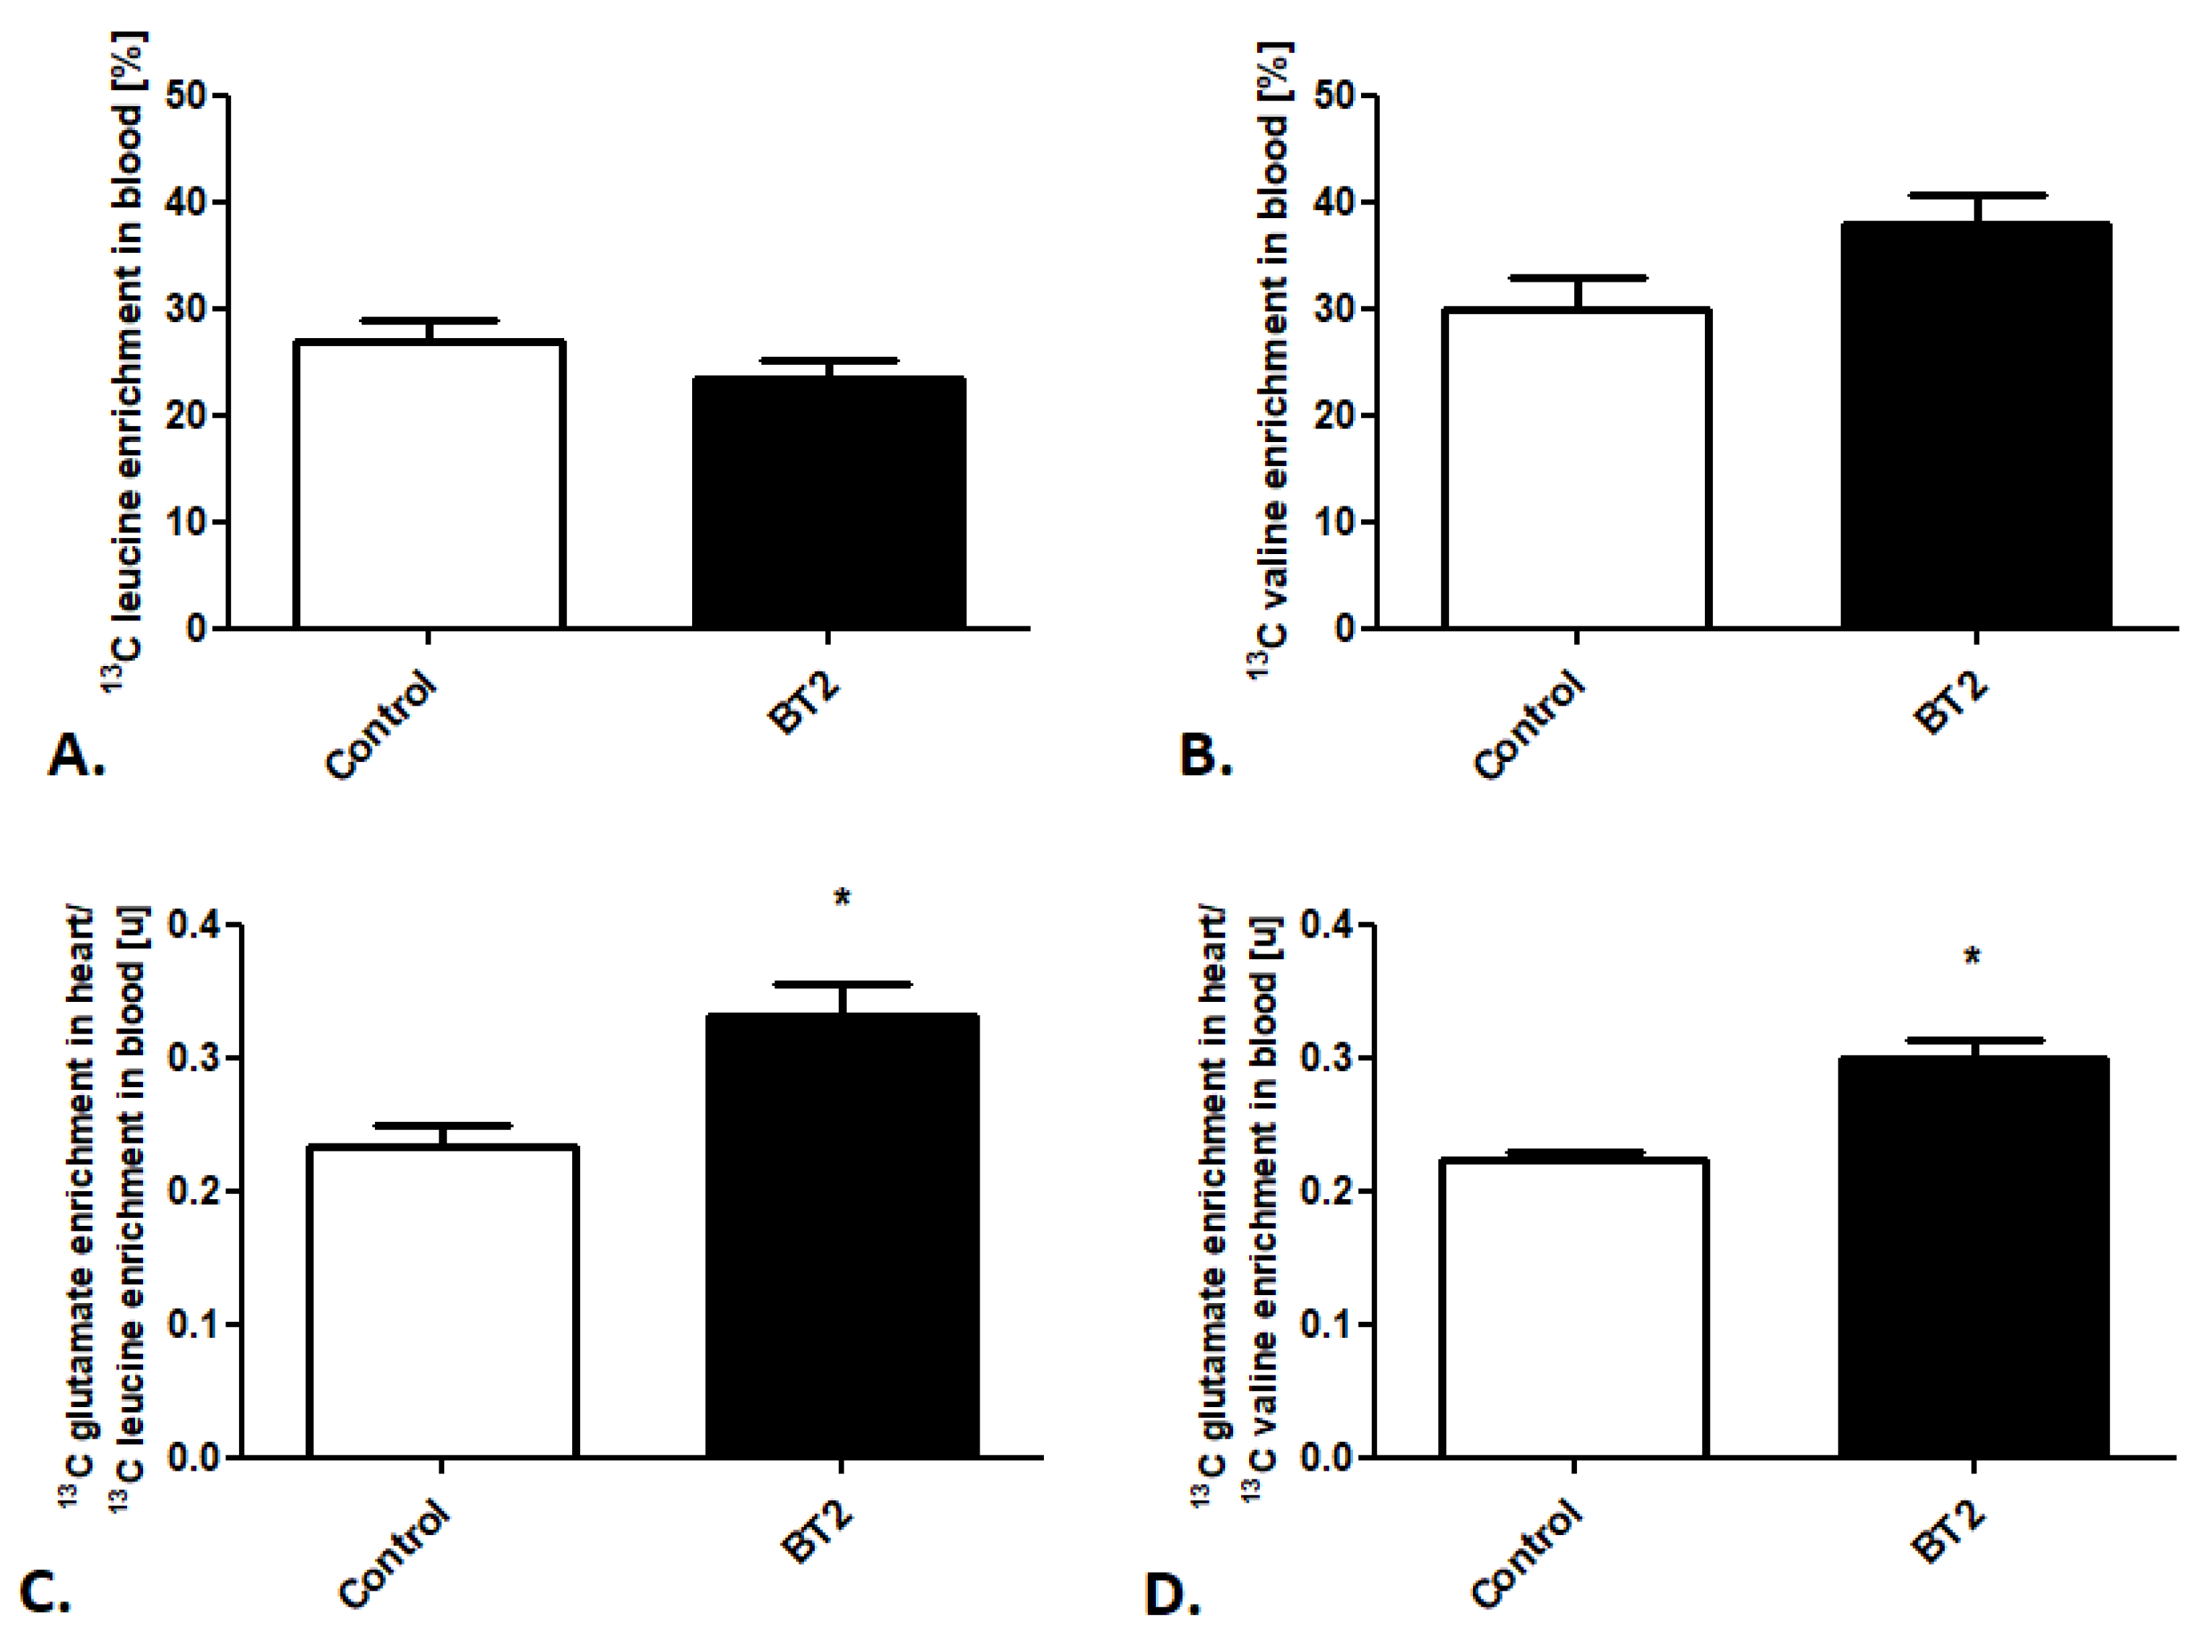
2.2. Cardiac Substrate Preference Analysis under Pharmacotherapy Conditions
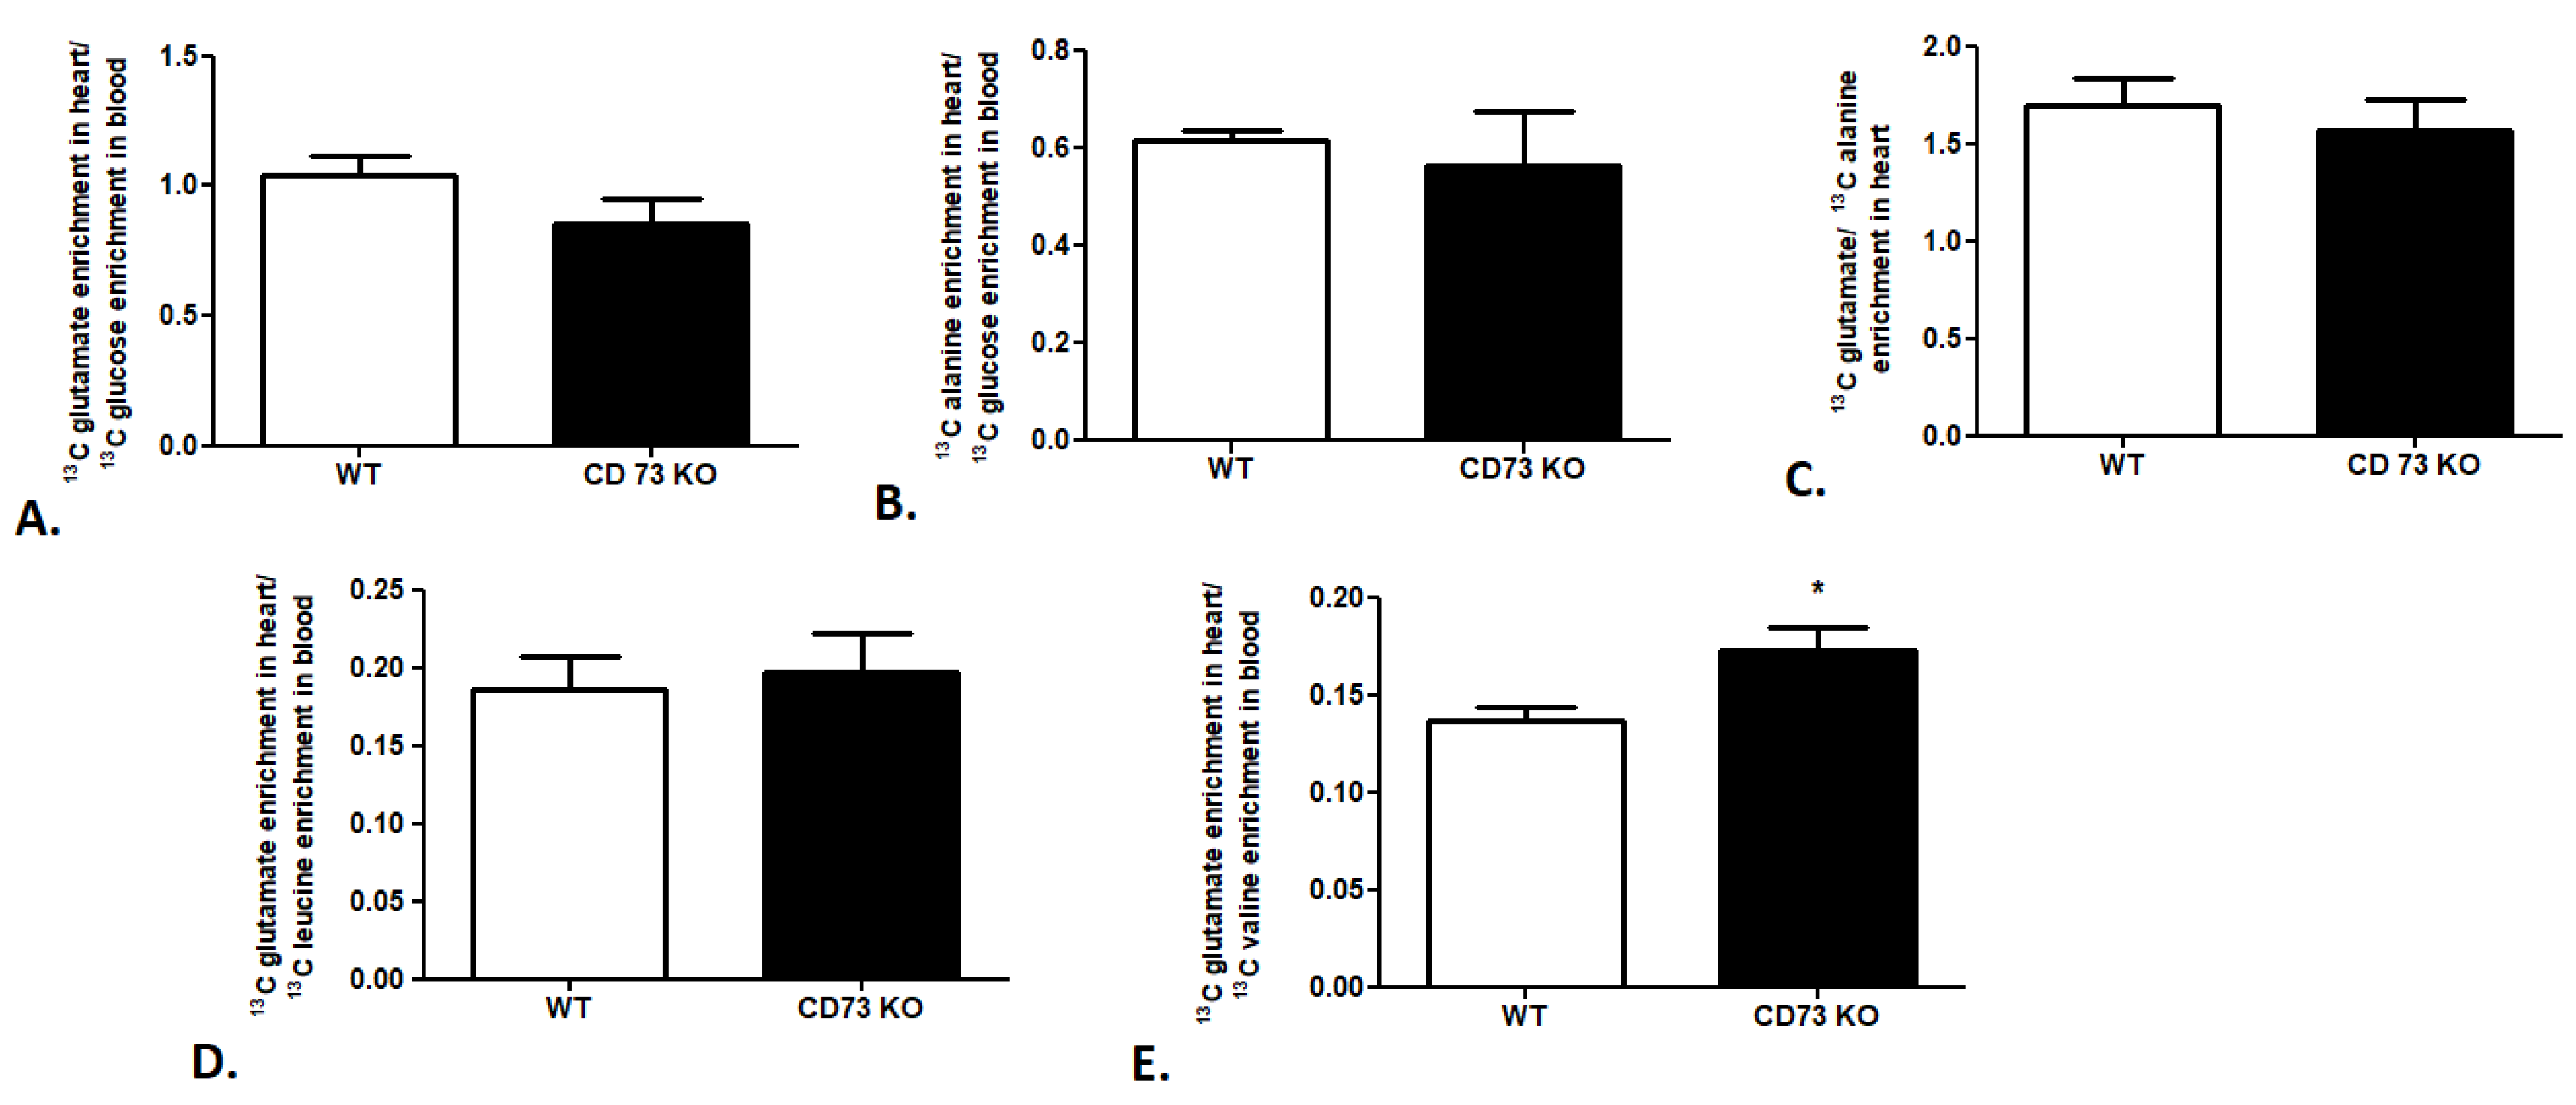
2.3. Cardiac Substrate Preference Analysis in Mouse Model of Cardiovascular Disease
3. Discussion
4. Materials and Methods
4.1. Animals
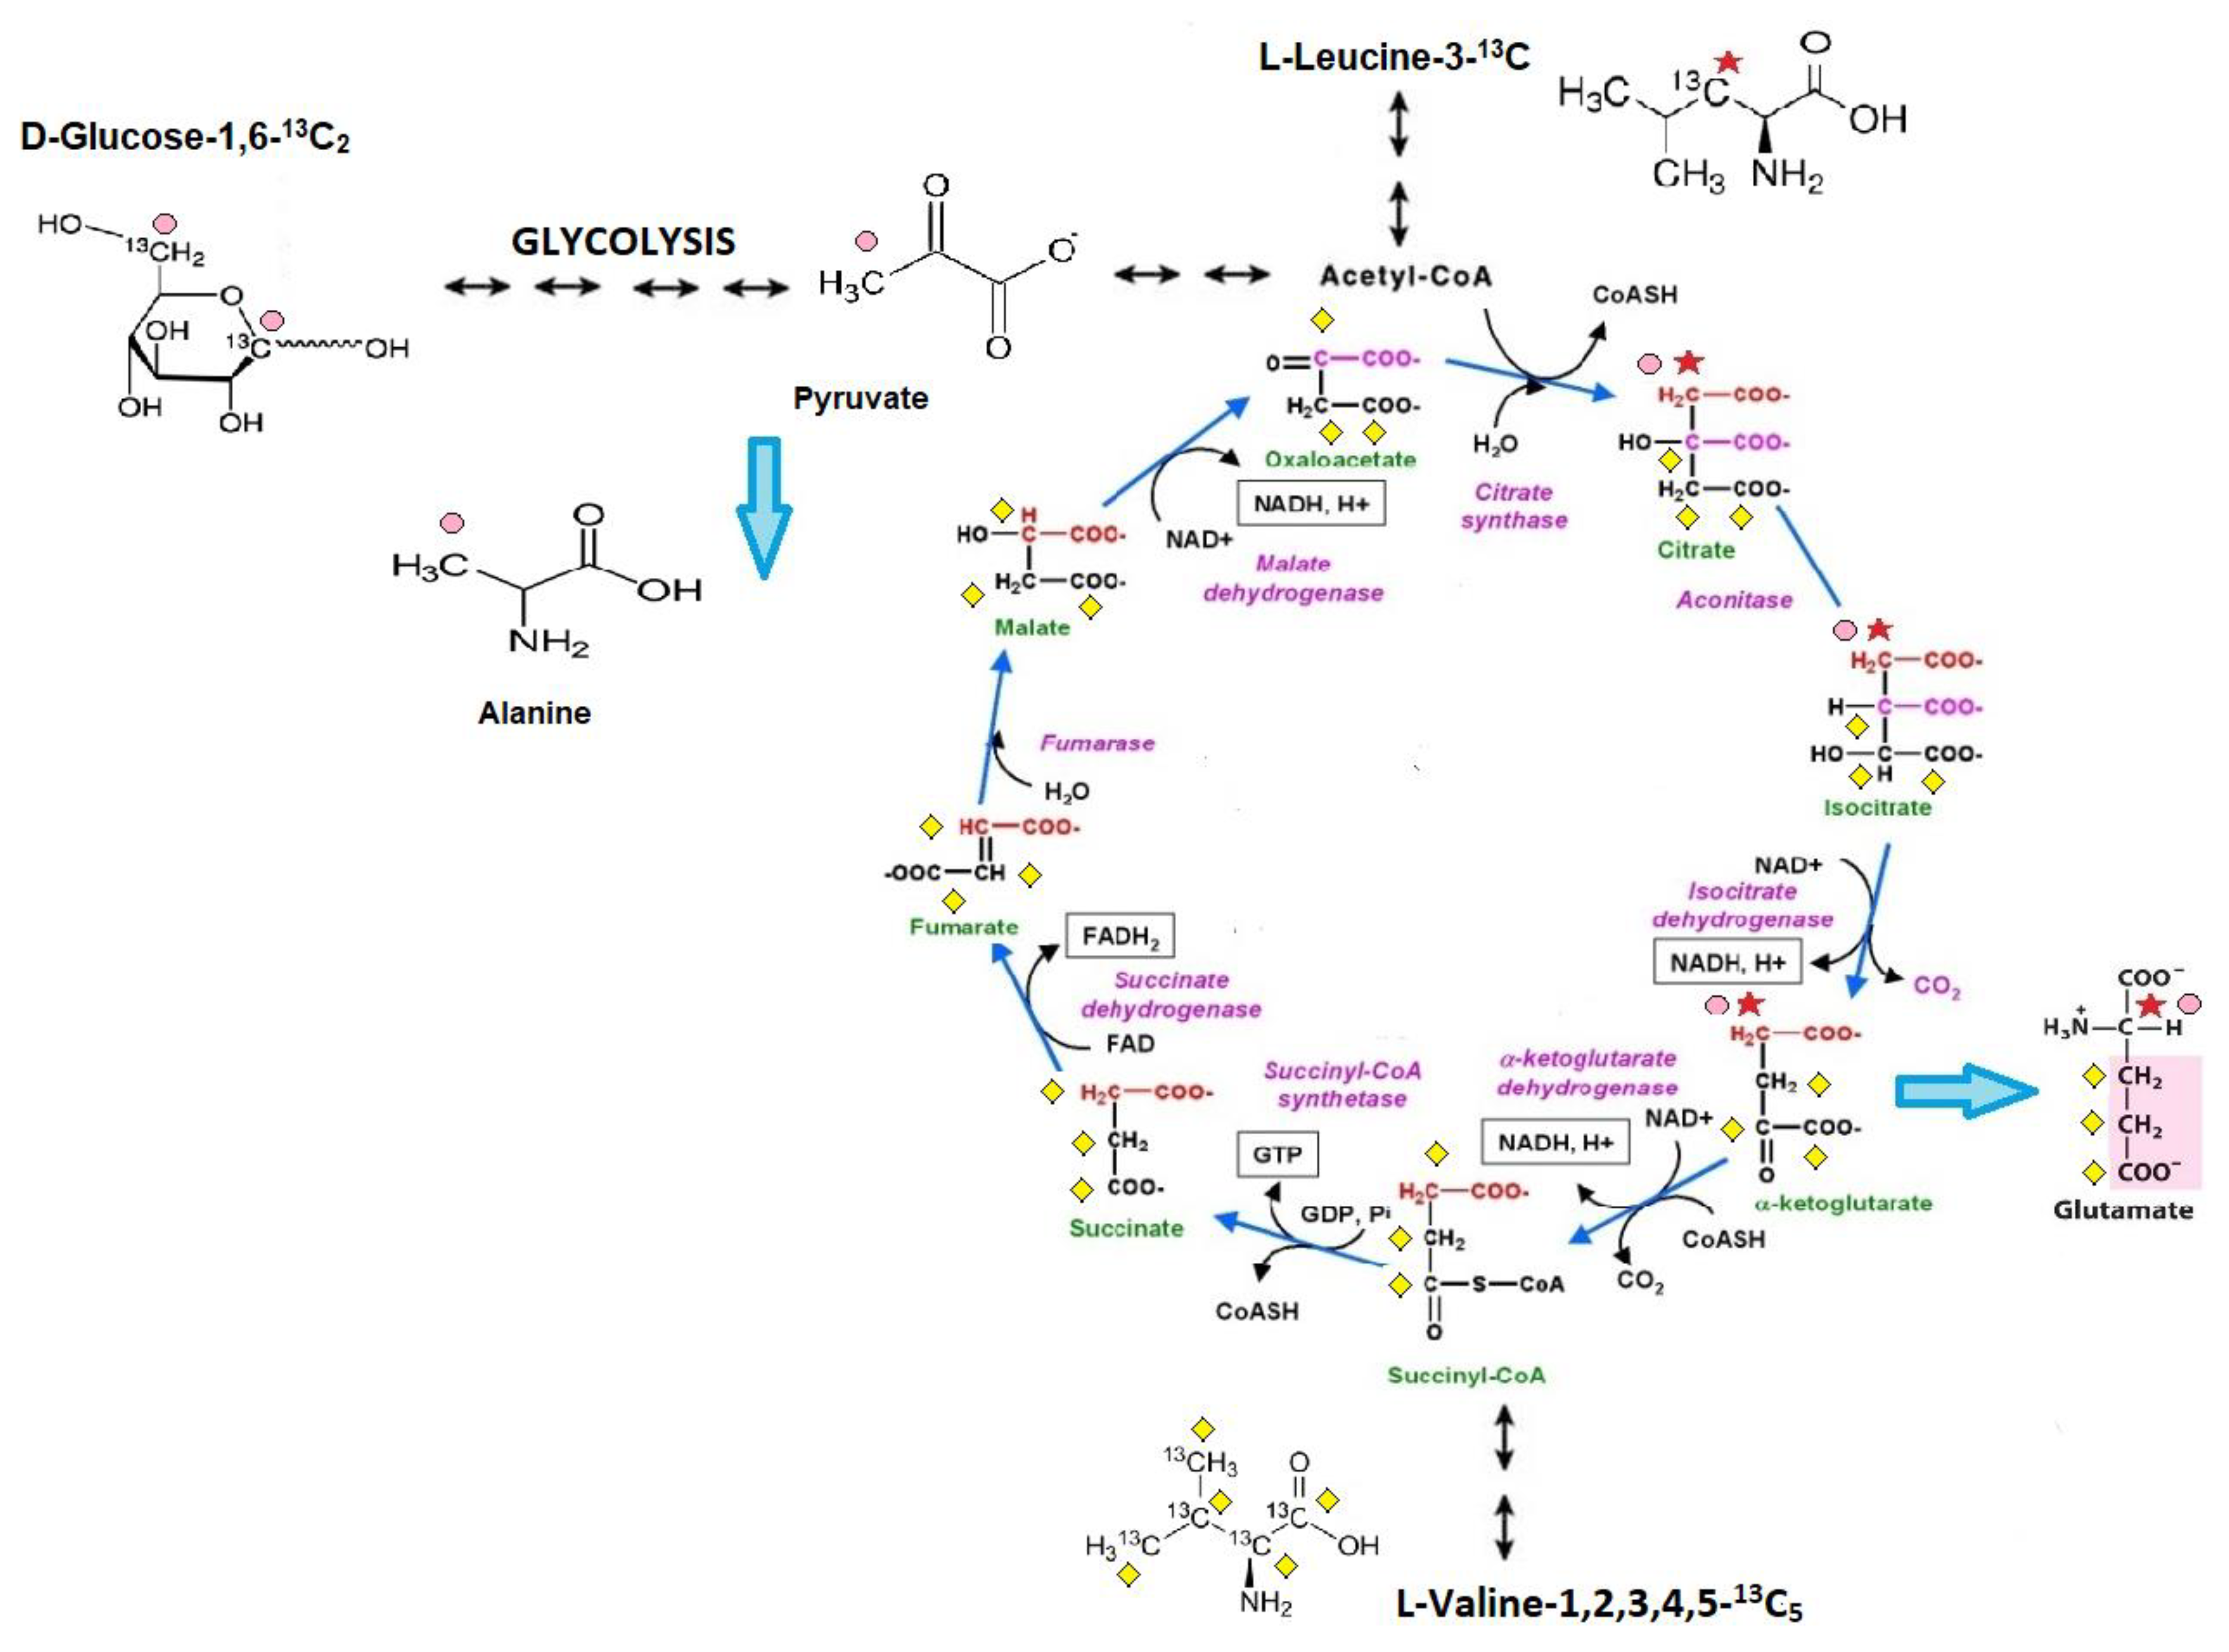
4.1.1. Administration of Stable 13C Glucose or 13C Branched-Chain Amino Acid Isotopomers
4.1.2. Administration of Glucose, Fatty Acids, and Branched-Chain Amino Acid Metabolic Inhibitors
4.2. Blood Extraction
4.3. Heart Extraction
4.4. LC/MS Methods
4.5. Statistical Analyses
5. Conclusions
Author Contributions
Funding
Institutional Review Board Statement
Informed Consent Statement
Data Availability Statement
Conflicts of Interest
Appendix A


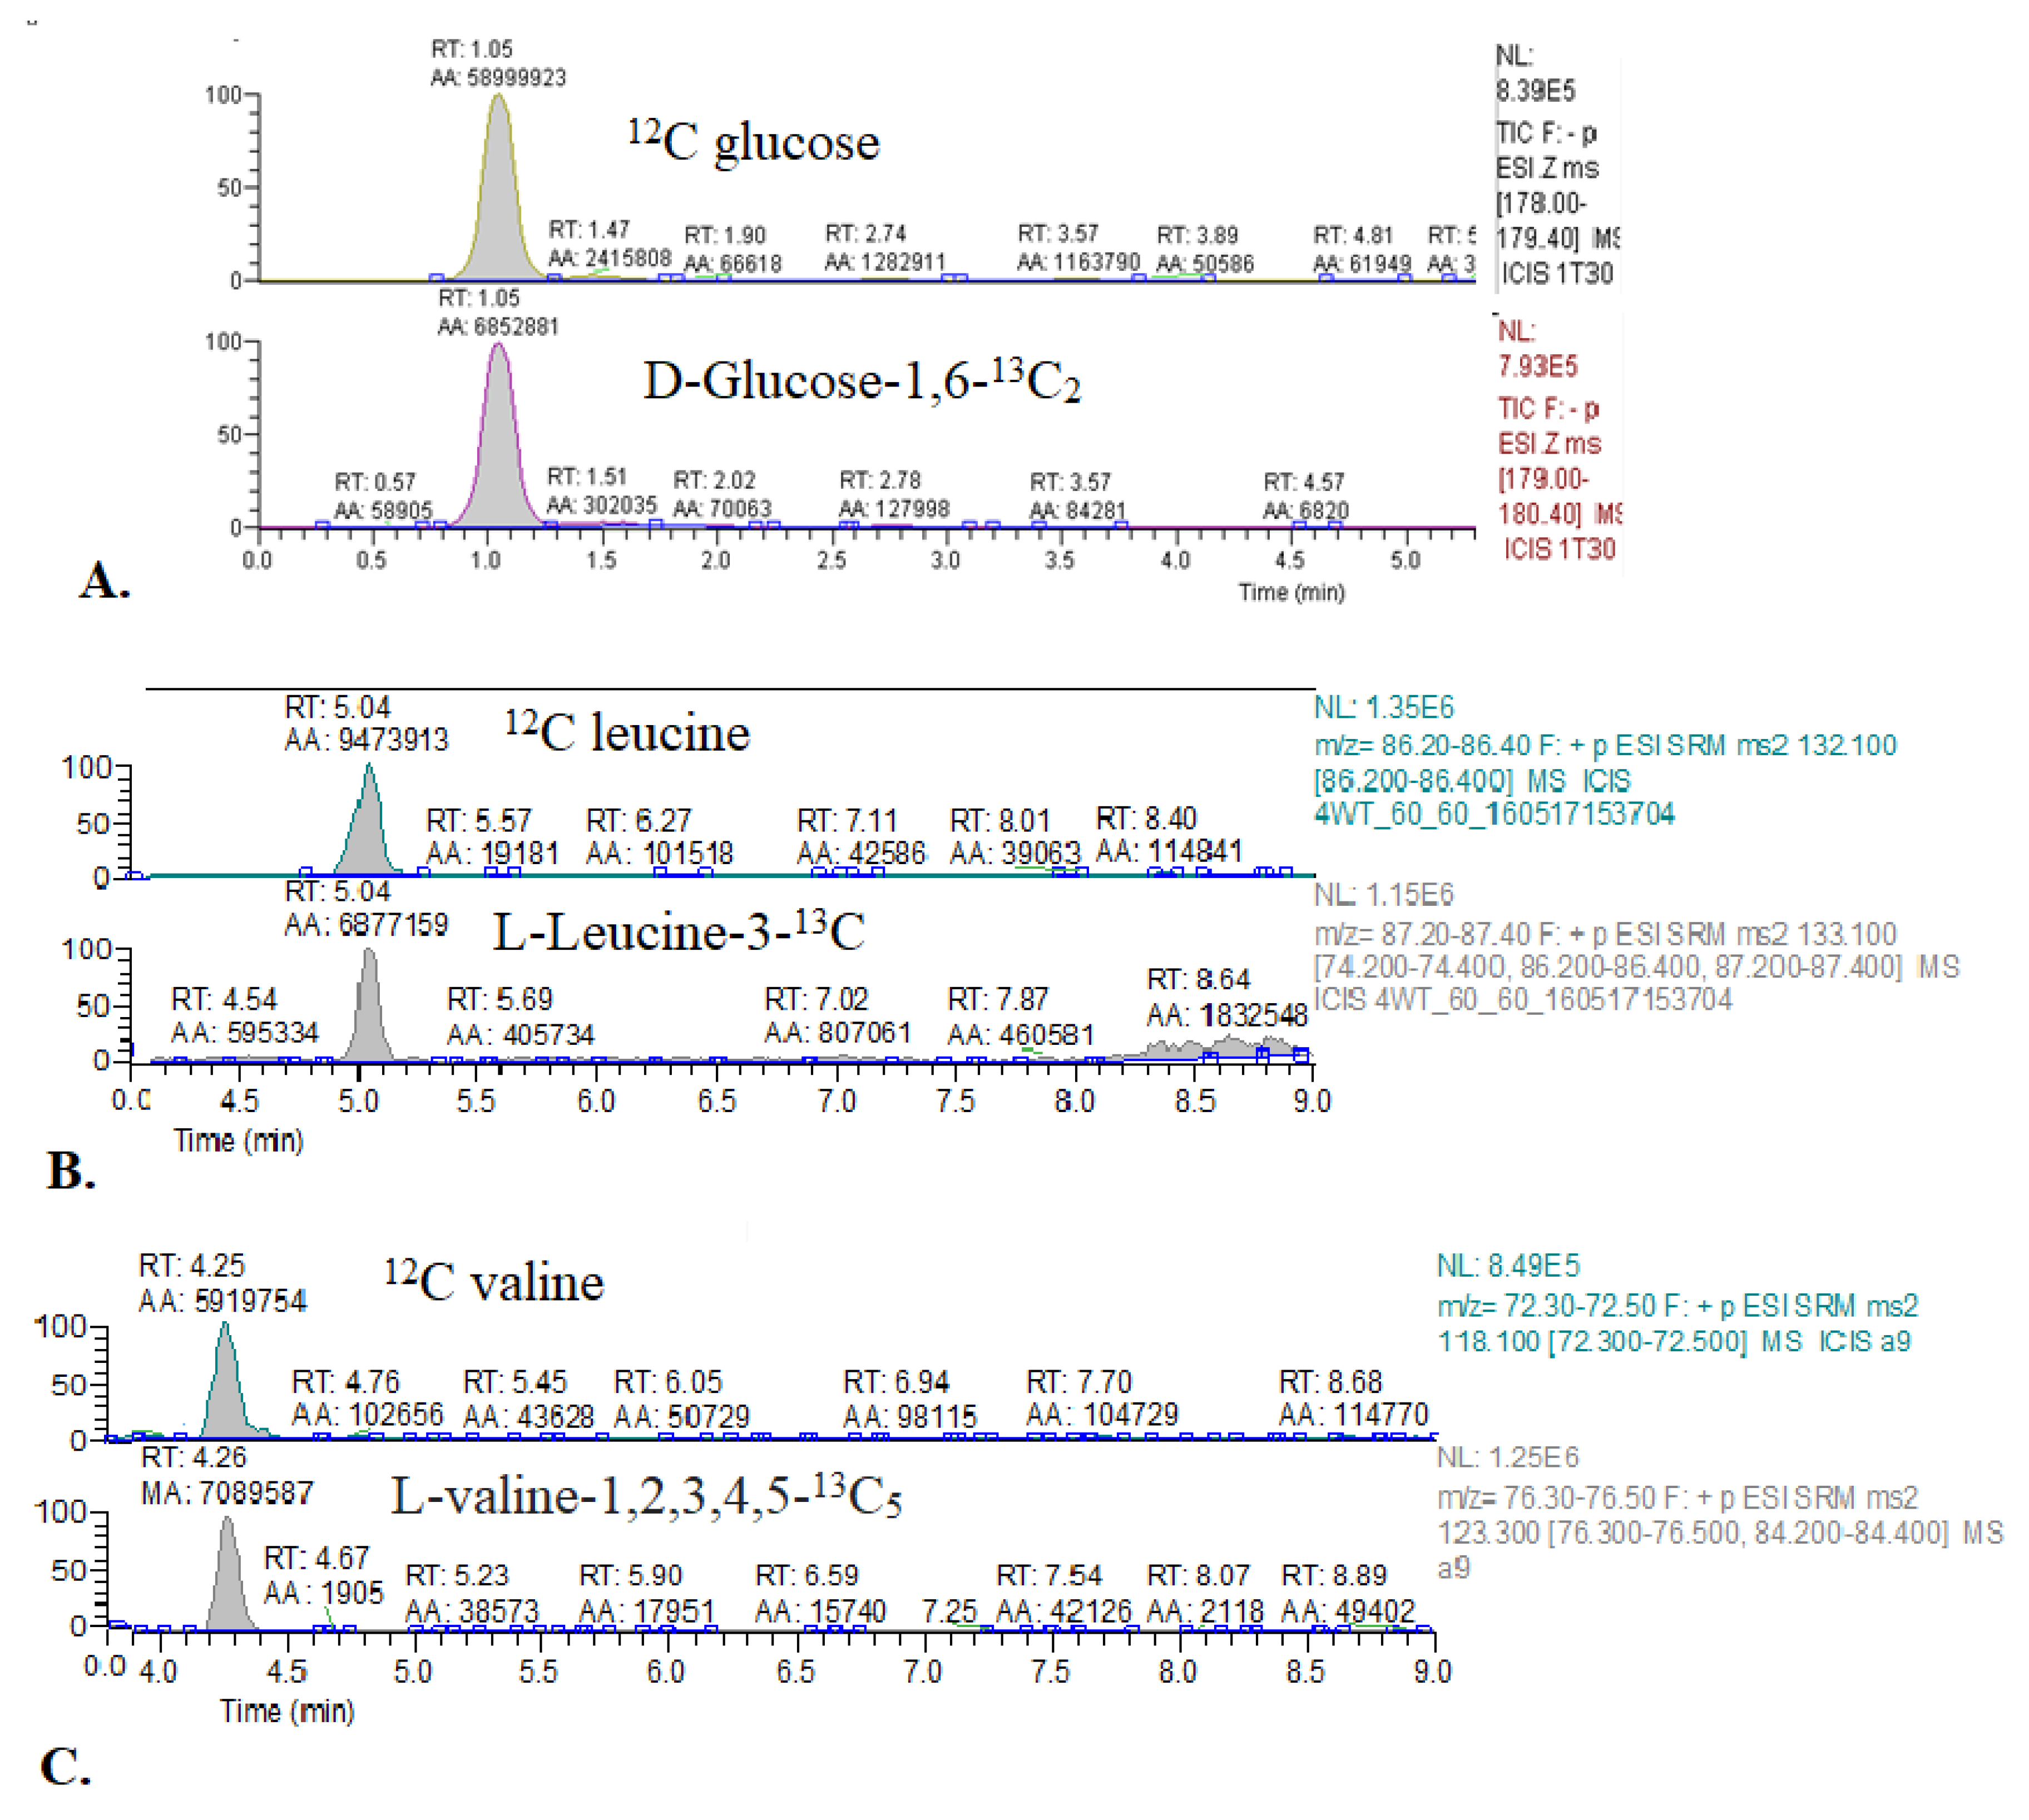
| Compound | Primary Ion (m/z) | Derivative Ions (m/z) |
|---|---|---|
| Glucose | 178.00–179.40 | -(SIM mode) |
| 1,6-13C2 glucose | 179.00–180.40 | -(SIM mode) |
| Leucine | 132.10 | 86.20–86.40 |
| 3-13C leucine | 133.10 | 87.20–87.40 |
| Valine | 118.10 | 72.30–72.50 |
| 1,2,3,4,5-13C5 valine | 123.30 | 76.30–76.50 |
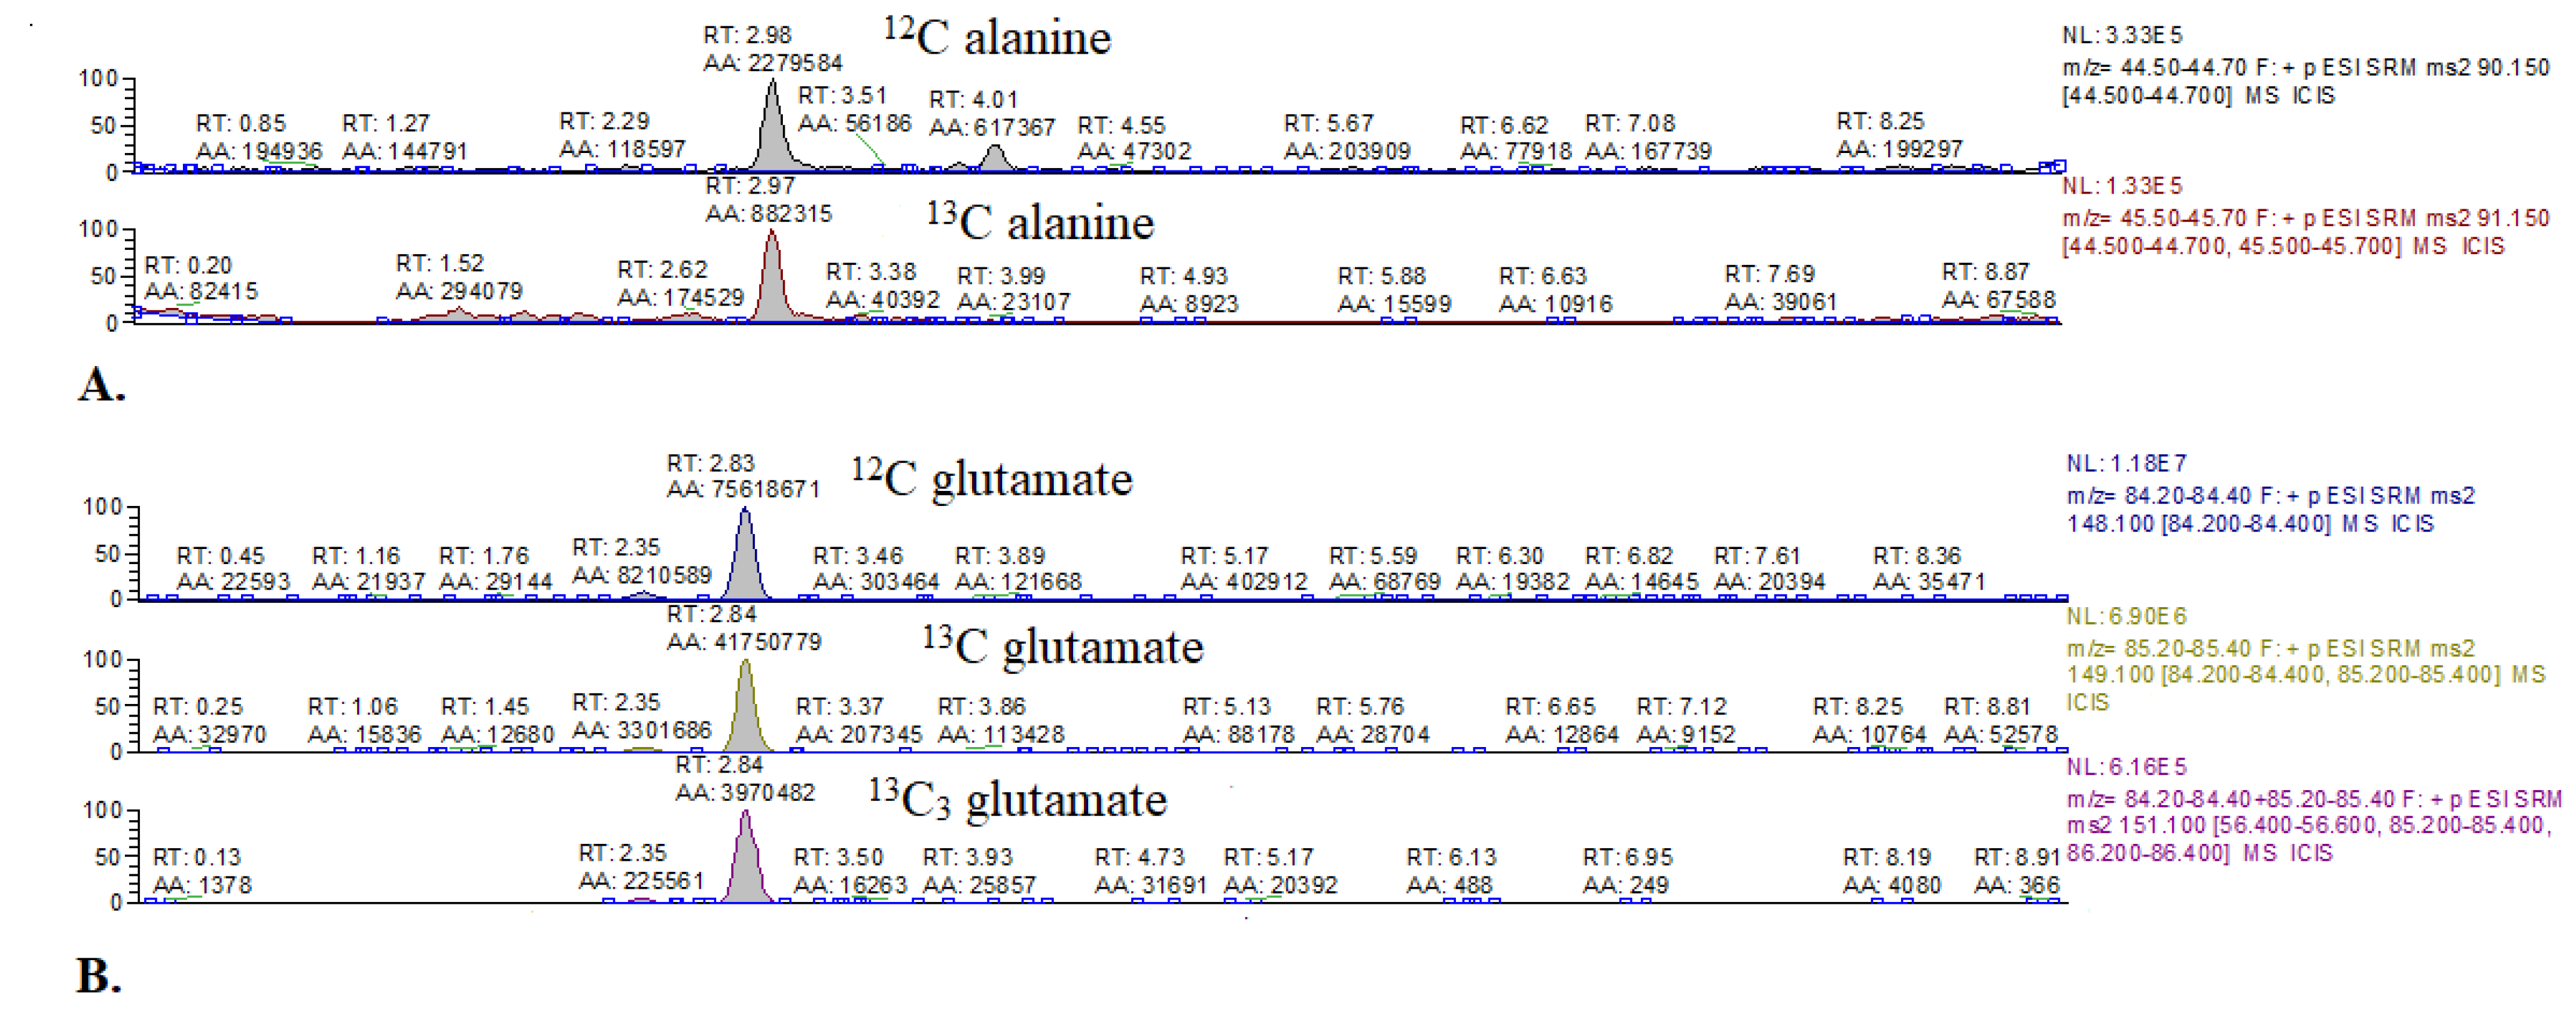
| Glutamate | 148.10 | 84.20–84.40 |
| 4-13C glutamate | 149.10 | 84.20–84.40, 85.20–85.40 |
| 1,2,3-13C3 glutamate | 151.10 | 85.30 |
| Alanine | 90.15 | 44.50–44.70 |
| 3-13C alanine | 91.15 | 44.50–44.70 |
References
- Neubauer, S. The failing heart—An engine out of fuel. N. Engl. J. Med. 2007, 356, 1140–1151. [Google Scholar] [CrossRef] [PubMed] [Green Version]
- Ventura-Clapier, R.; Garnier, A.; Veksler, V. Energy metabolism in heart failure. J. Physiol. 2004, 555, 1–13. [Google Scholar] [CrossRef] [PubMed]
- Tune, J.D.; Gorman, M.W.; Feigl, E.O. Matching coronary blood flow to myocardial oxygen consumption. J. Appl. Physiol. 2004, 97, 404–415. [Google Scholar] [CrossRef] [Green Version]
- Lopaschuk, G.D.; Spafford, M.A.; Marsh, D.R. Glycolysis is predominant source of myocardial ATP production immediately after birth. Am. J. Physiol. Hear. Circ. Physiol. 1991, 261, H1698–H1705. [Google Scholar] [CrossRef] [PubMed]
- Opie, L.H. Metabolism of the heart in health and disease. Part I. Am. Heart J. 1968, 76, 685–698. [Google Scholar] [CrossRef]
- Masoud, W.G.T.; Ussher, J.R.; Wang, W.; Jaswal, J.S.; Wagg, C.S.; Dyck, J.R.; Lygate, C.A.; Neubauer, S.; Clanachan, A.S.; Lopaschuk, G.D. Failing mouse hearts utilize energy inefficiently and benefit from improved coupling of glycolysis and glucose oxidation. Cardiovasc. Res. 2014, 101, 30–38. [Google Scholar] [CrossRef] [Green Version]
- Jaswal, J.S.; Keung, W.; Wang, W.; Ussher, J.R.; Lopaschuk, G.D. Targeting fatty acid and carbohydrate oxidation--a novel therapeutic intervention in the ischemic and failing heart. Biochim. Biophys. Acta 2011, 1813, 1333–1350. [Google Scholar] [CrossRef] [Green Version]
- Umbarawan, Y.; Syamsunarno, M.R.A.A.; Koitabashi, N.; Yamaguchi, A.; Hanaoka, H.; Hishiki, T.; Nagahata-Naito, Y.; Obinata, H.; Sano, M.; Sunaga, H.; et al. Glucose is preferentially utilized for biomass synthesis in pressure-overloaded hearts: Evidence from fatty acid-binding protein-4 and-5 knockout mice. Cardiovasc. Res. 2018, 114. [Google Scholar] [CrossRef] [PubMed] [Green Version]
- Umbarawan, Y.; Syamsunarno, M.R.A.A.; Obinata, H.; Yamaguchi, A.; Sunaga, H.; Matsui, H.; Hishiki, T.; Matsuura, T.; Koitabashi, N.; Obokata, M.; et al. Robust suppression of cardiac energy catabolism with marked accumulation of energy substrates during lipopolysaccharide-induced cardiac dysfunction in mice. Metabolism 2017, 77, 47–57. [Google Scholar] [CrossRef] [PubMed] [Green Version]
- Lopaschuk, G.D.; Karwi, Q.G.; Ho, K.L.; Pherwani, S.; Ketema, E.B. Ketone metabolism in the failing heart. Biochim. Biophys. Acta Mol. Cell Biol. Lipids 2020, 1865, 158813. [Google Scholar] [CrossRef]
- Ho, K.L.; Zhang, L.; Wagg, C.; Al Batran, R.; Gopal, K.; Levasseur, J.; Leone, T.; Dyck, J.R.B.; Ussher, J.R.; Muoio, D.M.; et al. Increased ketone body oxidation provides additional energy for the failing heart without improving cardiac efficiency. Cardiovasc. Res. 2019, 115, 1606–1616. [Google Scholar] [CrossRef]
- Karwi, Q.G.; Biswas, D.; Pulinilkunnil, T.; Lopaschuk, G.D. Myocardial Ketones Metabolism in Heart Failure. J. Card. Fail. 2020, 26, 998–1005. [Google Scholar] [CrossRef]
- Uddin, G.M.; Zhang, L.; Shah, S.; Fukushima, A.; Wagg, C.S.; Gopal, K.; Al Batran, R.; Pherwani, S.; Ho, K.L.; Boisvenue, J.; et al. Impaired branched chain amino acid oxidation contributes to cardiac insulin resistance in heart failure. Cardiovasc. Diabetol. 2019, 18, 86. [Google Scholar] [CrossRef]
- Obokata, M.; Negishi, K.; Sunaga, H.; Ishida, H.; Ito, K.; Ogawa, T.; Iso, T.; Ando, Y.; Kurabayashi, M. Association between circulating ketone bodies and worse outcomes in hemodialysis patients. J. Am. Heart Assoc. 2017, 6, e006885. [Google Scholar] [CrossRef] [PubMed] [Green Version]
- Weiss, R.G.; Gloth, S.T.; Kalil-Filho, R.; Chacko, V.P.; Stern, M.D.; Gerstenblith, G. Indexing tricarboxylic acid cycle flux in intact hearts by carbon-13 nuclear magnetic resonance. Circ. Res. 1992, 70, 392–408. [Google Scholar] [CrossRef] [Green Version]
- Jeffrey, F.M.H.; Roach, J.S.; Storey, C.J.; Sherry, A.D.; Malloy, C.R. 13C isotopomer analysis of glutamate by tandem mass spectrometry. Anal. Biochem. 2002, 300, 192–205. [Google Scholar] [CrossRef]
- Berliner, L.J.; Robitaille, P.-M. In Vivo Carbon-13 NMR; Springer: Boston, MA, USA, 2002. [Google Scholar] [CrossRef]
- McNulty, P.H.; Cline, G.W.; Whiting, J.M.; Shulman, G.I. Regulation of myocardial [13C]glucose metabolism in conscious rats. Am. J. Physiol. Hear. Circ. Physiol. 2000, 279, H375–H381. [Google Scholar] [CrossRef] [PubMed]
- Malloy, C.R.; Sherry, A.D.; Jeffrey, F.M.H. Evaluation of carbon flux and substrate selection through alternate pathways involving the citric acid cycle of the heart by 13C NMR spectroscopy. J. Biol. Chem. 1988, 263, 6964–6971. [Google Scholar] [CrossRef]
- Weiss, R.G.; Chacko, V.P.; Gerstenblith, G. Fatty acid regulation of glucose metabolism in the intact beating rat heart assessed by carbon-13 NMR spectroscopy: The critical role of pyruvate dehydrogenase. J. Mol. Cell. Cardiol. 1989, 21, 469–478. [Google Scholar] [CrossRef]
- Suh, E.H.; Hackett, E.P.; Wynn, R.M.; Chuang, D.T.; Zhang, B.; Luo, W.; Sherry, A.D.; Park, J.M. In vivo assessment of increased oxidation of branched-chain amino acids in glioblastoma. Sci. Rep. 2019, 9, 340. [Google Scholar] [CrossRef] [PubMed] [Green Version]
- Tanaka, K.; Armitage, I.M.; Ramsdell, H.S. [13C]valine metabolism in methylmalonicacidemia using nuclear magnetic resonance: Propionate as an obligate intermediate. Proc. Natl. Acad. Sci. USA 1975, 72, 3692–3696. [Google Scholar] [CrossRef] [PubMed] [Green Version]
- Taegtmeyer, H.; Young, M.E.; Lopaschuk, G.D.; Abel, E.D.; Brunengraber, H.; Darley-Usmar, V.; Des Rosiers, C.; Gerszten, R.; Glatz, J.F.; Griffin, J.L.; et al. Assessing Cardiac Metabolism. Circ. Res. 2016, 118, 1659–1701. [Google Scholar] [CrossRef] [PubMed]
- Lindsay, R.T.; Demetriou, D.; Manetta-Jones, D.; West, J.A.; Murray, A.J.; Griffin, J.L. A model for determining cardiac mitochondrial substrate utilisation using stable 13C-labelled metabolites. Metabolomics 2019, 15, 1–10. [Google Scholar] [CrossRef] [Green Version]
- Umbarawan, Y.; Kawakami, R.; Syamsunarno, M.R.A.A.; Koitabashi, N.; Obinata, H.; Yamaguchi, A.; Hanaoka, H.; Hishiki, T.; Hayakawa, N.; Sunaga, H.; et al. Reduced fatty acid uptake aggravates cardiac contractile dysfunction in streptozotocin-induced diabetic cardiomyopathy. Sci. Rep. 2020, 10, 1–12. [Google Scholar] [CrossRef] [PubMed]
- Umbarawan, Y.; Syamsunarno, M.R.A.A.; Koitabashi, N.; Obinata, H.; Yamaguchi, A.; Hanaoka, H.; Hishiki, T.; Hayakawa, N.; Sano, M.; Sunaga, H.; et al. Myocardial fatty acid uptake through CD36 is indispensable for sufficient bioenergetic metabolism to prevent progression of pressure overload-induced heart failure. Sci. Rep. 2018, 8, 1–13. [Google Scholar] [CrossRef] [PubMed]
- Bowe, J.E.; Franklin, Z.J.; Hauge-Evans, A.C.; King, A.J.; Persaud, S.J.; Jones, P.M. METABOLIC PHENOTYPING GUIDELINES: Assessing glucose homeostasis in rodent models. J. Endocrinol. 2014, 222, G13–G25. [Google Scholar] [CrossRef] [PubMed]
- Schnelle, M.; Chong, M.; Zoccarato, A.; Elkenani, M.; Sawyer, G.J.; Hasenfuss, G.; Ludwig, C.; Shah, A.M. In Vivo [U-13C]glucose labeling to assess heart metabolism in murine models of pressure and volume overload. Am. J. Physiol. Hear. Circ. Physiol. 2020, 319, H422–H431. [Google Scholar] [CrossRef] [PubMed]
- Patterson, R.E.; Kalavalapalli, S.; Williams, C.M.; Nautiyal, M.; Mathew, J.T.; Martinez, J.; Reinhard, M.K.; McDougall, D.J.; Rocca, J.R.; Yost, R.A.; et al. Lipotoxicity in steatohepatitis occurs despite an increase in tricarboxylic acid cycle activity. Am. J. Physiol. Endocrinol. Metab. 2016, 310, E484–E494. [Google Scholar] [CrossRef] [Green Version]
- Wiechert, W. An introduction to 13C metabolic flux analysis. Genet. Eng. 2002, 24, 215–238. [Google Scholar]
- Wiechert, W. 13C metabolic flux analysis. Metab. Eng. 2001, 3, 195–206. [Google Scholar] [CrossRef]
- Antoniewicz, M.R. 13C metabolic flux analysis: Optimal design of isotopic labeling experiments. Curr. Opin. Biotechnol. 2013, 24, 1116–1121. [Google Scholar] [CrossRef]
- Kantor, P.F.; Lucien, A.; Kozak, R.; Lopaschuk, G.D. The antianginal drug trimetazidine shifts cardiac energy metabolism from fatty acid oxidation to glucose oxidation by inhibiting mitochondrial long-chain 3-ketoacyl coenzyme A thiolase. Circ. Res. 2000, 86, 580–588. [Google Scholar] [CrossRef] [Green Version]
- Fragasso, G.; Perseghin, G.; De Cobelli, F.; Esposito, A.; Palloshi, A.; Lattuada, G.; Scifo, P.; Calori, G.; Del Maschio, A.; Margonato, A. Effects of metabolic modulation by trimetazidine on left ventricular function and phosphocreatine/adenosine triphosphate ratio in patients with heart failure. Eur. Heart J. 2006, 27, 942–948. [Google Scholar] [CrossRef] [PubMed]
- Antzelevitch, C.; Belardinelli, L.; Zygmunt, A.C.; Burashnikov, A.; Di Diego, J.M.; Fish, J.M.; Cordeiro, J.M.; Thomas, G. Electrophysiological effects of ranolazine, a novel antianginal agent with antiarrhythmic properties. Circulation 2004, 110, 904–910. [Google Scholar] [CrossRef]
- McCormack, J.G.; Barr, R.L.; Wolff, A.A.; Lopaschuk, G.D. Ranolazine stimulates glucose oxidation in normoxic, ischemic, and reperfused ischemic rat hearts. Circulation 1996, 93, 135–142. [Google Scholar] [CrossRef] [PubMed]
- Cheng, A.Y.Y.; Patel, D.K.; Reid, T.S.; Wyne, K. Differentiating Basal Insulin Preparations: Understanding How They Work Explains Why They Are Different. Adv. Ther. 2019, 36, 1018–1030. [Google Scholar] [CrossRef] [Green Version]
- Juhaeri, J.; Gao, S.; Dai, W.S. Incidence rates of heart failure, stroke, and acute myocardial infarction among Type 2 diabetic patients using insulin glargine and other insulin. Pharmacoepidemiol. Drug Saf. 2009, 18, 497–503. [Google Scholar] [CrossRef]
- Tso, S.C.; Gui, W.J.; Wu, C.Y.; Chuang, J.L.; Qi, X.; Skvorak, K.J.; Dorko, K.; Wallace, A.L.; Morlock, L.K.; Lee, B.H.; et al. Benzothiophene carboxylate derivatives as novel allosteric inhibitors of branched-chain α-ketoacid dehydrogenase kinase. J. Biol. Chem. 2014, 289, 20583–20593. [Google Scholar] [CrossRef] [Green Version]
- Soppa, G.K.R.; Smolenski, R.T.; Latif, N.; Yuen, A.H.Y.; Malik, A.; Karbowska, J.; Kochan, Z.; Terracciano, C.M.N.; Yacoub, M.H. Effects of chronic administration of clenbuterol on function and metabolism of adult rat cardiac muscle. Am. J. Physiol. Hear. Circ. Physiol. 2005, 288, H1468–H1476. [Google Scholar] [CrossRef] [PubMed] [Green Version]
- Zukowska, P.; Kutryb-Zajac, B.; Toczek, M.; Smolenski, R.T.; Slominska, E.M. The role of ecto-5′-nucleotidase in endothelial dysfunction and vascular pathologies. Pharmacol. Rep. 2015, 67, 675–681. [Google Scholar] [CrossRef]
- Koszalka, P.; Ozuyaman, B.; Huo, Y.; Zernecke, A.; Flogel, U.; Braun, N.; Buchheiser, A.; Decking, U.K.; Smith, M.L.; Sevigny, J.; et al. Targeted disruption of cd73/ecto-5′-nucleotidase alters thromboregulation and augments vascular inflammatory response. Circ. Res. 2004, 95, 814–821. [Google Scholar] [CrossRef] [Green Version]
- Xu, X.; Fassett, J.; Hu, X.; Zhu, G.; Lu, Z.; Li, Y.; Schnermann, J.; Bache, R.J.; Chen, Y. Ecto-5′-nucleotidase deficiency exacerbates pressure-overload-induced left ventricular hypertrophy and dysfunction. Hypertension 2008, 51, 1557–1564. [Google Scholar] [CrossRef] [PubMed] [Green Version]
- Zukowska, P.; Kutryb-Zajac, B.; Jasztal, A.; Toczek, M.; Zabielska, M.; Borkowski, T.; Khalpey, Z.; Smolenski, R.T.; Slominska, E.M. Deletion of CD73 in mice leads to aortic valve dysfunction. Biochim. Biophys. Acta Mol. Basis Dis. 2017, 1863, 1464–1472. [Google Scholar] [CrossRef] [PubMed]
- Mierzejewska, P.; Zabielska, M.A.; Kutryb-Zajac, B.; Tomczyk, M.; Koszalka, P.; Smolenski, R.T.; Slominska, E.M. Impaired l-arginine metabolism marks endothelial dysfunction in CD73-deficient mice. Mol. Cell. Biochem. 2019, 458, 133–142. [Google Scholar] [CrossRef] [PubMed] [Green Version]
- Olkowicz, M.; Tomczyk, M.; Debski, J.; Tyrankiewicz, U.; Przyborowski, K.; Borkowski, T.; Zabielska-Kaczorowska, M.; Szupryczynska, N.; Kochan, Z.; Smeda, M.; et al. Enhanced cardiac hypoxic injury in atherogenic dyslipidaemia results from alterations in the energy metabolism pattern. Metabolism 2021, 114, 154400. [Google Scholar] [CrossRef] [PubMed]
- Czarnowska, E.; Bierła, J.B.; Toczek, M.; Tyrankiewicz, U.; Pajak, B.; Domal-Kwiatkowska, D.; Ratajska, A.; Smolenski, R.T.; Mende, U.; Chlopicki, S. Narrow time window of metabolic changes associated with transition to overt heart failure in Tgaq*44 mice. Pharmacol. Rep. 2016, 68, 707–714. [Google Scholar] [CrossRef] [PubMed]
- Mielcarek, M.; Toczek, M.; Smeets, C.J.; Franklin, S.A.; Bondulich, M.K.; Jolinon, N.; Muller, T.; Ahmed, M.; Dick, J.R.; Piotrowska, I.; et al. HDAC4-Myogenin Axis As an Important Marker of HD-Related Skeletal Muscle Atrophy. PLoS Genet. 2015, 11, e1005021. [Google Scholar] [CrossRef]
- Toczek, M.; Zielonka, D.; Zukowska, P.; Marcinkowski, J.T.; Slominska, E.; Isalan, M.; Smolenski, R.T.; Mielcarek, M. An impaired metabolism of nucleotides underpins a novel mechanism of cardiac remodeling leading to Huntington’s disease related cardiomyopathy. Biochim. Biophys. Acta Mol. Basis Dis. 2016, 1862, 2147–2157. [Google Scholar] [CrossRef]
- Murashige, D.; Jang, C.; Neinast, M.; Edwards, J.J.; Cowan, A.; Hyman, M.C.; Rabinowitz, J.D.; Frankel, D.S.; Arany, Z. Comprehensive quantification of fuel use by the failing and nonfailing human heart. Science 2020, 370, 364–368. [Google Scholar] [CrossRef]


Publisher’s Note: MDPI stays neutral with regard to jurisdictional claims in published maps and institutional affiliations. |
© 2021 by the authors. Licensee MDPI, Basel, Switzerland. This article is an open access article distributed under the terms and conditions of the Creative Commons Attribution (CC BY) license (https://creativecommons.org/licenses/by/4.0/).
Share and Cite
Tomczyk, M.; Olkowicz, M.; Slominska, E.M.; Smolenski, R.T. High Throughput Procedure for Comparative Analysis of In Vivo Cardiac Glucose or Amino Acids Use in Cardiovascular Pathologies and Pharmacological Treatments. Metabolites 2021, 11, 497. https://0-doi-org.brum.beds.ac.uk/10.3390/metabo11080497
Tomczyk M, Olkowicz M, Slominska EM, Smolenski RT. High Throughput Procedure for Comparative Analysis of In Vivo Cardiac Glucose or Amino Acids Use in Cardiovascular Pathologies and Pharmacological Treatments. Metabolites. 2021; 11(8):497. https://0-doi-org.brum.beds.ac.uk/10.3390/metabo11080497
Chicago/Turabian StyleTomczyk, Marta, Mariola Olkowicz, Ewa M. Slominska, and Ryszard T. Smolenski. 2021. "High Throughput Procedure for Comparative Analysis of In Vivo Cardiac Glucose or Amino Acids Use in Cardiovascular Pathologies and Pharmacological Treatments" Metabolites 11, no. 8: 497. https://0-doi-org.brum.beds.ac.uk/10.3390/metabo11080497