Article

The Impact of Photorespiratory Glycolate Oxidase Activity on Arabidopsis thaliana Leaf Soluble Amino Acid Pool Sizes during Acclimation to Low Atmospheric CO2 Concentrations

1
Institute for Genetics, Environment and Plant Protection (IGEPP), National Institute for Research for Agriculture, Food and Environment (INRAE), Institut Agro, Univ Rennes, 35653 Le Rheu, France
2
Institute of Plant Sciences Paris-Saclay (IPS2), Université Paris-Saclay, National Committee of Scientific Research (CNRS), National Institute for Research for Agriculture, Food and Environment (INRAE), Université d’Evry, Université de Paris, 91190 Gif-sur-Yvette, France
*
Authors to whom correspondence should be addressed.
Submission received: 2 July 2021 / Revised: 22 July 2021 / Accepted: 26 July 2021 / Published: 30 July 2021
(This article belongs to the Special Issue Photorespiration on Plant Metabolism)

Abstract

:
Photorespiration is a metabolic process that removes toxic 2-phosphoglycolate produced by the oxygenase activity of ribulose-1,5-bisphosphate carboxylase/oxygenase. It is essential for plant growth under ambient air, and it can play an important role under stress conditions that reduce CO2 entry into the leaf thus enhancing photorespiration. The aim of the study was to determine the impact of photorespiration on Arabidopsis thaliana leaf amino acid metabolism under low atmospheric CO2 concentrations. To achieve this, wild-type plants and photorespiratory glycolate oxidase (gox) mutants were given either short-term (4 h) or long-term (1 to 8 d) low atmospheric CO2 concentration treatments and leaf amino acid levels were measured and analyzed. Low CO2 treatments rapidly decreased net CO2 assimilation rate and triggered a broad reconfiguration of soluble amino acids. The most significant changes involved photorespiratory Gly and Ser, aromatic and branched-chain amino acids as well as Ala, Asp, Asn, Arg, GABA and homoSer. While the Gly/Ser ratio increased in all Arabidopsis lines between air and low CO2 conditions, low CO2 conditions led to a higher increase in both Gly and Ser contents in gox1 and gox2.2 mutants when compared to wild-type and gox2.1 plants. Results are discussed with respect to potential limiting enzymatic steps with a special emphasis on photorespiratory aminotransferase activities and the complexity of photorespiration.

1. Introduction

In the light, plants carry out photosynthesis that leads to the fixation of atmospheric CO2 into organic matter via the carboxylase activity of ribulose-1,5-bisphosphate carboxylase/oxygenase (Rubisco) [1]. Despite a high affinity for CO2 and a low affinity for O2, Rubisco can fix atmospheric O2. Under the actual atmospheric concentrations of CO2 and O2 (0.041% CO2 versus 21% O2), the Rubisco of C3 plants can fix approximately one O2 for every three CO2 molecules assimilated [2]. In addition to 3-phosphoglycerate (3-PGA), this oxygenase activity also produces 2-phosphoglycolate (2-PG), a toxic metabolic intermediate that inhibits triose phosphate isomerase and sedoheptulose-1,7-bisphosphate phosphatase of the Calvin cycle [3,4]. To cope with this problem, plants metabolize 2-PGA to 3-PGA through photorespiration [5]. This pathway requires enzymes located in chloroplasts, peroxisomes, and mitochondria and ultimately leads to the production of one molecule of 3-PGA from two molecules of 2-PG per cycle. while also liberating a molecule each of CO2 and NH3, producing and consuming a molecule of NADH and consuming one ATP.
Photorespiration has been seen as a wasteful process since it leads to a potential loss of assimilated carbon and nitrogen and it has an energetic cost since released CO2 can diffuse to the chloroplast to be re-assimilated [6] and photorespiratory NH3 can be re-assimilated by the glutamine synthase/glutamine:2-oxoglutarate aminotransferase (GS/GOGAT) cycle [7]. However, photorespiration is crucial for plant growth in air as seen from studies of photorespiratory mutants that exhibit various deleterious symptoms including dwarfism, chlorosis, and plant death [8]. However, most photorespiratory mutants can be recovered by increasing atmospheric CO2 levels, thus reducing the Rubisco oxygenase activity and 2-PG production [9,10,11,12]. The severity of the photorespiratory phenotypes depends on gene redundancy (multiple genes for one enzymatic step) but also on the metabolic step targeted by the mutation, thereby highlighting the multiple interactions between photorespiration and leaf primary metabolism [8,9]. Photorespiration interacts with photosynthesis, nitrogen assimilation, amino acid metabolism, the tricarboxylic acid cycle and C1 metabolism [13]. Photorespiration is a major pathway for the production of Gly and Ser in photosynthetic tissues [14] and it is an important part of plant stress responses [15]. Many environmental stresses lead to stomatal closure that lowers CO2 levels within leaf mesophyll cells and thus favors photorespiration. In this context, an increased photorespiratory flux can have a beneficial effect by modulating photoinhibition, as seen in Arabidopsis photorespiratory mutants [16]. However, low leaf internal CO2 levels may have important consequences for leaf primary metabolism, and specifically amino acid metabolism, since photorespiration is linked to N-metabolism. A recent study in Arabidopsis showed that a short-term low CO2 treatment (4–28 h at 100 ppm) promoted the accumulation of urea cycle intermediates (including arginine and ornithine) and a differential regulation of this pathway at the transcriptional level [17]. Other studies showed that a short-term low CO2 treatment (2 h at 140 ppm) induced a broad re-orchestration of carbon allocation to major metabolites (including glucose, organic acids and phenylalanine) in sunflowers [18,19].
Photorespiratory enzyme mutants have highlighted the importance of photorespiration in plant amino acid metabolism as seen from metabolite analyses of plants transferred from a low photorespiratory situation (high CO2 concentration in air) to normal photorespiration in air. This transfer led to an increase in Gly and Ser levels in wild-type Arabidopsis rosettes [9] but also in the photorespiratory mutants hpr1, pglp1, and an artificial microRNAi amirgox1/2 line [4,9,11,12]. After a 5 h transfer from high CO2 to air, increased levels of all amino acid levels except for Glu, Asp and Pro were found in the leaves of pglp1 plants [4]. Changes in Gln, Glu, Asn, Asp and Arg levels were altered after a one-day transfer from high CO2 to air in wild-type, hpr1 and pglp1 rosettes [9] while after 5 days most amino acids increased in amirgox1/2 leaves [12]. In air grown Arabidopsis hpr1, hpr2, hpr3 and ggat1 plants, many amino acid levels were higher compared to wild-type plants [11,20,21] however ggat1 rosettes contained very low quantities of Ser when plants were grown either in high CO2 or in air [11]. On the other hand, air-grown single gox1 and gox2 rosettes retaining 30–45% of wild-type GOX activity showed no growth phenotype and exhibited wild-type amino acid levels and photosynthetic capacities [12] probably because the conversion of Gly to Ser by the glycine decarboxylase complex (GDC) has been reported to be the rate-limiting step of the photorespiratory cycle in ambient air [22]. Conversely, amirgox1/2 targeting both photorespiratory GOX genes [12,23,24,25] had only 5% of wild-type leaf GOX activity and exhibited a very strong dwarfism in air [12].
In this study, wild-type Arabidopsis and single gox1 and gox2 mutants were compared to determine the impact of photorespiration on amino acid metabolism under artificial low atmospheric CO2 concentrations. Although such conditions no longer exist on Earth since the last glacial period (18,000–20,000 years ago) when atmospheric CO2 levels dropped to 180–190 ppm [26], low internal leaf CO2 concentrations are found under certain environmental stress conditions like drought [27]. Short and long-term low CO2 treatments were both performed and net CO2 assimilation rates, leaf GOX activities and amino acid contents were measured. Statistical analyses revealed significant modifications of amino acid pools following low CO2 treatments. There was a specific over-accumulation of Gly and Ser in gox1 and gox2.2 mutants, although the Gly/Ser ratio remained similar to that of wild-type Arabidopsis. The metabolic origin of Gly and Ser in the single gox mutants under low CO2 conditions is discussed.

2. Results

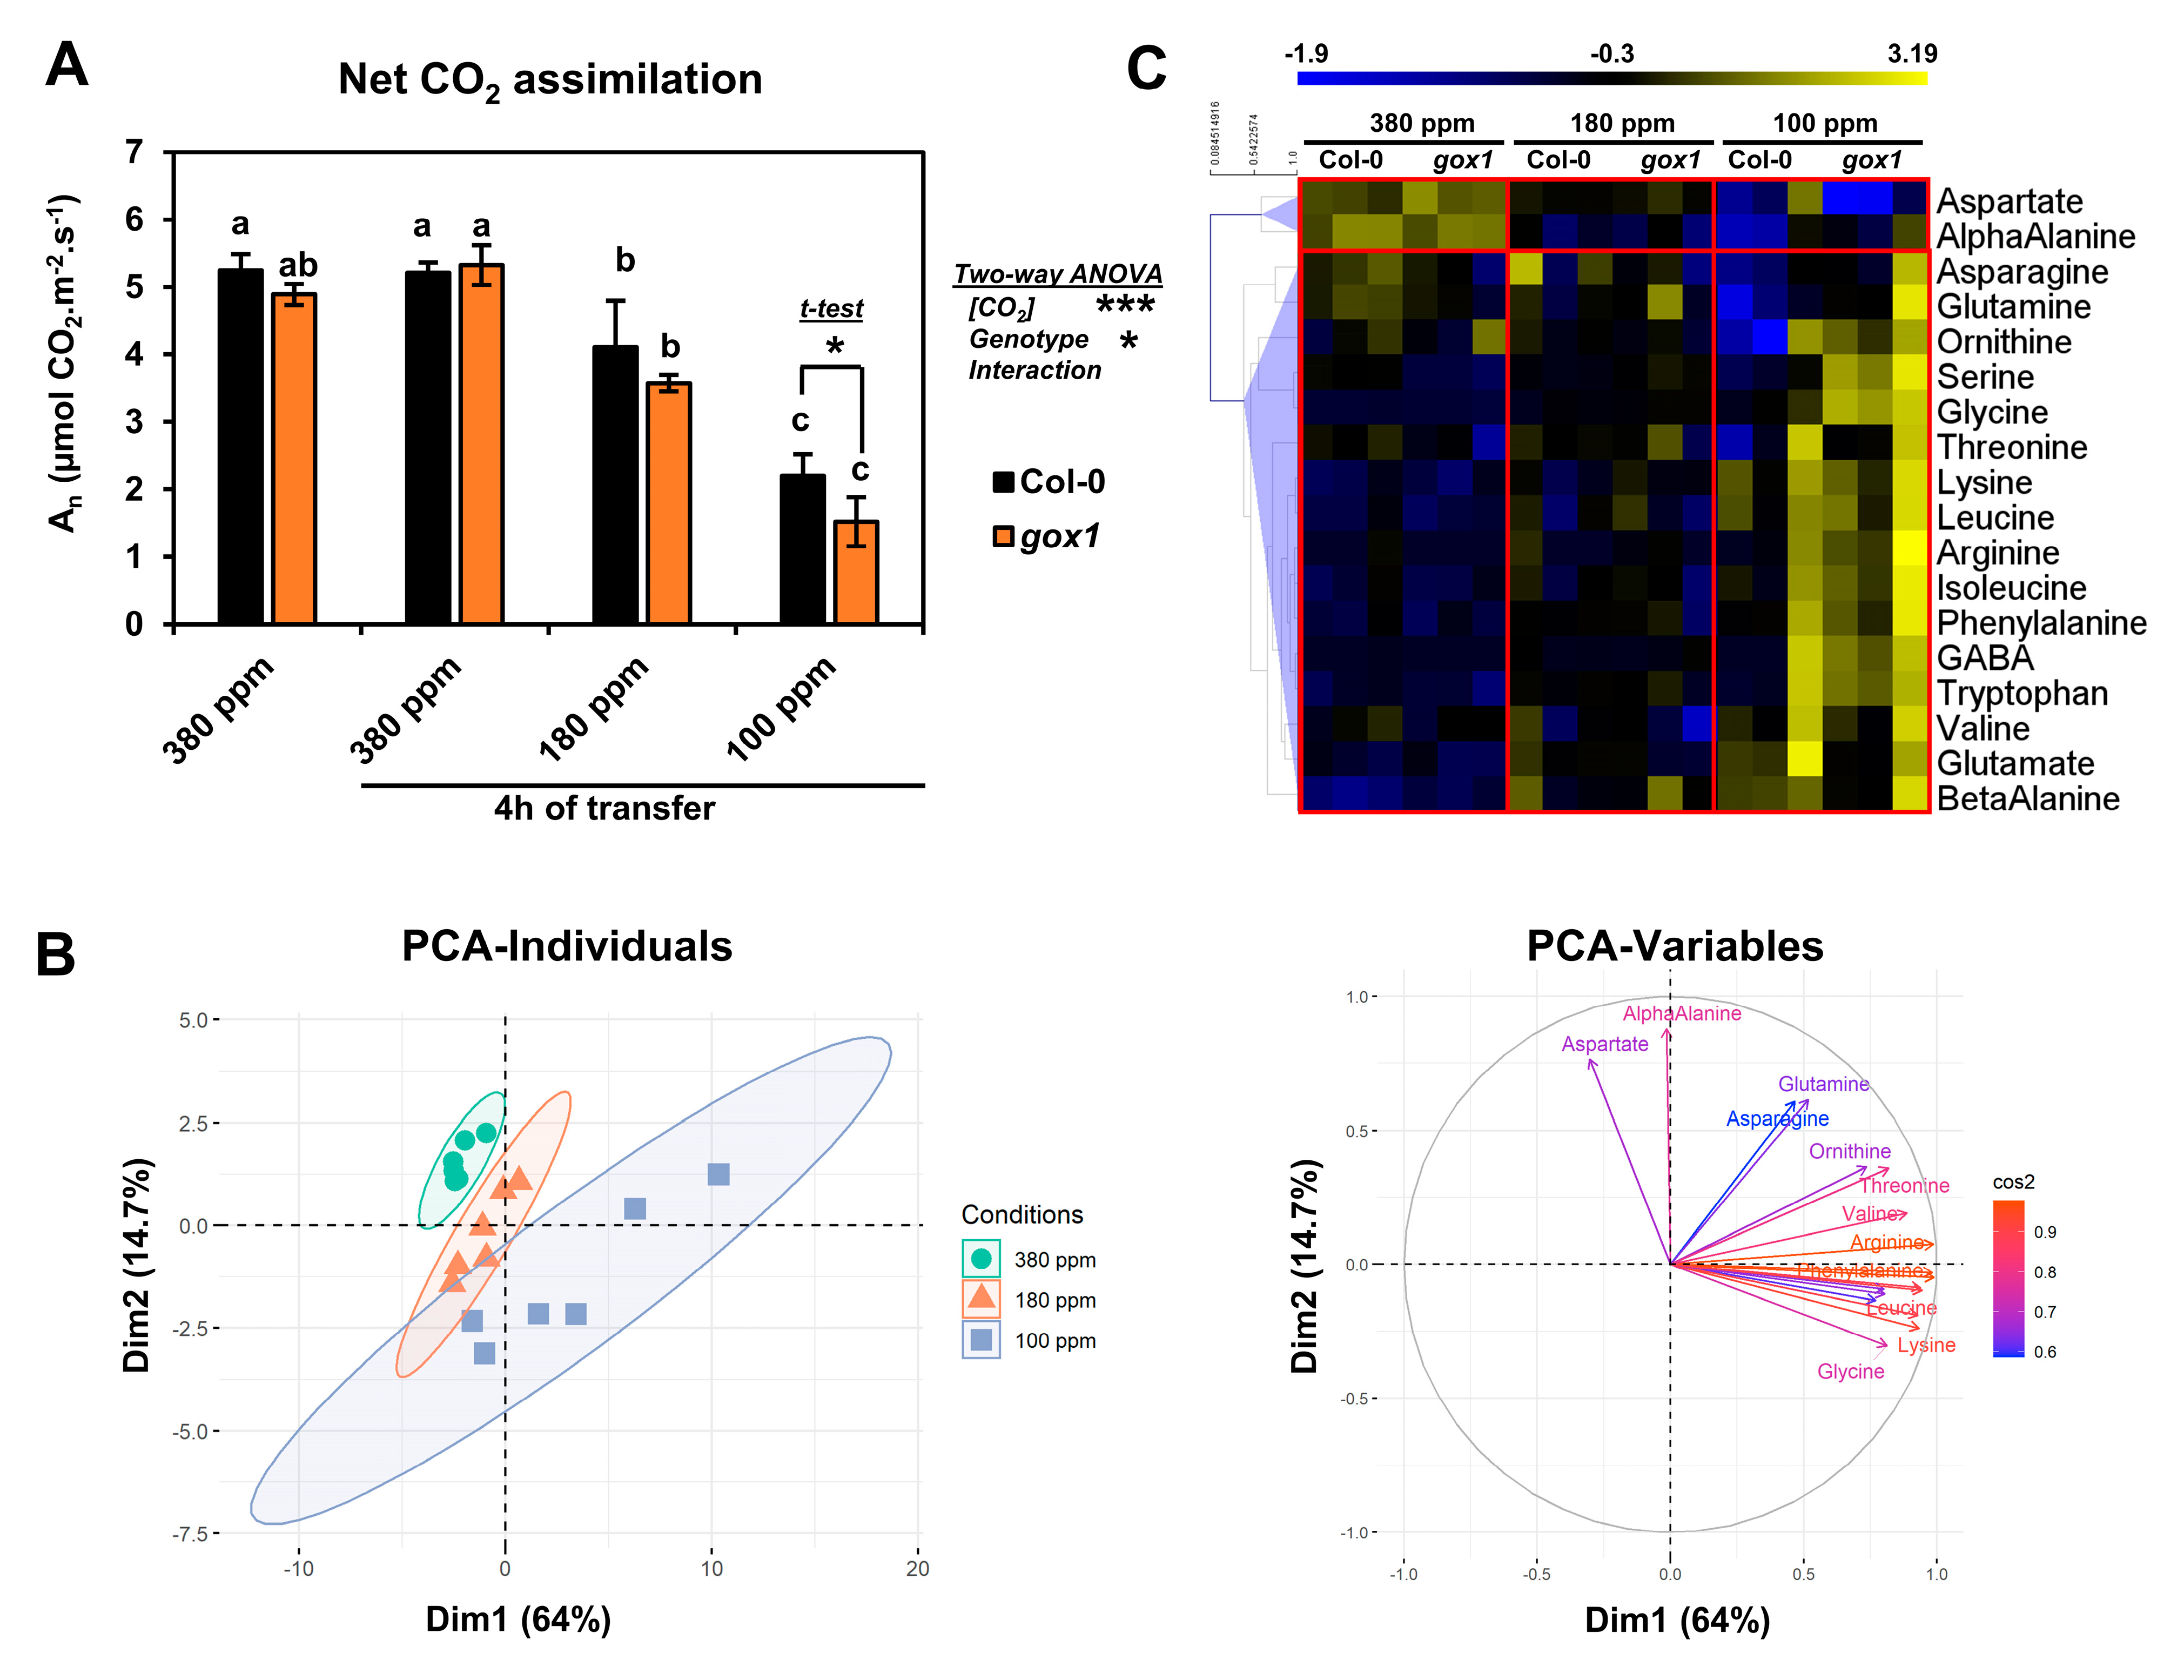
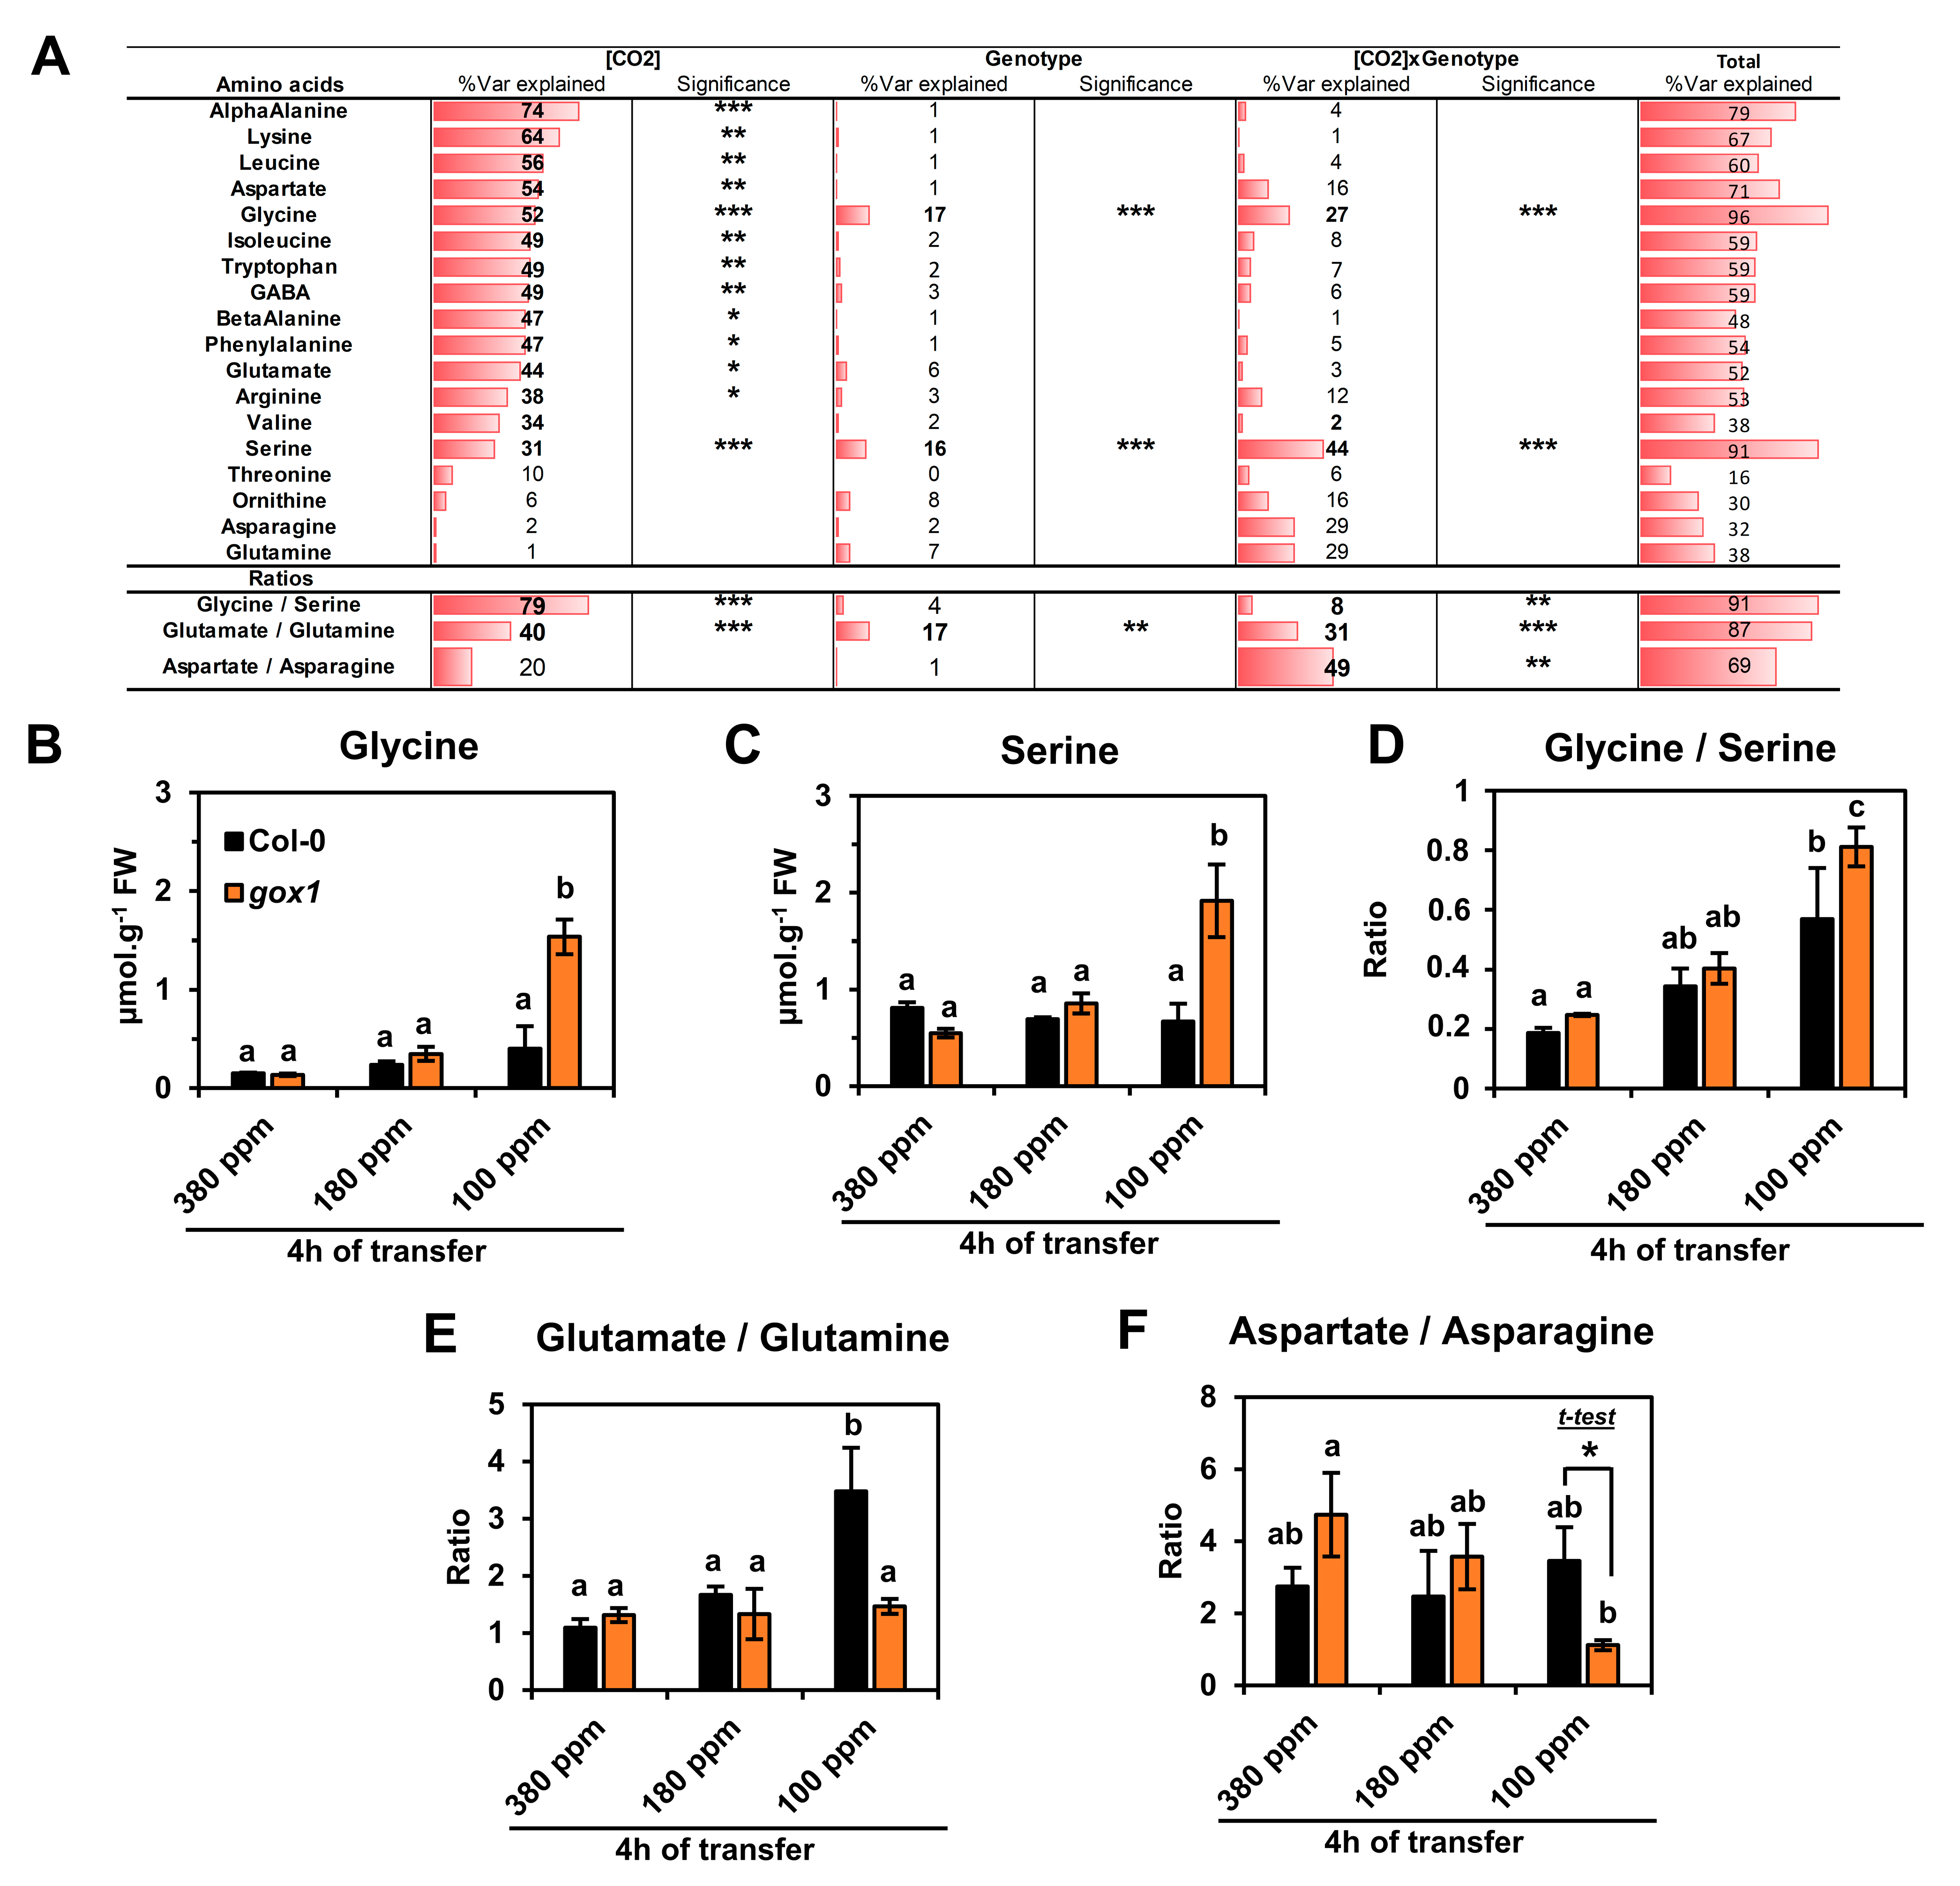
2.1. Impact of a Short-Term Low CO2 Treatment on Photosynthesis and Amino Acid Metabolism in the ARABIDOPSIS gox1 Mutant

In an initial short-term low CO2 treatment experiment, a small home-made gas exchange chamber was used to compare wild-type Col-0 and gox1 mutant Arabidopsis lines. The chamber allowed the simultaneous analysis of net CO2 assimilation rate of three 5-week-old Arabidopsis plants. After growth in ambient air (380 ppm CO2), plants were transferred for 4 h at either 380 ppm (control condition) or at two low CO2 concentrations (180 and 100 ppm). Net CO2 assimilation rate was not significantly different between wild-type Col-0 and gox1 either before the transfer of after a transfer to ambient CO2 (380 ppm) (Figure 1A). However, there was a gradual and significative decrease in net CO2 assimilation rate when low CO2 concentrations were applied. The comparison of wild-type Col-0 and gox1 after 4 h at 100 ppm CO2 revealed an additional 30% decrease in net CO2 assimilation rate in gox1 (Figure 1A). A rapid inhibition of photosynthesis in photorespiratory mutants is associated with a limitation of photorespiratory recycling [9,11,12]; therefore, this appeared to have occurred in gox1 during the 100 ppm CO2 treatment.
The same experimental set-up was used with wild-type Col-0 and gox1 to analyze the contribution of photorespiration to amino acid metabolism under low CO2 conditions by quantifying the amino acid content of their rosettes by HPLC (Table S1). From these data, a principal component analysis (PCA) succeeded to separate the three CO2 conditions with good confidence (see 95% ellipse confidence on the PCA-Individuals plot of Figure 1B), but not the Col-0 and gox1 groups. The two first components explained 78.7% of the variance between all samples: Dim1 with 64% and Dim2 with 14.7% (Figure 1B). The contribution of amino acid variations to Dim1 and Dim2 (with correlation circle, Figure 1B) showed that almost all amino acids were correlated with decreased CO2 concentration [CO2] (Dim1), while Asp and α-Ala were correlated with increased [CO2] (Dim2). Only Gln, Asn, Orn and Thr were essentially associated with the variability of biological replicates. A supervised partial least squares.
Discriminant analysis (PLS-DA) was also performed to identify amino acid variations maximizing the separation of Col-0 and gox1 groups (Figure S1). However, the results were relatively similar to those of the PCA analysis. Next, a hierarchical clustering analysis was carried out based on Pearson’s correlation coefficients with a heat map representation of normalized-mean center values (Figure 1C). This indicated that Asp and α-Ala contents were strongly decreased at low [CO2] (variations of up to 3–4 SD) while many amino acids had their levels increased with decreasing [CO2] (variations of up to 4–5 SD). The statistical significance of these results was then assessed using a two-way ANOVA test by considering two factors ([CO2] and genotype) and their interaction (Figure 2A). This showed that the variation of Thr, Orn, Asn, Gln and Val was not significantly explained by either [CO2] or genotype, thus statistically confirming the PCA analysis. Conversely, large proportions of the variance associated with the other amino
Acids detected were significantly explained by [CO2] (total explained Var (%) ranging from 31% to 74%). These observations included notably major plant amino acids (Glu, Asp), aromatic amino acids derived from the shikimate pathway (Phe, Trp), branched-chain amino acids (Leu, Ile), N-rich Arg associated with the urea cycle and photorespiratory amino acids (Gly, Ser). Interestingly, only the variation of Gly and Ser was significantly explained by the genotype (17% and 16% respectively) and the interaction [CO2]xGenotype (27% and 44% respectively), leading to the highest levels of total explained variances (96% and 91%, respectively). A detailed survey of Gly and Ser revealed an accumulation in the gox1 mutant at 100 ppm compared to the control Col-0 (Figure 2B,C; Table S1). Interestingly, the Gly/Ser ratio significantly increased with decreased [CO2] (Figure 2D; Table S1) and part of its variance was also explained by the interaction [CO2]xGenotype, given the differences observed for Col-0 and gox1 at 100 ppm (Figure 2A,D). The Asp/Asn and the Glu/Gln ratios were also calculated since they are good indicators of NH3 assimilation status by the GS/GOGAT cycle and asparagine synthetase [28,29]. Statistical analyses revealed that a large proportion of the Glu/Gln variability between samples was significantly explained by [CO2], the genotype and the interaction [CO2]xGenotype (Figure 2A). The Glu/Gln ratio increased with decreased [CO2] only in wild-type Col-0 rosettes due to a decrease in Glu (that was significantly different at 100 ppm CO2) and an increase in Gln (Figure 2E, Table S1). On the other hand, CO2 levels did not significantly affect Glu and Gln levels of gox1 rosettes (Figure 2E, Table S1). Conversely, the Asp/Asn ratio was significantly decreased in the gox1 mutant after 4 h at 100 ppm of CO2 (Figure 2A,F), and this was due to a reduction in Asp under low CO2 conditions compared to ambient air (Table S1).
Overall, a short-term low CO2 treatment decreased photosynthetic CO2 assimilation and triggered a broad reconfiguration of amino acid metabolism in both control and gox1 plants. This reconfiguration was more prominent at 100 ppm CO2. The remaining GOX activity in gox1 mutants became rate-limiting for photorespiration based on the increased inhibition of net CO2 assimilation rate (photosynthesis) in gox1 rosettes after 4 h at 100 ppm CO2 (Figure 1A). Interestingly, in these conditions, the limitation of GOX activity in gox1 resulted in an accumulation of Gly and Ser when compared to wild-type Col-0 and this was accompanied by a significant difference of the Gly/Ser ratio between the two lines at 100 ppm of CO2 (Figure 2B–D).

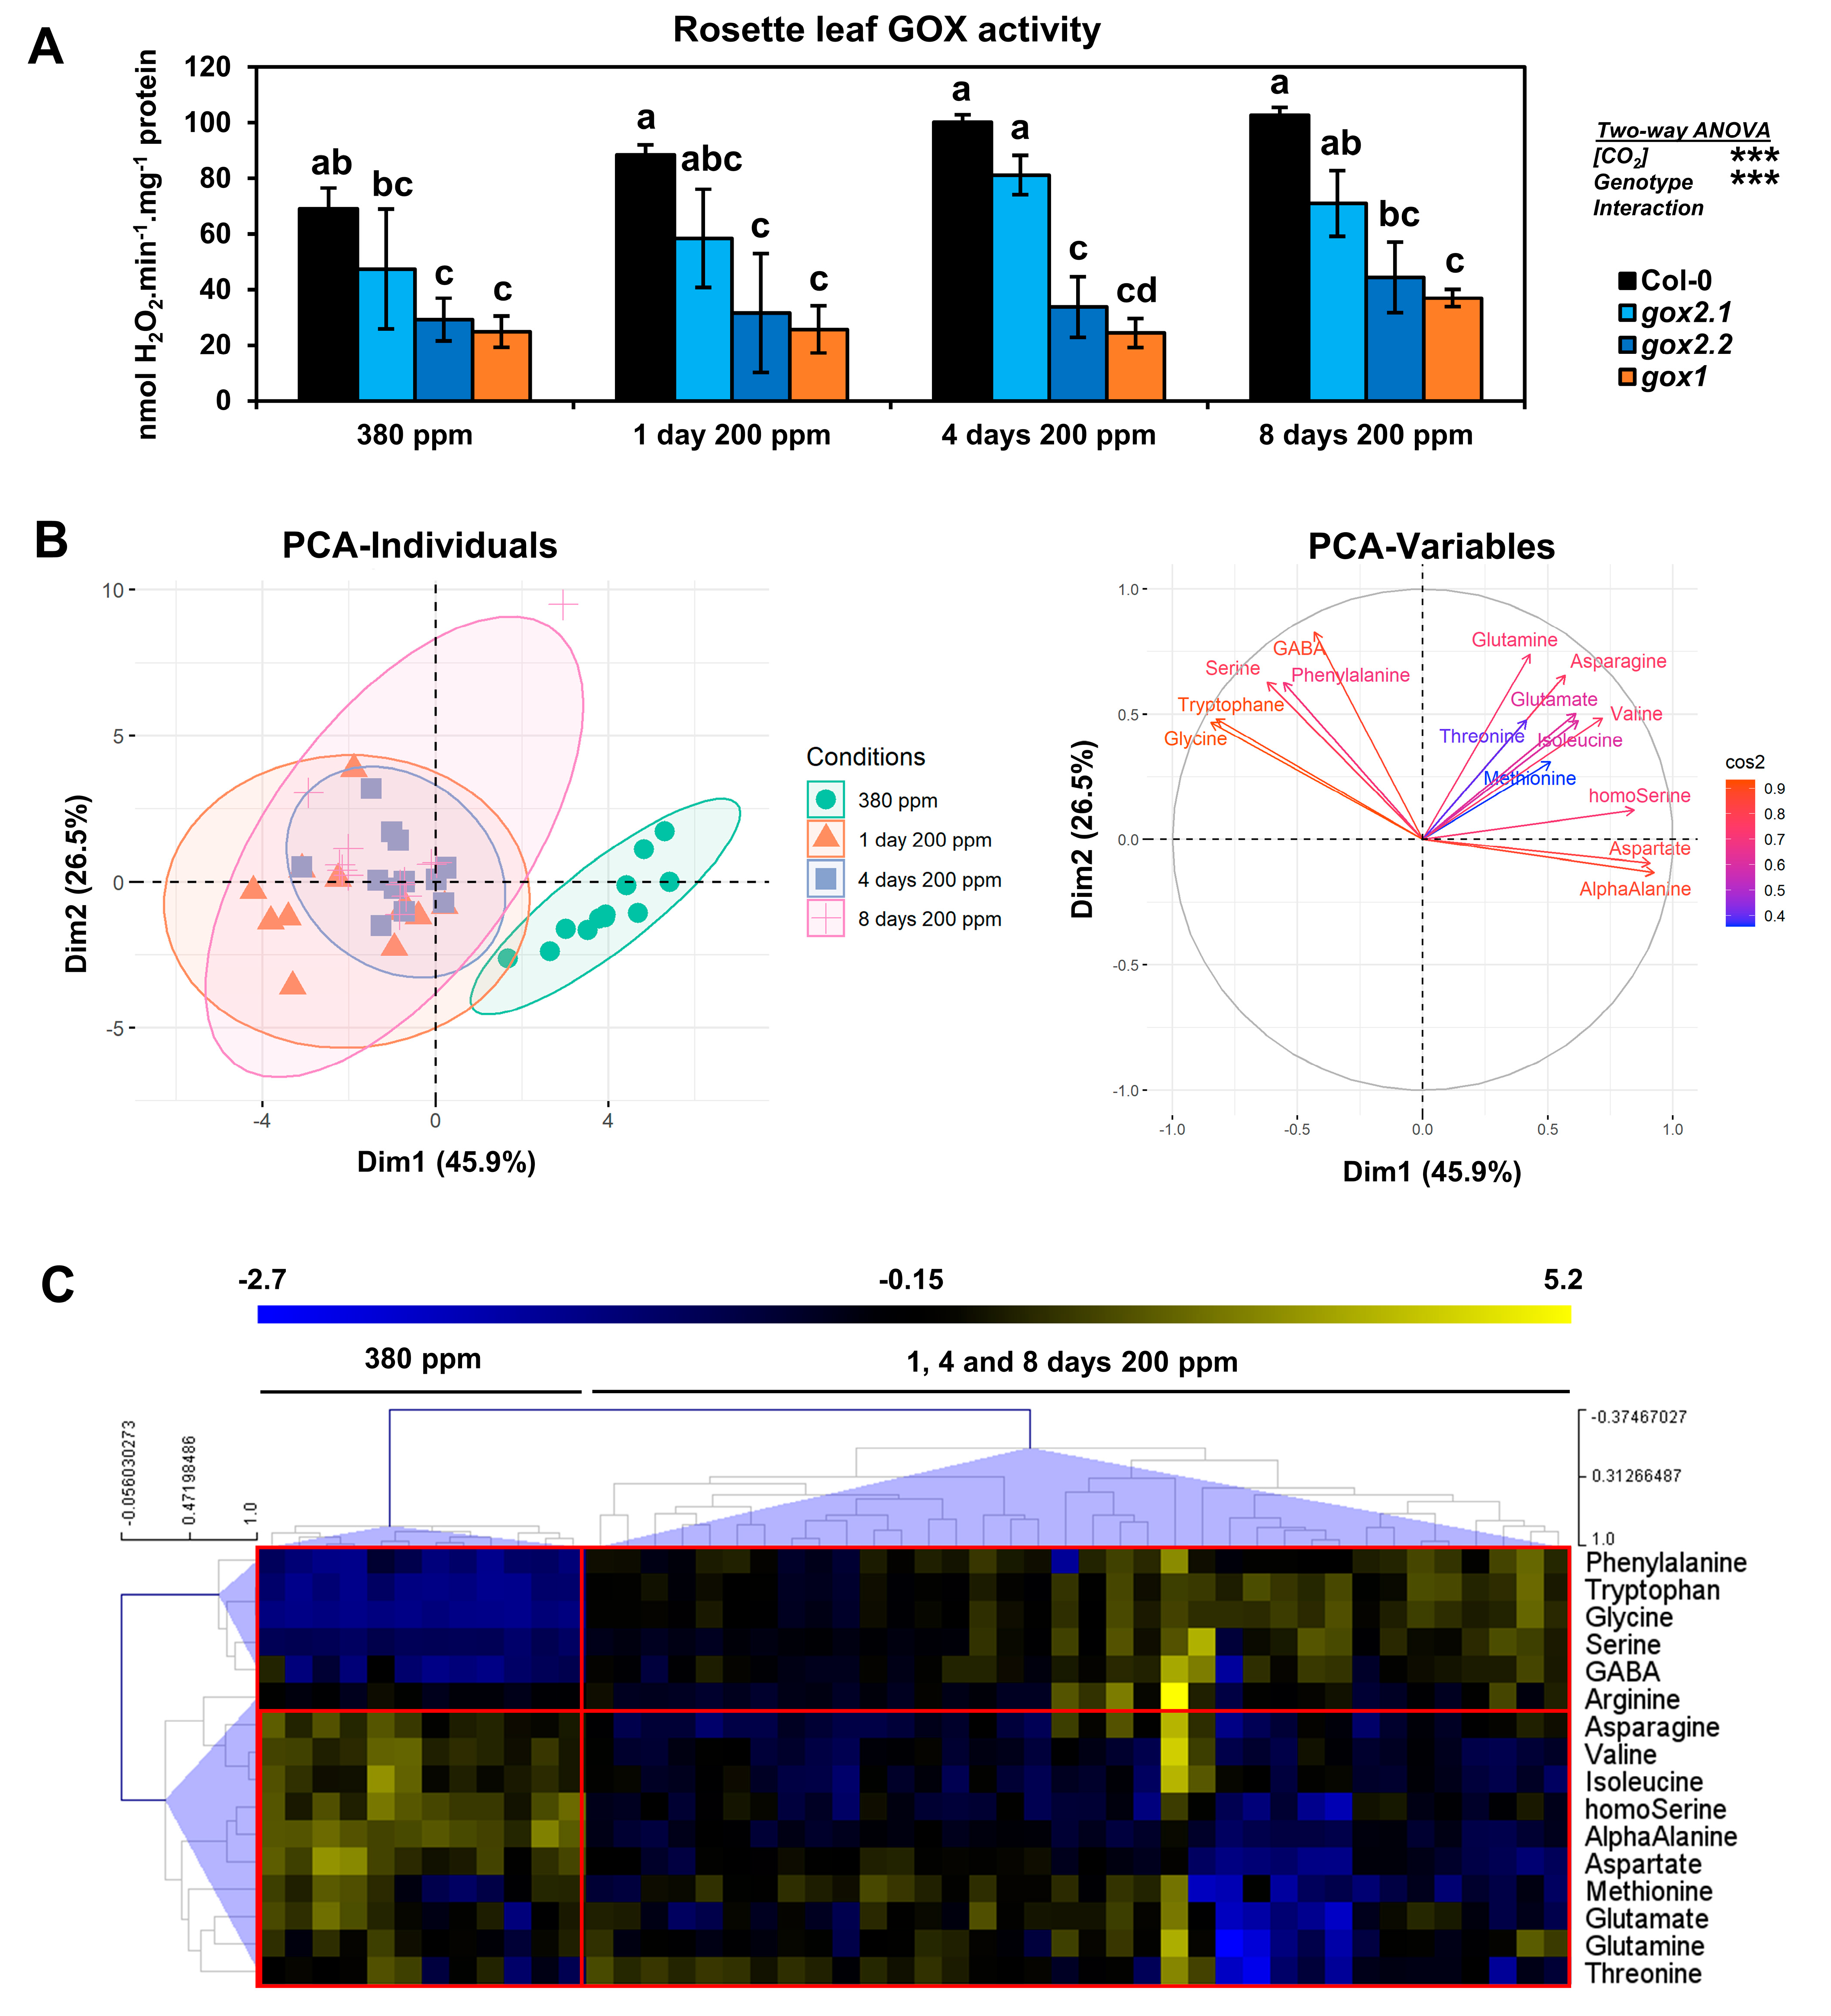
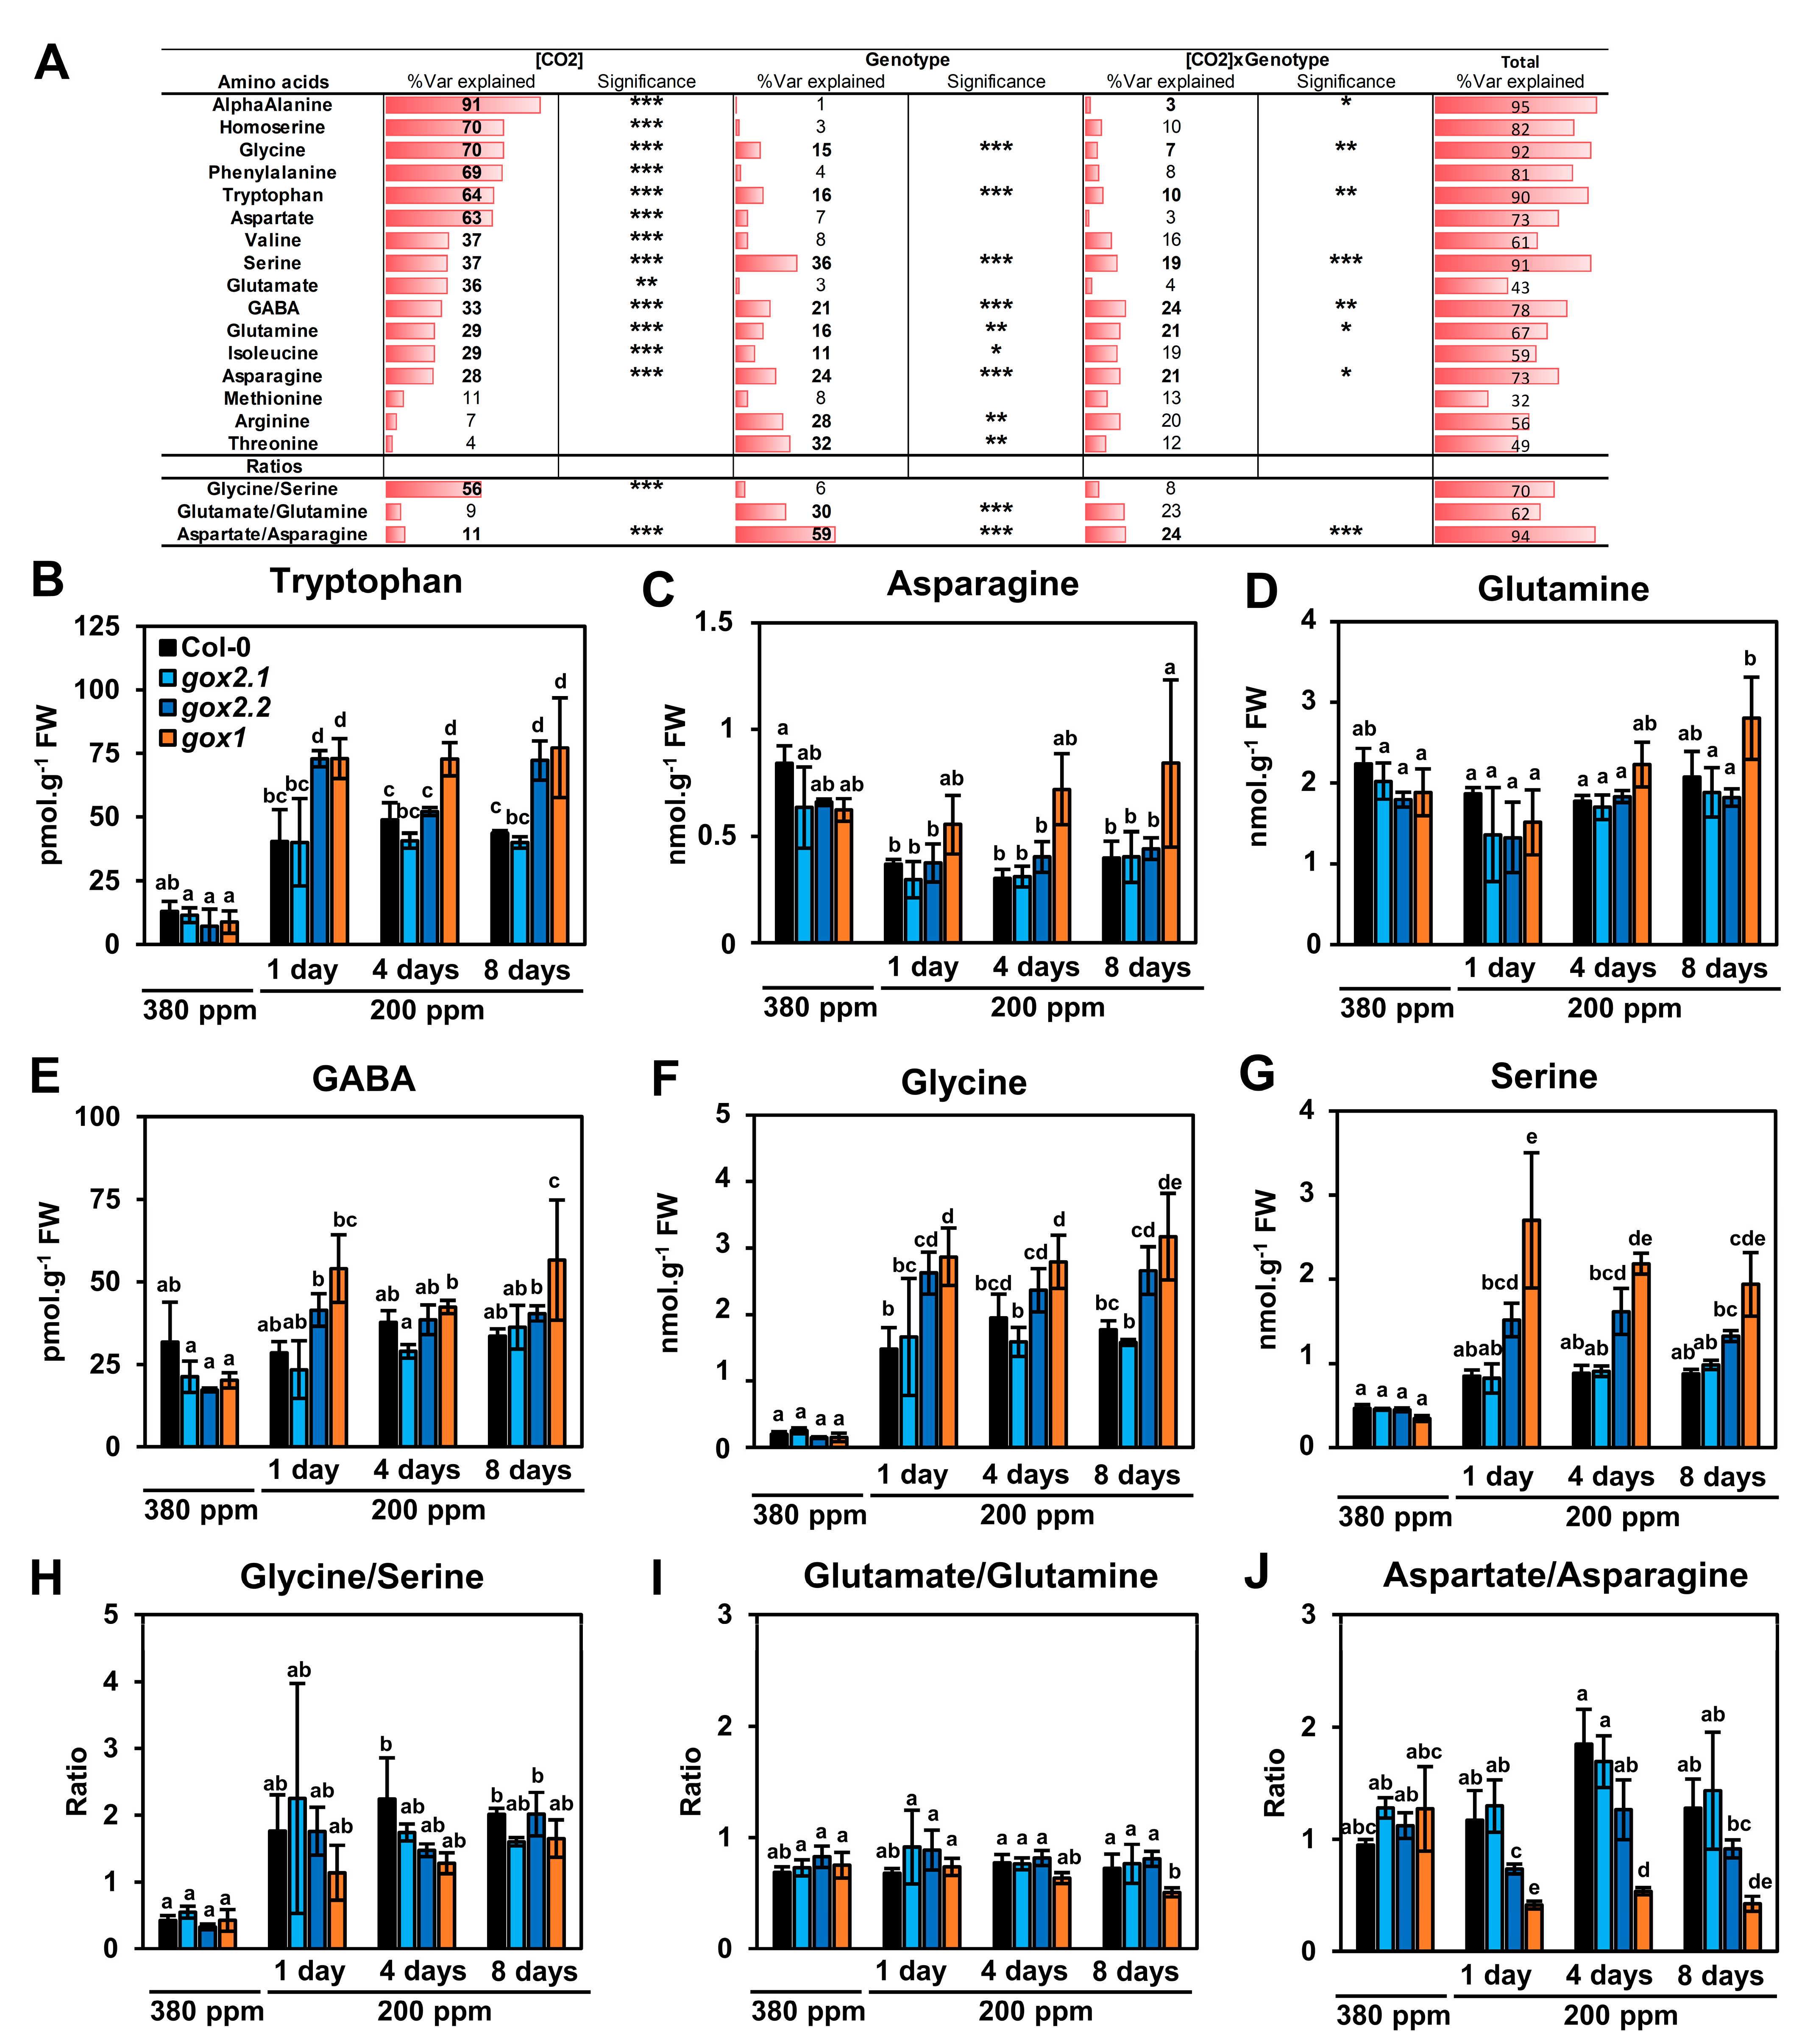
2.2. Impact of a Long-Term Low CO2 Treatment on Amino Acid Metabolism in gox1 and gox2 Mutants

Given the short-term low CO2 condition results, it was decided to analyze the consequences of long-term low CO2 conditions on leaf amino acid contents and the contribution of photorespiration to acclimation processes by comparing wild-type Col-0 and several gox mutants. Since it was not possible to use the home-made gas exchange system for long-term low CO2 treatments, experiments were carried out in a controlled growth cabinet where it was only possible to decrease [CO2] to 200 ppm. However, this allowed the testing of additional Arabidopsis gox mutant lines; two previously characterized Arabidopsis T-DNA insertion lines namely gox2.1, a knock-down line and gox2.2, a knock-out line [12]. The three gox lines were shown previously to have different levels of leaf GOX activity [12] and therefore a correlation between modifications of amino acid contents observed at low CO2 conditions and GOX activity, and subsequently the limitation of photorespiratory glyoxylate production, could be tested. The long-term low CO2 experiments were conducted for up to 8 days and rosette leaves were harvested either before (380 ppm) or after 1, 4 and 8 days of transfer to 200 ppm CO2. Prior to amino acid analyses, rosette leaf GOX activities were measured to confirm that the mutant lines exhibited different GOX activities during the time-course of the treatments. As expected, at 380 ppm of CO2, gox2.1 plants had around 69% of wild-type GOX activity while gox2.2 and gox1 had 42% and 36%, respectively (Figure 3A). GOX activity was significantly increased for all lines after the transfer to 200 ppm [CO2], but this had no significant impact on GOX activity differences between the genotypes (no significant interaction [CO2]xGenotype from the two-way ANOVA test).
Amino acid contents of wild-type Col-0 rosette leaves and of each gox mutant were quantified before (380 ppm) and after 1, 4 and 8 days of transfer to 200 ppm CO2 (Table S2). A PCA was carried out and the two first components explaining the maximum variance between all samples were selected: Dim1 with 45.9% and Dim 2 with 26.5% (Figure 3B). Again, this only separated the 380 ppm and 200 ppm CO2 conditions with a good confidence (see 95% ellipse confidence on the PCA–Individuals plot of Figure 3B). The contribution of amino acid variations to Dim1 and Dim2 (Figure 3B) showed that Gly, Ser, Trp, GABA and Phe were highly correlated with the separation of 380 and 200 ppm CO2 conditions (combination of both Dim1 and Dim2) while Asp, α-Ala and homoSer were negatively correlated with decreased [CO2] (mainly Dim1). A supervised PLS-DA was performed to improve the identification of amino acids whose variations maximized the separation of Col-0, gox2.1, gox2.2 and gox1 mutant groups. However, the results were relatively similar to those of the PCA analysis (Figure S2). A hierarchical clustering analysis based on Pearson’s correlation coefficients defined two groups of amino acids (Figure 3C). The first group comprised some amino acids also identified by the PCA analysis (notably Phe, Trp, Gly, Ser and GABA) where their contents were strongly increased after the transfer from 380 ppm to 200 ppm CO2 (variations from for to seven SDs). The second group comprised amino acids that exhibited decreased contents after transfer from 380 ppm to 200 ppm CO2 and included Asp, α-Ala and homoSer (variations from three to six SDs). The statistical significance of these results was assessed using a two-way ANOVA test by considering the two factors “[CO2]” and “genotype” and their interaction (Figure 4A). Similarly to the short-term transfer to low [CO2], the variation of many amino acids was significantly explained by [CO2], except for Met, Arg and Thr. However, a proportion of amino acid variability was also explained by the genotype and the [CO2]xGenotype interaction. This was most notable for Gly, Trp, Ser, GABA, Gln and Asn (Figure 4B–G). Globally, many of the differences observed between the mutant lines and the control after their transfer occurred from day 1 and remained relatively stable until day 8, as previously suggested by PCA and hierarchical clustering (Figure 3). Interestingly, Trp and GABA contents increased more in the two knock-out mutants gox1 and gox2.2 compared to wild-type Col-0 and the knock-down line gox2.1 after transfer to 200 ppm CO2 (Figure 4B,E). For Asn and Gln, an increase was essentially observed only in the gox1 mutant, and suggested that N assimilation was more affected by the transfer in this mutant compared to the other lines (Figure 4C,D). As observed with the short-term low CO2 treatment, Gly and Ser contents were significantly increased in the control line following transfer from 380 ppm to 200 ppm CO2 (Figure 4F,G). Although there was a higher accumulation of Gly and Ser in gox1 and gox2.2 compared to the control and gox2.1, a similar increase in the Gly/Ser ratio from 0.4 to around 2 was observed for all lines after transfer to low CO2 (Figure 4A,H). The short-term low CO2 treatment led to modifications of Asp, Asn, Gln and Glu amounts depending on the genotype (Figure 4C,D and Table S1) and this impacted both Asp/Asn and Glu/Gln ratios (Figure 4A,I,J). Statistical analyses revealed that 30% of the Glu/Gln variability was significantly explained by the genotype while 11%, 59% and 24% of the Asp/Asn variability was significantly explained by [CO2], genotype and the [CO2]xGenotype interaction, respectively. The Glu/Gln ratio significantly increased with respect to wild-type Col-0 only in the gox1 mutant after 8 days of transfer to 200 ppm CO2 while the Asp/Asn ratio was significantly increased in both gox1 and gox2.2 in low CO2.

3. Discussion

Photorespiration is an essential metabolic pathway in air-grown plants but it limits plant productivity [30]. It also plays a preponderant role in plant resistance to abiotic and biotic stresses [15,16,31,32,33]. Under such stress conditions, stomatal closure results in low CO2 concentrations at the vicinity of Rubisco thus reducing photosynthesis and promoting photorespiration and therefore impacting both carbon and nitrogen metabolisms. In such situations, higher photorespiration will impact both carbon and nitrogen metabolisms due to increased demands for the re-assimilation of photorespiratory-released NH3 and CO2. To investigate the impact of low CO2 concentrations and photorespiration on amino acid metabolism, Arabidopsis single gox mutants and short- and long-term transfers of plants from air to low CO2 conditions were used to modulate photosynthesis and photorespiration. To date, the impact of photorespiration on plant metabolism has often been studied using photorespiratory mutants and their transfer from high CO2 (for example 3000 ppm CO2, low photorespiration) to ambient air (400 ppm CO2, normal photorespiration) (for a review see [8]). The effects of low CO2 concentrations on plant metabolism have been less studied, perhaps due to practical reasons to maintain low CO2 air. Nevertheless, it has been reported that low CO2 induces the accumulation of urea cycle intermediates [17] and short-term low CO2 treatments were used to study Rubisco oxygenase activity (v0) and amino acid metabolism. The latter highlighted negative correlations between v0 and Ala and Asp while a positive correlation was reported between v0 and Gly and Ser [34]. Short-term low CO2 treatments coupled to 13C-labelling have been used to examine changes in photosynthesis and photorespiration on plant metabolism including recently the in vitro stoichiometry of photorespiratory metabolism [35], carbon allocation to major metabolites [18], the metabolic origin of carbon atoms in glutamate [36] and in vivo phosphoenolpyruvate carboxylase activity [37]. In this work, both short-term (4 h) and long-term (1 to 8 d) low CO2 treatments led to changes in amino acid pool sizes (see Tables S1 and S2). In general, maximal changes were attained after one day at low CO2 after which they remained stable. This shows that plant acclimation to low CO2 leads to a relatively rapid new metabolic homeostasis (Figure 3 and Figure 4; Table S2). This was associated with changes in photorespiratory enzyme capacity as seen from rosette GOX activities (Figure 3A). Overall, the long-term 200 ppm CO2 treatment triggered both depletions (Ala, Asn, Asp, homoSer, Ile and Val) and augmentations (Gly, Ser, Phe, Trp, Arg and GABA) in amino acid pool sizes (Figure 5, Table S2) while some changes were also photorespiratory-genotype dependent (Figure 4, Table S2). Interestingly, amino acid changes observed after short-term low CO2 treatments (Figure 2, Table S1) were more pronounced in the gox1 mutant and after transfer of wild-type Col-0 to 100 ppm CO2 (Table S1). A small number of differences in amino acid accumulations/depletions between the different CO2 conditions were observed, especially with respect to branched-chain amino acids (compare Tables S1 and S2). This could be due to specific responses depending either on the level of the low CO2 treatment and/or a temporal modulation of this response. Genotype differences (wild-type Col-0 v gox mutants) were associated with gox mutants having the lowest GOX activities (gox1 and gox2.1) (Figure 4, Table S2). This observation suggested an additional photorespiratory-dependent effect that could be due to limited glyoxylate production under higher photorespiration conditions.
Low CO2 acclimation did not appear to bring about changes associated with carbon starvation such as an increase in total amino acid pools due to protein degradation [12,38]. During both short- and long-term CO2 treatments, total soluble amino acid amounts remained relatively stable except in the gox1 and gox2.2 mutant lines due to a much higher accumulation of photorespiratory Gly and Ser compared to wild-type Col-0 and gox2.1 lines (Figure S3; Tables S3 and S4). This was also observed between gox1 and wild-type Col-0 after a short-term transfer to 100 ppm CO2. Therefore, the low CO2-induced over-accumulation of Gly and Ser in the gox mutants was related to
Their extractable leaf GOX activities and this will be discussed below (see Section 3.3). However, not only photorespiratory-associated amino acids were affected by a low CO2 atmosphere. Both low CO2 treatments resulted in the depletion of Ala and Asp in all lines thus identifying them along with Gly and Ser as important markers of low CO2/high photorespiration (Figure 1 and Figure 3; Tables S1 and S2). In addition to these major amino acids, some minor amino acid pools including Arg, branched-chain and aromatic amino acids were also modulated by low CO2 (Figure 1, Figure 3 and Figure 5; Tables S1 and S2). It might be expected that under low CO2 conditions, less carbon is available for N-assimilation and amino acid biosynthesis thereby decreasing amino acid pool sizes. This was clearly not the case since a number of amino acid pool sizes increased. This can happen because either they are being used less or being produced more. It should be noted that variations of amino acid pool sizes are clearly not always correlated with intuitive variations of their associated metabolic fluxes [39].

3.1. Minor Amino Acids: Arg, Aromatic and Branched-Chain Amino Acids under Low CO2 Conditions

Minor amino acid pools modulated by low CO2 conditions represented a very small percentage of the total soluble leaf amino acid pool (each < 2%) (Figure S3; Tables S3 and S4), thus representing very small carbon and nitrogen sinks. A previous study reported an accumulation of Arg and Orn in Arabidopsis after transfer from 400 ppm to 100 ppm CO2 [17] and this was explained by an excess of re-fixed photorespiratory N under high photorespiratory conditions being stored in N-rich amino acids due to carbon limitations [17]. In these experiments, net CO2 assimilation rates were similar to values obtained in the short-term experiments that led to an accumulation of Arg after 4 h at 100 ppm CO2 especially in gox1 rosettes and to a lesser extent in wild-type Col-0 (Figure 1A,C; Table S1). However, after transfer to 200 ppm CO2, Arg levels only significantly increased in gox1 rosettes while wild-type Col-0 and gox2.2 Arg levels appeared to decrease 1 and 4 days after transfer (Figure 3C; Table S2). Thus, the observed low CO2 Arg biosynthesis depended on both altered CO2 assimilation rates and photorespiratory capacities. This was accentuated when photorespiratory cycle functioning was altered in certain gox mutants leading to a further augmentation of carbon sequestration in photorespiratory Gly and Ser (Figure 4G) and/or an inhibition of Calvin cycle RuBP regeneration by the accumulation of 2-PG [4]. Such situations could have provoked a C-starvation syndrome as proposed in [17].
Low CO2 conditions also led to an accumulation of Phe and Trp (Figure 1C and Figure 3C; Tables S1 and S2), both aromatic amino acids produced via the shikimate pathway and requiring PEP and erythrose-4-phosphate as C-skeletons (Figure 5). A short-term CO2 effect was more significant at 100 ppm in the gox1 mutant line and only for Trp (Table S1) while the long-term, low CO2 treatment brought about significant increases of both Phe and Trp in all genotypes although the effect was greater in gox1 and gox2.2 plants (Figure 4B, Table S2). It is tempting to propose a stimulated shikimate pathway under low CO2 conditions, but this would be unexpected due to the reduced photosynthetic activity producing fewer C-skeletons. A recent study found that the incorporation of photosynthetically neo-assimilated carbon towards Phe biosynthesis was reduced by up to 35% following a transfer from 380 to 140 ppm CO2 using 13CO2 labeling [19]. This clearly shows a decrease in de novo biosynthesis of Phe under low CO2 conditions and therefore intuitionally the observed increase in Phe pool size probably reflected a reduced utilization.
Carbon-starvation in plants often occurs during stress conditions and induced protein degradation that generates an increase in branched-chain amino acids that are used for energy production via mitochondrial respiration [40,41,42]. Inhibition of photosynthesis in the photorespiratory mutant amiRgox1/2 triggered such symptoms after transfer from high CO2 (3000 ppm) to normal air [12]. It might be that the accumulation of Leu, Ile and Val at 100 ppm CO2 was brought about by a rapid C-starvation that either stimulated BCAA biosynthesis or reduced BCAA consumption. However, this was not the case during a long-term low CO2 treatment. In this situation, the observed reduction in BCAA levels could simply reflect lower photosynthetic carbon assimilation leading to a reduction in their biosynthesis. This agrees with the reduced incorporation of photosynthetically neo-assimilated carbon towards Val following a transfer from 380 to 140 ppm CO2 [19]. Nevertheless, the use of BCAAs as supplementary respiratory substrates cannot be excluded since glycolytic-derived substrates would be expected to be negatively impacted by less CO2 assimilation under low CO2 compared to 380 ppm CO2 air.

3.2. Major Amino Acids under Low CO2 Conditions

In 380 ppm CO2 air, major soluble amino acids included Gln, Glu, Asn, Asp and Ala (see Tables S3 and S4). The importance of Glu and Gln for N-assimilation via the GS/GOGAT cycle is highlighted by the observation that low CO2 acclimation did not significantly alter the Glu/Gln balance and their individual pool sizes (Figure 4I, Table S2). This observation agrees with an absence of a correlation between v0 with Glu and Gln levels and their stability in potato and wheat [34]. Since photorespiratory ammonium reassimilation and the GS/GOGAT cycle are linked by a cycling of Glu (Figure 5), this would require the maintenance of an adequate Glu supply especially under conditions where N is being sequestered in Gly and Ser (Figure 2 and Figure 3; Tables S3 and S4; see Section 3.3). This could be achieved by either increasing primary N-assimilation [43] and/or modulating the biosynthesis of other major amino acids derived from Glu. In agreement with this scenario, low CO2 acclimated plants contained lower levels of Ala, Asp and BCAAs when compared to plants grown in 380 ppm CO2 (Figure 1 and Figure 3; Tables S1 and S2). The biosynthesis of these amino acids involves Glu-dependent aminotransferase reactions (Figure 5). Due to lower CO2 assimilation rates at low CO2, the reduction of Ala and Asp could simply reflect reduced amounts of pyruvate and oxaloacetate required for transaminase activities. Furthermore, Asp could be consumed to maintain the malate/OAA balance allowing photorespiratory redox transfer from the mitochondria when photorespiration is high (see [32]). These scenarios would help reduce Glu consumption and help maintain Glu levels. The observed reduction in Asn levels (albeit not seen in the gox1 mutant for reasons that require further exploration) (Figure 4C) could be the consequence of low Asp levels while a lower asparagine synthetase activity would also help maintain Gln levels. Decreases in Ala and Asn could also be due to their increased use by photorespiratory SGAT [44]. GABA is also linked to Glu metabolism, and it increased under low CO2 but only in gox1 and gox2.2 mutants. GABA transferase converts GABA to succinic-semialdehyde and it uses either pyruvate or glyoxylate as amine acceptor to produce alanine and glycine, respectively [45]. Therefore, in these mutants at low CO2, GABA transferase activity could be reduced and thus lower GABA catabolism due to insufficient glyoxylate production.

3.3. Gly and Ser Become Major Amino Acids under Low CO2 Conditions and Accumulate More in Certain gox Mutants

Under normal air CO2 conditions, Gly and Ser were not major amino acids and together they represented only 8% of the total soluble amino acid pool (Figure S3). However, after a long-term low CO2 treatment they made up 27–61% of the total soluble amino acid pool (depending on genotype) and thus became an important N-sink (Tables S3 and S4). High photorespiration conditions also led to an increase in the Gly/Ser ratio (that has been correlated with v0, [34]) from 0.5 to around 2 in all genotypes when transferred to low 200 ppm CO2 (Figure 4H) due to larger increases in Gly compared to Ser (Figure 4F–G). The compartmentalization of photorespiration, its cyclic nature and its links with other metabolic pathways make it difficult to predict and to pinpoint the major processes that influence the differential change in Gly and Ser levels. A preferential increase in Gly could be the consequence of the GDC reaction becoming more limiting with respect to the SHMT1 reaction. It could also be influenced by the two aminotransferase reactions carried out by GGAT1 and SGAT1 that both produce Gly and require glyoxylate/Glu and glyoxylate/Ser, respectively. A limiting GDC reaction was suggested from changes in rosette Gly levels of Arabidopsis plants over-expressing either GDC-L [46] or GDC-H [47]. It has been shown also that THF availability for the GDC reaction is important to maintain Ser metabolism [48]. On the other hand, plants over-expressing SGAT1 exhibited very low Ser levels [49] and 14C-labelling of sgat1 mutants showed a much higher incorporation of 14C into Ser compared to Gly [10,50]. When a barley sgat mutant was transferred to air from high CO2 conditions, Ser levels were dramatically increased (40-fold) compared to Gly (only fourfold) [51]. Again, in a barley sgat knock-down line with 50% wild-type activity, Ser levels were increased more than Gly [52]. In tobacco, 14C-glycolate labeling of a sgat mutant led to a high incorporation of 14C into Ser whereas Gly was less labeled [50]. Thus, modified SGAT activity appears to modulate preferentially Ser levels compared to Gly. Arabidopsis ggat1 mutant rosettes containing only 10–20% of wild-type Ser levels, showed only a twofold increase in Gly when transferred from high CO2 to air while wild-type plants exhibited a sevenfold increase [11]. On the other hand, Arabidopsis plants over-expressing GGAT1 indicated a positive correlation between GGAT activity and Gly and Ser levels but Ser levels were increased more than Gly [53]. Such observations clearly indicate an important influence of GGAT1 and SGAT activities in determining photorespiratory Gly and Ser levels. They also show that there is often a differential modulation of Gly and Ser that leads to a higher accumulation of Ser. This might be expected when SGAT activity is reduced [51,52] but it is less intuitive when GGAT1 activity is increased [53]. In low CO2 conditions, Gly levels increased more than Ser levels (Figure 2 and Figure 4). This could reflect a GDC limitation due to inadequate THF levels and/or a retroinhibition by Ser on GDC activity [54]. This could be coupled to an altered equilibrium between the two aminotransferases due to their differential promiscuity with respect to alternative substrates and their kinetic properties. SGAT is associated with multiple activities while GGAT appears to undertake only two different transaminase reactions [44,55,56]. Although, Arabidopsis GGAT and SGAT have quite similar Km values for glyoxylate (0.21 mM and 0.11 mM) and for their respective amino acids (2 mM and 3 mM) [56,57], the kcat of GGAT was found to be sevenfold faster than that of SGAT (145 s−1 versus 20 s−1) in rice [58]. Such observations suggest that in planta, the production of Gly via GGAT1 would be more important than the removal of Ser by SGAT and thus lead to a low Gly/Ser ratio when GDC activity is not limiting.
The increase in Gly and Ser was much higher in the gox1 and gox2.2 mutants compared to gox2.2 and wild-type plants when transferred to 200 ppm CO2 (Figure 4F–G) and this appeared to be correlated with extractable rosette GOX activities (Figure 3A). As mentioned above, Gly and Ser accumulation is common to many Arabidopsis photorespiratory mutants after their transfer from high CO2 (low photorespiration) to ambient air (normal photorespiration). But a higher accumulation is observed in mutants lacking enzymes downstream from the GDC/SHMT step. Arabidopsis hpr1-1 plants transferred from high CO2 to air accumulated 80-fold more Gly and ninefold more Ser after one day while wild-type plants showed 2.5-fold changes in both amino acids [9]. The complexity of the photorespiratory cycle makes it difficult to predict the consequences of a specific mutation on Gly and Ser contents. Arabidopsis pglp1 mutants accumulated similar amounts of Gly and Ser as wild-type plants after their transfer from high CO2 to ambient air, although they already contained 18-fold more than wild-type plants under high CO2 [9]. The transfer from high CO2 to air of amiRgox plants with only 5% wild-type GOX activity brought about a 2.5-fold increase in Gly while a fivefold increase was seen in wild-type plants [12]. It appeared that the metabolic origin of the additional accumulated Gly and Ser in gox1 and gox2.2 was due to the low CO2 conditions stimulating photorespiration. It might be that in these mutants there is an activation of alternative metabolic routes to make Gly and Ser. For instance, Gly can be synthesized from Thr via Thr aldolase, although this activity is nonessential for Gly production in Arabidopsis under normal conditions [59], and from non-photorespiratory aminotransferases [57,60]. Ser can be made via the phosphoserine pathway that plays an essential role in embryo and pollen development [61,62]. This pathway became important in photosynthetic tissues when photorespiration was reduced [63] and it was induced in plants over-expressing SGAT [49]. However, such scenarios do not make sense in plants that are already accumulating large quantities of both amino acids. It is probably more important for gox1 and gox2.2 plants to maintain their capacity to produce glyoxylate, possibly by activating alternative non-photorespiratory pathways. A candidate could be the first enzyme of the glyoxylate cycle [64], isocitrate lyase (ICL) that produces glyoxylate from isocitrate. This cycle generates respiratory substrates from triacylglycerol degradation during seed germination but it is not present after this developmental stage, although ICL is induced by natural senescence [65]. This hypothesis requires further investigation, but it is probably difficult to reconcile such a scenario with Gly and Ser over-accumulation unless ICL allows for a higher glyoxylate production compared to wild-type Col-0 and gox2.2 plants. On the other hand, a perturbation of glyoxylate metabolism in the gox1 and gox2.2 mutants might alter the coordinated action of the two glyoxylate-dependent aminotransferase reactions that link photorespiratory Gly and Ser metabolisms. Based on the kinetic properties of Arabidopsis GGAT and SGAT [56,57], it is difficult to propose a differential effect of glyoxylate concentration on the transaminase activities that could explain the higher accumulation of Gly and Ser in gox1 and gox2.2. So, could it be that photorespiration is actually higher in the gox1 and gox2.2 plants due to their lower capacity to produce glyoxylate? Several observations made under non-physiological conditions using very high mM quantities of glyoxylate suggested that high amounts of glyoxylate actually improved photosynthesis, and led to lower amounts of both glycolate and glycine by inhibiting photorespiration [54,66]. Therefore, it is possible that the inverse is occurring in gox1 and gox2.2 rosettes where a lower maximal GOX activity reduces steady-state glyoxylate production and this has a beneficial effect on the photorespiratory cycle and allows for the production of more Gly and Ser under a high photorespiration situation (low CO2).

4. Materials and Methods

4.1. Plant Material and Growth Conditions

Experiments were performed using Arabidopsis thaliana wild-type ecotype Columbia (Col-0) and previously characterized T-DNA insertion mutants for GOX1 (At3g14420; SAIL 117-G11 (gox1)), and GOX2 (At3g14415; Salk 025,574 (gox2.1) and Salk 044,052 (gox2.2)) [12]. Seeds were germinated for one week and then individually transferred to medium pots for plant growth. The following climatic conditions were used for plant growth: 8 h/16 h day/night cycle (20 °C/18 °C), light intensity of 200 µmol photons.m−2.s−1, ambient air (380 µmol CO2.mol−1 air) and a relative humidity of 65–80%. Prior to low CO2 exposure, plants were grown for 5 weeks on a commercial peat substrate fertilized with 1 kg.m−3 of a 17:10:14 N/P/K mixture and irrigated twice a week with tap water.

4.2. Low CO2 Exposure Experiments

Two different experiments were performed: a short-term 4 h transfer and a long-term transfer for up to 8 days.
For short-term exposure to low CO2, three plants per condition and per genotype were taken from the growth cabinet 1 h after the beginning of illumination and transferred to a home-made gas exchange open system (0.8 dm3) illuminated with six LEDs (200 µmol photons.m−2.s−1) and connected to a portable photosynthesis system (LiCOR 6400XT). The upper part of the gas exchange chamber was built with a breakable soft and transparent film, thus allowing instant freezing of rosette leaves with liquid nitrogen spraying at the end of the experiment. The air flow inside the chamber was kept to around 40 L.h−1 with an air pump and the air temperature inside the chamber was kept to around 20 °C by using a coil cooler immersed into a water bath kept at 8 °C. A thermocouple was placed close to a leaf inside the chamber and connected to the LiCOR to follow air temperature evolution during the experiments. Relative humidity (65–80%) and [CO2] inside the chamber were directly controlled with the portable photosynthesis system (LiCOR 6400XT). Prior to low CO2 treatment, plants were acclimated for up to 1 h in the chamber at 380 ppm CO2. The speed of air renewal with this experimental setup allowed rapid adjustment of CO2 levels within the chamber (1–3 min).
For long-term exposure to low CO2, it was not possible to use the home-made gas exchange system. Therefore, a growth cabinet with a CO2 detector was equipped with two large cotton bags full of soda lime (1–2 kg per bag) in front of the air fans located within the chamber. The soda lime was renewed every 2 days and allowed approximately 200 ppm CO2 to be reached inside the growth cabinet. The experiment started with the transfer of plants taken from a classic growth cabinet (at 380 ppm) 1 h after the beginning of illumination. Samples were harvested after 1, 4 and 8 days by quickly cutting rosette leaves inside the chamber and putting them into liquid nitrogen (semi-instantaneous freezing).

4.3. Amino Acid Quantification

Frozen rosette leaves were ground to a fine powder in a mortar pre-cooled with liquid nitrogen and polar metabolites were extracted with ice-cold methanol/water (80:20) containing 100 µM of α-aminobutyrate as an internal standard. A ratio of 1 mL per 100 mg FW of rosettes was used. After a 15 min centrifugation step at 10,000× g at 4 °C, the supernatant was recovered and again subjected to the same centrifugation step. For each supernatant, an aliquot of 200 µL was dried overnight under vacuum and stored at −80 °C. Amino acids were derivatized with o-phthaldialdehyde (OPA), separated by HPLC on a “Symmetry C18 3.5 μm” column (150 mm × 4.6 mm, Waters) and detected with a fluorescence detector as previously described [67]. Three points of a calibration curve made with a mix of amino acid standards were injected every five samples to monitor the drift of the fluorescence response of OPA-derivatives during the run. Amino acid derivatives were identified by comparison of their retention times with authentic standards and quantified using a calibration curve, after a correction step with blank values and a normalization step with the internal standard α-aminobutyrate.

4.4. GOX Activity

Frozen rosette leaves were ground to a fine powder and leaf soluble proteins were extracted at 4 °C with 50 mM Tris-HCl, pH 8.0 containing an anti-protease cocktail (Complete-Mini, Roche). After a centrifugation step of 10 min at 20,000× g at 4 °C, 500 µL of each supernatant was desalted by filtration using individual ice-cold NAP-5 columns (GE Healthcare). Leaf soluble protein levels of the desalted fractions were quantified using the Bradford reagent (Sigma-Aldrich, St. Louis, MO, USA) with bovine serum albumin as the standard. The desalted extracts were immediately used for GOX activity measurements. The H2O2 produced by GOX activity was measured spectrophotometrically at 30 °C in the presence of 10 mM glycolate and 50–150 µg of soluble proteins using a coupled enzymatic assay comprising of o-dianisidine and horseradish peroxidase [25].

4.5. Multivariate and Statistical Analysis

Multivariate and statistical analyses were carried using R based [68] dedicated packages and personal scripts, except for the hierarchical clustering. Data normality was checked by visual inspection of quantile–quantile plots. Principal component analysis (PCA) was carried out with the R package FactoMineR [69] and the two first components showing the maximum of variability were used for graphical representations (variable plots with correlation circle and individual plots). Partial least squared discriminant analysis (PLS-DA) was performed with the mixOmics R package [70]. For hierarchical clustering, data were first visualized with a heat map after a normalization step and a mean-centered reduction step for each amino acid. Accordingly, the color scale in the heat map was expressed as the number of SDs (standard deviations). Hierarchical clustering based on Pearson correlation coefficients was achieved with the free Multiple Experiment Viewer software (MeV 4.9.0). The effect of genotype, [CO2] and their interaction were tested by a two-way ANOVA (p-value < 0.05). For amino acid analysis, the percentage of variance explained by the statistical model was calculated from the sum of squares (including residuals) and normality of the residues was checked with quantile–quantile plots. Tukey’s HSD tests were used for post-hoc multiple pairwise comparisons of mean groups and Student tests for the comparison of two mean groups (p-value < 0.05). All results are expressed as the mean ± standard deviation (SD) of three independent biological replicates.

5. Conclusions

Wild-type Arabidopsis and single gox1 and gox2 mutants were compared to determine the impact of photorespiration on amino acid metabolism under low atmospheric CO2 concentrations. Increased photorespiration and reduced photosynthesis brought about by a reduction in CO2 levels rapidly led to a broad reconfiguration of leaf soluble amino acid pool sizes (Figure 1, Figure 2, Figure 3 and Figure 4; Tables S1 and S2). Low CO2 acclimation led to an accumulation of photorespiratory Gly and Ser (Figure 2B,C and Figure 4F,G; Tables S1–S4) and a significant reduction in Ala, Asp and Asn (Tables S1 and S2) whereas both Glu and Gln were less affected (Figure 4D; Tables S1 and S2). A perturbation of glyoxylate biosynthesis in gox mutants led to a further over-accumulation of Gly and Ser (Figure 4F,G) and this was negatively correlated to extractable GOX activity (Figure 3A). Metabolic flux studies and kinetic modelling of the interacting metabolic pathways are now required to better understand the processes involved in the low CO2-induced changes of leaf amino acid metabolism.

Supplementary Materials

The following are available online at https://0-www-mdpi-com.brum.beds.ac.uk/article/10.3390/metabo11080501/s1, Figure S1: Partial Least Square—Discriminant Analysis of rosette leaf amino acid contents of Arabidopsis Col-0 and gox1 plants exposed to short-term low CO2 treatments (180 and 100 ppm for 4 h), Figure S2: Partial Least Square—Discriminant Analysis of rosette leaf amino acid contents of Arabidopsis Col-0, gox1, gox2-1 and gox2-2 plants exposed to long-term low CO2 treatment (200 ppm for 1, 4 or 8 days), Figure S3: Contribution of Gly and Ser to the variation of total amino acids after either short or long-term exposure to low CO2 treatment, Table S1: Complete dataset of free amino acid contents of Arabidopsis Col-0 and gox1 rosette leaves exposed to short-term low CO2 treatments (180 and 100 ppm for 4 h), Table S2: Complete dataset of free amino acid contents of Arabidopsis Col-0, go1x, gox2-1 and gox2-2 plants exposed to long-term low CO2 treatments (200 ppm for 1, 4 or 8 days), Table S3: Free amino acid contents of rosette leaves from Arabidopsis Col-0 and gox1 mutant exposed to short-term low CO2 treatments (180 and 100 ppm for 4 h) expressed as percentages of total amino acids, Table S4: Free amino acid contents of rosette leaves from Arabidopsis Col-0, gox1 and gox2 mutants exposed to long-term low CO2 treatment (200 ppm) for 1, 4 or 8 days expressed as percentages of total amino acids.

Author Contributions

Conceptualization, Y.D., M.J. and M.H.; methodology, Y.D. and C.M.; software, Y.D.; validation, Y.D. and C.M.; formal analysis, Y.D.; investigation, Y.D., M.J. and M.H.; data curation, Y.D. and C.M.; writing—original draft preparation, Y.D.; writing—review and editing, Y.D., M.J. and M.H.; visualization, Y.D. and M.H.; supervision, M.J. and M.H.; project administration, M.H.; funding acquisition, Y.D. and M.H. All authors have read and agreed to the published version of the manuscript.

Funding

This research was funded by French National Research Agency (ANR), grant number “ANR-10-LABX0040-SPS” and “ANR-11-IDEX-0003-02”. Y.D. was supported by a PhD grant from the French Ministry of Higher Education and Research.

Institutional Review Board Statement

Not applicable.

Informed Consent Statement

Not applicable.

Data Availability Statement

The datasets for amino acid analysis are available in the “Supplementary Materials” section. The other datasets generated and/or analyzed during the current study are available from the corresponding authors on request due to restrictions.

Acknowledgments

We would like to thank the Métabolisme-Métabolome facility (IPS2) for their help with the HPLC analyses, Edouard Boex-Fontvieille for the adaptation of the home-made gas exchange open system to Arabidopsis plants.

Conflicts of Interest

The authors declare no conflict of interest.

References

  1. Von Caemmerer, S. Rubisco carboxylase/oxygenase: From the enzyme to the globe: A gas exchange perspective. J. Plant. Physiol. 2020, 252. [Google Scholar] [CrossRef] [PubMed]
  2. Farquhar, G.D.; Von Caemmerer, S.; Berry, J.A. A biochemical model of photosynthetic CO2 assimilation in leaves of C3 species. Planta 1980, 149. [Google Scholar] [CrossRef] [Green Version]
  3. Timm, S.; Hagemann, M. Photorespiration—How is it regulated and regulates overall plant metabolism? J. Exp. Bot. 2020, 71, 3955–3965. [Google Scholar] [CrossRef]
  4. Flugel, F.; Timm, S.; Arrivault, S.; Florian, A.; Stitt, M.; Fernie, A.R.; Bauwe, H. The photorespiratory metabolite 2-phosphoglycolate regulates photosynthesis and starch accumulation in arabidopsis. Plant Cell 2017, 29, 2537–2551. [Google Scholar] [CrossRef] [PubMed] [Green Version]
  5. Bauwe, H.; Hagemann, M.; Fernie, A.R. Photorespiration: Players, partners and origin. Trends Plant Sci. 2010, 15, 330–336. [Google Scholar] [CrossRef] [PubMed]
  6. Berghuijs, H.N.C.; Yin, X.; Ho, Q.T.; Retta, M.A.; Nicolai, B.M.; Struik, P.C. Using a reaction-diffusion model to estimate day respiration and reassimilation of (photo)respired CO2 in leaves. New Phytol. 2019, 223, 619–631. [Google Scholar] [CrossRef] [Green Version]
  7. Wallsgrove, R.; Turner, J.; Hall, N.; Kendall, A.; Bright, S. Barley mutants lacking chloroplast glutamine synthetasebiochemical and genetic analysis. Plant Physiol. 1987, 83, 155–158. [Google Scholar] [CrossRef] [Green Version]
  8. Timm, S.; Bauwe, H. The variety of photorespiratory phenotypes—Employing the current status for future research directions on photorespiration. Plant Biol. 2013, 15, 737–747. [Google Scholar] [CrossRef]
  9. Timm, S.; Mielewczik, M.; Florian, A.; Frankenbach, S.; Dreissen, A.; Hocken, N.; Fernie, A.R.; Walter, A.; Bauwe, H. High-to-low CO2 acclimation reveals plasticity of the photorespiratory pathway and indicates regulatory links to cellular metabolism of arabidopsis. PLoS ONE 2012, 7, e42809. [Google Scholar] [CrossRef] [PubMed] [Green Version]
  10. Somerville, C.; Ogren, W. Photorespiration mutants of arabidopsis thaliana deficient in serine-glyoxylate aminotransferase activity. Proc. Natl. Acad. Sci. USA 1980, 77, 4. [Google Scholar] [CrossRef] [PubMed] [Green Version]
  11. Dellero, Y.; Lamothe-Sibold, M.; Jossier, M.; Hodges, M. Arabidopsis thaliana ggt1 photorespiratory mutants maintain leaf carbon/nitrogen balance by reducing rubisco content and plant growth. Plant J. 2015, 83, 1005–1018. [Google Scholar] [CrossRef] [PubMed]
  12. Dellero, Y.; Jossier, M.; Glab, N.; Oury, C.; Tcherkez, G.; Hodges, M. Decreased glycolate oxidase activity leads to altered carbon allocation and leaf senescence after a transfer from high CO2 to ambient air in arabidopsis thaliana. J. Exp. Bot. 2016, 67, 3149–3163. [Google Scholar] [CrossRef] [Green Version]
  13. Hodges, M.; Dellero, Y.; Keech, O.; Betti, M.; Raghavendra, A.S.; Sage, R.; Zhu, X.G.; Allen, D.K.; Weber, A.P. Perspectives for a better understanding of the metabolic integration of photorespiration within a complex plant primary metabolism network. J. Exp. Bot. 2016, 67, 3015–3026. [Google Scholar] [CrossRef] [PubMed]
  14. Ros, R.; Munoz-Bertomeu, J.; Krueger, S. Serine in plants: Biosynthesis, metabolism, and functions. Trends Plant Sci. 2014, 19, 564–569. [Google Scholar] [CrossRef] [PubMed]
  15. Voss, I.; Sunil, B.; Scheibe, R.; Raghavendra, A.S. Emerging concept for the role of photorespiration as an important part of abiotic stress response. Plant Biol. 2013, 15, 713–722. [Google Scholar] [CrossRef] [PubMed]
  16. Takahashi, S.; Bauwe, H.; Badger, M. Impairment of the photorespiratory pathway accelerates photoinhibition of photosystem ii by suppression of repair but not acceleration of damage processes in arabidopsis. Plant Physiol. 2007, 144, 487–494. [Google Scholar] [CrossRef] [Green Version]
  17. Blume, C.; Ost, J.; Muhlenbruch, M.; Peterhansel, C.; Laxa, M. Low CO2 induces urea cycle intermediate accumulation in arabidopsis thaliana. PLoS ONE 2019, 14, e0210342. [Google Scholar] [CrossRef]
  18. Abadie, C.; Bathellier, C.; Tcherkez, G. Carbon allocation to major metabolites in illuminated leaves is not just proportional to photosynthesis when gaseous conditions (CO2 and O2) vary. New Phytol. 2018, 218, 94–106. [Google Scholar] [CrossRef] [Green Version]
  19. Abadie, C.; Lalande, J.; Limami, A.M.; Tcherkez, G. Non-targeted 13c metabolite analysis demonstrates broad re-orchestration of leaf metabolism when gas exchange conditions vary. Plant Cell Environ. 2020, 44, 13. [Google Scholar] [CrossRef]
  20. Timm, S.; Nunes-Nesi, A.; Parnik, T.; Morgenthal, K.; Wienkoop, S.; Keerberg, O.; Weckwerth, W.; Kleczkowski, L.A.; Fernie, A.R.; Bauwe, H. A cytosolic pathway for the conversion of hydroxypyruvate to glycerate during photorespiration in arabidopsis. Plant Cell 2008, 20, 2848–2859. [Google Scholar] [CrossRef] [Green Version]
  21. Timm, S.; Florian, A.; Jahnke, K.; Nunes-Nesi, A.; Fernie, A.R.; Bauwe, H. The hydroxypyruvate-reducing system in arabidopsis: Multiple enzymes for the same end. Plant Physiol. 2011, 155, 694–705. [Google Scholar] [CrossRef] [PubMed] [Green Version]
  22. Timm, S. The impact of photorespiration on plant primary metabolism through metabolic and redox regulation. Biochem. Soc. Trans. 2020, 48, 2495–2504. [Google Scholar] [CrossRef]
  23. Esser, C.; Kuhn, A.; Groth, G.; Lercher, M.J.; Maurino, V.G. Plant and animal glycolate oxidases have a common eukaryotic ancestor and convergently duplicated to evolve long-chain 2-hydroxy acid oxidases. Mol. Biol. Evol. 2014, 31, 1089–1101. [Google Scholar] [CrossRef] [PubMed] [Green Version]
  24. Engqvist, M.K.; Schmitz, J.; Gertzmann, A.; Florian, A.; Jaspert, N.; Arif, M.; Balazadeh, S.; Mueller-Roeber, B.; Fernie, A.R.; Maurino, V.G. Glycolate oxidase3, a glycolate oxidase homolog of yeast l-lactate cytochrome c oxidoreductase, supports l-lactate oxidation in roots of arabidopsis. Plant Physiol. 2015, 169, 1042–1061. [Google Scholar] [CrossRef] [PubMed] [Green Version]
  25. Dellero, Y.; Mauve, C.; Boex-Fontvieille, E.; Flesch, V.; Jossier, M.; Tcherkez, G.; Hodges, M. Experimental evidence for a hydride transfer mechanism in plant glycolate oxidase catalysis. J. Biol. Chem. 2015, 290, 1689–1698. [Google Scholar] [CrossRef] [Green Version]
  26. Gerhart, L.M.; Ward, J.K. Plant responses to low [CO2] of the past. New Phytol. 2010, 188, 674–695. [Google Scholar] [CrossRef]
  27. Brodribb, T. Dynamics of changing intercellular CO2 concentration (ci) during drought and determination of minimum functional ci. Plant Physiol. 1996, 111, 179–185. [Google Scholar] [CrossRef] [Green Version]
  28. Masclaux-Daubresse, C.; Reisdorf-Cren, M.; Pageau, K.; Lelandais, M.; Grandjean, O.; Kronenberger, J.; Valadier, M.H.; Feraud, M.; Jouglet, T.; Suzuki, A. Glutamine synthetase-glutamate synthase pathway and glutamate dehydrogenase play distinct roles in the sink-source nitrogen cycle in tobacco. Plant Physiol. 2006, 140, 444–456. [Google Scholar] [CrossRef] [Green Version]
  29. Gaufichon, L.; Masclaux-Daubresse, C.; Tcherkez, G.; Reisdorf-Cren, M.; Sakakibara, Y.; Hase, T.; Clement, G.; Avice, J.C.; Grandjean, O.; Marmagne, A.; et al. Arabidopsis thaliana asn2 encoding asparagine synthetase is involved in the control of nitrogen assimilation and export during vegetative growth. Plant Cell Environ. 2013, 36, 328–342. [Google Scholar] [CrossRef] [PubMed]
  30. Zhu, X.G.; Long, S.P.; Ort, D.R. What is the maximum efficiency with which photosynthesis can convert solar energy into biomass? Curr. Opin. Biotechnol. 2008, 19, 153–159. [Google Scholar] [CrossRef] [PubMed]
  31. Timm, S.; Woitschach, F.; Heise, C.; Hagemann, M.; Bauwe, H. Faster removal of 2-phosphoglycolate through photorespiration improves abiotic stress tolerance of arabidopsis. Plants 2019, 8, 563. [Google Scholar] [CrossRef] [PubMed] [Green Version]
  32. Rojas, C.M.; Senthil-Kumar, M.; Wang, K.; Ryu, C.M.; Kaundal, A.; Mysore, K.S. Glycolate oxidase modulates reactive oxygen species-mediated signal transduction during nonhost resistance in nicotiana benthamiana and arabidopsis. Plant Cell 2012, 24, 336–352. [Google Scholar] [CrossRef] [PubMed] [Green Version]
  33. Liu, Y.; Mauve, C.; Lamothe-Sibold, M.; Guerard, F.; Glab, N.; Hodges, M.; Jossier, M. Photorespiratory serine hydroxymethyltransferase 1 activity impacts abiotic stress tolerance and stomatal closure. Plant Cell Environ. 2019, 42, 17. [Google Scholar] [CrossRef]
  34. Novitskaya, L.; Trevanion, S.J.; Driscoll, S.; Foyer, C.H.; Noctor, G. How does photorespiration modulate leaf amino acid contents? A dual approach through modelling and metabolite analysis. Plant Cell Environ. 2002, 25, 15. [Google Scholar] [CrossRef] [Green Version]
  35. Abadie, C.; Boex-Fontvieille, E.R.; Carroll, A.J.; Tcherkez, G. In vivo stoichiometry of photorespiratory metabolism. Nat. Plants 2016, 2. [Google Scholar] [CrossRef]
  36. Abadie, C.; Lothier, J.; Boex-Fontvieille, E.; Carroll, A.; Tcherkez, G. Direct assessment of the metabolic origin of carbon atoms in glutamate from illuminated leaves using (13) c-nmr. New Phytol. 2017, 216, 1079–1089. [Google Scholar] [CrossRef] [PubMed] [Green Version]
  37. Abadie, C.; Tcherkez, G. In vivo phosphoenolpyruvate carboxylase activity is controlled by CO2 and O2 mole fractions and represents a major flux at high photorespiration rates. New Phytol. 2019, 221, 1843–1852. [Google Scholar] [CrossRef] [PubMed]
  38. Chrobok, D.; Law, S.R.; Brouwer, B.; Linden, P.; Ziolkowska, A.; Liebsch, D.; Narsai, R.; Szal, B.; Moritz, T.; Rouhier, N.; et al. Dissecting the metabolic role of mitochondria during developmental leaf senescence. Plant Physiol. 2016, 172, 2132–2153. [Google Scholar] [CrossRef] [Green Version]
  39. Dellero, Y.; Heuillet, M.; Marnet, N.; Bellvert, F.; Millard, P.; Bouchereau, A. Sink/source balance of leaves influences amino acid pools and their associated metabolic fluxes in winter oilseed rape (brassica napus l.). Metabolites 2020, 10, 150. [Google Scholar] [CrossRef]
  40. Dellero, Y. Manipulating amino acid metabolism to improve crop nitrogen use efficiency for a sustainable agriculture. Front. Plant Sci. 2020, 11, 1857. [Google Scholar] [CrossRef] [PubMed]
  41. Hildebrandt, T.M.; Nunes Nesi, A.; Araujo, W.L.; Braun, H.P. Amino acid catabolism in plants. Mol. Plant 2015, 8, 1563–1579. [Google Scholar] [CrossRef] [Green Version]
  42. Pires, M.V.; Pereira Junior, A.A.; Medeiros, D.B.; Daloso, D.M.; Pham, P.A.; Barros, K.A.; Engqvist, M.K.; Florian, A.; Krahnert, I.; Maurino, V.G.; et al. The influence of alternative pathways of respiration that utilize branched-chain amino acids following water shortage in arabidopsis. Plant Cell Environ. 2016, 39, 1304–1319. [Google Scholar] [CrossRef] [Green Version]
  43. Bloom, A.J.; Burger, M.; Asensio, J.S.; Cousins, A.B. Carbon dioxide enrichment inhibits nitrate assimilation in wheat and arabidopsis. Science 2010, 328, 6. [Google Scholar] [CrossRef] [PubMed] [Green Version]
  44. Zhang, Q.; Lee, J.; Pandurangan, S.; Clarke, M.; Pajak, A.; Marsolais, F. Characterization of arabidopsis serine:Glyoxylate aminotransferase, agt1, as an asparagine aminotransferase. Phytochemistry 2013, 85, 30–35. [Google Scholar] [CrossRef]
  45. Clark, S.M.; Di Leo, R.; Dhanoa, P.K.; Van Cauwenberghe, O.R.; Mullen, R.T.; Shelp, B.J. Biochemical characterization, mitochondrial localization, expression, and potential functions for an arabidopsis gamma-aminobutyrate transaminase that utilizes both pyruvate and glyoxylate. J. Exp. Bot. 2009, 60, 1743–1757. [Google Scholar] [CrossRef] [PubMed] [Green Version]
  46. Timm, S.; Wittmiss, M.; Gamlien, S.; Ewald, R.; Florian, A.; Frank, M.; Wirtz, M.; Hell, R.; Fernie, A.R.; Bauwe, H. Mitochondrial dihydrolipoyl dehydrogenase activity shapes photosynthesis and photorespiration of arabidopsis thaliana. Plant Cell 2015, 27, 1968–1984. [Google Scholar] [CrossRef] [PubMed] [Green Version]
  47. Timm, S.; Florian, A.; Arrivault, S.; Stitt, M.; Fernie, A.R.; Bauwe, H. Glycine decarboxylase controls photosynthesis and plant growth. FEBS Lett. 2012, 586, 3692–3697. [Google Scholar] [CrossRef] [PubMed] [Green Version]
  48. Prabhu, V.; Brock Chatson, K.; Abrams, G.D.; King, J. 13c nuclear magnetic resonance detection of lnteractions of serine hydroxymethyltransferase with c1 -tetrahydrofoiate synthase and glycine decarboxylase complex activities in arabidopsis. Plant Physiol. 1996, 112, 10. [Google Scholar] [CrossRef] [PubMed] [Green Version]
  49. Modde, K.; Timm, S.; Florian, A.; Michl, K.; Fernie, A.R.; Bauwe, H. High serine:Glyoxylate aminotransferase activity lowers leaf daytime serine levels, inducing the phosphoserine pathway in arabidopsis. J. Exp. Bot. 2017, 68, 643–656. [Google Scholar] [CrossRef] [PubMed] [Green Version]
  50. Havir, E.A.; McHale, N.A. A mutant of nicotiana sylvestris lacking serine:Glyoxylate aminotransferase. Plant Physiol. 1988, 87, 3. [Google Scholar] [CrossRef] [Green Version]
  51. Murray, A.J.S.; Blackwell, R.D.; Joy, K.W.; Lea, P.J. Photorespiratory n donors, aminotransferase specificity and photosynthesis in a mutant of barley deficient in serine: Glyoxylate aminotransferase activity. Planta 1987, 172, 8. [Google Scholar] [CrossRef] [PubMed]
  52. Wingler, A.; Ann, V.J.; Lea, P.J.; Leegood, R.C. Serine: Glyoxylate aminotransferase exerts no control on photosynthesis. J. Exp. Bot. 1999, 50, 719–722. [Google Scholar] [CrossRef]
  53. Igarashi, D.; Tsuchida, H.; Miyao, M.; Ohsumi, C. Glutamate:Glyoxylate aminotransferase modulates amino acid content during photorespiration. Plant Physiol. 2006, 142, 901–910. [Google Scholar] [CrossRef] [Green Version]
  54. Oliver, D.J.; Sarojini, G. Regulation of Glycine Decarboxylase by Serine. In Progress in Photosynthesis Research; Springer: Dordrecht, The Netherlands, 1987; pp. 573–576. [Google Scholar] [CrossRef]
  55. Liepman, A.H.; Olsen, L.J. Peroxisomal alanine: Glyoxylate aminotransferase (agt1) is a photorespiratory enzyme with multiple substrates in arabidopsis thaliana. Plant J. 2001, 25, 12. [Google Scholar] [CrossRef] [PubMed]
  56. Kendziorek, M.; Paszkowski, A. Properties of serine:Glyoxylate aminotransferase purified from arabidopsis thaliana leaves. Acta Biochim. Biophys. Sin. 2008, 40, 102–110. [Google Scholar] [CrossRef] [Green Version]
  57. Liepman, A.H.; Olsen, L.J. Alanine aminotransferase homologs catalyze the glutamate:Glyoxylate aminotransferase reaction in peroxisomes of arabidopsis. Plant Physiol. 2003, 131, 215–227. [Google Scholar] [CrossRef] [PubMed] [Green Version]
  58. Zhang, Z.; Mao, X.; Ou, J.; Ye, N.; Zhang, J.; Peng, X. Distinct photorespiratory reactions are preferentially catalyzed by glutamate:Glyoxylate and serine:Glyoxylate aminotransferases in rice. J. Photochem. Photobiol. B 2015, 142, 110–117. [Google Scholar] [CrossRef] [PubMed]
  59. Joshi, V.; Laubengayer, K.M.; Schauer, N.; Fernie, A.R.; Jander, G. Two arabidopsis threonine aldolases are nonredundant and compete with threonine deaminase for a common substrate pool. Plant Cell 2006, 18, 3564–3575. [Google Scholar] [CrossRef] [PubMed] [Green Version]
  60. Plant Metabolics Network. 2021. Available online: https://pmn.Plantcyc.Org/plant/new-image?Type=pathway&object=glysyn2-pwyonwww.plantcyc.org (accessed on 30 July 2021).
  61. Toujani, W.; Munoz-Bertomeu, J.; Flores-Tornero, M.; Rosa-Tellez, S.; Anoman, A.D.; Alseekh, S.; Fernie, A.R.; Ros, R. Functional characterization of the plastidial 3-phosphoglycerate dehydrogenase family in arabidopsis. Plant Physiol. 2013, 163, 1164–1178. [Google Scholar] [CrossRef] [PubMed] [Green Version]
  62. Cascales-Minana, B.; Munoz-Bertomeu, J.; Flores-Tornero, M.; Anoman, A.D.; Pertusa, J.; Alaiz, M.; Osorio, S.; Fernie, A.R.; Segura, J.; Ros, R. The phosphorylated pathway of serine biosynthesis is essential both for male gametophyte and embryo development and for root growth in arabidopsis. Plant Cell 2013, 25, 2084–2101. [Google Scholar] [CrossRef] [PubMed] [Green Version]
  63. Benstein, R.M.; Ludewig, K.; Wulfert, S.; Wittek, S.; Gigolashvili, T.; Frerigmann, H.; Gierth, M.; Flugge, U.I.; Krueger, S. Arabidopsis phosphoglycerate dehydrogenase1 of the phosphoserine pathway is essential for development and required for ammonium assimilation and tryptophan biosynthesis. Plant Cell 2013, 25, 5011–5029. [Google Scholar] [CrossRef] [PubMed] [Green Version]
  64. Eastmond, P.J.; Graham, I.A. Re-examining the role of the glyoxylate cycle in oilseeds. Trends Plant Sci. 2001, 6, 487–498. [Google Scholar] [CrossRef]
  65. Charlton, W.L.; Johnson, B.; Graham, I.A.; Baker, A. Non-coordinate expression of peroxisome biogenesis, beta-oxidation and glyoxylate cycle genes in mature arabidopsis plants. Plant Cell Rep. 2005, 23, 647–653. [Google Scholar] [CrossRef] [PubMed]
  66. Oliver, D.J.; Zelitch, I. Increasing photosynthesis by inhibiting photorespiration with glyoxylate. Science 1977, 196, 1450–1451. [Google Scholar] [CrossRef]
  67. Noctor, G.; Bergot, G.; Mauve, C.; Thominet, D.; Lelarge-Trouverie, C.; Prioul, J.-L. A comparative study of amino acid measurement in leaf extracts by gas chromatography-time of flight-mass spectrometry and high performance liquid chromatography with fluorescence detection. Metabolomics 2007, 3, 161–174. [Google Scholar] [CrossRef]
  68. R Core Team. R: A Language and Environment for Statistical Computing; R Foundation for Statistical Computing: Vienna, Austria, 2021. [Google Scholar]
  69. Lê, S.; Josse, J.; Husson, F. Factominer: An r package for multivariate analysis. J. Stat. Softw. 2008, 25, 1–18. [Google Scholar] [CrossRef] [Green Version]
  70. Rohart, F.; Gautier, B.; Singh, A.; Le Cao, K.A. Mixomics: An r package for ‘omics feature selection and multiple data integration. PLoS Comput. Biol. 2017, 13, e1005752. [Google Scholar] [CrossRef] [PubMed] [Green Version]
Figure 1. The effect of short-term low CO2 treatments (180 and 100 ppm for 4 h) on net CO2 assimilation rate and amino acid contents of Arabidopsis Col-0 and gox1 rosette leaves. (A) Net CO2 assimilation rate before (380 ppm) and after exposure to an atmosphere with 380, 180 or 100 ppm CO2 (4 h treatment). (B) Principal Component Analysis of amino acid contents of Col-0 and gox1 rosette leaves after a 4 h exposure to an atmosphere with 380, 180 or 100 ppm CO2. (C) Hierarchical clustering of amino acid contents based on Pearson’s correlation coefficients. Results are expressed as the mean ± standard deviation of three independent biological replicates. Different letters indicate groups of mean values that are significantly different between the conditions (two-way ANOVA test followed by a post-hoc Tukey HSD test, p-value < 0.05). Ellipses on the PCA plots represent the 95% confidence intervals. *** p-value < 0.001; * p-value < 0.05.
Metabolites 11 00501 g001
Figure 2. Statistical analyses of amino acid variations associated with short-term exposure to low CO2 (180 and 100 ppm for 4 h) in wild-type and gox1 Arabidopsis thaliana Col-0. (A) Two-way ANOVA analysis of amino acid contents from rosette leaves of Col-0 and gox1 plants after 4 h of exposure to an atmosphere with 380, 180 or 100 ppm CO2. (B) Glycine and (C) Serine contents, (D) Glycine/Serine, (E) Glutamate/Glutamine and (F) Aspartate/Asparagine ratios. Results are expressed as the mean ± standard deviation of three independent biological replicates. Different letters indicate groups of mean values that are significantly different between the different conditions (two-way ANOVA test followed by a post-hoc Tukey HSD test, p-value < 0.05). *** p-value < 0.001; ** p-value < 0.01; * p-value < 0.05. Var = Variance.
Metabolites 11 00501 g002
Figure 3. The effect of a long-term low CO2 treatment (200 ppm) on rosette leaf GOX activity and amino acid levels of Arabidopsis Col-0, gox1 and gox2 mutants. Plants were exposed to an atmosphere containing 200 ppm CO2 for either 1, 4 or 8 days. (A) Rosette leaf GOX activity, (B) principal component analysis of amino acid contents, (C) hierarchical clustering of amino acid contents based on Pearson’s correlation coefficients. Results are expressed as the mean ± standard deviation of three independent biological replicates. Different letters indicate groups of mean values that are significantly different between the different conditions (two-way ANOVA test followed by a post-hoc Tukey HSD test, p-value < 0.05). Ellipses on PCA plots represent the 95% confidence intervals. *** p-value < 0.001.
Metabolites 11 00501 g003
Figure 4. Statistical analyses of amino acid variations associated with long-term low CO2 treatment (200 ppm) in gox1 and gox2 mutants. (A) Two-way ANOVA analysis of amino acid contents from rosette leaves of Col-0, gox1 and gox2 mutants after 1, 4 or 8 days of exposure to an atmosphere with 200 ppm of CO2. (B) Tryptophan, (C) asparagine, (D) glutamine, (E) GABA, (F) glycine and (G) serine contents. Ratios for (H) glycine/serine, (I) glutamate/glutamine, (J) aspartate/asparagine. Results are expressed as the mean ± standard deviation of three independent biological replicates. Different letters indicate groups of mean values that are significantly different between the different conditions (two-way ANOVA test followed by a post-hoc Tukey HSD test, p-value < 0.05). *** p-value < 0.001; ** p-value < 0.01; * p-value < 0.05. Var = Variance.
Metabolites 11 00501 g004
Figure 5. Simplified metabolic scheme highlighting low-CO2 induced changes in amino acids. In low CO2 conditions, Rubisco oxygenase activity is increased at the expense of Rubisco carboxylase activity. This led to increased (green boxed) and decreased (orange boxed) soluble amino acid levels in Arabidopsis rosette leaves. Photorespiratory NH3 is reassimilated to produce Glu via the GS/GOGAT cycle and this Glu is recycled by the glutamate:glyoxylate aminotransferase (GGAT). Glyoxylate produced by glycolate oxidase (GOX) is a common substrate of GGAT and the serine:glyoxylate aminotransferase (SGAT). * Indicates Glu-dependent aminotransferases involved in amino acid biosynthesis pathways. Other abbreviations: 2OG, 2-oxoglutarate; 2-PG, 2-phosphoglycolate; 3-PGA, 3-phosphoglycerate; AA, amino acids; BCAA, branched-chain amino acids; GDC, glycine decarboxylase; GOGAT, Gln:2-oxoglutarate aminotransferase; GS, glutamine synthetase; PEP, phosphoenolpyruvate; Pyr-OH, hydroxypyruvate; Rubisco, ribulose-1,5-bisphosphate carboxylase/oxygenase; SHMT, serine hydroxymethyl transferase; THF, tetrahydrofolate; Triose-P, triose-phosphates.
Metabolites 11 00501 g005
Publisher’s Note: MDPI stays neutral with regard to jurisdictional claims in published maps and institutional affiliations.

