The metaRbolomics Toolbox in Bioconductor and beyond

 , , , , , , , ,
  ,
,  , , , , , , , , and
Abstract
:
1. Introduction
1.1. Metabolomics Data Processing and Analysis
1.2. The R Package Landscape
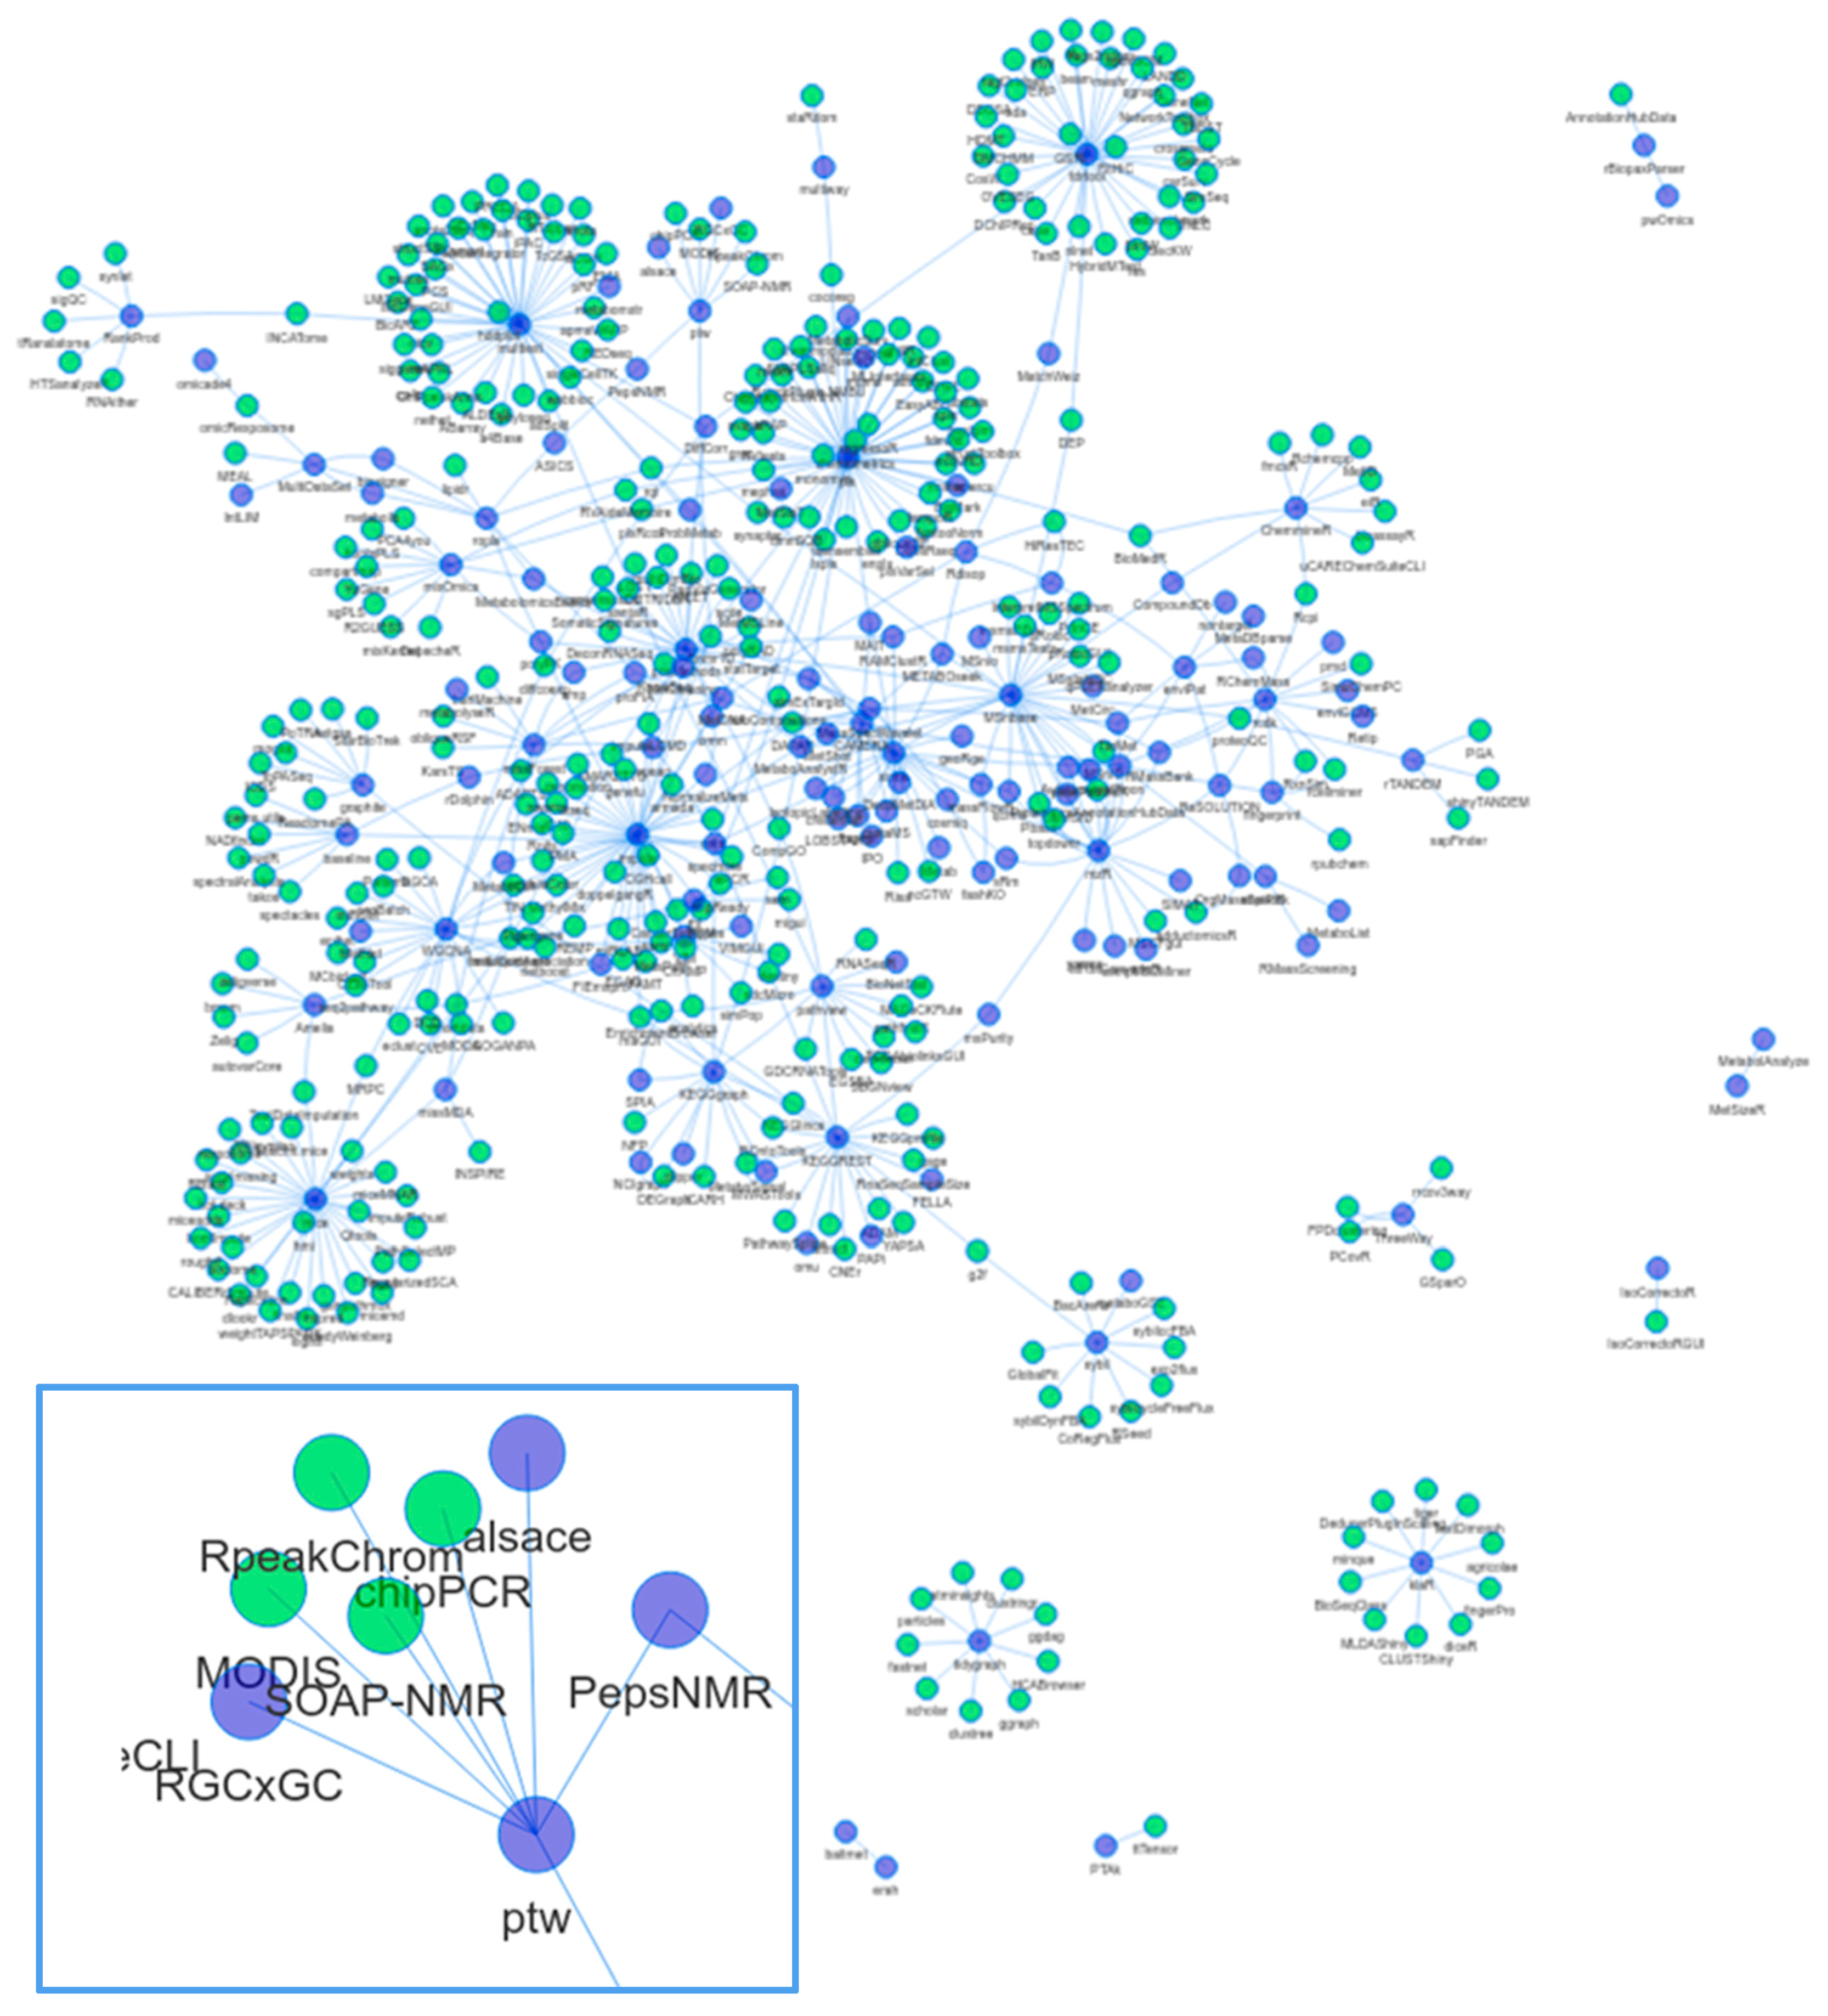
1.3. Dependencies and Connectivity of Metabolomics Packages
2. R-Packages for Metabolomics
2.1. Mass Spectrometry Data Handling and (Pre-) Processing
2.1.1. Profile Mode and Centroided Data
2.1.2. Direct Infusion Mass Spectrometry Data
2.1.3. Hyphenated MS and Non-Targeted Data
2.1.4. Targeted Data and Alternative Representations of Data
2.1.5. Additional Dimensionality
2.1.6. Structuring Data and Metadata

| Functionalities | Package | Reference | Repo |
|---|---|---|---|
| MS Data Handling | |||
| Parser for common file formats: mzXML, mzData, mzML and netCDF. Usually not used directly by the end user, but provides functions to read raw data for other packages. | mzR | [27] | BioC |
| Infrastructure to manipulate, process and visualise MS and proteomics data, ranging from raw to quantitative and annotated data. | MSnbase | [38] | BioC |
| Export and import of processed metabolomics MS results to and from the mzTab-M for metabolomics data format. | rmzTab-M | [37] | GitHub |
| Converts MRM-MS (.mzML) files to LC-MS style .mzML. | MRMConverteR | GitHub | |
| Infrastructure for import, handling, representation and analysis of chromatographic MS data. | Chromatograms | GitHub | |
| Infrastructure for import, handling, representation and analysis of MS spectra. | Spectra | GitHub | |
| Peak Picking, Grouping and Alignment (LC-MS Focussed or General) | |||
| Pre-processing and visualisation for (LC/GC-) MS data. Includes visualisation and simple statistics. | xcms | [31,32] | BioC |
| Automatic optimisation of xcms parameters based on isotopes. | IPO | [39] | BioC |
| Parameter tuning algorithm for xcms, MZmine2, and other metabolomics data processing software. | Autotuner | BioC | |
| Pre-processing and visualisation for (LC/GC-) MS data. Includes visualisation and simple statistics. | yamss | [40] | BioC |
| Peak picking with xcms and apLCMS, low intensity peak detection via replicate analyses. Multi-parameter feature extraction and data merging, sample quality and feature consistency evaluation. Annotation with METLIN and KEGG. | xMSanalyzer | [41] | SF |
| Pre-processing and alignment of LC-MS data without assuming a parametric peak shape model allowing maximum flexibility. It utilises the knowledge of known metabolites, as well as robust machine learning. | apLCMS | [42] | SF |
| Peak detection using chromatogram subregion detection, consensus integration bound determination and Accurate missing value integration. Outputs in xcms-compatible format. | warpgroup | [43] | GitHub |
| Peak picking for (LC/GC-) MS data, improving the detection of low abundance signals via a master map of m/z/RT space before peak detection. Results are xcms-compatible. | cosmiq | BioC | |
| m/z detection (i.e., peak picking) for accurate mass data, collecting all data points above an intensity threshold, grouping them by m/z values and estimating representative m/z values for the clusters; extracting EICs. | AMDORAP | [44] | SF |
| (GC/LC)-MS data analysis for environmental science, including raw data processing, analysis of molecular isotope ratios, matrix effects, and short-chain chlorinated paraffins. | enviGCMS | [45] | CRAN |
| Sequential partitioning, clustering and peak detection of centroided LC-MS mass spectrometry data (.mzXML), with Interactive result and raw data plot. | enviPick | CRAN | |
| Peak picking with xcms. Groups chemically related features before alignment across samples. Additional processing after alignment includes feature validation, re-integration and annotation based on custom database. | massFlowR | GitHub | |
| KPIC2 extracts pure ion chromatograms (PIC) via K-means clustering of ions in region of interest, performs grouping and alignment, grouping of isotopic and adduct features, peak filling and Random Forest classification. | KPIC2 | GitHub | |
| Isotope Labeling Using MS | |||
| Analysis of untargeted LC/MS data from stable isotope-labeling experiments. Also uses xcms for feature detection. | geoRge | [46] | GitHub |
| Correction of MS and MS/MS data from stable isotope labeling (any tracer isotope) experiments for natural isotope abundance and tracer impurity. Separate GUI available in IsoCorrectoRGUI. | IsoCorrectoR | [47] | BioC |
| Extension of xcms that provides support for isotopic labeling. Detection of metabolites that have been enriched with isotopic labeling. | X13CMS | [48] | |
| Analysis of isotopic patterns in isotopically labeled MS data. Estimates the isotopic abundance of the stable isotope (either 2H or 13C) within specified compounds. | IsotopicLabelling | [49] | GitHub |
| Finding the dual (or multiple) isotope labeled analytes using dual labeling of metabolites for metabolome analysis (DLEMMA) approach, described in Liron [50]. | Miso | [51] | CRAN |
| Targeted MS | |||
| Peak picking using peak apex intensities for selected masses. Reference library matching, RT/RI conversion plus metabolite identification using multiple correlated masses. Includes GUI. | TargetSearch | [52] | BioC |
| Pre-processing for targeted (SIM) GC-MS data. Guided selection of appropriate fragments for the targets of interest by using an optimisation algorithm based on user provided library. | SIMAT | [53] | BioC |
| Deconvolution of SWATH-MS experiments to MRM transitions. | SWATHtoMRM | [54] | |
| Automatic analysis of large-scale MRM experiments. | MRMAnalyzer | [55] | |
| Tailors peak detection for targeted metabolites through iterative user interface. It automatically integrates peak areas for all isotopologues and outputs extracted ion chromatograms (EICs). | AssayR | [56] | GitHub |
| Targeted peak picking and annotation. Includes shiny GUI. | peakPantheR | GitHub | |
| Toolkit for working with Selective Reaction Monitoring (SRM) MS data and other variants of targeted LC-MS data. | sRm | GitHub | |
| Deconvolution of SWATH-MS data. | DecoMetDIA | [57] | GitHub |
| Targeted peak picking and annotation. All functions through shiny GUI. | TarMet | GitHub | |
| GC-MS and GC×GC-MS | |||
| Unsupervised data mining on GC-MS. Clustering of mass spectra to detect compound spectra. The output can be searched in NIST and ARISTO [58]. | MSeasy | [59] | CRAN |
| Pre-processing for GC/MS, MassBank search, NIST format export. | erah | [60] | CRAN |
| Pre-processing using AMDIS [61,62] for untargeted GC-MS analysis. Feature grouping across samples, improved quantification, removal of false positives, normalisation via internal standard or biomass; basic statistics. | Metab | [63] | BioC |
| Deconvolution of GC-MS and GC×GC-MS unit resolution data using orthogonal signal deconvolution (OSD), independent component regression (ICR) and multivariate curve resolution (MCR-ALS). | osd | [64,65] | CRAN |
| Corrects overloaded signals directly in raw data (from GC-APCI-MS) automatically by using a Gaussian or isotopic-ratio approach. | CorrectOverloadedPeaks | [66] | CRAN |
| Alignment of GC data. Also GC-FID or any single channel data since it works directly on peak lists. | GCalignR | [67] | CRAN |
| GC-MS data processing and compound annotation pipeline. Includes the building, validating, and query of in-house databases. | metaMS | [68] | BioC |
| Peak picking for GC×GC-MS using bayes factor and mixture probability models. | msPeak | [69] | SF |
| Peak alignment for GC×GC-MS data with homogeneous peaks based on mixture similarity measures. | mSPA | [70] | SF |
| Peak alignment for GC×GC-MS data with homogeneous and/or heterogenous peaks based on mixture similarity measures. | SWPA | [71] | SF |
| Chemometrics analysis GC×GC-MS: baseline correction, smoothing, COW peak alignment, multiway PCA is incorporated. | RGCxGC | CRAN | |
| Retention time and mass spectra similarity threshold-free alignments, seamlessly integrates retention time standards for universally reproducible alignments, performs common ion filtering, and provides compatibility with multiple peak quantification methods. | R2DGC | [72] | GitHub |
| Flow Injection/Direct Infusion Analysis | |||
| Pre-processing of data from Flow Injection Analysis (FIA) coupled to High-Resolution Mass Spectrometry (HRMS). | proFIA | [73] | BioC |
| Flow In-jection Electrospray Mass Spectrometry Processing: data processing, classification modelling and variable selection in metabolite fingerprinting | FIEmspro | [74] | GitHub |
| Processing Mass Spectrometry spectrum by using wavelet-based algorithm. Can be used for direct infusion experiments. | MassSpecWavelet | [75] | BioC |
| Other | |||
| Filtering of features originating from artifactual interference. Based on the analysis of an extract of E. coli grown in 13C-enriched media. | credential | [76] | GitHub |
| Wrappers for xcms and CAMERA. Also includes matching to a spectral library and a GUI. | metaMS | [68] | BioC |
| Processing of peaktables from AMDIS, xcms or ChromaTOF. Functions for plotting also provided. | flagme | [77] | BioC |
| Parametric Time Warping (RT correction) for both DAD and LC-MS. | ptw | [78] | CRAN |
| R wrapper for X!Tandem software for protein identification. | rTANDEM | [79] | BioC |
| Building, validation, and statistical analysis of extended assay libraries for SWATH proteomics data. | SwathXtend | [80] | BioC |
| Split a data set into a set of likely true metabolites and likely measurement artifacts by comparing missing rates of pooled plasma samples and biological samples. | MetProc | [81] | CRAN |
| Quality of LC-MS and direct infusion MS data. Generates a report that contains a comprehensive set of quality control metrics and charts. | qcrms | GitHub | |
2.1.7. Ion Species Grouping and Annotation
| Functionalities | Package | Reference | Repos |
|---|---|---|---|
| Molecular Formula and Isotope Analysis | |||
| Uses GenForm for molecular formula generation on mass accuracy, isotope and/or MS/MS fragments, as well as performing MS/MS subformula annotation. | GenFormR | [83] | GitHub |
| Calculation of isotope fine patterns. Also adduct calculations and molecular formula parsing. Web version available at www.envipat.eawag.ch. | enviPat | [84] | CRAN |
| Molecular formula assignment, mass recalibration, signal-to-noise evaluation, and unambiguous formula selections are provided. | MFAssignR | GitHub | |
| Checking element isotopes, calculating (isotope labelled) exact monoisotopic mass, m/z values, mass accuracy, and inspecting possible contaminant mass peaks, examining possible adducts in ESI and MALDI. | MSbox | CRAN | |
| Simulation of and decomposition of Isotopic Patterns. | Rdisop | [85] | BioC |
| MS Feature Grouping | |||
| Grouping of correlated features into pseudo compound spectra using correlation across samples and similarity of peak shape. Annotation of isotopes and adducts. Works as an add-on to xcms. | CAMERA | [86] | BioC |
| Grouping of features based on similarity between coelution profiles. | CliqueMS | [87] | CRAN |
| Cluster-based feature grouping for non-targeted GC or LC-MS data. | RAMClustR | [88] | CRAN |
| Deconvolution of MS/MS spectra obtained with wide isolation windows. | decoMS2 | [89] | |
| Uses dynamic block summarisation to group features belong to the same compound. Correction for peak misalignments and isotopic pattern validation. | MetTailor | [90] | SF |
| Isotope & adduct peak grouping, homologous series detection. | nontarget | [91] | CRAN |
| Bayesian approach for grouping peaks originating from the same compound. | peakANOVA | [92] | |
| Combination of data from positive and negative ionisation mode finding common molecular entities. | MScombine | [93] | CRAN |
| Grouping of correlated features into pseudo compound spectra using correlation across sample. Annotation of isotopes and adducts. Can work directly with the xcms output. | Astream | [94] | |
| Navigation of high-resolution MS/MS data in a GUI based on mass spectral similarity. | MetCirc | [95] | BioC |
| Ion/Adduct/Fragment Annotation | |||
| Bayesian probabilistic annotation. | ProbMetab | [96] | GitHub |
| Isotope & adduct peak grouping, unsupervised homologous series detection. | nontarget | [91] | CRAN |
| Automatic interpretation of fragments and adducts in MS spectra. Molecular formula prediction based on fragmentation. | InterpretMSSpectrum | [97] | CRAN |
| Automated annotation using MS/MS data or databases and retention time. Calculation of spectral and chemical networks. | compMS2Miner | [98] | GitHub |
| Screening, annotation, and putative identification of mass spectral features in lipidomics. Default databases contain ~25,000 compounds. | LOBSTAHS | [99] | BioC |
| Automated annotation of fragments from MS and MS/MS and putative identification against simulated library fragments of ~500,000 lipid species across ~60 lipid types. | LipidMatch | [100] | GitHub |
| Annotation of lipid type and acyl groups on independent acquisition-mass spectrometry lipidomics based on fragmentation and intensity rules. | LipidMS | [101] | CRAN |
| Accurate mass and/or retention time and/or collisional cross section matching. | masstrixR | [102] | GitHub |
| Downloads KEGG compounds orthology data and wraps the KEGGREST package to extract gene data. | omu | [103] | CRAN |
| Paired mass distance analysis to find independent peaks in m/z-retention time profiles based on retention time hierarchical cluster analysis and frequency analysis of paired mass distances within retention time groups. Structure directed analysis to find potential relationship among those independent peaks. shiny GUI included. | pmd | [104] | CRAN |
| Pre-processing (xcms), replicate merging, noise, blank and missingness filtering, feature grouping, annotation of known compounds, isotopic labeling analysis, annotation from KEGG or HMDB, common biotransformations and probabilistic putative metabolite annotation using MetAssign. | mzMatch | [82,105] | GitHub |
| Putative annotation of unknowns in MS1 data. | xMSAnnotator | [106] | SF |
2.2. Metabolite Identification with MS/MS Data
2.2.1. MS/MS Data Handling, Spectral Matching and Clustering
| Functionalities | Package | Reference | Repos |
|---|---|---|---|
| MS/MS and Libraries | |||
| Tools for processing raw data to database ready cleaned spectra with metadata. | RMassBank | [110] | BioC |
| From RT-m/z pairs (or m/z alone) creates MS/MS experiment files with non-overlapping subsets of the targets. Bruker, Agilent and Waters supported. | MetShot | [111] | GitHub |
| Creating MS libraries from LC-MS data using xcms/CAMERA packages. A multi-modular annotation function including X-Rank spectral scoring matches experimental data against the generated MS library. | MatchWeiz | [107] | GitHub |
| Assess precursor contribution to fragment spectrum acquired or anticipated isolation windows using “precursor purity” for both LC-MS(/MS) and DI-MS(/MS) data. Spectral matching against a SQLite database of library spectra. | msPurity | [112] | BioC |
| Automated quantification of metabolites by targeting mass spectral/retention time libraries into full scan-acquired GC-MS chromatograms. | baitmet | [113] | CRAN |
| MS/MS spectra similarity and unsupervised statistical methods. Workflow from raw data to visualisations and is interfaceable with xcms. | CluMSID | [114] | BioC |
| Import of spectra from different file formats such as NIST msp, mgf (mascot generic format), and library (Bruker) to MSnbase objects. | MSnio | GitHub | |
| Multi-purpose mass spectrometry package. Contains many different functions e.g., isotope pattern calculation, spectrum similarity, chromatogram plotting, reading of msp files and peptide related functions. | OrgMassSpecR | CRAN | |
| Annotation of LC-MS data based on a database of fragments. | MetaboList | [115] | CRAN |
| In Silico Fragmentation | |||
| In silico fragmentation of candidate structures. | MetFragR | [116] | GitHub |
| SOLUTIONS for High ReSOLUTION Mass Spectrometry including several functions to interact with MetFrag, developed during the SOLUTIONS project (www.solutions-project.eu). | ReSOLUTION | [116] | GitHub |
| Uses MetFrag and adds substructure prediction using the isotopic pattern. Can be trained on a custom dataset. | CCC | [117] | GitHub |
| Retention Time Correction | |||
| Retention time prediction based on compound structure descriptors. Five different machine learning algorithms are available to build models. Plotting available to explore chemical space and model quality assessment. | Retip | GitHub | |
2.2.2. Reading of Spectral Databases
2.3. NMR Data Handling and (Pre-)Processing
| Functionalities | Package | Reference | Repos |
|---|---|---|---|
| Data Pre-processing and Analysis | |||
| Interactive environment based on shiny that includes a complete set of tools to process and visualise 1D NMR spectral data using the package Rnmr1D. Processing includes baseline correction, ppm calibration, removal of solvents and contaminants and re-alignment of chemical shifts. | NMRProcFlow | [123] | Bitbucket |
| Basic processing and statistical analysis steps including several spectral quality assessment as well as pre-processing to multivariate analysis statistics functions. | MetaboMate | GitHub | |
| A tool for processing of 1H NMR data including apodisation, baseline correction, bucketing, Fourier transformation, warping and phase correction. Bruker FID can be directly imported. | PepsNMR | [137] | GitHub |
| Spectra alignment, peak picking-based processing, quantitative analysis and visualisations for 1D NMR. | speaq | [138,139] | CRAN |
| Data Analysis and Identification | |||
| I dentification and quantification of metabolites in complex 1D 1H NMR spectra. | ASICS | [140] | BioC |
| Bayesian automated metabolite analyser for 1D NMR spectra. Deconvolution of NMR spectra and automatic metabolite quantification. Also identification based on chemical shift lists. | BATMAN | [136] | RF |
| Pre-processing and identification in an R-based GUI for 1D NMR. | rDolphin | [141] | GitHub |
| Analysis of 1D and 2D NMR spectra using a ROI-based approach. Export to MMCD or uploaded to BMRB for identification. | rNMR | [142] | |
| shiny-based interactive NMR data import and Statistical TOtal Correlation SpectroscopY (STOCSY) analyses. | iSTATS | CRAN | |
| NMR and Integration with Genomics | |||
| Handles hyperspectral data, i.e., spectra plus further information such as spatial information, time, concentrations, etc. Such data are frequently encountered in Raman, IR, NIR, UV/VIS, NMR, MS, etc. | hyperSpec | CRAN | |
| MWASTools: an integrated pipeline to perform NMR-based metabolome-wide association studies (MWAS). Quality control analysis; MWAS using various models (partial correlations, generalised linear models); visualisation of statistical outcomes; metabolite assignment using STOCSY; and biological interpretation of MWAS results. | MWASTools | [143] | BioC |
| An Integrated Suite for Genetic Mapping of Quantitative Variations of 1H NMR-Based Metabolic Profiles. mQTL.NMR provides a complete metabotype quantitative trait locus (mQTL) mapping analysis pipeline for metabolomic data. | mQTL.NMR | [144] | BioC |
2.4. UV Data Handling and (Pre-)Processing
| DAD | |||
|---|---|---|---|
| Functionalities | Package | Reference | Repos |
| Multivariate Curve Resolution (Alternating Least Squares) for DAD data. | alsace | [145] | GitHub |
| Collection of baseline correction algorithms, along with a GUI for optimising baseline algorithm parameters. | baseline | CRAN | |
| Handles hyperspectral data, i.e., spectra plus further information such as spatial information, time, concentrations, etc. Such data are frequently encountered in Raman, IR, NIR, UV/VIS, NMR, MS, etc. | hyperSpec | CRAN | |
| Projection-based methods for pre-processing, exploring and analysis of multivariate data. | mdatools | CRAN | |
| Parametric Time Warping (RT correction) for both DAD and LC-MS. | ptw | [78] | CRAN |
2.5. Statistical Analysis of Metabolomics Data
| Functionalities | Package | Reference | Repos |
|---|---|---|---|
| Sample Size | |||
| Estimate sample sizes for metabolomics experiments (NMR and targeted approaches supported). | MetSizeR | [181] | CRAN |
| Normalisation | |||
| Within and between batch correction of LC-MS metabolomics data using either QC samples or all samples. | batchCorr | [182] | GitLab |
| Drift correction using QC samples or all study samples. | BatchCorrMetabolomics | [183] | GitHub |
| Cross-contribution robust multiple standard normalisation. Normalisation using internal standards. | crmn | [184] | CRAN |
| Normalisation using a singular value decomposition. | EigenMS | [185] | SF |
| Functions for drift removal and data normalisation based on component correction, median fold change, ComBat or common PCA. | intCor | [186] | |
| Normalisation for low concentration metabolites. Mixed model with simultaneous estimation of a correlation matrix. | Metabnorm | [187] | SF |
| Multiple fitting models to correct intra- and inter-batch effects. | MetaboQC | [188] | CRAN |
| Normalisation based on removing unwanted variation [189]. | MetNorm | [190] | CRAN |
| Collection of functions designed to implement, assess, and choose a suitable normalisation method for a given metabolomics study. | NormalizeMets | [191] | CRAN |
| Support Vector Regression based normalisation and integration for large-scale metabolomics data. | MetNormalizer | [192] | GitHub |
| A collection of data distribution normalisation methods. | Normalizer | [193] | |
| Signal and Batch Correction for Mass Spectrometry. | SBCMS | GitHub | |
| Exploratory Data Analysis | |||
| Chemometric analysis of NMR, IR or Raman spectroscopy data. It includes functions for spectral visualisation, peak alignment, HCA, PCA and model-based clustering. | ChemoSpec | BioC | |
| Joint analysis of MS and MS/MS data, where hierarchical cluster analysis is applied to MS/MS data to annotate metabolite families and principal component analysis is applied to MS data to discover regulated metabolite families. | MetFamily | [194] | GitHub |
| A large number of methods available for PCA. | pcaMethods | [195] | BioC |
| Univariate Hypothesis Testing 1 | |||
| Estimate tail area-based false discovery rates (FDR) as well as local false discovery rates (fdr) for a variety of null models (p-values, z-scores, correlation coefficients, t-scores). | fdrtool | [196] | CRAN |
| GUI for statistical analysis using linear mixed models to normalise data and ANOVA to test for treatment effects. | MetabR | [197] | RF |
| Many methods for corrections for multiple testing. | multtest | [198] | BioC |
| Derives stable estimates of the metabolome-wide significance level within a univariate approach based on a permutation procedure, which effectively controls the maximum overall type I error rate at the α level. | MWSL | [199] | GitHub |
| Multivariate Modeling and Feature Selection | |||
| Find Biomarkers in two class discrimination problems with variable selection methods provided for several classification methods (LASSO, Elastic Net, PC-LDA, PLS-DA, and t-test). | BioMark | [178] | CRAN |
| Recursive feature elimination approach that selects features, which significantly contribute to the performance of PLS-DA, Random Forest or SVM classifiers. | biosigner | [177] | BioC |
| General framework for building regression and classification models. | caret | [200] | CRAN |
| Linear and non-linear Discriminant Analysis methods (e.g., LDA), stepwise selection and classification methods useful for feature selection. | klaR | [201] | CRAN |
| Unsupervised feature extraction specifically designed for analysing noisy and high-dimensional datasets. | KODAMA | [202] | CRAN |
| Various additions to PCA like PPCA, PPCCA, MPPCA. | MetabolAnalyze | [203] | CRAN |
| ANOVA-simultaneous component analysis (ASCA), figure of merit, PCA, Goeman’s global test for metabolomic pathways (Q-stat), Penalised Jacobian method (for calculating network connections), time-lagged correlation method and zero slopes method. It also includes centering and scaling functions. | MetStaT | CRAN | |
| Performs variable selection in a multivariate linear model by estimating the covariance matrix of the residuals then use it to remove the dependence that may exist among the responses and eventually performs variable selection by using the Lasso criterion. | MultiVarSel | [204] | CRAN |
| Fits multi-way component models via alternating least squares algorithms with optional constraints: orthogonal, non-negative, unimodal, monotonic, periodic, smooth, or structure. Fit models include InDScal, PARAFAC, PARAFAC2, SCA, Tucker. | multiway | CRAN | |
| Predictive multivariate modelling using PLS and Random Forest Data. Repeated double cross unbiased validation and variable selection. | MUVR | [179] | GitLab |
| Probabilistic PLS-DA, Random Forest, SVM, GBM, GLMNET, PAM models for spectral data. | OmicsMarkeR | [176] | BioC |
| Performs the O2PLS data integration method for two datasets yielding joint and data-specific parts for each dataset. | OmicsPLS | [205] | CRAN |
| Package for performing Partial Least Squares regression (PLS). | pls | [206] | CRAN |
| Variable selection methods for PLS, including significance multivariate correlation, selectivity ratio, variable importance in projections (VIP), loading weights, and regression coefficients. It contains also some other modelling methods. | plsVarSel | [207] | CRAN |
| Decompose a tensor of any order, as a generalisation of SVD also supporting non-identity metrics and penalisations. 2-way SVD is also available. Also includes PCAn (Tucker-n) and PARAFAC/CANDECOMP. | PTAk | [208] | CRAN |
| Non-parametric method for identifying differentially expressed features based on the estimated percentage of false predictions. | RankProd | [209] | BioC |
| RF for the construction, optimisation and validation of classification models with the aim of identifying biomarkers. Also includes functionality for normalisation, scaling, PCA, MDS. | RFmarkerDetector | CRAN | |
| Various multivariate methods to analyse metabolomics datasets. Main methods include PCA, Partial Least Squares regression, and extensions like PLS-DA and the orthogonal variants OPLS(-DA). | ropls | [210] | BioC |
| Fits multi-way component models via alternating least squares algorithms with optional constraints. Fit models include Individual Differences Scaling, Multiway Covariates Regression, PARAFAC (1 and 2), SCA, and Tucker Factor Analysis. | ThreeWay | [211] | CRAN |
| Contains ordination methods such as ReDundancy Analysis (RDA), (Canonical or Detrended) Correspondence Analysis (CCA, DCA for binary explanatory variables), (Non-metric) MDS and other univariate and multivariate methods. Originally developed for vegetation ecologists, many functions are also applicable to metabolomics. | vegan | CRAN | |
| Biomarker validation for predicting survival. Cross validation methods to validate and select biomarkers when the outcome of interest is survival. | MetabolicSurv | CRAN | |
| Pre-treatment, classification, feature selection and correlation analyses of metabolomics data. | metabolyseR | GitHub | |
| Components search, optimal model components number search, optimal model validity test by permutation tests, observed values evaluation of optimal model parameters and predicted categories, bootstrap values evaluation of optimal model parameters and predicted cross-validated categories. | packMBPLSDA | CRAN | |
| Robust identification of time intervals are significantly different between groups. | OmicsLonDA | BioC | |
| Omics Data Integration | |||
| Identifies analyte-analyte (e.g., gene-metabolite) pairs whose relationship differs by phenotype (e.g., positive correlation in one phenotype, negative or no correlation in another). The software is also accessible as a user-friendly interface at intlim.bmi.osumc.edu. | IntLIM | [212] | GitHub |
| Statistical framework supporting many different types of multivariate analyses, e.g., PCA, CCA, (sparse)PLS(-DA). | mixOmics ggmixOmics | [213] [163] | CRAN |
| Multi-omics base classes integrable with commonly used R Bioconductor objects for omics data; container that holds omics results. | MultiDataSet | [214] | BioC |
| Multiple co-inertia analysis of omics datasets (MCIA) is a multivariate approach for visualisation and integration of multi-omics datasets. The MCIA method is not dependent on feature annotation therefore it can extract important features even when they are not present across all datasets. | omicade4 | [215] | BioC |
| STATegRa combines information in multiple omics datasets to evaluate the reproducibility among samples and across experimental conditions using component analysis (omicsNPC implements the NonParametric Combination) and clustering. | STATegRa STATegra-EMS | [216] | BioC |
| STatistics in R Using Class Templates—Classes for building statistical workflows using methods, models and validation objects. | STRUCT | GitHub | |
| Integration of omics data using multivariate methods such as PLS. Performs community detection and network analysis to allow visualisation of positive or negative associations between different datasets generated using samples from the same individuals. Also available as a shiny app (https://kuppal.shinyapps.io/xmwas). | xMWAS | [217] | GitHub |
| Joint metabolic model-based analysis of metabolomics measurements and taxonomic composition from microbial communities. | MIMOSA | [218] | GitHub |
| Missing Value Imputation | |||
| Mixture-model for accounting for data missingness’. | metabomxtr | [219] | BioC |
| Kernel-Based Metabolite Differential Analysis provides a kernel-based score test to cluster metabolites between treatment groups, in order to handle missing values. | KMDA | [220] | CRAN |
| Visualisation and imputation of missing values. VIM provides methods for the evaluation and visualisation of the type and patterns of missing data. The included imputation approaches are kNN, Hot-Deck, iterative robust model-based imputation, fast matching/imputation based on categorical variables and regression imputation. | VIM | [221] | CRAN |
| GUI for VIM. | VIMGUI | CRAN | |
| kNN-based imputation for microarray data. | impute | [222] | BioC |
| Bootstrap-based algorithm and diagnostics for fast and robust multiple imputation for cross sectional, time series or combined cross sectional and time series data. | Amelia | [223] | CRAN |
| Algorithms and diagnostics for the univariate imputation of time series data. | imputeTS | [224] | CRAN |
| Methods for the Imputation of incomplete continuous or categorical datasets. missMDA allows missing data imputation using in categorial, continuous or mixed-type datasets using PCA, CA, a multiple correspondence analysis (MCA) model, a multiple factor analysis (MFA) model or factorial analysis for mixed data. | missMDA | [225] | CRAN |
| Random forest-based missing data imputation for mixed-type, nonparametric data. An out-of-bag (OOB) error estimate is used for model optimisation. | missForest | [226] | CRAN |
| Multivariate imputation by chained equations using fully conditional specifications for categorical, continuous and binary datasets. It includes various diagnostic plots for the evaluation of the imputation quality. | mice | [227] | CRAN |
| Missing data imputation using an approximate Bayesian framework. Diagnostic algorithms are included to analyse the models, the assumptions of the imputation algorithm and the multiply imputed datasets. | mi | [228] | CRAN |
| Iterative Gibbs sampler-based left-censored missing value imputation. | GSimp | [229] | GitHub |
| Multiple Workflow Steps | |||
| Missing value imputation, filtering, normalisation and averaging of technical replications. | MSPrep | [230] | SF |
| HCA, Fold change analysis, heat maps, linear models (ordinary and empirical Bayes), PCA and volcano plots. Also includes functionality for log transformation, missing value replacement and methods for normalisation. Cross-contribution compensating multiple internal standard normalisation and remove unwanted variation. | metabolomics | [231] | CRAN |
| Data processing, normalisation, statistical analysis, metabolite set enrichment analysis, metabolic pathway analysis, and biomarker analysis. | MetaboAnalystR | [232,233] | GitHub |
| Pipeline for metabolomics data pre-processing, with particular focus on data representation using univariate and multivariate statistics. Built on already published functions. | muma | [234] | GitHub |
| Framework for multi-omics experiments. Identifies sources of variability in the experiment and performs additional analysis (identification of subgroups, data imputation, outlier detection). | MOFA | [235] | BioC |
| Performs entry-level differential analysis on metabolomics data. | MetaboDiff | [236] | GitHub |
| STRUCT wrappers (see above) for filtering, normalisation, missing value imputation, glog transform, HCA, PCA, PLS-DA, PLSR, t-test, fold-change, ANOVA, Mixed Effects and post-hoc tests. | STRUCTToolbox | GitHub | |
| Data transformation, filtering of feature and/or samples and data normalisation. Quality control processing, statistical analysis and visualisation of MS data. | pmartR | GitHub | |
| Quality control, signal drift and batch correction, transformation, univariate hypothesis testing. | phenomis | GitHub | |
| Missing value filtering and imputation, zero value filtering, data normalisation, data integration, data quality assessment, univariate statistical analysis, multivariate statistical analysis such as PCA and PLS-DA and potential marker selection. | MetCleaning | GitHub | |
| Univariate analysis (linear model), PCA, clustered heatmap, and partial correlation network analysis. Based on classes from the Metabase package [36]. | ShinyMetabase | GitHub | |
| Outlier detection, PCA, drift correction, visualisation, missing value imputation, classification. | MetabolomicsBasics | [237] | CRAN |
| Pre-processing, differential compound identification and grouping, pharmacokinetic parameter calculation, multivariate statistical analysis, correlations, cluster analyses and visualisation. | polyPK | [238] | CRAN |
2.6. Handling of Molecule Structures and Chemical Structure Databases
| Structure Representation and Manipulation | |||
|---|---|---|---|
| Functionalities | Package | Reference | Repos |
| Subset of functions from the Chemistry Development Kit. Provide a computer readable representation of molecular structures and provide functions to import structures from different molecule structure description formats, manipulate structures, visualise structures and calculate properties and molecular fingerprints. | rcdk | [252] | CRAN |
| Similar to rcdk in functionality and provides more fingerprints and clustering methods and provides additional tools through querying the ChemMine Tools web service. | ChemmineR | [253] | BioC |
| Provides conversion of structure representation through OpenBabel. | ChemmineOB | BioC | |
| Exposes functionalities of the RDKit library, including reading and writing of SF files and calculating a few physicochemical properties. | RRDKit | GitHub | |
| Read and write InChI and InChIKey from and to rcdk. | rinchi | GitHub | |
| Maximum Common Substructure Searching using ChemmineR structures. | FmcsR | [254] | BioC |
| Basic cheminformatics functions tailored for mass spectrometry applications, enhancing functionality available in other packages like rcdk, enviPat, RMassBank etc. | RChemMass | GitHub | |
| Provides fingerprinting methods for rcdk. | fingerprint | CRAN | |
| Database Queries | |||
| Calculation of molecular properties. | camb | [255] | GitHub |
| Querying information from PubChem. | Rpubchem | CRAN | |
| Querying information from various web services (CACTUS, CTS, PubChem, ChemSpider) as part of compound list generation. | RMassBank | [110] | BioC |
| Querying information from a large number of databases. | webchem | [256] | CRAN |
| R Interface to the ClassyFire REST API. | classyfireR | CRAN | |
| Allows mapping of identifiers from one database to another, for metabolites, genes, proteins, and interactions. | BridgeDbR | BioC | |
| Define utilities for exploration of human metabolome database, including functions to retrieve specific metabolite entries and data snapshots with pairwise associations. | hmdbQuery | BioC | |
| Parsers for many compound databases including HMDB, MetaCyc, ChEBI, FooDB, Wikidata, WikiPathways, RIKEN respect, MaConDa, T3DB, KEGG, Drugbank, LipidMaps, MetaboLights, Phenol-Explorer, MassBank. | MetaDBparse | GitHub | |
| Functionality to create and use compound databases generated from (mostly publicly) available resources such as HMDB, ChEBI and PubChem. | CompoundDb | GitHub | |
| Standardised and extensible framework to query chemical and biological databases. | biodb | GitHub | |
2.7. Network Analysis and Biochemical Pathways
2.7.1. Network Infrastructure and Analysis
2.7.2. Metabolite Annotation
2.7.3. Generation of Metabolic Networks
2.7.4. Pathway Analysis
2.7.5. Pathway Resources and Interfaces
| Functionalities | Package | Reference | Repos |
|---|---|---|---|
| Network Infrastructure and Analysis | |||
| Infrastructure for representation of networks, analysis and visualisation. | igraph | [271] | CRAN |
| Infrastructure for representation of networks, analysis and visualisation. | tidygraph | CRAN | |
| Infrastructure for representation of networks, analysis and visualisation. | statnet | CRAN | |
| Interactive visualisation and manipulation of networks. | RedeR | [272] | BioC |
| Comparison of correlation networks from two experiments. | DiffCorr | [273] | CRAN |
| Correlation-based networks from metabolomics data and analysis tools. | BioNetStat | BioC | |
| Annotation | |||
| Putative annotation of unknowns in MS1 data. | MetNet | [274] | BioC |
| Putative annotation of unknowns in MS1 data. | xMSAnnotator | [106] | SF |
| Putative annotation of unknowns using MS1 and MS/MS data. | MetDNA | [264] | GitHub |
| Visualisation of spectral similarity networks, putative annotation of unknowns using MS/MS data. | MetCirc | [95] | BioC |
| Putative annotation of unknowns using MS/MS data, clustering of MS/MS data. | CluMSID | [114] | BioC |
| Putative annotation of unknowns using MS/MS data. | compMS2Miner | [98] | GitHub |
| Generation of Metabolite Networks | |||
| Biochemical reaction networks, spectral and structural similarity networks. | MetaMapR | [275] | GitHub |
| Correlation-based networks, structural similarity networks. | Metabox | [276] | GitHub |
| Targeted metabolome-wide association studies. | MetabNet | [277] | SF |
| Generation of scale-free correlation-based networks. | WGCNA | [278] | CRAN |
| Pathway Analysis | |||
| Analysis of -omics data, pathway, transcription factor and target gene identification. | pwOmics | [279] | BioC |
| MSEA a metabolite set enrichment analysis with factor loading in principal component analysis. | mseapca | [280] | CRAN |
| Enrichment analysis of a list of affected metabolites. | tmod | CRAN | |
| Network-based enrichment analysis of a list of affected metabolites. | FELLA | [281] | BioC |
| Pathway-based enrichment analysis of a list of affected metabolites. | CePa | [282] | CRAN |
| Differential analysis, modules/sub-pathway identification using networks. | MetaboDiff | [236] | GitHub |
| Integrates metabolic networks and RNA-seq data to construct condition-specific series of metabolic sub-networks and applies to gene set enrichment analysis | metaboGSE | [283] | CRAN |
| Differential analysis. | SDAMS | BioC | |
| Biomarker identification. | lilikoi | [284] | CRAN |
| Biomarker identification. | INDEED | [285] | BioC |
| Biomarker identification. | MoDentify | [286] | GitHub |
| Pathway activity profiling. | PAPi | [287] | BioC |
| Pathway activity profiling. | pathwayPCA | [288] | BioC |
| Flux balance analysis. | BiGGR | [289] | BioC |
| Flux balance analysis. | abcdeFBA | CRAN | |
| Flux balance analysis. | sybil | CRAN | |
| Flux balance analysis. | fbar | CRAN | |
| Identification of affected pathway from phenotype data (interface with graphite). | SPIA | [290] | BioC |
| Identification of affected pathway from phenotype data (interface with graphite). | clipper | BioC | |
| Interface to PathVisio and WikiPathways and pathway analysis and enrichment. | RPathVisio | [291] | GitHub |
| Enrichment analysis of a list of genes and metabolites. | RaMP | [292] | GitHub |
| Simulation of longitudinal metabolomics data based on an underlying biological network | MetaboLouise | CRAN | |
| Pathway Resources and Interfaces | |||
| BioPax parser and representation in R. | rBiopaxParser | [293] | BioC |
| Interface to KEGG, Biocarta, Reactome, NCI/Nature Pathway Interaction Database, HumanCyc, Panther, SMPDB and PharmGKB. | graphite | [294,295] | BioC |
| Interface to NCI Pathways Database. | NCIgraph | BioC | |
| Interface to KEGG. | pathview | [296] | BioC |
| Interface to KEGG. | KEGGgraph | [297] | BioC |
| Interface to systems biology markup language (SBML). | SBMLR | BioC | |
| Interface to systems biology markup language (SBML). | rsbml | BioC | |
| Interface to Gaggle-enabled software (Cytoscape, Firegoose, Gaggle Genome browser). | gaggle | BioC | |
| Interface to molecular interaction databases. | PSICQUIC | BioC | |
| Interface to KEGG REST server. | KEGGREST | BioC | |
| Interface to BioPAX OWL files and the Pathway Commons (PW) molecular interaction database. | paxtoolsr | [298] | BioC |
| Interface to WikiPathways. | rWikiPathways | [299] | BioC |
| Database that integrates metabolite and gene biological pathways from HMDB, KEGG, Reactome, and WikiPathways. Includes user-friendly R shiny web application for queries and pathway enrichment analysis. | RaMP-DB | [292] | GitHub |
2.8. Multifunctional Workflows
| Functionalities | Package | Reference | Repos |
|---|---|---|---|
| Convenience wrapper for pre-processing tools (xcms, CAMERA) and several statistical analyses. | MAIT | [302] | BioC |
| Pre-processing (xcms), replicate merging, noise, blank and missingness filtering, feature grouping, annotation of known compounds, isotopic labeling analysis, annotation from KEGG or HMDB, common biotransformations and probabilistic putative metabolite annotation using MetAssign. | mzMatch | [82,105] | GitHub |
| xcms and CAMERA-based workflow for non-targeted processing of LC-MS datasets. It includes pre-processing, peak picking, peak filtering, data normalisation and descriptive statistics calculation. | MStractor | GitHub | |
| Performs simultaneous raw data to mzXML conversion (MSConvert), peak picking, automatic PCA outlier detection and statistical analysis, visualisation and possible MS/MS target list determination during an MS1 metabolomic profiling experiment. | simExTargId | [303] | GitHub |
| Pre-processing of large LC-MS datasets. Performs automatic PCA with iterative automatic outlier removal and, clustering analysis and biomarker discovery. | MetMSLine | [304] | GitHub |
| Workflow for the systematic analysis of 1H NMR metabolomics dataset in quantitative genetics. Performs pre-processing, mQTL mapping, metabolites structural assignment and offers data visualisation tools. | mQTL.NMR | [144] | BioC |
| Workflow for pre-processing, quality control, annotation and statistical data analysis of LC-MS and GC-MS-based metabolomics data to be submitted to public repositories. | MetaDB | [305] | GitHub |
| Framework mainly built on several already published packages. It supports data processing form different analytical platforms (LC-MS, GC-MS, NMR, IR, UV-Vis). | specmine | [306] | GitHub |
| Common interface for several different MS-based data processing software. It covers various aspects, such as data preparation and data extraction, formula calculation, compound identification and reporting. | patRoon | GitHub | |
| Processing of high resolution of LC-MS data for environmental trend analysis. | enviMass | Zenodo | |
| Workflow for pre-processing of LC-HRMS data, suspect screening, screening for transformation products using combinatorial prediction, and interactive filtering based on ratios between sample groups. | RMassScreening | [307,308] | GitHub |
| Workflow to perform pre-processing, statistical analysis and metabolite identifications based on database search of detected spectra. | MetaboNexus | [309] | GitHub |
| shiny-based platform to extract differential features from LC-MS data, includes xcms-based feature detection, statistical analysis, prediction of molecular formulas, annotation of MS/MS spectra, MS/MS molecular networking and chemical compound database search. | METABOseek | GitHub | |
| shiny interface to Metabolomics packages and MetaboAnalyst scripts. | MetaboShiny | [310] | GitHub |
| Pre-processing and visualising LC-MS data, as well as statistical analyses, mainly based on univariate linear models. | amp | GitHub |
2.9. User Interfaces and Workflow Management Systems
| Framework | Implementation Simplicity Low to High | User- Friendliness Low to High | Interactivity | Example URLs |
|---|---|---|---|---|
| R script | ++ | -- | - | write.mzTab |
| R Markdown vignette | o | o | -- | xcms, patRoon |
| Jupyter Notebook | o | + | + | MSEAp |
| LearnR (CRAN) | - | ++ | + | LearnR Examples |
| shiny app | -- | ++ | ++ | MetFamily and apps in e.g., RaMP-DB, IntLIM |
| Functionalities | Package | Reference | Repos |
|---|---|---|---|
| Given an R function and its manual page, make the documented function available in Galaxy. | RGalaxy | BioC | |
| Integration of R and C++. Many R data types and objects can be mapped back and forth to C++ equivalents. | Rcpp | [325] | CRAN |
| Low-Level R to Java Interface. | rJava | CRAN | |
| Interface to ‘Python’ modules, classes, and functions and translation between R and Python objects. | reticulate | CRAN |
2.10. Metabolomics Data Sets
| Content | Package | Reference | Repos |
|---|---|---|---|
| LC-MS | |||
| 12 HPLC-MS NetCDF files (Agilent 1100 LC-MSD SL). | faahKO | [328] | BioC |
| 16 UPLC-MS mzData files (Bruker microTOFq). | mtbls2 | [111] | BioC |
| 12 UPLC-MS mzML files (AB Sciex TripleTOF 5600, SWATH mode). | mtbls297 | [329] | GitHub |
| Different raw MS files (LTQ, TripleQ, FTICR, Orbitrap, QTOF) some in different formats (mzML, mzXML, mzData, mzData.gz, NetCDF, mz5). Also mzid format from proteomics. | msdata | BioC | |
| Metadata and DDA MS/MS spectra of 15 narcotics standards (LTQ Orbitrap XL). | RMassBankData | [110] | BioC |
| 183 × 109 peak table. | ropls | [210] | BioC |
| 69 × 5501 peak table. | biosigner | [177] | BioC |
| 40 × 1632 peak table. | BioMark | [178] | CRAN |
| Raw MS files from a set of blanks and standards that contain common environmental contaminants (acquired with Bruker maXis 4G). | patRoonData | GitHub | |
| Proteomics, metabolomics GC-MS and Lipidomics data from Calu-3 cell culture; 3 mockulum treated and 9 MERS-CoV treated; Time point, 18 h from MassIVE dataset ids MSV000079152, MSV000079153, MSV000079154. | pmartRdata | GitHub | |
| FIA-MS | |||
| 6 mzML files (human plasma spiked with 40 compounds acquired in positive mode on an orbitrap fusion). | plasFIA | BioC | |
| mzML files (Thermo Exactive) from comparison of leaf tissue from 4 B. distachyon ecotypes with Flow-infusion electrospray ionisation-high resolution mass spectrometry (FIE-HRMS). Also includes data sets with 10 technical injections of human urine and another 10 injections from leaf tissue (ecotype ABR1). | metaboData | GitHub | |
| GC-MS | |||
| 52 × 154 peak table. | pcaMethods | [195] | BioC |
| NMR | |||
| 18 × 189 peak table. | MetabolAnalyze | CRAN | |
| 33 × 164 peak table. | MetabolAnalyze | CRAN | |
| ASICSdata: 1D NMR spectra for ASICS. | ASICSdata | [140] | BioC |
3. Conclusions
Supplementary Materials
Author Contributions
Acknowledgments
Conflicts of Interest
Disclaimer
References
- Emwas, A.-H.; Roy, R.; McKay, R.T.; Tenori, L.; Saccenti, E.; Gowda, G.A.N.; Raftery, D.; Alahmari, F.; Jaremko, L.; Jaremko, M.; et al. NMR spectroscopy for metabolomics research. Metabolites 2019, 9, 123. [Google Scholar] [CrossRef] [PubMed]
- Wehrens, R.; Salek, R. Metabolomics: Practical Guide to Design and Analysis; Chapman & Hall/CRC Mathematical and Computational Biology: Boca Raton, FL, USA, 2019. [Google Scholar]
- Lämmerhofer, M.; Weckwerth, W. Metabolomics in Practice: Successful Strategies to Generate and Analyze Metabolic Data; Wiley-VCH Verlag GmbH & Co. KGaA: Weinheim, Germany, 2013. [Google Scholar]
- Villas-Boas, S.G.; Nielsen, J.; Smedsgaard, J.; Hansen, M.A.E.; Roessner-Tunali, U. Metabolome Analysis: An Introduction, 1st ed.; Wiley, John & Sons: Hoboken, NJ, USA, 2007; p. 319. [Google Scholar]
- Salek, R.; Emery, L.; Beisken, S. Metabolomics: An Introduction | EMBL-EBI Train Online. Available online: https://www.ebi.ac.uk/training/online/course/introduction-metabolomics (accessed on 8 September 2019).
- International Metabolomics Society Category: Free Tools & Learning Resources—Metabolomics Society Wiki. Available online: http://wiki.metabolomicssociety.org/index.php/Category:Free_Tools_%26_Learning_Resources (accessed on 8 September 2019).
- R Core Development Team. R: A Language and Environment for Statistical Computing. Available online: https://www.R-project.org (accessed on 6 August 2019).
- Spicer, R. GitHub—RASpicer/MetabolomicsTools. Available online: https://github.com/RASpicer/MetabolomicsTools (accessed on 10 July 2019).
- Spicer, R.; Salek, R.M.; Moreno, P.; Cañueto, D.; Steinbeck, C. Navigating freely-available software tools for metabolomics analysis. Metabolomics 2017, 13, 106. [Google Scholar] [CrossRef] [PubMed]
- Misra, B.B.; van der Hooft, J.J.J. Updates in metabolomics tools and resources: 2014–2015. Electrophoresis 2016, 37, 86–110. [Google Scholar] [CrossRef] [PubMed]
- Misra, B.B.; Fahrmann, J.F.; Grapov, D. Review of emerging metabolomic tools and resources: 2015–2016. Electrophoresis 2017, 38, 2257–2274. [Google Scholar] [CrossRef] [PubMed]
- Misra, B.B. New tools and resources in metabolomics: 2016–2017. Electrophoresis 2018, 39, 909–923. [Google Scholar] [CrossRef] [PubMed]
- Misra, B. GitHub—Biswapriyamisra/Metabolomics: Tools Databases Resources in Metabolomics & Integrated Omics in 2015–2016. Available online: https://github.com/biswapriyamisra/metabolomics (accessed on 10 July 2019).
- Kannan, L.; Ramos, M.; Re, A.; El-Hachem, N.; Safikhani, Z.; Gendoo, D.M.A.; Davis, S.; Gomez-Cabrero, D.; Castelo, R.; Hansen, K.D.; et al. Public data and open source tools for multi-assay genomic investigation of disease. Brief. Bioinform. 2016, 17, 603–615. [Google Scholar] [CrossRef] [PubMed]
- Blaženović, I.; Kind, T.; Ji, J.; Fiehn, O. Software Tools and Approaches for Compound Identification of LC-MS/MS Data in Metabolomics. Metabolites 2018, 8, 31. [Google Scholar] [CrossRef] [PubMed]
- Mullen, K. CRAN Task View: Chemometrics and Computational Physics. Available online: https://cran.r-project.org/view=ChemPhys (accessed on 10 July 2019).
- Gentleman, R.C.; Carey, V.J.; Bates, D.M.; Bolstad, B.; Dettling, M.; Dudoit, S.; Ellis, B.; Gautier, L.; Ge, Y.; Gentry, J.; et al. Bioconductor: Open software development for computational biology and bioinformatics. Genome Biol. 2004, 5, R80. [Google Scholar] [CrossRef]
- Bioconductor Bioconductor—BiocViews. Available online: http://bioconductor.org/packages/release/BiocViews.html#___Workflow (accessed on 10 July 2019).
- The Comprehensive R Archive Network CRAN Repository Policy. Available online: https://cran.r-project.org/web/packages/policies.html (accessed on 10 July 2019).
- Bioconductor Bioconductor—Developers. Available online: http://bioconductor.org/developers/ (accessed on 10 July 2019).
- Theußl, S.; Zeileis, A. Collaborative Software Development Using R-Forge. R J. 2009, 1, 9. [Google Scholar] [CrossRef]
- Boettiger, C.; Chamberlain, S.; Hart, E.; Ram, K. Building Software, Building Community: Lessons from the rOpenSci Project. J. Open Res. Softw. 2015, 3. [Google Scholar] [CrossRef]
- De Vries, A.; Rickert, J. The Network Structure of R Packages on CRAN & BioConductor. Available online: https://www.slideshare.net/RevolutionAnalytics/jsm-r-pkgs-2015-0809 (accessed on 10 July 2019).
- de Vries, A. Differences in the Network Structure of CRAN and BioConductor (Revolutions). Available online: https://blog.revolutionanalytics.com/2015/08/differences-in-the-network-structure-of-cran-and-bioconductor.html (accessed on 10 July 2019).
- De Vries, A. GitHub—Andrie/Cran-Network-Structure: Scripts Used for My UseR!2015 Presentation on the Network Structure of CRAN. Available online: https://github.com/andrie/cran-network-structure (accessed on 10 July 2019).
- Neumann, S. GitHub—Sneumann/Metarbolomics: Metabolomics in R and Bioconductor. Available online: http://github.com/sneumann/metaRbolomics (accessed on 10 July 2019).
- Chambers, M.C.; Maclean, B.; Burke, R.; Amodei, D.; Ruderman, D.L.; Neumann, S.; Gatto, L.; Fischer, B.; Pratt, B.; Egertson, J.; et al. A cross-platform toolkit for mass spectrometry and proteomics. Nat. Biotechnol. 2012, 30, 918–920. [Google Scholar] [CrossRef] [PubMed]
- Kessner, D.; Chambers, M.; Burke, R.; Agus, D.; Mallick, P. ProteoWizard: Open source software for rapid proteomics tools development. Bioinformatics 2008, 24, 2534–2536. [Google Scholar] [CrossRef] [PubMed]
- Fuhrer, T.; Heer, D.; Begemann, B.; Zamboni, N. High-throughput, accurate mass metabolome profiling of cellular extracts by flow injection-time-of-flight mass spectrometry. Anal. Chem. 2011, 83, 7074–7080. [Google Scholar] [CrossRef] [PubMed]
- Mahieu, N.G.; Genenbacher, J.L.; Patti, G.J. A roadmap for the XCMS family of software solutions in metabolomics. Curr. Opin. Chem. Biol. 2016, 30, 87–93. [Google Scholar] [CrossRef] [PubMed]
- Smith, C.A.; Want, E.J.; O’Maille, G.; Abagyan, R.; Siuzdak, G. XCMS: Processing mass spectrometry data for metabolite profiling using nonlinear peak alignment, matching, and identification. Anal. Chem. 2006, 78, 779–787. [Google Scholar] [CrossRef] [PubMed]
- Tautenhahn, R.; Böttcher, C.; Neumann, S. Highly sensitive feature detection for high resolution LC/MS. BMC Bioinform. 2008, 9, 504. [Google Scholar] [CrossRef] [PubMed]
- Conley, C.J.; Smith, R.; Torgrip, R.J.O.; Taylor, R.M.; Tautenhahn, R.; Prince, J.T. Massifquant: Open-source Kalman filter-based XC-MS isotope trace feature detection. Bioinformatics 2014, 30, 2636–2643. [Google Scholar] [CrossRef]
- Huber, W.; Carey, V.J.; Gentleman, R.; Anders, S.; Carlson, M.; Carvalho, B.S.; Bravo, H.C.; Davis, S.; Gatto, L.; Girke, T.; et al. Orchestrating high-throughput genomic analysis with Bioconductor. Nat. Methods 2015, 12, 115–121. [Google Scholar] [CrossRef]
- Martin Morgan, V.O. SummarizedExperiment. Bioconductor 2017. [Google Scholar] [CrossRef]
- Zhu, C. Zhuchcn/Metabase: A R Package to Store, Manipulate, Analyze, and Visualize Metabolomics Data. Available online: https://github.com/zhuchcn/Metabase (accessed on 4 September 2019).
- Hoffmann, N.; Rein, J.; Sachsenberg, T.; Hartler, J.; Haug, K.; Mayer, G.; Alka, O.; Dayalan, S.; Pearce, J.T.M.; Rocca-Serra, P.; et al. mzTab-M: A Data Standard for Sharing Quantitative Results in Mass Spectrometry Metabolomics. Anal. Chem. 2019, 91, 3302–3310. [Google Scholar] [CrossRef] [Green Version]
- Gatto, L.; Lilley, K.S. MSnbase-an R/Bioconductor package for isobaric tagged mass spectrometry data visualization, processing and quantitation. Bioinformatics 2012, 28, 288–289. [Google Scholar] [CrossRef] [PubMed]
- Libiseller, G.; Dvorzak, M.; Kleb, U.; Gander, E.; Eisenberg, T.; Madeo, F.; Neumann, S.; Trausinger, G.; Sinner, F.; Pieber, T.; et al. IPO: A tool for automated optimization of XCMS parameters. BMC Bioinform. 2015, 16, 118. [Google Scholar] [CrossRef] [PubMed]
- Myint, L.; Kleensang, A.; Zhao, L.; Hartung, T.; Hansen, K.D. Joint Bounding of Peaks Across Samples Improves Differential Analysis in Mass Spectrometry-Based Metabolomics. Anal. Chem. 2017, 89, 3517–3523. [Google Scholar] [CrossRef] [PubMed]
- Uppal, K.; Soltow, Q.A.; Strobel, F.H.; Pittard, W.S.; Gernert, K.M.; Yu, T.; Jones, D.P. xMSanalyzer: Automated pipeline for improved feature detection and downstream analysis of large-scale, non-targeted metabolomics data. BMC Bioinform. 2013, 14, 15. [Google Scholar] [CrossRef] [PubMed]
- Yu, T.; Jones, D.P. Improving peak detection in high-resolution LC/MS metabolomics data using preexisting knowledge and machine learning approach. Bioinformatics 2014, 30, 2941–2948. [Google Scholar] [CrossRef] [PubMed] [Green Version]
- Mahieu, N.G.; Spalding, J.L.; Patti, G.J. Warpgroup: Increased precision of metabolomic data processing by consensus integration bound analysis. Bioinformatics 2016, 32, 268–275. [Google Scholar] [CrossRef] [PubMed]
- Takahashi, H.; Morimoto, T.; Ogasawara, N.; Kanaya, S. AMDORAP: Non-targeted metabolic profiling based on high-resolution LC-MS. BMC Bioinform. 2011, 12, 259. [Google Scholar] [CrossRef]
- Yu, M.; Hou, X.; Liu, Q.; Wang, Y.; Liu, J.; Jiang, G. Evaluation and reduction of the analytical uncertainties in GC-MS analysis using a boundary regression model. Talanta 2017, 164, 141–147. [Google Scholar] [CrossRef]
- Capellades, J.; Navarro, M.; Samino, S.; Garcia-Ramirez, M.; Hernandez, C.; Simo, R.; Vinaixa, M.; Yanes, O. geoRge: A Computational Tool To Detect the Presence of Stable Isotope Labeling in LC/MS-Based Untargeted Metabolomics. Anal. Chem. 2016, 88, 621–628. [Google Scholar] [CrossRef] [PubMed]
- Heinrich, P.; Kohler, C.; Ellmann, L.; Kuerner, P.; Spang, R.; Oefner, P.J.; Dettmer, K. Correcting for natural isotope abundance and tracer impurity in MS-, MS/MS- and high-resolution-multiple-tracer-data from stable isotope labeling experiments with IsoCorrectoR. Sci. Rep. 2018, 8, 17910. [Google Scholar] [CrossRef]
- Huang, X.; Chen, Y.-J.; Cho, K.; Nikolskiy, I.; Crawford, P.A.; Patti, G.J. X13CMS: Global tracking of isotopic labels in untargeted metabolomics. Anal. Chem. 2014, 86, 1632–1639. [Google Scholar] [CrossRef] [PubMed]
- Ferrazza, R.; Griffin, J.L.; Guella, G.; Franceschi, P. IsotopicLabelling: An R package for the analysis of MS isotopic patterns of labelled analytes. Bioinformatics 2017, 33, 300–302. [Google Scholar] [CrossRef] [PubMed]
- Feldberg, L.; Dong, Y.; Heinig, U.; Rogachev, I.; Aharoni, A. DLEMMA-MS-Imaging for Identification of Spatially Localized Metabolites and Metabolic Network Map Reconstruction. Anal. Chem. 2018, 90, 10231–10238. [Google Scholar] [CrossRef] [PubMed]
- Dong, Y.; Feldberg, L.; Aharoni, A. Miso: An R package for multiple isotope labeling assisted metabolomics data analysis. Bioinformatics 2019. [Google Scholar] [CrossRef] [PubMed]
- Cuadros-Inostroza, A.; Caldana, C.; Redestig, H.; Kusano, M.; Lisec, J.; Peña-Cortés, H.; Willmitzer, L.; Hannah, M.A. TargetSearch--a Bioconductor package for the efficient preprocessing of GC-MS metabolite profiling data. BMC Bioinform. 2009, 10, 428. [Google Scholar] [CrossRef] [PubMed]
- Ranjbar, M.R.N.; Di Poto, C.; Wang, Y.; Ressom, H.W. SIMAT: GC-SIM-MS data analysis tool. BMC Bioinform. 2015, 16, 259. [Google Scholar]
- Zha, H.; Cai, Y.; Yin, Y.; Wang, Z.; Li, K.; Zhu, Z.-J. SWATHtoMRM: Development of High-Coverage Targeted Metabolomics Method Using SWATH Technology for Biomarker Discovery. Anal. Chem. 2018, 90, 4062–4070. [Google Scholar] [CrossRef] [PubMed]
- Cai, Y.; Weng, K.; Guo, Y.; Peng, J.; Zhu, Z.-J. An integrated targeted metabolomic platform for high-throughput metabolite profiling and automated data processing. Metabolomics 2015, 11, 1575–1586. [Google Scholar] [CrossRef]
- Wills, J.; Edwards-Hicks, J.; Finch, A.J. Assayr: A simple mass spectrometry software tool for targeted metabolic and stable isotope tracer analyses. Anal. Chem. 2017, 89, 9616–9619. [Google Scholar] [CrossRef]
- Yin, Y.; Wang, R.; Cai, Y.; Wang, Z.; Zhu, Z.-J. DecoMetDIA: Deconvolution of Multiplexed MS/MS Spectra for Metabolite Identification in SWATH-MS based Untargeted Metabolomics. Anal. Chem. 2019. [Google Scholar] [CrossRef]
- Askenazi, M.; Linial, M. ARISTO: Ontological classification of small molecules by electron ionization-mass spectrometry. Nucleic Acids Res. 2011, 39, W505–W510. [Google Scholar] [CrossRef] [PubMed]
- Nicolè, F.; Guitton, Y.; Courtois, E.A.; Moja, S.; Legendre, L.; Hossaert-McKey, M. MSeasy: Unsupervised and untargeted GC-MS data processing. Bioinformatics 2012, 28, 2278–2280. [Google Scholar] [CrossRef] [PubMed]
- Domingo-Almenara, X.; Brezmes, J.; Vinaixa, M.; Samino, S.; Ramirez, N.; Ramon-Krauel, M.; Lerin, C.; Díaz, M.; Ibáñez, L.; Correig, X.; et al. eRah: A Computational Tool Integrating Spectral Deconvolution and Alignment with Quantification and Identification of Metabolites in GC/MS-Based Metabolomics. Anal. Chem. 2016, 88, 9821–9829. [Google Scholar] [CrossRef] [PubMed]
- Meyer, M.R.; Peters, F.T.; Maurer, H.H. Automated mass spectral deconvolution and identification system for GC-MS screening for drugs, poisons, and metabolites in urine. Clin. Chem. 2010, 56, 575–584. [Google Scholar] [CrossRef] [PubMed]
- The National Institute of Standards and Technology AMDIS Download. Available online: https://chemdata.nist.gov/dokuwiki/doku.php?id=chemdata:downloads:start#amdis (accessed on 1 August 2019).
- Aggio, R.; Villas-Bôas, S.G.; Ruggiero, K. Metab: An R package for high-throughput analysis of metabolomics data generated by GC-MS. Bioinformatics 2011, 27, 2316–2318. [Google Scholar] [CrossRef] [PubMed]
- Domingo-Almenara, X.; Perera, A.; Ramírez, N.; Cañellas, N.; Correig, X.; Brezmes, J. Compound identification in gas chromatography/mass spectrometry-based metabolomics by blind source separation. J. Chromatogr. A 2015, 1409, 226–233. [Google Scholar] [CrossRef] [PubMed] [Green Version]
- Domingo-Almenara, X.; Perera, A.; Ramírez, N.; Brezmes, J. Automated resolution of chromatographic signals by independent component analysis-orthogonal signal deconvolution in comprehensive gas chromatography/mass spectrometry-based metabolomics. Comput. Methods Programs Biomed. 2016, 130, 135–141. [Google Scholar] [CrossRef]
- Lisec, J.; Hoffmann, F.; Schmitt, C.; Jaeger, C. Extending the dynamic range in metabolomics experiments by automatic correction of peaks exceeding the detection limit. Anal. Chem. 2016, 88, 7487–7492. [Google Scholar] [CrossRef]
- Ottensmann, M.; Stoffel, M.A.; Nichols, H.J.; Hoffman, J.I. GCalignR: An R package for aligning gas-chromatography data for ecological and evolutionary studies. PLoS ONE 2018, 13, e0198311. [Google Scholar] [CrossRef]
- Wehrens, R.; Weingart, G.; Mattivi, F. metaMS: An open-source pipeline for GC-MS-based untargeted metabolomics. J. Chromatogr. B Anal. Technol. Biomed. Life Sci. 2014, 966, 109–116. [Google Scholar] [CrossRef]
- Kim, S.; Ouyang, M.; Jeong, J.; Shen, C.; Zhang, X. A new method of peak detection for analysis of comprehensive two-dimensional gas chromatography mass spectrometry data. Ann. Appl. Stat. 2014, 8, 1209–1231. [Google Scholar] [CrossRef] [PubMed] [Green Version]
- Kim, S.; Fang, A.; Wang, B.; Jeong, J.; Zhang, X. An optimal peak alignment for comprehensive two-dimensional gas chromatography mass spectrometry using mixture similarity measure. Bioinformatics 2011, 27, 1660–1666. [Google Scholar] [CrossRef] [PubMed] [Green Version]
- Kim, S.; Koo, I.; Fang, A.; Zhang, X. Smith-Waterman peak alignment for comprehensive two-dimensional gas chromatography-mass spectrometry. BMC Bioinform. 2011, 12, 235. [Google Scholar] [CrossRef] [PubMed]
- Ramaker, R.C.; Gordon, E.; Cooper, S.J. R2DGC: Threshold-free peak alignment and identification for 2D gas chromatography mass spectrometry in R. Bioinformatics 2018, 34, 1789–1791. [Google Scholar] [CrossRef] [PubMed]
- Delabrière, A.; Hohenester, U.M.; Colsch, B.; Junot, C.; Fenaille, F.; Thévenot, E.A. proFIA: A data preprocessing workflow for flow injection analysis coupled to high-resolution mass spectrometry. Bioinformatics 2017, 33, 3767–3775. [Google Scholar] [CrossRef] [PubMed]
- Enot, D.P.; Lin, W.; Beckmann, M.; Parker, D.; Overy, D.P.; Draper, J. Preprocessing, classification modeling and feature selection using flow injection electrospray mass spectrometry metabolite fingerprint data. Nat. Protoc. 2008, 3, 446–470. [Google Scholar] [CrossRef] [PubMed]
- Du, P.; Kibbe, W.A.; Lin, S.M. Improved peak detection in mass spectrum by incorporating continuous wavelet transform-based pattern matching. Bioinformatics 2006, 22, 2059–2065. [Google Scholar] [CrossRef] [Green Version]
- Mahieu, N.G.; Huang, X.; Chen, Y.-J.; Patti, G.J. Credentialing features: A platform to benchmark and optimize untargeted metabolomic methods. Anal. Chem. 2014, 86, 9583–9589. [Google Scholar] [CrossRef]
- Robinson, M.D.; De Souza, D.P.; Keen, W.W.; Saunders, E.C.; McConville, M.J.; Speed, T.P.; Likić, V.A. A dynamic programming approach for the alignment of signal peaks in multiple gas chromatography-mass spectrometry experiments. BMC Bioinform. 2007, 8, 419. [Google Scholar] [CrossRef]
- Wehrens, R.; Bloemberg, T.G.; Eilers, P.H.C. Fast parametric time warping of peak lists. Bioinformatics 2015, 31, 3063–3065. [Google Scholar] [CrossRef]
- Frederic Fournier, C.B. Rene Paradis, Arnaud Droit rTANDEM. Bioconductor 2017. [Google Scholar] [CrossRef]
- Pascovici, J.W.A.D. SwathXtend. Bioconductor 2017. [Google Scholar] [CrossRef]
- Chaffin, M.D.; Cao, L.; Deik, A.A.; Clish, C.B.; Hu, F.B.; Martínez-González, M.A.; Razquin, C.; Bullo, M.; Corella, D.; Gómez-Gracia, E.; et al. MetProc: Separating Measurement Artifacts from True Metabolites in an Untargeted Metabolomics Experiment. J. Proteome Res. 2019, 18, 1446–1450. [Google Scholar] [CrossRef] [PubMed]
- Scheltema, R.A.; Jankevics, A.; Jansen, R.C.; Swertz, M.A.; Breitling, R. PeakML/mzMatch: A file format, Java library, R library, and tool-chain for mass spectrometry data analysis. Anal. Chem. 2011, 83, 2786–2793. [Google Scholar] [CrossRef]
- Meringer, M.; Reinker, S.; Zhang, J.; Muller, A. MS/MS data improves automated determination of molecular formulas by mass spectrometry. Match Commun. Math. Comput. Chem. 2011, 65, 259–290. [Google Scholar]
- Loos, M.; Gerber, C.; Corona, F.; Hollender, J.; Singer, H. Accelerated isotope fine structure calculation using pruned transition trees. Anal. Chem. 2015, 87, 5738–5744. [Google Scholar] [CrossRef] [PubMed]
- Böcker, S.; Lipták, Z.; Martin, M.; Pervukhin, A.; Sudek, H. DECOMP--from interpreting Mass Spectrometry peaks to solving the Money Changing Problem. Bioinformatics 2008, 24, 591–593. [Google Scholar] [CrossRef] [PubMed] [Green Version]
- Kuhl, C.; Tautenhahn, R.; Böttcher, C.; Larson, T.R.; Neumann, S. CAMERA: An integrated strategy for compound spectra extraction and annotation of liquid chromatography/mass spectrometry data sets. Anal. Chem. 2012, 84, 283–289. [Google Scholar] [CrossRef] [PubMed]
- Senan, O.; Aguilar-Mogas, A.; Navarro, M.; Capellades, J.; Noon, L.; Burks, D.; Yanes, O.; Guimerà, R.; Sales-Pardo, M. CliqueMS: A computational tool for annotating in-source metabolite ions from LC-MS untargeted metabolomics data based on a coelution similarity network. Bioinformatics 2019. [Google Scholar] [CrossRef] [PubMed]
- Broeckling, C.D.; Afsar, F.A.; Neumann, S.; Ben-Hur, A.; Prenni, J.E. RAMClust: A novel feature clustering method enables spectral-matching-based annotation for metabolomics data. Anal. Chem. 2014, 86, 6812–6817. [Google Scholar] [CrossRef]
- Nikolskiy, I.; Mahieu, N.G.; Chen, Y.-J.; Tautenhahn, R.; Patti, G.J. An untargeted metabolomic workflow to improve structural characterization of metabolites. Anal. Chem. 2013, 85, 7713–7719. [Google Scholar] [CrossRef] [PubMed]
- Chen, G.; Cui, L.; Teo, G.S.; Ong, C.N.; Tan, C.S.; Choi, H. MetTailor: Dynamic block summary and intensity normalization for robust analysis of mass spectrometry data in metabolomics. Bioinformatics 2015, 31, 3645–3652. [Google Scholar] [CrossRef] [PubMed]
- Loos, M.; Singer, H. Nontargeted homologue series extraction from hyphenated high resolution mass spectrometry data. J. Cheminform. 2017, 9, 12. [Google Scholar] [CrossRef] [PubMed]
- Suvitaival, T.; Rogers, S.; Kaski, S. Stronger findings from mass spectral data through multi-peak modeling. BMC Bioinform. 2014, 15, 208. [Google Scholar] [CrossRef] [PubMed]
- Calderón-Santiago, M.; Fernández-Peralbo, M.A.; Priego-Capote, F.; Luque de Castro, M.D. MSCombine: A tool for merging untargeted metabolomic data from high-resolution mass spectrometry in the positive and negative ionization modes. Metabolomics 2016, 12, 43. [Google Scholar] [CrossRef]
- Alonso, A.; Julià, A.; Beltran, A.; Vinaixa, M.; Díaz, M.; Ibañez, L.; Correig, X.; Marsal, S. AStream: An R package for annotating LC/MS metabolomic data. Bioinformatics 2011, 27, 1339–1340. [Google Scholar] [CrossRef]
- Naake, T.; Gaquerel, E. MetCirc: Navigating mass spectral similarity in high-resolution MS/MS metabolomics data. Bioinformatics 2017, 33, 2419–2420. [Google Scholar] [CrossRef]
- Silva, R.R.; Jourdan, F.; Salvanha, D.M.; Letisse, F.; Jamin, E.L.; Guidetti-Gonzalez, S.; Labate, C.A.; Vêncio, R.Z.N. ProbMetab: An R package for Bayesian probabilistic annotation of LC-MS-based metabolomics. Bioinformatics 2014, 30, 1336–1337. [Google Scholar] [CrossRef]
- Jaeger, C.; Méret, M.; Schmitt, C.A.; Lisec, J. Compound annotation in liquid chromatography/high-resolution mass spectrometry based metabolomics: Robust adduct ion determination as a prerequisite to structure prediction in electrospray ionization mass spectra. Rapid Commun. Mass Spectrom. 2017, 31, 1261–1266. [Google Scholar] [CrossRef]
- Edmands, W.M.B.; Petrick, L.; Barupal, D.K.; Scalbert, A.; Wilson, M.J.; Wickliffe, J.K.; Rappaport, S.M. compMS2Miner: An Automatable Metabolite Identification, Visualization, and Data-Sharing R Package for High-Resolution LC-MS Data Sets. Anal. Chem. 2017, 89, 3919–3928. [Google Scholar] [CrossRef]
- Collins, J.R.; Edwards, B.R.; Fredricks, H.F.; Van Mooy, B.A.S. LOBSTAHS: An Adduct-Based Lipidomics Strategy for Discovery and Identification of Oxidative Stress Biomarkers. Anal. Chem. 2016, 88, 7154–7162. [Google Scholar] [CrossRef] [PubMed]
- Koelmel, J.P.; Kroeger, N.M.; Ulmer, C.Z.; Bowden, J.A.; Patterson, R.E.; Cochran, J.A.; Beecher, C.W.W.; Garrett, T.J.; Yost, R.A. LipidMatch: An automated workflow for rule-based lipid identification using untargeted high-resolution tandem mass spectrometry data. BMC Bioinform. 2017, 18, 331. [Google Scholar] [CrossRef] [PubMed]
- Alcoriza-Balaguer, M.I.; García-Cañaveras, J.C.; Lopez, A.; Conde, I.; Juan, O.; Carretero, J.; Lahoz, A. LipidMS: An R package for lipid annotation in untargeted liquid chromatography-data independent acquisition-mass spectrometry lipidomics. Anal. Chem. 2018, 91, 836–845. [Google Scholar] [CrossRef] [PubMed]
- Wägele, B.; Witting, M.; Schmitt-Kopplin, P.; Suhre, K. MassTRIX reloaded: Combined analysis and visualization of transcriptome and metabolome data. PLoS ONE 2012, 7, e39860. [Google Scholar] [CrossRef] [PubMed]
- Tiffany, C.R.; Bäumler, A.J. omu, a Metabolomics Count Data Analysis Tool for Intuitive Figures and Convenient Metadata Collection. Microbiol. Resour. Announc. 2019, 8, e00129-19. [Google Scholar] [CrossRef] [PubMed] [Green Version]
- Yu, M.; Olkowicz, M.; Pawliszyn, J. Structure/reaction directed analysis for LC-MS based untargeted analysis. Anal. Chim. Acta 2019, 1050, 16–24. [Google Scholar] [CrossRef]
- Daly, R.; Rogers, S.; Wandy, J.; Jankevics, A.; Burgess, K.E.V.; Breitling, R. MetAssign: Probabilistic annotation of metabolites from LC-MS data using a Bayesian clustering approach. Bioinformatics 2014, 30, 2764–2771. [Google Scholar] [CrossRef] [PubMed]
- Uppal, K.; Walker, D.I.; Jones, D.P. xMSannotator: An R Package for Network-Based Annotation of High-Resolution Metabolomics Data. Anal. Chem. 2017, 89, 1063–1067. [Google Scholar] [CrossRef] [PubMed]
- Shahaf, N.; Rogachev, I.; Heinig, U.; Meir, S.; Malitsky, S.; Battat, M.; Wyner, H.; Zheng, S.; Wehrens, R.; Aharoni, A. The WEIZMASS spectral library for high-confidence metabolite identification. Nat. Commun. 2016, 7, 12423. [Google Scholar] [CrossRef] [PubMed]
- Witting, M. GitHub—Michaelwitting/ms2dbworkflow. Available online: https://github.com/michaelwitting/ms2dbworkflow (accessed on 7 August 2019).
- Horai, H.; Arita, M.; Kanaya, S.; Nihei, Y.; Ikeda, T.; Suwa, K.; Ojima, Y.; Tanaka, K.; Tanaka, S.; Aoshima, K.; et al. MassBank: A public repository for sharing mass spectral data for life sciences. J. Mass Spectrom. 2010, 45, 703–714. [Google Scholar] [CrossRef]
- Stravs, M.A.; Schymanski, E.L.; Singer, H.P.; Hollender, J. Automatic recalibration and processing of tandem mass spectra using formula annotation. J. Mass Spectrom. 2013, 48, 89–99. [Google Scholar] [CrossRef] [PubMed]
- Neumann, S.; Thum, A.; Böttcher, C. Nearline acquisition and processing of liquid chromatography-tandem mass spectrometry data. Metabolomics 2013, 9, 84–91. [Google Scholar] [CrossRef]
- Lawson, T.N.; Weber, R.J.M.; Jones, M.R.; Chetwynd, A.J.; Rodrı Guez-Blanco, G.; Di Guida, R.; Viant, M.R.; Dunn, W.B. msPurity: Automated Evaluation of Precursor Ion Purity for Mass Spectrometry-Based Fragmentation in Metabolomics. Anal. Chem. 2017, 89, 2432–2439. [Google Scholar] [CrossRef] [PubMed] [Green Version]
- Domingo-Almenara, X.; Brezmes, J.; Venturini, G.; Vivó-Truyols, G.; Perera, A.; Vinaixa, M. Baitmet, a computational approach for GC–MS library-driven metabolite profiling. Metabolomics 2017, 13, 93. [Google Scholar] [CrossRef]
- Depke, T.; Franke, R.; Brönstrup, M. CluMSID: An R package for similarity-based clustering of tandem mass spectra to aid feature annotation in metabolomics. Bioinformatics 2019. [Google Scholar] [CrossRef] [PubMed]
- Sentandreu, E.; Peris-Díaz, M.D.; Sweeney, S.R.; Chiou, J.; Muñoz, N.; Tiziani, S. A Survey of Orbitrap All Ion Fragmentation Analysis Assessed by an R MetaboList Package to Study Small-Molecule Metabolites. Chromatographia 2018, 81, 981–994. [Google Scholar] [CrossRef]
- Ruttkies, C.; Schymanski, E.L.; Wolf, S.; Hollender, J.; Neumann, S. MetFrag relaunched: Incorporating strategies beyond in silico fragmentation. J. Cheminform. 2016, 8, 3. [Google Scholar] [CrossRef]
- Narduzzi, L.; Stanstrup, J.; Mattivi, F.; Franceschi, P. The Compound Characteristics Comparison (CCC) approach: A tool for improving confidence in natural compound identification. Food Addit. Contam. Part A Chem. Anal. Control Expo. Risk Assess. 2018, 35, 1–13. [Google Scholar] [CrossRef]
- Mylonas, R.; Mauron, Y.; Masselot, A.; Binz, P.-A.; Budin, N.; Fathi, M.; Viette, V.; Hochstrasser, D.F.; Lisacek, F. X-Rank: A robust algorithm for small molecule identification using tandem mass spectrometry. Anal. Chem. 2009, 81, 7604–7610. [Google Scholar] [CrossRef]
- The National Institute of Standards and Technology Library Conversion Tool. Available online: https://chemdata.nist.gov/mass-spc/ms-search/Library_conversion_tool.html (accessed on 1 August 2019).
- Tsugawa, H.; Cajka, T.; Kind, T.; Ma, Y.; Higgins, B.; Ikeda, K.; Kanazawa, M.; VanderGheynst, J.; Fiehn, O.; Arita, M. MS-DIAL: Data-independent MS/MS deconvolution for comprehensive metabolome analysis. Nat. Methods 2015, 12, 523–526. [Google Scholar] [CrossRef]
- MassBank of North America MoNA Downloads. Available online: http://mona.fiehnlab.ucdavis.edu/downloads (accessed on 1 August 2019).
- Wang, M.; Carver, J.J.; Phelan, V.V.; Sanchez, L.M.; Garg, N.; Peng, Y.; Nguyen, D.D.; Watrous, J.; Kapono, C.A.; Luzzatto-Knaan, T.; et al. Sharing and community curation of mass spectrometry data with Global Natural Products Social Molecular Networking. Nat. Biotechnol. 2016, 34, 828–837. [Google Scholar] [CrossRef] [PubMed] [Green Version]
- Jacob, D.; Deborde, C.; Lefebvre, M.; Maucourt, M.; Moing, A. NMRProcFlow: A graphical and interactive tool dedicated to 1D spectra processing for NMR-based metabolomics. Metabolomics 2017, 13, 36. [Google Scholar] [CrossRef] [PubMed]
- Dieterle, F.; Ross, A.; Schlotterbeck, G.; Senn, H. Probabilistic quotient normalization as robust method to account for dilution of complex biological mixtures. Application in 1H NMR metabonomics. Anal. Chem. 2006, 78, 4281–4290. [Google Scholar] [CrossRef] [PubMed]
- Wishart, D.S.; Knox, C.; Guo, A.C.; Eisner, R.; Young, N.; Gautam, B.; Hau, D.D.; Psychogios, N.; Dong, E.; Bouatra, S.; et al. HMDB: A knowledgebase for the human metabolome. Nucleic Acids Res. 2009, 37, D603–D610. [Google Scholar] [CrossRef] [PubMed]
- Wishart, D.S.; Jewison, T.; Guo, A.C.; Wilson, M.; Knox, C.; Liu, Y.; Djoumbou, Y.; Mandal, R.; Aziat, F.; Dong, E.; et al. HMDB 3.0—The Human Metabolome Database in 2013. Nucleic Acids Res. 2013, 41, D801–D807. [Google Scholar] [CrossRef] [PubMed]
- Wishart, D.S.; Tzur, D.; Knox, C.; Eisner, R.; Guo, A.C.; Young, N.; Cheng, D.; Jewell, K.; Arndt, D.; Sawhney, S.; et al. HMDB: The human metabolome database. Nucleic Acids Res. 2007, 35, D521–D526. [Google Scholar] [CrossRef] [PubMed]
- Wishart, D.S.; Feunang, Y.D.; Marcu, A.; Guo, A.C.; Liang, K.; Vázquez-Fresno, R.; Sajed, T.; Johnson, D.; Li, C.; Karu, N.; et al. HMDB 4.0: The human metabolome database for 2018. Nucleic Acids Res. 2018, 46, D608–D617. [Google Scholar] [CrossRef] [PubMed]
- Beckonert, O.; Keun, H.C.; Ebbels, T.M.D.; Bundy, J.; Holmes, E.; Lindon, J.C.; Nicholson, J.K. Metabolic profiling, metabolomic and metabonomic procedures for NMR spectroscopy of urine, plasma, serum and tissue extracts. Nat. Protoc. 2007, 2, 2692–2703. [Google Scholar] [CrossRef]
- Pudakalakatti, S.M.; Dubey, A.; Jaipuria, G.; Shubhashree, U.; Adiga, S.K.; Moskau, D.; Atreya, H.S. A fast NMR method for resonance assignments: Application to metabolomics. J. Biomol. NMR 2014, 58, 165–173. [Google Scholar] [CrossRef]
- Ludwig, C.; Viant, M.R. Two-dimensional J-resolved NMR spectroscopy: Review of a key methodology in the metabolomics toolbox. Phytochem. Anal. 2010, 21, 22–32. [Google Scholar] [CrossRef]
- Gómez, J.; Brezmes, J.; Mallol, R.; Rodríguez, M.A.; Vinaixa, M.; Salek, R.M.; Correig, X.; Cañellas, N. Dolphin: A tool for automatic targeted metabolite profiling using 1D and 2D (1)H-NMR data. Anal. Bioanal. Chem. 2014, 406, 7967–7976. [Google Scholar] [CrossRef] [PubMed]
- Shinzawa, H.; Nishida, M.; Kanematsu, W.; Tanaka, T.; Suzuki, K.; Noda, I. Parallel factor (PARAFAC) kernel analysis of temperature- and composition-dependent NMR spectra of poly(lactic acid) nanocomposites. Analyst 2012, 137, 1913–1921. [Google Scholar] [CrossRef] [PubMed]
- Chen, K.; Park, J.; Li, F.; Patil, S.M.; Keire, D.A. Chemometric methods to quantify 1D and 2D NMR spectral differences among similar protein therapeutics. AAPS PharmSciTech 2018, 19, 1011–1019. [Google Scholar] [CrossRef] [PubMed]
- Pedersen, H.T.; Dyrby, M.; Engelsen, S.B.; Bro, R. Application of Multi-Way Analysis to 2D NMR Data. In Annual Reports on NMR Spectroscopy; Elsevier: Amsterdam, The Netherlands, 2006; Volume 59, pp. 207–233. [Google Scholar]
- Hao, J.; Astle, W.; De Iorio, M.; Ebbels, T.M.D. BATMAN--an R package for the automated quantification of metabolites from nuclear magnetic resonance spectra using a Bayesian model. Bioinformatics 2012, 28, 2088–2090. [Google Scholar] [CrossRef] [PubMed] [Green Version]
- Martin, M.; Legat, B.; Leenders, J.; Vanwinsberghe, J.; Rousseau, R.; Boulanger, B.; Eilers, P.H.; De Tullio, P.; Govaerts, B. PepsNMR for the 1H-NMR Metabolomic Data Pre-Processing. Anal. Chim. Acta 2018, 1019, 1–13. [Google Scholar] [CrossRef]
- Vu, T.N.; Valkenborg, D.; Smets, K.; Verwaest, K.A.; Dommisse, R.; Lemière, F.; Verschoren, A.; Goethals, B.; Laukens, K. An integrated workflow for robust alignment and simplified quantitative analysis of NMR spectrometry data. BMC Bioinform. 2011, 12, 405. [Google Scholar] [CrossRef]
- Beirnaert, C.; Meysman, P.; Vu, T.N.; Hermans, N.; Apers, S.; Pieters, L.; Covaci, A.; Laukens, K. speaq 2.0: A complete workflow for high-throughput 1D NMR spectra processing and quantification. bioRxiv 2017. [Google Scholar] [CrossRef]
- Lefort, G.; Liaubet, L.; Canlet, C.; Tardivel, P.; Père, M.-C.; Quesnel, H.; Paris, A.; Iannuccelli, N.; Vialaneix, N.; Servien, R. ASICS: An R package for a whole analysis workflow of 1D 1H NMR spectra. Bioinformatics 2019. [Google Scholar] [CrossRef]
- Cañueto, D.; Gómez, J.; Salek, R.M.; Correig, X.; Cañellas, N. rDolphin: A GUI R package for proficient automatic profiling of 1D 1H-NMR spectra of study datasets. Metabolomics 2018, 14, 24. [Google Scholar] [CrossRef]
- Lewis, I.A.; Schommer, S.C.; Markley, J.L. rNMR: Open source software for identifying and quantifying metabolites in NMR spectra. Magn. Reson. Chem. 2009, 47 (Suppl. 1), S123–S126. [Google Scholar] [CrossRef]
- Rodriguez-Martinez, A.; Posma, J.M.; Ayala, R.; Neves, A.L.; Anwar, M.; Petretto, E.; Emanueli, C.; Gauguier, D.; Nicholson, J.K.; Dumas, M.-E. MWASTools: An R/bioconductor package for metabolome-wide association studies. Bioinformatics 2018, 34, 890–892. [Google Scholar] [CrossRef] [PubMed]
- Hedjazi, L.; Gauguier, D.; Zalloua, P.A.; Nicholson, J.K.; Dumas, M.-E.; Cazier, J.-B. mQTL.NMR: An integrated suite for genetic mapping of quantitative variations of (1)H NMR-based metabolic profiles. Anal. Chem. 2015, 87, 4377–4384. [Google Scholar] [CrossRef] [PubMed]
- Wehrens, R.; Carvalho, E.; Fraser, P.D. Metabolite profiling in LC–DAD using multivariate curve resolution: The alsace package for R. Metabolomics 2015, 11, 143–154. [Google Scholar] [CrossRef]
- Bioconductor Bioconductor—BiocViews: Packages Found under StatisticalMethod. Available online: http://bioconductor.org/packages/release/BiocViews.html#___StatisticalMethod (accessed on 1 August 2019).
- Groemping, U. CRAN Task View: Design of Experiments (DoE) & Analysis of Experimental Data. Available online: https://cran.r-project.org/web/views/ExperimentalDesign.html (accessed on 1 August 2019).
- Leisch, F.; Gruen, B. CRAN Task View: Cluster Analysis & Finite Mixture Models. Available online: https://cran.r-project.org/web/views/Cluster.html (accessed on 1 August 2019).
- Hewson, P. CRAN Task View: Multivariate Statistics. Available online: https://cran.r-project.org/web/views/Multivariate.html (accessed on 1 August 2019).
- Hothorn, T. CRAN Task View: Machine Learning & Statistical Learning. Available online: https://cran.r-project.org/web/views/MachineLearning.html (accessed on 1 August 2019).
- The Comprehensive R Archive Network CRAN Task Views. Available online: https://cran.r-project.org/web/views/ (accessed on 1 August 2019).
- Müllner, D. Modern hierarchical, agglomerative clustering algorithms. arXiv 2011, arXiv:1109.2378. [Google Scholar]
- Zaslavsky, L.; Ciufo, S.; Fedorov, B.; Tatusova, T. Clustering analysis of proteins from microbial genomes at multiple levels of resolution. BMC Bioinform. 2016, 17 (Suppl. 8), 276. [Google Scholar] [CrossRef]
- Brusco, M.J.; Shireman, E.; Steinley, D. A comparison of latent class, K-means, and K-median methods for clustering dichotomous data. Psychol. Methods 2017, 22, 563–580. [Google Scholar] [CrossRef] [PubMed]
- Bishop, C.M. Pattern Recognition and Machine Learning (Information Science and Statistics); Springer: New York, NY, USA, 2006; p. 738. [Google Scholar]
- Felici, G. Mathematical Methods for Knowledge Discovery and Data Mining; Idea Group Reference: Hershey, PA, USA, 2007; p. 371. [Google Scholar]
- Shaw, P.J.A. Multivariate Statistics for the Environmental Sciences (Mathematics), 1st ed.; Hodder Education Publishers: London, UK, 2003; p. 233. [Google Scholar]
- Manly, B.F.; Alberto, J.A.N. Multivariate Statistical Methods, 4th ed.; Routledge: Boca Raton, FL, USA, 2017; p. 270. [Google Scholar]
- Chatfield, C. Introduction to Multivariate Analysis; Routledge: Abingdon-on-Thames, UK, 2018. [Google Scholar]
- Murtagh, F.; Contreras, P. Algorithms for hierarchical clustering: An overview. Wires Data Min. Knowl. Discov. 2012, 2, 86–97. [Google Scholar] [CrossRef]
- Hall, R.D. Annual Plant Reviews, Biology of Plant Metabolomics, 1st ed.; Wiley, John & Sons: Hoboken, NJ, USA, 2011; p. 448. [Google Scholar]
- Cai, Q.; Alvarez, J.A.; Kang, J.; Yu, T. Network Marker Selection for Untargeted LC-MS Metabolomics Data. J. Proteome Res. 2017, 16, 1261–1269. [Google Scholar] [CrossRef]
- Rohart, F.; Gautier, B.; Singh, A.; Lê Cao, K.-A. mixOmics: An R package for ’omics feature selection and multiple data integration. PLoS Comput. Biol. 2017, 13, e1005752. [Google Scholar] [CrossRef]
- Christin, C.; Hoefsloot, H.C.J.; Smilde, A.K.; Hoekman, B.; Suits, F.; Bischoff, R.; Horvatovich, P. A critical assessment of feature selection methods for biomarker discovery in clinical proteomics. Mol. Cell Proteom. 2013, 12, 263–276. [Google Scholar] [CrossRef]
- Wen, B.; Mei, Z.; Zeng, C.; Liu, S. metaX: A flexible and comprehensive software for processing metabolomics data. BMC Bioinform. 2017, 18, 183. [Google Scholar] [CrossRef] [PubMed]
- Peters, K.; Worrich, A.; Weinhold, A.; Alka, O.; Balcke, G.; Birkemeyer, C.; Bruelheide, H.; Calf, O.W.; Dietz, S.; Dührkop, K.; et al. Current Challenges in Plant Eco-Metabolomics. Int. J. Mol. Sci. 2018, 19, 1385. [Google Scholar] [CrossRef] [PubMed]
- Legendre, P.; Legendre, L.F.J. Numerical Ecology, Volume 24 (Developments in Environmental Modelling), 3rd ed.; Elsevier: Amsterdam, The Netherlands, 2012; p. 1006. [Google Scholar]
- Gromski, P.S.; Xu, Y.; Correa, E.; Ellis, D.I.; Turner, M.L.; Goodacre, R. A comparative investigation of modern feature selection and classification approaches for the analysis of mass spectrometry data. Anal. Chim. Acta 2014, 829, 1–8. [Google Scholar] [CrossRef] [PubMed]
- Clarke, B.; Fokoue, E.; Zhang, H.H. Principles and Theory for Data Mining and Machine Learning; Springer series in statistics; Springer: New York: New York, NY, 2009. [Google Scholar]
- Feng, J.; Li, B.; Jiang, X.; Yang, Y.; Wells, G.F.; Zhang, T.; Li, X. Antibiotic resistome in a large-scale healthy human gut microbiota deciphered by metagenomic and network analyses. Environ. Microbiol. 2018, 20, 355–368. [Google Scholar] [CrossRef] [PubMed]
- Vaughan, A.A.; Dunn, W.B.; Allwood, J.W.; Wedge, D.C.; Blackhall, F.H.; Whetton, A.D.; Dive, C.; Goodacre, R. Liquid chromatography-mass spectrometry calibration transfer and metabolomics data fusion. Anal. Chem. 2012, 84, 9848–9857. [Google Scholar] [CrossRef] [PubMed]
- Wei, R.; Wang, J.; Su, M.; Jia, E.; Chen, S.; Chen, T.; Ni, Y. Missing Value Imputation Approach for Mass Spectrometry-based Metabolomics Data. Sci. Rep. 2018, 8, 663. [Google Scholar] [CrossRef]
- Fukushima, A.; Kusano, M.; Redestig, H.; Arita, M.; Saito, K. Integrated omics approaches in plant systems biology. Curr. Opin. Chem. Biol. 2009, 13, 532–538. [Google Scholar] [CrossRef]
- Saeys, Y.; Inza, I.; Larrañaga, P. A review of feature selection techniques in bioinformatics. Bioinformatics 2007, 23, 2507–2517. [Google Scholar] [CrossRef] [Green Version]
- Degenhardt, F.; Seifert, S.; Szymczak, S. Evaluation of variable selection methods for random forests and omics data sets. Brief. Bioinform. 2019, 20, 492–503. [Google Scholar] [CrossRef]
- Determan, C.E., Jr. Optimal Algorithm for Metabolomics Classification and Feature Selection varies by Dataset. IJB 2014, 7, 100. [Google Scholar]
- Rinaudo, P.; Boudah, S.; Junot, C.; Thévenot, E.A. biosigner: A New Method for the Discovery of Significant Molecular Signatures from Omics Data. Front. Mol. Biosci. 2016, 3, 26. [Google Scholar] [CrossRef] [PubMed]
- Wehrens, R.; Franceschi, P. Meta-Statistics for Variable Selection: TheR PackageBioMark. J. Stat. Softw. 2012, 51. [Google Scholar]
- Shi, L.; Westerhuis, J.A.; Rosén, J.; Landberg, R.; Brunius, C. Variable selection and validation in multivariate modelling. Bioinformatics 2019, 35, 972–980. [Google Scholar] [CrossRef] [PubMed]
- Li, S.; Park, Y.; Duraisingham, S.; Strobel, F.H.; Khan, N.; Soltow, Q.A.; Jones, D.P.; Pulendran, B. Predicting network activity from high throughput metabolomics. PLoS Comput. Biol. 2013, 9, e1003123. [Google Scholar] [CrossRef] [PubMed]
- Nyamundanda, G.; Gormley, I.C.; Fan, Y.; Gallagher, W.M.; Brennan, L. MetSizeR: Selecting the optimal sample size for metabolomic studies using an analysis based approach. BMC Bioinform. 2013, 14, 338. [Google Scholar] [CrossRef] [PubMed]
- Brunius, C.; Shi, L.; Landberg, R. Large-scale untargeted LC-MS metabolomics data correction using between-batch feature alignment and cluster-based within-batch signal intensity drift correction. Metabolomics 2016, 12, 173. [Google Scholar] [CrossRef] [PubMed]
- Wehrens, R.; Hageman, J.A.; van Eeuwijk, F.; Kooke, R.; Flood, P.J.; Wijnker, E.; Keurentjes, J.J.B.; Lommen, A.; van Eekelen, H.D.L.M.; Hall, R.D.; et al. Improved batch correction in untargeted MS-based metabolomics. Metabolomics 2016, 12, 88. [Google Scholar] [CrossRef] [PubMed]
- Redestig, H.; Fukushima, A.; Stenlund, H.; Moritz, T.; Arita, M.; Saito, K.; Kusano, M. Compensation for systematic cross-contribution improves normalization of mass spectrometry based metabolomics data. Anal. Chem. 2009, 81, 7974–7980. [Google Scholar] [CrossRef]
- Karpievitch, Y.V.; Nikolic, S.B.; Wilson, R.; Sharman, J.E.; Edwards, L.M. Metabolomics data normalization with EigenMS. PLoS ONE 2014, 9, e116221. [Google Scholar] [CrossRef]
- Fernández-Albert, F.; Llorach, R.; Garcia-Aloy, M.; Ziyatdinov, A.; Andres-Lacueva, C.; Perera, A. Intensity drift removal in LC/MS metabolomics by common variance compensation. Bioinformatics 2014, 30, 2899–2905. [Google Scholar] [CrossRef] [Green Version]
- Jauhiainen, A.; Madhu, B.; Narita, M.; Narita, M.; Griffiths, J.; Tavaré, S. Normalization of metabolomics data with applications to correlation maps. Bioinformatics 2014, 30, 2155–2161. [Google Scholar] [CrossRef] [PubMed] [Green Version]
- Calderón-Santiago, M.; López-Bascón, M.A.; Peralbo-Molina, Á.; Priego-Capote, F. MetaboQC: A tool for correcting untargeted metabolomics data with mass spectrometry detection using quality controls. Talanta 2017, 174, 29–37. [Google Scholar] [CrossRef] [PubMed]
- Jacob, L.; Gagnon-Bartsch, J.A.; Speed, T.P. Correcting gene expression data when neither the unwanted variation nor the factor of interest are observed. Biostatistics 2016, 17, 16–28. [Google Scholar] [CrossRef] [PubMed]
- De Livera, A.M.; Sysi-Aho, M.; Jacob, L.; Gagnon-Bartsch, J.A.; Castillo, S.; Simpson, J.A.; Speed, T.P. Statistical methods for handling unwanted variation in metabolomics data. Anal. Chem. 2015, 87, 3606–3615. [Google Scholar] [CrossRef] [PubMed]
- De Livera, A.M.; Olshansky, G.; Simpson, J.A.; Creek, D.J. NormalizeMets: Assessing, selecting and implementing statistical methods for normalizing metabolomics data. Metabolomics 2018, 14, 54. [Google Scholar] [CrossRef] [PubMed]
- Shen, X.; Gong, X.; Cai, Y.; Guo, Y.; Tu, J.; Li, H.; Zhang, T.; Wang, J.; Xue, F.; Zhu, Z.-J. Normalization and integration of large-scale metabolomics data using support vector regression. Metabolomics 2016, 12, 89. [Google Scholar] [CrossRef]
- Chawade, A.; Alexandersson, E.; Levander, F. Normalyzer: A tool for rapid evaluation of normalization methods for omics data sets. J. Proteome Res. 2014, 13, 3114–3120. [Google Scholar] [CrossRef]
- Treutler, H.; Tsugawa, H.; Porzel, A.; Gorzolka, K.; Tissier, A.; Neumann, S.; Balcke, G.U. Discovering regulated metabolite families in untargeted metabolomics studies. Anal. Chem. 2016, 88, 8082–8090. [Google Scholar] [CrossRef]
- Stacklies, W.; Redestig, H.; Scholz, M.; Walther, D.; Selbig, J. pcaMethods--a bioconductor package providing PCA methods for incomplete data. Bioinformatics 2007, 23, 1164–1167. [Google Scholar] [CrossRef]
- Strimmer, K. fdrtool: A versatile R package for estimating local and tail area-based false discovery rates. Bioinformatics 2008, 24, 1461–1462. [Google Scholar] [CrossRef]
- Ernest, B.; Gooding, J.R.; Campagna, S.R.; Saxton, A.M.; Voy, B.H. MetabR: An R script for linear model analysis of quantitative metabolomic data. BMC Res. Notes 2012, 5, 596. [Google Scholar] [CrossRef]
- Pollard, K.S.; Dudoit, S.; van der Laan, M.J. Multiple Testing Procedures: The multtest Package and Applications to Genomics. In Bioinformatics and Computational Biology Solutions Using R and Bioconductor; Gentleman, R., Carey, V.J., Huber, W., Irizarry, R.A., Dudoit, S., Eds.; Statistics for biology and health; Springer: New York, NY, USA, 2005; pp. 249–271. [Google Scholar]
- Peluso, A.; Glen, R.; Ebbels, T.M.D. Estimation of permutation-based metabolome-wide significance thresholds: Supplementary material. bioRxiv 2018. [Google Scholar] [CrossRef]
- Kuhn, M. Building Predictive Models in R Using the caret Package. J. Stat. Softw. 2008, 28, 1–26. [Google Scholar] [CrossRef]
- Weihs, C.; Ligges, U.; Luebke, K.; Raabe, N. klaR Analyzing German Business Cycles. In Data Analysis and Decision Support; Baier, D., Decker, R., Schmidt-Thieme, L., Eds.; Springer-Verlag: Berlin/Heidelberg, Germany, 2005; pp. 335–343. [Google Scholar]
- Cacciatore, S.; Tenori, L.; Luchinat, C.; Bennett, P.R.; MacIntyre, D.A. KODAMA: An R package for knowledge discovery and data mining. Bioinformatics 2017, 33, 621–623. [Google Scholar] [CrossRef]
- Nyamundanda, G.; Brennan, L.; Gormley, I.C. Probabilistic principal component analysis for metabolomic data. BMC Bioinform. 2010, 11, 571. [Google Scholar] [CrossRef] [PubMed]
- Perrot-Dockès, M.; Lévy-Leduc, C.; Chiquet, J.; Sansonnet, L.; Brégère, M.; Étienne, M.-P.; Robin, S.; Genta-Jouve, G. A variable selection approach in the multivariate linear model: An application to LC-MS metabolomics data. Stat. Appl. Genet. Mol. Biol. 2018. [Google Scholar] [CrossRef]
- Bouhaddani, S.E.; Uh, H.-W.; Jongbloed, G.; Hayward, C.; Klarić, L.; Kiełbasa, S.M.; Houwing-Duistermaat, J. Integrating omics datasets with the OmicsPLS package. BMC Bioinform. 2018, 19, 371. [Google Scholar] [CrossRef]
- Mevik, B.-H.; Wehrens, R. The pls Package: Principal Component and Partial Least Squares Regression inR. J. Stat. Softw. 2007, 2, 18. [Google Scholar]
- Mehmood, T.; Liland, K.H.; Snipen, L.; Sæbø, S. A review of variable selection methods in Partial Least Squares Regression. Chemom. Intell. Lab. Syst. 2012, 118, 62–69. [Google Scholar] [CrossRef]
- Leibovici, D.G. Spatio-Temporal Multiway Decompositions Using Principal Tensor Analysis on-Modes: TheR PackagePTAk. J. Stat. Softw. 2010, 34, 1–34. [Google Scholar] [CrossRef]
- Del Carratore, F.; Jankevics, A.; Eisinga, R.; Heskes, T.; Hong, F.; Breitling, R. RankProd 2.0: A refactored bioconductor package for detecting differentially expressed features in molecular profiling datasets. Bioinformatics 2017, 33, 2774–2775. [Google Scholar] [CrossRef]
- Thévenot, E.A.; Roux, A.; Xu, Y.; Ezan, E.; Junot, C. Analysis of the Human Adult Urinary Metabolome Variations with Age, Body Mass Index, and Gender by Implementing a Comprehensive Workflow for Univariate and OPLS Statistical Analyses. J. Proteome Res. 2015, 14, 3322–3335. [Google Scholar] [CrossRef]
- Giordani, P.; Kiers, H.A.L.; Ferraro, M.A.D. Three-Way Component Analysis Using theR PackageThreeWay. J. Stat. Softw. 2014, 57, 1–23. [Google Scholar] [CrossRef]
- Siddiqui, J.K.; Baskin, E.; Liu, M.; Cantemir-Stone, C.Z.; Zhang, B.; Bonneville, R.; McElroy, J.P.; Coombes, K.R.; Mathé, E.A. IntLIM: Integration using linear models of metabolomics and gene expression data. BMC Bioinform. 2018, 19, 81. [Google Scholar] [CrossRef]
- Lê Cao, K.-A.; González, I.; Déjean, S. integrOmics: An R package to unravel relationships between two omics datasets. Bioinformatics 2009, 25, 2855–2856. [Google Scholar] [CrossRef]
- Hernandez-Ferrer, C.; Ruiz-Arenas, C.; Beltran-Gomila, A.; González, J.R. MultiDataSet: An R package for encapsulating multiple data sets with application to omic data integration. BMC Bioinform. 2017, 18, 36. [Google Scholar] [CrossRef]
- Meng, C.; Kuster, B.; Culhane, A.C.; Gholami, A.M. A multivariate approach to the integration of multi-omics datasets. BMC Bioinform. 2014, 15, 162. [Google Scholar] [CrossRef]
- Hernández-de-Diego, R.; Boix-Chova, N.; Gómez-Cabrero, D.; Tegner, J.; Abugessaisa, I.; Conesa, A. STATegra EMS: An Experiment Management System for complex next-generation omics experiments. BMC Syst. Biol. 2014, 8 (Suppl. 2), S9. [Google Scholar] [CrossRef]
- Uppal, K.; Ma, C.; Go, Y.-M.; Jones, D.P.; Wren, J. xMWAS: A data-driven integration and differential network analysis tool. Bioinformatics 2018, 34, 701–702. [Google Scholar] [CrossRef]
- Noecker, C.; Eng, A.; Srinivasan, S.; Theriot, C.M.; Young, V.B.; Jansson, J.K.; Fredricks, D.N.; Borenstein, E. Metabolic Model-Based Integration of Microbiome Taxonomic and Metabolomic Profiles Elucidates Mechanistic Links between Ecological and Metabolic Variation. mSystems 2016, 1. [Google Scholar] [CrossRef] [Green Version]
- Nodzenski, M.; Muehlbauer, M.J.; Bain, J.R.; Reisetter, A.C.; Lowe, W.L.; Scholtens, D.M. Metabomxtr: An R package for mixture-model analysis of non-targeted metabolomics data. Bioinformatics 2014, 30, 3287–3288. [Google Scholar] [CrossRef]
- Zhan, X.; Patterson, A.D.; Ghosh, D. Kernel approaches for differential expression analysis of mass spectrometry-based metabolomics data. BMC Bioinform. 2015, 16, 77. [Google Scholar] [CrossRef]
- Kowarik, A.; Templ, M. Imputation with theR PackageVIM. J. Stat. Softw. 2016, 74, 1–16. [Google Scholar] [CrossRef]
- James, G.; Witten, D.; Hastie, T.; Tibshirani, R. An Introduction to Statistical Learning; Springer Texts in Statistics; Springer: New York, NY, USA, 2013; Volume 103. [Google Scholar]
- Honaker, J.; King, G.; Blackwell, M. Amelia II: A program for missing data. J. Stat. Softw. 2011, 45, 1–47. [Google Scholar] [CrossRef]
- Moritz, S.; Bartz-Beielstein, T. impute TS: Time Series Missing Value Imputation in R. R J. 2017, 9, 207. [Google Scholar] [CrossRef]
- Josse, J.; Husson, F. missmda: A package for handling missing values in multivariate data analysis. J. Stat. Softw. 2016, 70, 1–31. [Google Scholar] [CrossRef]
- Stekhoven, D.J.; Bühlmann, P. MissForest--non-parametric missing value imputation for mixed-type data. Bioinformatics 2012, 28, 112–118. [Google Scholar] [CrossRef]
- Buuren, S.V.; Groothuis-Oudshoorn, K. mice: Multivariate Imputation by Chained Equations inR. J. Stat. Softw. 2011, 45, 1–68. [Google Scholar] [CrossRef]
- Su, Y.-S.; Gelman, A.; Hill, J.; Yajima, M. Multiple Imputation with Diagnostics (mi) inR: Opening Windows into the Black Box. J. Stat. Softw. 2011, 45, 1–31. [Google Scholar] [CrossRef]
- Wei, R.; Wang, J.; Jia, E.; Chen, T.; Ni, Y.; Jia, W. GSimp: A Gibbs sampler based left-censored missing value imputation approach for metabolomics studies. PLoS Comput. Biol. 2018, 14, e1005973. [Google Scholar] [CrossRef]
- Hughes, G.; Cruickshank-Quinn, C.; Reisdorph, R.; Lutz, S.; Petrache, I.; Reisdorph, N.; Bowler, R.; Kechris, K. MSPrep--summarization, normalization and diagnostics for processing of mass spectrometry-based metabolomic data. Bioinformatics 2014, 30, 133–134. [Google Scholar] [CrossRef]
- De Livera, A.M.; Dias, D.A.; De Souza, D.; Rupasinghe, T.; Pyke, J.; Tull, D.; Roessner, U.; McConville, M.; Speed, T.P. Normalizing and integrating metabolomics data. Anal. Chem. 2012, 84, 10768–10776. [Google Scholar] [CrossRef]
- Xia, J.; Sinelnikov, I.V.; Han, B.; Wishart, D.S. MetaboAnalyst 3.0--making metabolomics more meaningful. Nucleic Acids Res. 2015, 43, W251–W257. [Google Scholar] [CrossRef]
- Chong, J.; Xia, J. MetaboAnalystR: An R package for flexible and reproducible analysis of metabolomics data. Bioinformatics 2018, 34, 4313–4314. [Google Scholar] [CrossRef]
- Gaude, E.; Chignola, F.; Spiliotopoulos, D.; Spitaleri, A.; Ghitti, M.; M Garcia-Manteiga, J.; Mari, S.; Musco, G. muma, An R Package for Metabolomics Univariate and Multivariate Statistical Analysis. CMB 2013, 1, 180–189. [Google Scholar] [CrossRef]
- Argelaguet, R.; Velten, B.; Arnol, D.; Dietrich, S.; Zenz, T.; Marioni, J.C.; Buettner, F.; Huber, W.; Stegle, O. Multi-Omics Factor Analysis-a framework for unsupervised integration of multi-omics data sets. Mol. Syst. Biol. 2018, 14, e8124. [Google Scholar] [CrossRef]
- Mock, A.; Warta, R.; Dettling, S.; Brors, B.; Jäger, D.; Herold-Mende, C. MetaboDiff: An R package for differential metabolomic analysis. Bioinformatics 2018, 34, 3417–3418. [Google Scholar] [CrossRef]
- Jaeger, C.; Lisec, J. Statistical and Multivariate Analysis of MS-Based Plant Metabolomics Data. Methods Mol. Biol. 2018, 1778, 285–296. [Google Scholar]
- Li, M.; Wang, S.; Xie, G.; Ma, X.; Chen, T.; Jia, W. polyPK: An R package for pharmacokinetic analysis of multi-component drugs using a metabolomics approach. Bioinformatics 2018, 34, 1792–1794. [Google Scholar] [CrossRef]
- Willighagen, E.L.; Mayfield, J.W.; Alvarsson, J.; Berg, A.; Carlsson, L.; Jeliazkova, N.; Kuhn, S.; Pluskal, T.; Rojas-Chertó, M.; Spjuth, O.; et al. The Chemistry Development Kit (CDK) v2.0: Atom typing, depiction, molecular formulas, and substructure searching. J. Cheminform. 2017, 9, 33. [Google Scholar] [CrossRef]
- Heller, S.R.; McNaught, A.; Pletnev, I.; Stein, S.; Tchekhovskoi, D. Inchi, the IUPAC international chemical identifier. J. Cheminform. 2015, 7, 23. [Google Scholar] [CrossRef]
- Backman, T.W.H.; Cao, Y.; Girke, T. ChemMine tools: An online service for analyzing and clustering small molecules. Nucleic Acids Res. 2011, 39, W486–W491. [Google Scholar] [CrossRef]
- O’Boyle, N.M.; Banck, M.; James, C.A.; Morley, C.; Vandermeersch, T.; Hutchison, G.R. Open Babel: An open chemical toolbox. J. Cheminform. 2011, 3, 33. [Google Scholar] [CrossRef]
- Landrum, G. RDKit: Open-Source Cheminformatics Software. Available online: https://github.com/rdkit/rdkit/ (accessed on 16 September 2019).
- Wang, Y.; Xiao, J.; Suzek, T.O.; Zhang, J.; Wang, J.; Bryant, S.H. PubChem: A public information system for analyzing bioactivities of small molecules. Nucleic Acids Res. 2009, 37, W623–W633. [Google Scholar] [CrossRef]
- Kim, S.; Thiessen, P.A.; Bolton, E.E.; Chen, J.; Fu, G.; Gindulyte, A.; Han, L.; He, J.; He, S.; Shoemaker, B.A.; et al. PubChem Substance and Compound databases. Nucleic Acids Res. 2016, 44, D1202–D1213. [Google Scholar] [CrossRef]
- Pence, H.E.; Williams, A. Chemspider: An online chemical information resource. J. Chem. Educ. 2010, 87, 1123–1124. [Google Scholar] [CrossRef]
- Erxleben, F.; Günther, M.; Krötzsch, M.; Mendez, J.; Vrandečić, D. Introducing wikidata to the linked data web. In The Semantic Web—ISWC 2014; Mika, P., Tudorache, T., Bernstein, A., Welty, C., Knoblock, C., Vrandečić, D., Groth, P., Noy, N., Janowicz, K., Goble, C., Eds.; Lecture notes in computer science; Springer International Publishing: Cham, Switzerland, 2014; Volume 8796, pp. 50–65. [Google Scholar]
- Wohlgemuth, G.; Haldiya, P.K.; Willighagen, E.; Kind, T.; Fiehn, O. The Chemical Translation Service--a web-based tool to improve standardization of metabolomic reports. Bioinformatics 2010, 26, 2647–2648. [Google Scholar] [CrossRef] [Green Version]
- SRC, Inc. Scientific Databases. Available online: https://www.srcinc.com/what-we-do/environmental/scientific-databases.html (accessed on 1 August 2019).
- NCI/CADD Group. NCI/CADD Chemical Identifier Resolver. Available online: https://cactus.nci.nih.gov/chemical/structure (accessed on 1 August 2019).
- Djoumbou Feunang, Y.; Eisner, R.; Knox, C.; Chepelev, L.; Hastings, J.; Owen, G.; Fahy, E.; Steinbeck, C.; Subramanian, S.; Bolton, E.; et al. ClassyFire: Automated chemical classification with a comprehensive, computable taxonomy. J. Cheminform. 2016, 8, 61. [Google Scholar] [CrossRef]
- Guha, R. Chemical Informatics Functionality in R. J. Stat. Softw. 2007, 18, 1–16. [Google Scholar] [CrossRef]
- Cao, Y.; Charisi, A.; Cheng, L.-C.; Jiang, T.; Girke, T. ChemmineR: A compound mining framework for R. Bioinformatics 2008, 24, 1733–1734. [Google Scholar] [CrossRef]
- Wang, Y.; Backman, T.W.H.; Horan, K.; Girke, T. fmcsR: Mismatch tolerant maximum common substructure searching in R. Bioinformatics 2013, 29, 2792–2794. [Google Scholar] [CrossRef]
- Murrell, D.S.; Cortes-Ciriano, I.; van Westen, G.J.P.; Stott, I.P.; Bender, A.; Malliavin, T.E.; Glen, R.C. Chemically Aware Model Builder (camb): An R package for property and bioactivity modelling of small molecules. J. Cheminform. 2015, 7, 45. [Google Scholar] [CrossRef]
- Szöcs, E. Webchem: Zenodo Release; Zenodo: Genève, Switzerland, 2015. [Google Scholar] [CrossRef]
- Watrous, J.; Roach, P.; Alexandrov, T.; Heath, B.S.; Yang, J.Y.; Kersten, R.D.; van der Voort, M.; Pogliano, K.; Gross, H.; Raaijmakers, J.M.; et al. Mass spectral molecular networking of living microbial colonies. Proc. Natl. Acad. Sci. USA 2012, 109, E1743–E1752. [Google Scholar] [CrossRef] [Green Version]
- Kanehisa, M.; Furumichi, M.; Tanabe, M.; Sato, Y.; Morishima, K. KEGG: New perspectives on genomes, pathways, diseases and drugs. Nucleic Acids Res. 2017, 45, D353–D361. [Google Scholar] [CrossRef]
- Kanehisa, M.; Sato, Y.; Furumichi, M.; Morishima, K.; Tanabe, M. New approach for understanding genome variations in KEGG. Nucleic Acids Res. 2019, 47, D590–D595. [Google Scholar] [CrossRef]
- Kanehisa, M.; Goto, S. KEGG: Kyoto encyclopedia of genes and genomes. Nucleic Acids Res. 2000, 28, 27–30. [Google Scholar] [CrossRef]
- Wishart, D.; Arndt, D.; Pon, A.; Sajed, T.; Guo, A.C.; Djoumbou, Y.; Knox, C.; Wilson, M.; Liang, Y.; Grant, J.; et al. T3DB: The toxic exposome database. Nucleic Acids Res. 2015, 43, D928–D934. [Google Scholar] [CrossRef]
- Lim, E.; Pon, A.; Djoumbou, Y.; Knox, C.; Shrivastava, S.; Guo, A.C.; Neveu, V.; Wishart, D.S. T3DB: A comprehensively annotated database of common toxins and their targets. Nucleic Acids Res. 2010, 38, D781–D786. [Google Scholar] [CrossRef]
- Fahy, E.; Sud, M.; Cotter, D.; Subramaniam, S. LIPID MAPS online tools for lipid research. Nucleic Acids Res. 2007, 35, W606–W612. [Google Scholar] [CrossRef] [Green Version]
- Shen, X.; Wang, R.; Xiong, X.; Yin, Y.; Cai, Y.; Ma, Z.; Liu, N.; Zhu, Z.-J. Metabolic reaction network-based recursive metabolite annotation for untargeted metabolomics. Nat. Commun. 2019, 10, 1516. [Google Scholar] [CrossRef]
- Schaefer, C.F.; Anthony, K.; Krupa, S.; Buchoff, J.; Day, M.; Hannay, T.; Buetow, K.H. PID: The pathway interaction database. Nucleic Acids Res. 2009, 37, D674–D679. [Google Scholar] [CrossRef]
- Nishimura, D. BioCarta. Biotech Softw. Internet Rep. 2001, 2, 117–120. [Google Scholar] [CrossRef]
- Fabregat, A.; Jupe, S.; Matthews, L.; Sidiropoulos, K.; Gillespie, M.; Garapati, P.; Haw, R.; Jassal, B.; Korninger, F.; May, B.; et al. The reactome pathway knowledgebase. Nucleic Acids Res. 2018, 46, D649–D655. [Google Scholar] [CrossRef]
- Kramer, F.; Bayerlová, M.; Beißbarth, T. R-based software for the integration of pathway data into bioinformatic algorithms. Biology 2014, 3, 85–100. [Google Scholar] [CrossRef]
- Tenenbaum, D. Bioconductor—KEGGREST. Available online: http://bioconductor.org/packages/release/bioc/html/KEGGREST.html (accessed on 6 September 2019).
- Chang, W.; Cheng, J.; Allaire, J.J.; Xie, Y.; McPherson, J. Shiny: Web Application Framework for R. Available online: https://CRAN.R-project.org/package=shiny (accessed on 6 August 2019).
- Csardi, G.; Nepusz, T. The igraph software package for complex network research. InterJournal Complex Syst. 2006, 1695, 1–9. [Google Scholar]
- Castro, M.A.A.; Wang, X.; Fletcher, M.N.C.; Meyer, K.B.; Markowetz, F. RedeR: R/Bioconductor package for representing modular structures, nested networks and multiple levels of hierarchical associations. Genome Biol. 2012, 13, R29. [Google Scholar] [CrossRef]
- Fukushima, A. DiffCorr: An R package to analyze and visualize differential correlations in biological networks. Gene 2013, 518, 209–214. [Google Scholar] [CrossRef] [Green Version]
- Naake, T.; Fernie, A.R. MetNet: Metabolite Network Prediction from High-Resolution Mass Spectrometry Data in R Aiding Metabolite Annotation. Anal. Chem. 2019, 91, 1768–1772. [Google Scholar] [CrossRef]
- Grapov, D.; Wanichthanarak, K.; Fiehn, O. MetaMapR: Pathway independent metabolomic network analysis incorporating unknowns. Bioinformatics 2015, 31, 2757–2760. [Google Scholar] [CrossRef]
- Wanichthanarak, K.; Fan, S.; Grapov, D.; Barupal, D.K.; Fiehn, O. Metabox: A toolbox for metabolomic data analysis, interpretation and integrative exploration. PLoS ONE 2017, 12, e0171046. [Google Scholar] [CrossRef]
- Uppal, K.; Soltow, Q.A.; Promislow, D.E.L.; Wachtman, L.M.; Quyyumi, A.A.; Jones, D.P. MetabNet: An R Package for Metabolic Association Analysis of High-Resolution Metabolomics Data. Front. Bioeng. Biotechnol. 2015, 3, 87. [Google Scholar] [CrossRef]
- Langfelder, P.; Horvath, S. WGCNA: An R package for weighted correlation network analysis. BMC Bioinform. 2008, 9, 559. [Google Scholar] [CrossRef]
- Wachter, A.; Beißbarth, T. pwOmics: An R package for pathway-based integration of time-series omics data using public database knowledge. Bioinformatics 2015, 31, 3072–3074. [Google Scholar] [CrossRef]
- Yamamoto, H.; Fujimori, T.; Sato, H.; Ishikawa, G.; Kami, K.; Ohashi, Y. Statistical hypothesis testing of factor loading in principal component analysis and its application to metabolite set enrichment analysis. BMC Bioinform. 2014, 15, 51. [Google Scholar] [CrossRef]
- Picart-Armada, S.; Fernández-Albert, F.; Vinaixa, M.; Rodríguez, M.A.; Aivio, S.; Stracker, T.H.; Yanes, O.; Perera-Lluna, A. Null diffusion-based enrichment for metabolomics data. PLoS ONE 2017, 12, e0189012. [Google Scholar] [CrossRef]
- Gu, Z.; Wang, J. CePa: An R package for finding significant pathways weighted by multiple network centralities. Bioinformatics 2013, 29, 658–660. [Google Scholar] [CrossRef]
- Tran, V.D.T.; Moretti, S.; Coste, A.T.; Amorim-Vaz, S.; Sanglard, D.; Pagni, M. Condition-specific series of metabolic sub-networks and its application for gene set enrichment analysis. Bioinformatics 2018, 35, 2258–2266. [Google Scholar] [CrossRef] [Green Version]
- Al-Akwaa, F.M.; Yunits, B.; Huang, S.; Alhajaji, H.; Garmire, L.X. Lilikoi: An R package for personalized pathway-based classification modeling using metabolomics data. GigaScience 2018, 7, giy136. [Google Scholar] [CrossRef]
- Zuo, Y.; Cui, Y.; Di Poto, C.; Varghese, R.S.; Yu, G.; Li, R.; Ressom, H.W. INDEED: Integrated differential expression and differential network analysis of omic data for biomarker discovery. Methods 2016, 111, 12–20. [Google Scholar] [CrossRef] [Green Version]
- Do, K.T.; Rasp, D.J.N.-P.; Kastenmüller, G.; Suhre, K.; Krumsiek, J. MoDentify: Phenotype-driven module identification in metabolomics networks at different resolutions. Bioinformatics 2019, 35, 532–534. [Google Scholar] [CrossRef]
- Aggio, R.B.M.; Ruggiero, K.; Villas-Bôas, S.G. Pathway Activity Profiling (PAPi): From the metabolite profile to the metabolic pathway activity. Bioinformatics 2010, 26, 2969–2976. [Google Scholar] [CrossRef]
- Odom, G.; Ban, Y.; Liu, L.; Sun, X.; Pico, A.; Zhang, B.; Wang, L.; Chen, X. pathwayPCA: An R package for integrative pathway analysis with modern PCA methodology and gene selection. bioRxiv 2019. [Google Scholar] [CrossRef]
- Gavai, A.K.; Supandi, F.; Hettling, H.; Murrell, P.; Leunissen, J.A.M.; van Beek, J.H.G.M. Using bioconductor package BiGGR for metabolic flux estimation based on gene expression changes in brain. PLoS ONE 2015, 10, e0119016. [Google Scholar] [CrossRef]
- Tarca, A.L.; Draghici, S.; Khatri, P.; Hassan, S.S.; Mittal, P.; Kim, J.-S.; Kim, C.J.; Kusanovic, J.P.; Romero, R. A novel signaling pathway impact analysis. Bioinformatics 2009, 25, 75–82. [Google Scholar] [CrossRef]
- Bohler, A.; Eijssen, L.M.T.; van Iersel, M.P.; Leemans, C.; Willighagen, E.L.; Kutmon, M.; Jaillard, M.; Evelo, C.T. Automatically visualise and analyse data on pathways using PathVisioRPC from any programming environment. BMC Bioinform. 2015, 16, 267. [Google Scholar] [CrossRef]
- Zhang, B.; Hu, S.; Baskin, E.; Patt, A.; Siddiqui, J.K.; Mathé, E.A. Ramp: A comprehensive relational database of metabolomics pathways for pathway enrichment analysis of genes and metabolites. Metabolites 2018, 8, 16. [Google Scholar] [CrossRef]
- Kramer, F.; Bayerlová, M.; Klemm, F.; Bleckmann, A.; Beissbarth, T. rBiopaxParser--an R package to parse, modify and visualize BioPAX data. Bioinformatics 2013, 29, 520–522. [Google Scholar] [CrossRef]
- Sales, G.; Calura, E.; Romualdi, C. metaGraphite—A new layer of pathway annotation to get metabolite networks. Bioinformatics 2018, 35, 1258–1260. [Google Scholar] [CrossRef]
- Sales, G.; Calura, E.; Cavalieri, D.; Romualdi, C. graphite—A Bioconductor package to convert pathway topology to gene network. Bmc Bioinform. 2012, 13, 20. [Google Scholar] [CrossRef]
- Luo, W.; Brouwer, C. Pathview: An R/Bioconductor package for pathway-based data integration and visualization. Bioinformatics 2013, 29, 1830–1831. [Google Scholar] [CrossRef]
- Zhang, J.D.; Wiemann, S. KEGGgraph: A graph approach to KEGG PATHWAY in R and bioconductor. Bioinformatics 2009, 25, 1470–1471. [Google Scholar] [CrossRef]
- Luna, A.; Babur, Ö.; Aksoy, B.A.; Demir, E.; Sander, C. PaxtoolsR: Pathway analysis in R using Pathway Commons. Bioinformatics 2016, 32, 1262–1264. [Google Scholar] [CrossRef]
- Slenter, D.N.; Kutmon, M.; Hanspers, K.; Riutta, A.; Windsor, J.; Nunes, N.; Mélius, J.; Cirillo, E.; Coort, S.L.; Digles, D.; et al. WikiPathways: A multifaceted pathway database bridging metabolomics to other omics research. Nucleic Acids Res. 2018, 46, D661–D667. [Google Scholar] [CrossRef]
- Rocca-Serra, P.; Brandizi, M.; Maguire, E.; Sklyar, N.; Taylor, C.; Begley, K.; Field, D.; Harris, S.; Hide, W.; Hofmann, O.; et al. ISA software suite: Supporting standards-compliant experimental annotation and enabling curation at the community level. Bioinformatics 2010, 26, 2354–2356. [Google Scholar] [CrossRef]
- Sansone, S.-A.; Rocca-Serra, P.; Field, D.; Maguire, E.; Taylor, C.; Hofmann, O.; Fang, H.; Neumann, S.; Tong, W.; Amaral-Zettler, L.; et al. Toward interoperable bioscience data. Nat. Genet. 2012, 44, 121–126. [Google Scholar] [CrossRef]
- Fernández-Albert, F.; Llorach, R.; Andrés-Lacueva, C.; Perera, A. An R package to analyse LC/MS metabolomic data: MAIT (Metabolite Automatic Identification Toolkit). Bioinformatics 2014, 30, 1937–1939. [Google Scholar] [CrossRef]
- Edmands, W.M.B.; Hayes, J.; Rappaport, S.M. simExTargId: A comprehensive package for real-time LC-MS data acquisition and analysis. Bioinformatics 2018, 34, 3589–3590. [Google Scholar] [CrossRef]
- Edmands, W.M.B.; Barupal, D.K.; Scalbert, A. MetMSLine: An automated and fully integrated pipeline for rapid processing of high-resolution LC-MS metabolomic datasets. Bioinformatics 2015, 31, 788–790. [Google Scholar] [CrossRef]
- Franceschi, P.; Mylonas, R.; Shahaf, N.; Scholz, M.; Arapitsas, P.; Masuero, D.; Weingart, G.; Carlin, S.; Vrhovsek, U.; Mattivi, F.; et al. MetaDB a Data Processing Workflow in Untargeted MS-Based Metabolomics Experiments. Front. Bioeng. Biotechnol. 2014, 2, 72. [Google Scholar] [CrossRef]
- Costa, C.; Maraschin, M.; Rocha, M. An R package for the integrated analysis of metabolomics and spectral data. Comput. Methods Programs Biomed. 2016, 129, 117–124. [Google Scholar] [CrossRef] [Green Version]
- Stravs, M.A.; Pomati, F.; Hollender, J. Exploring micropollutant biotransformation in three freshwater phytoplankton species. Environ. Sci. Process. Impacts 2017, 19, 822–832. [Google Scholar] [CrossRef] [Green Version]
- Stravs, M.A.; Pomati, F.; Hollender, J. Biodiversity drives micropollutant biotransformation in freshwater phytoplankton assemblages. Environ. Sci. Technol. 2019, 53, 4265–4273. [Google Scholar] [CrossRef]
- Huang, S.-M.; Toh, W.; Benke, P.I.; Tan, C.S.; Ong, C.N. MetaboNexus: An interactive platform for integrated metabolomics analysis. Metabolomics 2014, 10, 1084–1093. [Google Scholar] [CrossRef]
- Wolthuis, J.C.; Magnusdottir, S.; Pras-Raves, M.; Jans, J.J.M.; Burgering, B.; van Mil, S.; de Ridder, J. MetaboShiny—Interactive processing, analysis and identification of untargeted metabolomics data. bioRxiv 2019. [Google Scholar] [CrossRef]
- Plotly Technologies Inc. Collaborative Data Science. Available online: https://plot.ly (accessed on 27 May 2019).
- Wickham, H. Ggplot2: Elegant Graphics for Data Analysis; Springer International Publishing: Berlin/Heidelberg, Germany, 2016. [Google Scholar]
- Jupyter, P.; Bussonnier, M.; Forde, J.; Freeman, J.; Granger, B.; Head, T.; Holdgraf, C.; Kelley, K.; Nalvarte, G.; Osheroff, A.; et al. Binder 2.0—Reproducible, interactive, sharable environments for science at scale. In Proceedings of the 17th Python in Science Conference, Austin, TX, USA, 9–15 July 2018; pp. 113–120. [Google Scholar]
- Ram, K. Configure Your R Project for Binderhub Hole Punch. Available online: https://karthik.github.io/holepunch/ (accessed on 8 August 2019).
- Verhoeven, A.; Giera, M.; Mayboroda, O.A. KIMBLE: A versatile visual NMR metabolomics workbench in KNIME. Anal. Chim. Acta 2018, 1044, 66–76. [Google Scholar] [CrossRef]
- Liggi, S.; Hinz, C.; Hall, Z.; Santoru, M.L.; Poddighe, S.; Fjeldsted, J.; Atzori, L.; Griffin, J.L. KniMet: A pipeline for the processing of chromatography-mass spectrometry metabolomics data. Metabolomics 2018, 14, 52. [Google Scholar] [CrossRef]
- Davidson, R.L.; Weber, R.J.M.; Liu, H.; Sharma-Oates, A.; Viant, M.R. Galaxy-M: A Galaxy workflow for processing and analyzing direct infusion and liquid chromatography mass spectrometry-based metabolomics data. GigaScience 2016, 5, 10. [Google Scholar] [CrossRef]
- Giacomoni, F.; Le Corguillé, G.; Monsoor, M.; Landi, M.; Pericard, P.; Pétéra, M.; Duperier, C.; Tremblay-Franco, M.; Martin, J.-F.; Jacob, D.; et al. Workflow4Metabolomics: A collaborative research infrastructure for computational metabolomics. Bioinformatics 2015, 31, 1493–1495. [Google Scholar] [CrossRef]
- Goecks, J.; Nekrutenko, A.; Taylor, J. Galaxy Team Galaxy: A comprehensive approach for supporting accessible, reproducible, and transparent computational research in the life sciences. Genome Biol. 2010, 11, R86. [Google Scholar] [CrossRef]
- Metabohub National Infrastructure in Metabolomics and Fluxomics. Available online: https://www.metabohub.fr/home.html (accessed on 1 August 2019).
- Guitton, Y.; Tremblay-Franco, M.; Le Corguillé, G.; Martin, J.-F.; Pétéra, M.; Roger-Mele, P.; Delabrière, A.; Goulitquer, S.; Monsoor, M.; Duperier, C.; et al. Create, run, share, publish, and reference your LC-MS, FIA-MS, GC-MS, and NMR data analysis workflows with the Workflow4Metabolomics 3.0 Galaxy online infrastructure for metabolomics. Int. J. Biochem. Cell Biol. 2017, 93, 89–101. [Google Scholar] [CrossRef]
- Workflow4metabolomics Referenced W4M Histories | Workflow4metabolomics.org. Available online: https://workflow4metabolomics.org/referenced_W4M_histories (accessed on 1 August 2019).
- Goble, C.; Cohen-Boulakia, S.; Soiland-Reyes, S.; Garijo, D.; Gil, Y.; Crusoe, M.R.; Peters, K.; Schober, D. FAIR Computational Workflows; Zenodo: Genève, Switzerland, 2019. [Google Scholar] [CrossRef]
- Wilkinson, M.D.; Dumontier, M.; Aalbersberg, I.J.J.; Appleton, G.; Axton, M.; Baak, A.; Blomberg, N.; Boiten, J.-W.; da Silva Santos, L.B.; Bourne, P.E.; et al. The FAIR Guiding Principles for scientific data management and stewardship. Sci. Data 2016, 3, 160018. [Google Scholar] [CrossRef] [Green Version]
- Eddelbuettel, D.; François, R. rcpp: Seamless R and C++ Integration. J. Stat. Softw. 2011, 40, 1–18. [Google Scholar] [CrossRef]
- Haug, K.; Salek, R.M.; Conesa, P.; Hastings, J.; de Matos, P.; Rijnbeek, M.; Mahendraker, T.; Williams, M.; Neumann, S.; Rocca-Serra, P.; et al. MetaboLights—An open-access general-purpose repository for metabolomics studies and associated meta-data. Nucleic Acids Res. 2013, 41, D781–D786. [Google Scholar] [CrossRef]
- Sud, M.; Fahy, E.; Cotter, D.; Azam, K.; Vadivelu, I.; Burant, C.; Edison, A.; Fiehn, O.; Higashi, R.; Nair, K.S.; et al. Metabolomics Workbench: An international repository for metabolomics data and metadata, metabolite standards, protocols, tutorials and training, and analysis tools. Nucleic Acids Res. 2016, 44, D463–D470. [Google Scholar] [CrossRef]
- Saghatelian, A.; Trauger, S.A.; Want, E.J.; Hawkins, E.G.; Siuzdak, G.; Cravatt, B.F. Assignment of endogenous substrates to enzymes by global metabolite profiling. Biochemistry 2004, 43, 14332–14339. [Google Scholar] [CrossRef]
- Balcke, G.U.; Bennewitz, S.; Bergau, N.; Athmer, B.; Henning, A.; Majovsky, P.; Jiménez-Gómez, J.M.; Hoehenwarter, W.; Tissier, A. Multi-Omics of Tomato Glandular Trichomes Reveals Distinct Features of Central Carbon Metabolism Supporting High Productivity of Specialized Metabolites. Plant Cell 2017, 29, 960–983. [Google Scholar] [CrossRef] [Green Version]
- Gray, A.J.G.; Goble, C.A.; Jimenez, R. Bioschemas: From Potato Salad to Protein Annotation. In ISWC 2017 Posters & Demonstrations and Industry Tracks (ISWC-PD-Industry); CEUR-WS.org: Aachen, Germany, 2017. [Google Scholar]
- Attempt to Add BioSchemas.org JSON-LD to the Vignette HTML Bridgedb/BridgeDbR@40e741a GitHub. Available online: https://github.com/bridgedb/BridgeDbR/commit/40e741aed77765572e77f84f9fea0e0fb511d3f0 (accessed on 30 July 2019).
- Added Template for BioSchemas Tool Annotation by Egonw Pull Request #25 Bioconductor/Bioconductor.org GitHub. Available online: https://github.com/Bioconductor/bioconductor.org/pull/25 (accessed on 30 July 2019).
- Collberg, C.; Proebsting, T.A. Repeatability in computer systems research. Commun. ACM 2016, 59, 62–69. [Google Scholar] [CrossRef]
- Taschuk, M.; Wilson, G. Ten simple rules for making research software more robust. PLoS Comput. Biol. 2017, 13, e1005412. [Google Scholar] [CrossRef]
- Stanstrup, J.; Broeckling, C.D.; Helmus, R.; Hoffmann, N.; Mathé, E.; Naake, T.; Nicolotti, L.; Peters, K.; Rainer, J.; Salek, R.; et al. The MetaRbolomics Book. Available online: https://rformassspectrometry.github.io/metaRbolomics-book/ (accessed on 10 September 2019).


© 2019 by the authors. Licensee MDPI, Basel, Switzerland. This article is an open access article distributed under the terms and conditions of the Creative Commons Attribution (CC BY) license (http://creativecommons.org/licenses/by/4.0/).
Share and Cite
Stanstrup, J.; Broeckling, C.D.; Helmus, R.; Hoffmann, N.; Mathé, E.; Naake, T.; Nicolotti, L.; Peters, K.; Rainer, J.; Salek, R.M.; et al. The metaRbolomics Toolbox in Bioconductor and beyond. Metabolites 2019, 9, 200. https://0-doi-org.brum.beds.ac.uk/10.3390/metabo9100200
Stanstrup J, Broeckling CD, Helmus R, Hoffmann N, Mathé E, Naake T, Nicolotti L, Peters K, Rainer J, Salek RM, et al. The metaRbolomics Toolbox in Bioconductor and beyond. Metabolites. 2019; 9(10):200. https://0-doi-org.brum.beds.ac.uk/10.3390/metabo9100200
Chicago/Turabian StyleStanstrup, Jan, Corey D. Broeckling, Rick Helmus, Nils Hoffmann, Ewy Mathé, Thomas Naake, Luca Nicolotti, Kristian Peters, Johannes Rainer, Reza M. Salek, and et al. 2019. "The metaRbolomics Toolbox in Bioconductor and beyond" Metabolites 9, no. 10: 200. https://0-doi-org.brum.beds.ac.uk/10.3390/metabo9100200