A Table-Top Pilot Experiment for Narrow Mass Range Light Cold Dark Matter Particle Searches


Department of Physics, Faculty of Science, Jazan University, Gizan 45142, Jazan, Saudi Arabia
Universe 2020, 6(2), 28; https://0-doi-org.brum.beds.ac.uk/10.3390/universe6020028
Submission received: 7 January 2020
/
Revised: 28 January 2020
/
Accepted: 29 January 2020
/
Published: 3 February 2020
(This article belongs to the Special Issue Dark Matter and Dark Energy: Particle Physics, Cosmology, and Experimental Searches)
Abstract
:This report presents the detection framework and a proposal for a pilot table-top experiment (supported by simulations and preliminary test results) for adoption into narrow mass range light Cold Dark Matter (CDM) searches, specifically for axions or Axion-Like Particles (ALPs) in a resonant cavity-based scheme. The novelty of this proposal lies in an attempt to concentrate searches corresponding to specific axion masses of interest (coinciding with recent proposals), using multiple cavities in a symmetric scheme, instead of using noisy and complicated tuning mechanisms, and in reduction of associated hardware by employing simpler underlying instrumentation instead of heterodyne mode of detection, by means of a low-noise ac amplification and dc phase-sensitive detection scheme, in order to make a viable and compact table-top experiment possible. These simplifications could possibly be valuable in substantially reducing detection hardware, experiment complexities (and associated noise) and long run-times, while maintaining low noise similar to conventional axion searches. The feasibility of proposed scheme and the experiment design are demonstrated with some calculations, simulations and preliminary tests with artificial axion signals injected into the cavities. The technique and ideas reported here have significant potential to be developed into a small-scale table-top, narrow-range, dark matter axion/ALP spectroscopy experiment, in addition to aiding in the on-going resonant cavity-based and broadband experiments.
1. Introduction
The current understanding of the beginnings and evolution of our universe is based on the ΛCDM model, based on strong theoretical motivations and compelling observations. Dark matter (DM) thus constitutes a cornerstone of the current model of cosmology and in the large scale structure of the universe. Cold dark matter (CDM) [1] has been suggested as the dominant form of this hypothetical matter present in the universe, with axions (A0) [2,3] being the most plausible candidates constituting it. Initially suggested in the late 70s as an emergent solution to the Peccei-Quinn broken symmetry U(1)PQ [4] in the theory of Quantum Chromodynamics (QCD), these pseudoscalar Nambu-Goldstone-like bosons were posited to be constituent particles of the dark matter. Axions are believed to have small masses and extremely weak coupling to ordinary matter and radiation, and their phenomenological origins lie in the vacuum re-alignment of the field (θ) at or around the onset of QCD phase transition while lying in a minimum of the (so-called ‘Mexican hat-like’) U(1) potential [5,6]. Soon, axions emerged as one of the significant constituents of our universe within the framework of string theory as well, whereby it was suggested that a large number of dark matter axions may either be produced from compactification of strings and domain walls that slowly decay into an ensemble of background cosmic axions, or produced as a result of topological defects after the onset of inflation [7,8,9].
Axions therefore enjoy substantial credence for being constituent particles of the CDM (along with the “dark photons” and weakly interacting massive particles, or WIMP’s) and their detection is very important to our correct understanding of the universe and its underlying structure.
A majority of the axionic candidates was excluded by a number of experimental searches and astrophysical observations, however a form, known as the “invisible axions” [10,11,12] has hitherto sustained undiminished significance. The invisible axions, and possible other fields with similar attributes, often named as axion-like particles (ALP’s), are an important element of all the contemporary cold dark matter models. There are many experiments and searches going on all over the world looking for this kind of matter, following both the broadband and resonant approaches [13] to their detection. However, owing to very little masses and even lower kinetic energies of such axions, the direct searches are precluded and indirect search techniques are sought as a better alternative. These include methods borrowed from QED, such as resonant or broadband radio frequency signal detection in high-finesse cavities of various geometries.
Owing to their origins within the theory of QCD, axions share a number of underlying symmetries with neutral pions and hence exhibit many similarities to the latter. They can couple to both fermions and bosons mediated by strong or electromagnetic interactions, respectively, including a two-photon interaction in the case of latter.
Axions are electrically neutral and pseudoscalar bosons and the interaction Lagrangian for the coupling of an axion to a pair of photons has a form:
where is the axion field, is the electromagnetic field tensor and its dual, and are the electric and magnetic fields, respectively, and is the axion-two-photon coupling which may be expressed as:
With as the fine structure constant of electromagnetism, z the ratio of the up and down quark masses, and being the energy scale at which the Peccei-Quinn symmetry breaks (which is also the axion decay constant), the seemingly unfamiliar factors E and N are the consequent electromagnetic U(1) and color SU(3) anomalous axial currents associated with the axion production. The form of this coupling has deep connections with the hadronic origins of axions, especially in the mixing of wavefunctions of the up, strange and down quarks, with those of the axions, which enables axions to couple to photons. Thus, the photon-axion system becomes a pseudo-resonant state which undergoes oscillations, analogous to the well-understood neutrino oscillations and neutrino flavor mixings.
One may write the axion-two-photon coupling in a compact form as:
The form of is explained by two widely accepted models [2,3], the Kim-Shifman-Vainshtein-Zakharov (KSVZ) or “Hadronic axions” model and the Dine-Fischler-Srednicki-Zhitnitskii (DFSZ)or the “Grand Unified Theory”model, which assign values of 0 and −0.97 for KSVZ and 8/3 and 0.39 for DFSZ [10,11,12], to respectively. Similarly, an upper limit of 10−10 GeV−1 has been assigned to the axion-two-photon coupling constant . These values are theoretical estimates based on astronomical observations from various sources, their detailed discussion is beyond this proposal.
The axion decay constant or coupling is an important parameter and its value in turn depends on the axion mass. Within the DFSZ model, its value has been set at a lower limit of 0.8 × 10⁷ GeV (with a corresponding axion mass upper limit of < 0.7 eV), and as per the KSVZ model, it varies between ~1010 to 1011 GeV, corresponding to a mass range between 10−5 to 10−4 eV [10,11,12].
Leaving aside all the well-established experimentally known constants, the axion decay constant/coupling emerges as the most important factor (and unknown) which determines both the axion mass and the coupling strength of axions to photons. Axions are essentially massless, an effective mass is endowed to them after symmetry breaking by the virtue of instanton effects in the QCD vacuum, analogous to the Higgs mechanism and the creation of other pseudoscalar Nambu-Goldstone bosons. Axion mass () is the second most important and related parameter which originates after symmetry breaking in QCD as a function of the PQ symmetry breaking scale, . The origins of axion mass and its scale are also dependent on the temperature scale of the primordial universe and whether the onset of U(1)PQ symmetry breaking preceded the inflation era or followed later. The discussion is beyond the scope of this report and is deferred to existing established treatises on the subject (cf, for instance [1,2,3,13]).
Following the original axion proposals by Weinberg and Wilczek in late 70’s, soon it was shown by Raffelt and Stodolsky [14] that photons can undergo a mixing with light scalar, pseudoscalar or even vector bosons under a two-photon vertex coupling in the presence of non-trivial magnetic fields, whereas Sikivie [15,16,17], taking the specific case of axions, suggested that the probability of axion coupling to photons may be maximized (in vacuo) in the presence of strong magnetic fields, exploiting the inverse of the well-known Primakoff effect. Van Biber et al. [18] proposed a laboratory experiment to produce and detect these and similar light neutral pseudoscalar bosons which could couple to two photons.
As per the Sikivie’s proposal, the interaction of an axionic field (a) with a photon is mediated by means of the axion’s two-photon vertex under a meson-like coherent inverse Primakoff process (as illustrated by a Feynman diagram in Figure 1):
In the presence of a high-intensity magnetic field, the aforementioned coupling is associated with a small momentum transfer (q) and the interaction remains coherent over a large distance [15], which enables the coupling to take the form of an axion-photon oscillation in analogy to the neutrino flavor mixing oscillations. It then becomes highly probable for such a process to be experimentally detected with sufficiently strong magnetic fields and sensitive measurement techniques.
Since then, there have been a myriad number of axion searches from the sun and galactic sources going on in the past two decades, for example the ADMX experiment [19], whereby a resonant cavity housed in a strong magnetic field is tuned to a specific frequency (corresponding to the axion mass of interest) by a tuning mechanism and a heterodyne RF detection scheme is used to detect any possible resonant signals arising from the cavity beyond the noise floor of the detection system. This is a low-temperature and extremely low-power quantum measurement, similar to cavity Quantum Electrodynamics (cQED) regime of experiments (and a bit similar to quantum computing in some cases), but with involvement of extremely low-power photons. There are some other experiments based on totally disparate principles, for example the MADMAX experiment [20], whereby it is attempted to measure very weak electromagnetic fields arising from axion-led transitions between two non-conducting materials with different refractive indices in a large magnetic field. There has been another class of experiments involving a disparate detection strategy of photon regeneration (also known as the “light shining through walls” experiments) [21], whereby two individual cavities separated by a barrier produce and detect any possible axion-led photons as a result of shining a laser through the barrier. However, till now, no strong signature (with a 5σ or better statistical certainty) has been seen in any of the experiments which could lead us to believe that axions/ALPs, or for that matter, CDM exists.
Building upon similar lines and following similar motivations for axion searches in a resonant cavity scheme, we present here the proposal of a scheme with a few new ideas which might be valuable in creating a pilot table-top experiment for CDM axion or ALP searches. These ideas (and the arguments presented in this report) could also be valuable in on-going cQED axion searches as well.
2. An Axion Model and Detection Framework
The Model
The axion Compton frequency, can be expressed as a function of its mass, as:
A model is presented here for some fixed mass values of axions. The parameters of this model (following both the DFSZ and KSVZ specifications) and detection regimen are enumerated in Table 1. Unlike a variable mass scan range technique (the broadband approach), a fixed axion mass search is devised here, searching only for some chosen values of axion mass which may have high likelihood (in view of excluded regions and a few theoretical suggestions, as shall be discussed later in the discussions section) by repeating the experiment with cavities with dimensions corresponding to the mass of interest. The masses are chosen in a symmetric manner, corresponding to harmonics of the base frequency of an initial mass value.
An arbitrary axion mass value of 11.25 μeV has been chosen to start with, selected from the window of some likely axion mass values, followed by its multiples as 22.5, 33.75, 45, 56.25, 67.5, 78.75, 90, and 112.5 μeV. These mass values correspond to the associated axion Compton frequencies of 2.7, 5.4, 8.1, 10.8, 13.5, 16.2, 18.9, 21.6, 24.3, and 27 GHz, respectively (the initial value f0 and its nine higher harmonics or multiples). However, in view of the exclusion of some of these values by existing experimental searches or cosmological constraints, the initial values to be probed in the proposed experiments are the eight values from 22.5 to 112.5 μeV with an error of ±0.5 μeV (corresponding to frequencies from 5.4 to 27 GHz, respectively, with an error of ±0.12 GHz). Out of these, four values, viz. 22.5, 56.25, 90 and 112.5 μeV, are chosen for a pilot experiment to probe, as our chosen values for an axion or ALP particle, if at all it exists. However, these values are just some chosen ad hoc values (however, in a symmetric manner), which we believe may have strong likelihood for coupling to an axionic/ALP field, but any other values may also have equal likelihood within the mass windows suggested by various theoretical estimates.
As suggested by contemporary cosmological models, the overall galactic dark matter density around earth () is estimated at values such as 0.1143 to 0.12 [22,23,24] (where h is the Hubble parameter), although it is possible that it may have a higher value if dark matter has more profound abundance. Based on those models, we choose a unanimously accepted and recent value of ~0.3 ± 0.1 GeV·cm−3 [25] as the total DM density for our model.
The average contribution of axions to the overall DM density is estimated at [15]:
Using the inverse relation between and , this can be alternatively expressed as:
Thus, the corresponding axion density around the Earth for our suggested axion mass window is approximately on the order of:
An axion with mass and momentum incident on an earth-bound terrestrial detector, whether in the form of a purported “axion wind” or as part of a surrounding galactic halo, would have a Lorentz-boosted total energy (with ):
We assume the velocity and direction of axions coming from the galactic halo to Earth as ms−1 in orthogonal direction.
Most of the energy content of the axion is concentrated in its mass and a small value is carried by its kinetic energy.
An important factor to consider here is a dispersion in the axion kinetic energy owing to the time-dependent velocity dispersion () of axions coming from the galactic halo and reaching a terrestrial detector. The axion velocities are thus expected to follow an appropriate velocity distribution profile, an important variable to be taken care of in realistic calculations.
The probability of axion photonic decay in a magnetic field () under an inverse coherent Primakoff effect, can be written down in a generic form, as per Sikivie’s model, as:
Here, is the Lorentz-boosted velocity for the axions, l is the length of the detector, and is the axion-photon momentum transfer (which is in vacuo). The last term expresses the degree of coherence between the two particle wavefunctions involved with the axion-photon conversion and is constant for a fully-coherent conversion. Assuming a coherent conversion and weak coupling of axions, one can appreciate from Equation (10) that the probability for the axion-two-photon conversion is quite small and the most significant factors contributing to it are the axion coupling, detector length and the ambient magnetic field.
The power registered within the cavity for a particular mode () may be expressed as:
This is the most important expression in any cavity-based axion search, as it gives an estimate of the powers involved with an axion signal. Here V and QL are the cavity volume and loaded Quality factor, respectively, and is the cavity axion-photon coupling form factor (normalized to 1) which determines the coupling of an axion to a particular mode of the electromagnetic field within the cavity.
The second most important factor other than power is the Signal to Noise Ratio (SNR) of any measurement scheme.
The SNR of a radiometer, or a microwave signal measurement scheme, can be estimated by an adapted form of the Dicke Radiometer Equation [26]:
Here, P refers to the signal power (as expressed in the Equation (12)), T the collective physical noise temperature of the system (which is a sum of the ambient, amplifier and post-amplification signal processing stages temperatures), t the integration time (i.e., the time over which a measured sample is averaged) and Δf the integrated bandwidth (i.e., the measurement bandwidth, over which a single measurement is made). This equation is simply a consequence of the Central Limit theorem which specifies how the noise temperature measurement uncertainty scales with the square root of the number of samples. Thus, SNRs can significantly be improved by integration over long periods of time, often recovering an otherwise impossible signal which lies beneath the noise floor baseline of a measurement scheme. Typically, the integration time is on the order of minutes and it is set between 103 to 104 for our experiments. The integrated bandwidth is on the order of few KHz (which is 20 KHz in our data acquisition system, as set by the system parameters and our DAQ). The expected SNR for axion searches is normally taken as equal to greater than 5, which is a challenge, especially for the DFSZ model axion searches. However, after long integration times, it is possible to achieve SNRs of up to 10 in realistic conditions. This is a great advantageous factor to overcome hardware limitations in axion, or any weak quantum measurement, schemes.
Figure 2a illustrates our theoretical estimation of power from both KSVZ and DFSZ axion events, plotted above the noise floor, arising from the cavity detector, for a range of center frequencies of 2.7, 5.4, and 8.1 GHz in our model, whereas Figure 2b provides the corresponding raw signal to noise ratios (SNRs) based upon the radiometer formula (without any signal processing or integration). This gives a rough measure of the difficulties faced with detecting true axionic events and heralds the need for unconventional detection techniques.
Based on the Equations (10)–(12), the tenet of resonant cavity detection schemes, in general, is to couple an incoming axion to a resonant electromagnetic mode (ϕρz) in a carefully chosen volume of a high Q-factor cavity, permeated by a strong and highly uniform magnetic field, while working at low physical temperatures and taking a large number of samples, over a sufficient (but not too large) a bandwidth. Such a strategy may, in principle, facilitate the resonant detection of an axion-photon conversion event beyond the thermal noise. Although the axion signal power depends on a multitude of factors, it has substantial dependence on the strength and uniformity of the ambient magnetic field, the resonant frequency mode and cavity properties (such as volume, finesse and form factor). It is important to note, however, that the loaded Q factor of cavity (QL) cannot be much larger than the axion signal quality factor (Qa) within the cavity [27] (the two are typically expected to be on the order of approximately 105 to 106). The secondary factors which aid in the detection strategy are signal processing and analysis techniques, which lie in the domain of software.
In a similar fashion, we attempt to measure a resonant frequency weak signal corresponding to a probable axion-two-photon conversion. An overview of our proposed experiment, which is a based upon the conventional Primakoff effect-based resonant cavity axion detection experiments, is illustrated in Figure 3a. A resonant cavity made with copper or niobium, with a center frequency corresponding to the axion mass of interest, is enclosed in a cryostat under the influence of a strong solenoidal magnetic field to facilitate the conversion of an incident axion into a photon. Since we probe pre-defined frequencies corresponding to specific axion masses, there is no tuning mechanism involved, thus substantial noise and interference are reduced (in addition to a lot of hardware burden). Any possible photon arising from an axionic conversion within the cavity is detected by an antenna (here we have devised a special tuning fork antenna geometry). The ultra-weak signal is amplified by a three-stage cryogenic amplification cascade which increases the signal power to be read out by a conventional data acquisition and read-out scheme. Figure 3b provides a coarse, false-color, visualization of the z-axis electric field vector component distribution in the cavity, based on a usual Finite-Element simulation, over which a cartoon of a magnetic field-mediated axion field’s conversion into a photon (γ) going outward is depicted.
In order to assess the form of axionic signals in cavity and intrinsic noise, including its spectral distribution in the frequency range of our interest, some calculations were performed and simulations were carried out. A 15,000-point simulation was written in a computer program and results were accumulated in a data file.
3. The Experiment
3.1. Detection Scheme
Similar to the conventional resonant cavity axion detection instruments, the central part of our experiment is a resonant cavity which provides an environment to facilitate the resonant conversion and detection of an axion/ALP event. The cavities proposed here and being tested are 1.0–2.1 cm radius and 24–50 cm long cylindrical geometries made with 0.3 mm thick oxygen-free 99.99% high-purity copper, with an aim to support the TM010 modes (which accord the maximal form factor in a cylindrical geometry setting). However, we are contemplating cavities of other geometries, especially toroidal cavities, which may possibly have advantages over the existing geometries used in axion searches. There is a separate cavity for each frequency (axion mass of interest) as per our model, starting from 5.4 GHz to 27 GHz, and individual experiments are carried out for each frequency. As illustrated in Figure 7, a special glass cryostat with stainless steel mounting rods and brackets holds the cavity in its center with liquid nitrogen/helium running around the perimeter of the cavity, cooling the cavity and antenna-JPA-detector assembly. A specially-made magnetic-field free capsule mounts the antenna, JPA and detectors on one of the cavity end-caps (via a waveguide), while isolating them from the magnetic field.
Once the antenna and waveguide are mounted, a loaded Q factor of around 1 × 10⁵ is expected to be achieved with special interior polishing by means of procedures as reported earlier [28]. The cavity is surrounded by a LN2-cooled superconducting solenoid which provides a highly uniform (ΔB/B~1 ppb) and homogenous field throughout the interior of cavity. For practical reasons, the magnet sought for the proposed experiments is a 8.0 T solenoid, however much higher intensity magnets are commercially available now up to 40.0 T. In our previous studies [28] Hallbach geometry magnet designs were incorporated, but due to limitations on possible intensities and uniformity, they were abandoned.
The detection system architecture comprises three main stages, as has already been illustrated in Figure 3. Figure 8 expands on this architecture, illustrating the electronics and instrumentation involved with the experiment in detail. The experiment has three distinct temperature stages, 20 mK, 4 K and 290 K, which are all operated on batteries, without resorting to ac power to reduce mains noise and other electromagnetic interferences. The measurement equipment and computers are all at room temperature, operated on 220 V ac mains supply. For test purposes, the cavities and amplifiers are all kept in a class I solid copper Faraday cage, covered with a special RF protection fiber canopy (Aaronia GmBH, Strickscheid, Germany). The lock-in amplifier, signal generators and DAQ are also kept in isolated cabinets covered with aluminum foil and ant-EMI fiber canopies. All possible measures are taken to minimize EMI and RF noise in our test procedures and in the acquisition of preliminary results reported here.
The first stage in signal processing and acquisition cascade comprises a special tuning fork antenna coupled to the cavity (shown here as a lumped LC circuit) which is in turn coupled to a narrow-band microwave Josephson Parametric Amplifier (JPA) [29] comprising a network of two (or possibly four) dc SQUIDs as per our preliminary design. An external waveguide housing the antenna and connected to the cavity may be incorporated for impedance matching between the two.
A Josephson Parametric Amplifier (JPA) is a non-linear phase-sensitive amplification device which carries out parametric amplification of an ultra-weak signal around its resonance frequency by varying one of its parameters. Since a JPA offers one of the most sensitive non-dissipative detection regimens at the single-photon level available today for ultra-weak microwave detection, it is the most feasible, and at the same time most critical stage, of the detection scheme and pivotal to its success. The particular design we propose to employ is a ‘degenerate’ Josephson amplifier design [30], an amplifier which could possibly work with the true quantum character of radiation, by the virtue of its ability to work with squeezed states. Such a device is useful in amplifying a signal by adding less quadrature of intrinsic noise to its output than that of the intrinsic electromagnetic fluctuations in the quantum vacuum, while at the same time providing sufficient gain (within a limited bandwidth).
The parametric amplifier we contemplate is designed around a pair of Superconducting QUantum Interference Devices (SQUIDs), less than one wavelength apart from our center frequency, and each comprising two Josephson junctions, similar to the designs reported earlier [31,32]. Such designs have claimed an efficient 42% squeezing of 4.2 K thermal noise with a noise temperature of 0.28 K and a gain of around 12 dB. Another viable design in this direction is one reported elsewhere [33] involving a Josephson Traveling Wave parametric amplifier (JTWA) architecture that offers high-gain and low-noise detection at the level of single photons. All these ideas and technologies seem to be a good starting point towards making an ideal weak-measurement, quantum-limited and squeezed state single-photon parametric amplifier for axion detection. Although at this point it is not possible for us to develop a highly-advanced four-SQUID single photon detection amplifier, such a facility would be extremely valuable. The JPA design is in progress and has not been implemented in the experiment so far.
The signal obtained from the JPA (or the tuning fork antenna at the moment) is ac-coupled to a carefully-designed amplification circuit made around a resonant tunneling diode (RTD) and some passive components before conveying the signal to the HEMT amplification stage. So far, we have successfully employed commercially available RF tunnel diodes at the LNA input as a low-noise resonance detection and amplification device [34], owing to their negative conductance region, high-speed amplification, low-temperature operation and fast resonant tunneling of electrons, however, in the next stage we propose to use an RTD coupled to the HEMT stage. Tunnel diodes and RTD’s [35,36] have been used in high-frequency microwave amplification, with potential for utility up to mm wave (THz) range. Recent studies involving quantum barrier RTD structures, fabricated using Al(x)Ga(1-x)As:GaAs:Al(x)Ga(1-x)As materials, support frequencies from 5 to about 35 GHz [37], which coincides with our region of interest. Novel GaAs/AlGaAs RTD heterostructures with higher sensitivities have been reported in literature which involve a quantum well in the middle [38]. Integrated RTD-HEMT devices have also been demonstrated by incorporating an HEMT junction with electron injection from a RTD structure at the gate [39]. We propose a similar custom-made structure to be incorporated in our design to achieve a gain of around 30–40dB using a combo cryogenic RTD-HEMT device.
Working in tandem with TD/RTD, a number of extremely high-Q and low-loss microwave-grade passive components, including a pair of GaAs varicaps (Varactor Diodes), capacitors and inductors are an important part of this scheme, which we have so far achieved success with in detecting weak microwave signals around frequencies of interest (~5 GHz).
Following the RTD stage, a pair of matched cryogenic ultra-low-noise amplifiers, working in parallel, further amplify the acquired signal while adding negligible noise. The second stage consists of a traditional room-temperature high-electron mobility transistor (HEMT) (which are a kind of heterogeneous field effect transistors, or HFETs) low-noise amplifier (LNA) device connected to a commercial yttrium-iron-garnet (YIG) RF band-pass filter which provides a band-pass filtered output to an RF detector, which together endeavor to provide highest possible gain (while keeping noise temperature to minimum) to considerably increase the signal power to be detected by the detection scheme. Our current design uses a Low-Noise Factory (Goteborg, Sweden) LNF-LNC1.5_6A, a 27 dB gain 1.9 K noise temperature device, but in the next stage it would be replaced with a lower noise temperature device, such as LNF-LNC2_4A which offers a higher gain of 38 dB at a typical noise temperature of 1.2 K. Both the cryogenic as well as the room-temperature low-noise-amplifiers are based upon the usual HEMT architectures, implemented in the form of commercial monolithic microwave integrated circuits (MMICs), the working details and designs of these devices in microwave amplification and resonance detection have been discussed elsewhere [28]. Since the quantum limit happens at around 48 mK/GHz, our amplification scheme presents about 259 mK quantum noise temperature for probing an axion mass window of around 22–23 μeV.
The next stage after amplification and filtering is detection of microwave signals, based upon a commercial RF detector. This detector is a high-precision square power law detector of Schottky barrier diode (SBD)-monolithic architecture, offering high responsivity and low noise. RF detectors made with barrier diodes offer high sensitivity noise equivalent power (N.E.P.) and they are a set of devices which can detect the lowest detectable microwave signal power. There is a caveat in using such a detector in a resonant scheme that it would detect and convert non-resonant signals in addition to the on-resonance signals of interest, however, by means of the next stage (the lock-in amplifier based PSD detection), the non-resonant signals are eliminated, and only the resonant signals are recovered. We employ here an extremely sensitive and high-precision GaAs planar doped barrier diode detector (8474E, Agilent, Santa Clara, CA, USA), which has so far been satisfactory in our tests. For detection purposes at these higher frequencies, an Agilent/Keysight 8474C/8473D planar-doped barrier diode detector (0.01–33 GHz) will replace the current 12 GHz RF detector. However, in an actual experiment it would be extremely desirable to have a custom-made detector employed to offer highest possible precision.
Following the amplification and detection stages, the third stage comprises a phase-sensitive detection and low-pass filtering of the signal designed around a digital signal processing (DSP) lock-in amplifier (SR865, Stanford Research, Sunnyvale, CA, USA).The basic working principle of a phase-sensitive detection [28] based upon a lock-in amplifier, is to mix (multiply) a time-varying noisy signal with a modulation signal at a carrier frequency, and carrying out a Fourier analysis of the modulated (multiplied) signal and selecting only the in-phase components which appear at the carrier frequency. The phase-sensitive detector decomposes a time-varying voltage signal [V(t)] into an X (in-phase) and y (quadrature) component around a carrier frequency () as:
And produces at its output a voltage corresponding to the product of two sinusoidal waves, one the measured signal (at the center frequency ), and the other the reference signal (at the carrier frequency, );
Which after filtration through a Low-Pass filter leaves a clean dc voltage of maximum amplitude proportional to the signal at every point where the signal frequency () matches the carrier frequency (), as:
In a similar fashion, we multiply the measured signal from the cavity amplifiers with an ultra-low distortion carrier frequency signal, 150 KHz to 1 MHz (maximum), and then subsequently time-average each in-phase sample produced from the LIA output along the time axis and obtain a time averaged series of dc voltages which reproduce the measured signal. Thus, a clean signal average is obtained with substantial SNR improvement and noise reduction. Effectively, one can expect an SNR improvement of around 5 times or more for a raw signal which had poor SNR before. This is the benefit of phase-sensitive detection and time averaging, a quite rudimentary technique in signal analysis.
Monitoring of cryogenic as well as second-stage LNA temperatures and various voltages are carried out using commercial thermometers and digital multi-meters, respectively.
A parallel chain of a commercial low-noise high gain amplifier (LNA3035 LNA module, 40 dB gain, 0.5–0.9 dB NF, for pilot studies RFBay, Inc., Gaithersberg, MD, USA) connected to a 6 GHz spectrum analyzer (Aaronia GmBH HF6060v4), is used for calibration and monitoring purposes with its source, a signal from an Agilent Keysight E8251A 20 GHz RF signal generator (via a 20 dB attenuator). The injected test signals are obtained from either the same signal generator or from external RF sources of low intensity weakly coupled to the cavity and at times outside the cavity.
3.2. Noise Registry:
The total noise temperature of the system is calculated as per a simple expression:
Here, is the system’s physical temperature and is the cavity temperature which takes into account a black-body radiation form of the enclosed quantum vacuum (including the quantum fluctuations at ). is the noise temperature of the first or primary amplifier (which is the JPA in our case), are the noise temperatures of secondary amplifiers (i.e., the cryogenic and room-temperature LNA’s) and are their gains, respectively. For the JPA, once fully implemented, a total noise temperature of around 1.0–1.2 K is expected (operating at 20 mK) while obtaining a gain of around 15–25 dB. With this value, we estimate the total noise temperature of the system within 5 K (excluding the room temperature stages). The individual noise temperatures of each stage, the gains and overall noise overhead of the system are tabulated in Table 2.
Another important factor in noise registry, even at the low temperature regime (~mK) is the quantum partition noise of photon-created electron-hole pairs, a kind of photon-assisted shot noise, owing to the photonic excitation of electrons emitted from a thermal bath. It has been reported elsewhere [40] that approximately 8–10% of the noise associated with the measurement of a quantum system at sub-Kelvin physical temperatures is of this kind, having a form with Jl a Bessel function, and may be reduced by a factor of three by using optimal filtering and increasing the thermal conductance of the cables involved.
We have carried out our tests at liquid nitrogen temperatures of around 70 K, but once we acquire a dilution refrigerator and JPA, the antenna and parametric amplifier shall be mounted on the mixing chamber stage at around 20 mK (in order to achieve the quantum limit of Tsys ~ ma for 5.4 GHz), whereas the SRH and post-amplification stages are at the top chamber of the dilution refrigerator at a temperature of 4 K. For the resonant frequency of 5.4 GHz, the Johnson noise at 0.020 K ambient temperature and a bandwidth (f) of 20 KHz is estimated around 10−21 W (using ). In terms of the overall measurement accuracy, we expect a total systemic uncertainty of around 10%. Other than effectively minimizing the thermal noise to a nearly negligible order, the other main concern in terms of the total noise registry of the measurement system is the quantum noise associated with high frequencies involved, including the quantum partition noise as discussed above. This kind of noise is inherent with the detection circuitry, which mainly includes the detector and amplifier, and in low-temperature measurements is known to dominate the total noise overhead. It has been proposed elsewhere to use either single-photon detectors or phase-sensitive parametric amplifiers working beyond the standard quantum limit to minimize this [41]. However, in addition to great benefits, they have serious shortcomings and limitations as well, such as intrinsic noise arising from zero-point energy fluctuations which are amplified along with the signal excitations, etc. We propose a similar scheme with a new improvement in the read-out stages by incorporating phase-sensitive detection, which we believe could extend a benefit to overcome the noise inherent with the measurement and compensate for the noise backlog.
4. Preliminary Tests
Over a period of two months, various tests were carried out based on the scheme proposed in this report, working with both room (~300 K) and LN2 (~70 K) physical temperatures, to investigate the resonance detection and measurement capabilities for artificially injected axion signals, especially assessing the noise profile of the signal and associated signal to noise ratio’s.
In order to assess the noise profile of our cavity and measurement scheme, Figure 9 illustrates the raw power spectral density (PSD) in the region of interest of the noise measured from the cavity without any kind of stimulation and in stringent shielding conditions. The outcome is quite satisfactory showing quite small fluctuations in the spectral distribution of measured power.
Figure 10 and Figure 11 illustrate the time-domain detection of 2.5–2.7 GHz Lorentzian-shape signals artificially injected in the cavity as detected by the scheme depicted in Figure 8, excluding the JPA. Signal was picked with the help of our tuning fork antenna mounted in the RF cavity and coupled to the RTD and sensing and routing hub, all kept at LN2 temperatures, and amplified further by 290 K HEMT and RF detector stages. Figure 10 is an instantaneous raw signal as received and displayed by the DSO, thus depicting a true representation of a resonance detection event as registered in the cavity, whereas Figure 11 is a processed form of the signal as generated by the LIA and DAQ, thus depicting higher signal to noise ratio.
Figure 12 and Figure 13 are the frequency-domain spectra of the injected signals as detected by the measurement scheme and produced by our 16-bit precision DAQ, using its Fast Fourier Transform (FFT) spectroscopy software routines. The data received as a function of time is parsed through an online FFT, with a sampling rate of upto 2 MHz (which is sufficient for the analysis of our signal, which bears its maximum component at 300KHz to 1MHz, as per the Nyquist criterion), producing a data set of power as a function of frequencies, which is saved for later analysis and plotting. Based upon the time-domain voltages data in Figure 11, the Figure 12a depicts the 150 KHz carrier frequency peak whereas Figure 12b (inset of Figure 12) depicts its first harmonic, at approximately 300 KHz.
Figure 13 illustrates an overall accumulated view of various batches and data sets depicting detection of resonance within the cavity corresponding to an artificially injected 11.2 eV axion signal, after phase-sensitive detection, filtering and integration, showing a remarkable capability to detect resonance as well as a conspicuous improvement in SNR.
5. Discussion and Conclusions
Axion research has gained momentum and a number of new axion detection searches have been going on all over the world, including resonant cavity-based experiments, each search trying to improve one or more aspects of the Primakoff effect-based axion detection strategy, and setting a new exclusion window for axion mass.
A similar new scheme for the detection of axions under both the KSVZ and DFSZ models has been outlined in this paper. Although based on the conventional resonant cavity-based detection concept (exploiting the inverse Primakoff effect), a few new ideas have been incorporated, such as some useful detection elements to aid in the improvement of associated signal to noise ratio while maintaining the minimum noise, as presented and discussed in this report, with an earnest hope that these ideas are soon developed into a realistic table-top axion experiment.
With the help of the reported scheme in this report and preliminary tests carried out during a span of last six months, we have demonstrated the viability of the proposed scheme especially in the resonant detection for the axion masses of interest in a cavity QED setting. We have obtained a lowest signal detection capability (at liquid nitrogen temperatures ~70 K) of around 10−18 to 10−17 W with a raw signal-to-noise ratio of around 3 (and processed SNR of around 10) for the frequencies from 2.5 to 5.4 GHz, corresponding to axion masses of around 11.2 to 22.5 μeV. Once we integrate the signals over long integration periods we can improve our lowest signal limit to around 10−22 W with SNR of around 10 for the full region of our interest (axion mass up to 112.5 μeV), comparable to a number of microwave signal detection studies carried out at room temperature. Going down to cryogenic temperatures of 20 mK and incorporating a JPA, one could confidently venture down to the measurement capabilities of DFSZ signals down to the order of 10−25 W, using the scheme proposed here. Caldwell et al. (MADMAX collaboration) [42] have reported measuring a 10−21 W signal at a center frequency of 17 GHz using an ordinary HEMT amplifier operating at room temperature (with a 6σ confidence level) in a one week run, with expectations of 100 time better performance at cryogenic temperatures. In a similar manner, we hope to improve our performance after operating at LHe sub-Kelvin temperatures.
So far, we have not taken care of the direction of axion wind and the geographical orientation of our measurement system, however, in actual implementation and data taking, the experiment will have to be oriented as per the flux of incident ‘axion wind’. Hence we propose a movable longitudinal detector cavity cryostat, which can be oriented in any polar or azimuthal angle, as opposed to a fixed vertical setting. With a table-top experiment mounted on a gantry, it would be a trivial task. It is important to consider that the “axion wind” or the flux of incoming axions from our galactic halo or other sources, would have a slight spectral shift (Δf/f) in its manifested frequency, owing to a velocity dispersion. Axions have been suggested to follow a Maxwell-Boltzmannian velocity distribution [10]. There would also be a modulation and anisotropy in their flux over space and time. Thus, an intelligent search would accommodate these factors in detection and analysis, in addition to taking care of detector location and data taking times.
We would like to mention here two important technical factors for an actual axion search. The first of these is the line width of the detection. It is extremely important to obtain a line width of approximately 1–2 MHz in the frequencies of proposed mass range, to obtain a peak covering the full span of cavity centered at the cavity center resonance frequency. Although the maximum bandwidth allowed by JPA and detection stages is 100 MHz, our designs implement a bandwidth of 150 KHz–1 MHz to coincide with maximum cavity line width, owing to limitations of our current precision instruments. With a higher frequency ultra-low distortion signal generator available, we could venture to higher bandwidths. The second factor is the shape of “synthetic axion” injected signal, as coupled to the cavity to simulate the detection for test and calibration purposes. We have so far incorporated a simple Lorentzian shape signal injection scheme corresponding to the axion mass of interest, however an actual simulation would entail a synthetic axion signal shape following the cosmological axion distribution, such as for instance a Maxwellian spectral distribution.
While proposing a detection scheme and an experiment to detect axions of specific fixed mass, we also highlight the possibility of axions with a variable mass distribution, suggesting that axions or axion-like particles may exist in a range of masses, thus having a variable energy content similar to photons. Based upon our calculations and simulations we suggest an axion mass distribution of 56.25 to 146.25 μeV (corresponding to a frequency range of 13.5 to 35.1 GHz) centered at a mean value of 101 μeV + 1.0 μeV, however this may not be limited to this range in actual reality. Experiments will be needed to validate this assumption. As per various theoretical axion models, whether of the scalar, pseudoscalar or vector dark matter nature, axions over a large mass range are possible [43]. Variable mass scheme for cold dark matter, like axions, have been suggested as a plausible mechanism which even favors inflation coupling scenarios [44].
There have been suggestions of values close to our proposed value by various theoretical studies during the last one decade, especially with post-inflationary CDM axion mass beginning with values around 10 to 20 μeV. As per Battye and Shellard [45], with a value of hubble parameter around 0.5, the string theory-based estimates suggest a value of axion mass around 100 μeV. Ballesteros et al. in their review paper [46] have suggested an axion mass of 100 μeV. In two separate studies [47,48], an axion mass range has been suggested around 50–1500 and 50–200 μeV, respectively. Khlopov et al. [49] have outlined cosmological constraints for axions and ALP’s not far from the mass range as proposed in this model. Narrower estimates have been suggested around 60–150 μeV in studies by Kawasaki et al. [44], with subsequent improvements in theoretical uncertainty in the involved masses in a recent report by Gorghetto et al. [50]. New cosmological simulations within the framework of a QCD PQ complex scalar field, and optimized for the DM density, also suggest the value of axion mass around 25.2 ± 11.0 µeV [51].
All these estimates support our proposed axion mass range from 22.5 μeV to 111.5 μeV, which is within reach of current technology available in small research laboratories like ours.
On the other hand, based upon the analysis of five different condensed matter experiments data involving a special kind of Josephson junctions, arguments by Beck [52] suggest a mass range of 104 to 110 μeV, not far from our suggested value. In addition, the study suggests the need for more experiments to assess these propositions, especially taking into account the annual modulation (of around 10%) in the Earth’s velocity with respect to the galactic halo, which has a peak in June and minimum in December.
Considerations of important factors encountered by a terrestrial axion detector, such as daily modulation of incident (anisotropic) axion flux and the signal amplitudes from our galactic halo (or other celestial sources), the direction of incidence as well as the rotation of Earth and our solar system with respect to the sources of axion wind, as discussed in detail elsewhere [53,54], are essential elements of a realistic axion detection experiment design, just as spectral broadening and modulation are, as highlighted in this report and elsewhere [13]. These factors are not only important variables of the experiment but also a touchstone for the validity of a true axionic event of celestial source. Similarly, another variable to consider in an Earth-based search is the correlations with Earth’s gravitomagnetic field and it might be important to consider them in a realistic Primakoff effect-based axion/ALP detection system. There have been some measurements made on this field (spin and orbital precessions) [55,56,57] and some experiments are currently underway (cf see for instance, [58]).
In the end, we suggest that one would have to look beyond the current measurement strategies in order to probe the DFSZ region axions, in particular exploiting the recent advancements in quantum metrology. One such way could be, for instance, incorporation of quantum well structure-based detectors, such as quantum well-based HEMT’s, and approaches like artificial qubits and other recent advancements in cirQED [59,60,61]. However, since approaches like qubits and associated hardware would significantly add to the noise overhead and complications in the experiment hardware, it would be imperative to find ways to keep the noise overhead to a minimum. There will have to be a consideration of quantum back action [62], especially a measurement approach which takes into the account back action caused by the detector itself on the measurand and consequent effects on the measurement. It would be important to assess the role back action might play in a realistic axion signal detection. Another problem, as pointed out by the Carugno group [63], is the inadvertent amplification of vacuum fluctuations by the amplification scheme. Any sensitive amplification scheme to detect axions would also amplify the fluctuations of the quantum vacuum which would pose a background similar to axions. In such events, it would be necessary to incorporate some cosmological cuts and analysis of the detected noise to eliminate the background signal corresponding to vacuum fluctuations, if at all it is possible. Otherwise, an altogether different approach would have to be sought other than the customary microwave signal amplification and detection approaches. On the other hand, we argue, what if the fluctuations in the electric field of quantum vacuum can themselves interact with or drive the axion-induced electric fields to higher amplitudes? The quantum fluctuations remain an important factor to consider in axion detection schemes and must not be overlooked. We are currently assessing the role of these fluctuations in our experimental studies.
Similarly, ordinary cylindrical cavity geometries might not be sufficient, novel new methods like re-entrant cavities and torus geometries, which could facilitate resonance effects, could be extremely valuable. However, these measures would pose additional problems in setting up the detectors and magnets.
An important new direction in axion search experiments would be to find novel new ways for ultra-weak single photon detection, such as photon counting. For instance, as reported in a recent study [64], various cavity frequencies can be mapped onto individual states of a qubit by means of a microwave Josephson photomultiplier (JPM), and thus very weak microwave signals can be measured in a cavity, extending the concept of a photomultiplier tube to single photon detection and counting. Raw single-shot photon measurement fidelity of more than 90% was demonstrated in their experiments while preserving the quantum states of the system in a quantum non-demolition (QND) manner. Such methods could offer a viable solution in detecting ultra-weak photons generated as a result of axions in a microwave cavity setting. Additionally, a qubit placed in a microwave cavity while incorporating the effect of quantum back action and a detection scheme which could detect this back action may be useful. Once again, the added noise and complexities in the experiment would be a significant factor to consider in such schemes. There are a number of other recent ideas, including a model which delineates the interaction of an axion field in vacuo with circularly polarized photonic probe fields [65], which may be useful in future axion searches.
We suggest here some humble ideas to advance the current knowledge in axion and cold dark matter particle searches with a hope that they could be helpful in on-going searches, especially in achieving a small footprint table-top experiment. We are confident that once implemented, an experiment devised on these lines as proposed in our scheme, as well as considering the ideas discussed herein, could assist in the detection of axions/ALP’s with sufficient statistical certainty after a run for few months. Another important theoretical idea in place for some time regarding axions is the concept of their ensembles called “axion stars” [66,67,68,69]. It is believed that ensembles of axions can condense into bound states similar to Bose-Einstein Condensates, the so-called axion stars, forming a significant percentage of the cold dark matter in the universe. This further broadens the potential and scope of axion searches.
The importance of an axion solution for the CP violation problem in the QCD provides serious motivations for cosmic axion searches even if axions are a subdominant component of the dark matter. Independent of the existence of the dark matter as a plausible explanation of the galactic rotational velocity curve discrepancies and other astronomical observations, axions have their profound existence as per the QCD and instanton effects, with their roots in both CP violation and strings. It is a search worth continuing for our correct understanding of the quantum fields and matter constituting the universe, independent of a priori assumption of a dark matter in the universe. However, if dark matter exists, as the current cosmological evidence suggests, search for this mysterious field becomes paramount, and in fact quintessential, to our understanding of other particles and fields which constitute our universe.
Supplementary Materials
The following are available online at https://0-www-mdpi-com.brum.beds.ac.uk/2218-1997/6/2/28/s1.
Acknowledgments
Author acknowledges, with great gratitude, valuable discussions with Z. H. Shah, Giovanni Carugno, Maxim Yu Khlopov, Giuseppe Ruoso, Mark Ghorgetto, and Nicholas Crescini, as well as with the able reviewers of the manuscript, which were fruitful in refining the manuscript and updating references to appropriate recent work. I appreciate the valuable discussions and technical assistance by Mahlon Long at the US Jefferson National Laboratory & Accelerator Facility, Newport News, VA, USA, in making the RF cavities and solving associated problems. I wish to thank the Jazan University for its support in establishing my laboratory (The JU Research Laboratory of Low-Level Quantum Measurements at the Department of Physics, Faculty of Science, JU) where this work was carried out.
Conflicts of Interest
The author declares no conflict of interest regarding the publication of this paper.
References
- Seigar, M.S. The Dark Matter in the Universe. In Cold Dark Matter, Hot Dark Matter, and Their Alternatives; Morgan and Claypool: San Rafael, CA, USA, 2015. [Google Scholar]
- Marsh, D.J.E. Axion cosmology. Phys. Rept. 2016, 643, 1–79. [Google Scholar] [CrossRef]
- Visinelli, L.; Gondolo, P. Dark matter axions revisited. Phys. Rev. D 2009, 80, 035024. [Google Scholar] [CrossRef] [Green Version]
- Peccei, R.D.; Quinn, H.R. CP Conservation in the Presence of Instantons. Phys. Rev. Lett. 1977, 38, 1440. [Google Scholar] [CrossRef] [Green Version]
- Wilczek, F. Problem of Strong p and t Invariance in the Presence of Instantons. Phys. Rev. Lett. 1978, 40, 279. [Google Scholar] [CrossRef]
- Berezhiani, Z.G.; Khlopov, M.Y. Cosmology of spontaneously broken gauge family symmetry with axion solution of strong CP-problem. Z. Phys. C Part. Fields 1991, 49, 73. [Google Scholar] [CrossRef]
- Svrcek, P.; Witten, E. Axions in string theory. J. High Energ. Phys. 2016, 2016, 051. [Google Scholar] [CrossRef] [Green Version]
- Arvanitaki, A.; Dimopoulos, S.; Dubovsky, S.; Kaloper, N.; March-Russell, J. String axiverse. Phys. Rev. D 2010, 81, 123530. [Google Scholar] [CrossRef] [Green Version]
- Visinelli, L.; Vagnozzi, C. Cosmological window onto the string axiverse and the supersymmetry breaking scale. Phys. Rev. D 2019, 99, 063517. [Google Scholar] [CrossRef] [Green Version]
- Raffelt, G.G.; Rosenberg, L.J. Axions and other similar particles. Phys. Rev. D 2012, 86, 010001. [Google Scholar]
- Tanabashi, M.; Hagiwara, K.; Hikasa, K.; Nakamura, K.; Sumino, Y.; Takahashi, F.; Tanaka, J.; Agashe, K.; Aielli, G.; Amsler, C.; et al. Review of Particle Physics. Phys. Rev. D 2018, 98, 030001. [Google Scholar] [CrossRef] [Green Version]
- Cadamuro, D. Cosmological limits on axions and axion-like particles. arXiv 2012, arXiv:1210.3196. [Google Scholar]
- Kahn, Y.; Safdi, B.R.; Thaler, J. Broadband and resonant approaches to axion dark matter detection. Phys. Rev. Lett. 2016, 117, 141801. [Google Scholar] [CrossRef]
- Raffelt, G.; Stodolsky, L. Mixing of the photon with low-mass particles. Phys. Rev. D 1988, 37, 1237. [Google Scholar] [CrossRef] [Green Version]
- Sikivie, P.; Tanner, D.B.; van Bibber, K. Resonantly enhanced axion-photon regeneration. Phys. Rev. Lett. 2007, 98, 172002. [Google Scholar] [CrossRef] [Green Version]
- Sikivie, P. Axion Cosmology. Lect. Notes Phys. 2008, 741, 19–50. [Google Scholar]
- Gondolo, P.; Visinelli, L. Axion cold dark matter in view of BICEP2 results. Phys. Rev. Lett. 2014, 113, 011802. [Google Scholar] [CrossRef] [Green Version]
- Van Bibber, K.; Dagdeviren, N.R.; Koonin, S.E.; Kerman, A.K.; Nelson, H.N. Proposed experiment to produce and detect light pseudoscalars. Phys. Rev. Lett. 1987, 59, 759. [Google Scholar] [CrossRef] [Green Version]
- Asztalos, S.J.; Carosi, G.; Hagmann, C.; Kinion, D.; Van Bibber, K.; Hotz, M.; Rosenberg, L.J.; Rybka, G.; Hoskins, J.; Hwang, J.; et al. SQUID-based microwave cavity search for dark-matter axions. Phys. Rev. Lett. 2010, 104, 041301. [Google Scholar] [CrossRef] [Green Version]
- Majorovits, B. MADMAX: A new road to axion dark matter detection. J. Phys. Conf. Ser. 2017, 1342, 012098. [Google Scholar] [CrossRef]
- Redondo, J.; Ringwald, A. Light shining through walls. Contemp. Phys. 2011, 52, 211–236. [Google Scholar] [CrossRef]
- Ade, P.A.; Aghanim, N.; Arnaud, M.; Ashdown, M.; Aumont, J.; Baccigalupi, C.; Banday, A.J.; Barreiro, R.B.; Bartlett, J.G.; Bartolo, N.; et al. [Planck Collaboration] Planck 2015 results-xiii. cosmological parameters. Astron. Astrophys. 2016, 594, A13. [Google Scholar] [CrossRef] [Green Version]
- Bae, K.J.; Huh, J.H.; Kim, J.E. Update of axion CDM energy density. J. Cosmol. Astropart. Phys. 2008, 2008, 005. [Google Scholar] [CrossRef]
- Di Luzio, L.; Mescia, F.; Nardi, E. Window for preferred axion models. Phys. Rev. D 2017, 96, 075003. [Google Scholar] [CrossRef] [Green Version]
- Read, J.I. The local dark matter density. J. Phys. G: Nucl. Part. Phys. 2014, 41, 063101. [Google Scholar] [CrossRef] [Green Version]
- Dicke, R.H. The measurement of thermal radiation at microwave frequencies. In Classics in Radio Astronomy; Springer: Dordrecht, The Netherlands, 1946; pp. 106–113. [Google Scholar]
- McAllister, B.T.; Flower, G.; Ivanov, E.N.; Goryachev, M.; Bourhill, J.; Tobar, M.E. The ORGAN experiment: An axion haloscope above 15 GHz. Phys. Dark Universe 2017, 18, 67–72. [Google Scholar] [CrossRef] [Green Version]
- Bukhari, M.H.S.; Shah, Z.H. An Experiment and Detection Scheme for Cavity-Based Light Cold Dark Matter Particle Searches. Adv. High Energy Phys. 2017, 2017, 6432354. [Google Scholar] [CrossRef]
- Roy, A.; Devoret, M. Introduction to parametric amplification of quantum signals with Josephson circuits. C.R. Phys. 2016, 17, 740–755. [Google Scholar] [CrossRef]
- Beltran, M.A.C. Development of a Josephson Parametric Amplifier for the Preparation and Detection of Nonclassical States of Microwave Fields. Ph.D. Thesis, University of Colorado at Boulder, Boulder, CO, USA, 2010. [Google Scholar]
- Yurke, B.; Kaminsky, P.G.; Miller, R.E.; Whittaker, E.A.; Smith, A.D.; Silver, A.H.; Simon, R.W. Observation of 4.2-K equilibrium-noise squeezing via a Josephson-parametric amplifier. Phys. Rev. Lett. 1988, 60, 764–767. [Google Scholar] [CrossRef]
- Yurke, B.; Corruccini, L.R.; Kaminsky, P.G.; Rupp, L.W.; Smith, A.D.; Silver, A.H.; Simon, R.W.; Whittaker, E.A. Observation of parametric amplification and deamplification in a Josephson parametric amplifier. Phys. Rev. A 1989, 39, 2519. [Google Scholar] [CrossRef]
- Macklin, C.; O’Brien, K.; Hover, D.; Schwartz, M.E.; Bolkhovsky, V.; Zhang, X.; Oliver, W.D.; Siddiqi, I. A near-quantum-limited Josephson traveling-wave parametric amplifier. Science 2015, 350, 307–310. [Google Scholar] [CrossRef] [Green Version]
- Nag, B.R. Resonant Tunneling Diode. In Physics of Quantum Well Devices; Springer: Dordrecht, The Netherlands, 2002; pp. 188–201. [Google Scholar]
- Sollner, T.C.L.G.; Le, H.Q.; Brown, E.L. Microwave and Millimeter-Wave Resonant Tunneling Devices; Technical Report for Electronics and Electrical Engineering; NASA: Lexington, MA, USA, January 1988.
- Doychinov, V.; Steenson, D.P.; Patel, H. Resonant-Tunneling Diode Based Reflection Amplifier. In Proceedings of the 22nd European Workshop on Heterostructure Technology (HETECH), Glasgow, UK, 9–11 September 2013. [Google Scholar]
- Dubois, J.; Jullien, T.; Portier, F.; Roche, P.; Cavanna, A.; Jin, Y.; Glattli, D.C. Minimal-excitation states for electron quantum optics using levitons. Nature 2013, 502, 659–663. [Google Scholar] [CrossRef]
- Kasjoo, S.R. Novel Electronic Nanodevices Operating in the TeraHertz Region. Ph.D. Thesis, University of Manchester, Manchester, UK, 2012. [Google Scholar]
- Qi, H.; Guo, W.; Li, Y.; Zhang, X.; Li, X. InP-based RTD/HEMT monolithic integration. Trans. Tianjin Univ. 2010, 16, 267–269. [Google Scholar] [CrossRef]
- Reydellet, L.H.; Roche, P.; Glattli, D.C.; Etienne, B.; Jin, Y. Quantum partition noise of photon-created electron-hole pairs. Phys. Rev. Lett. 2003, 90, 176803. [Google Scholar] [CrossRef] [Green Version]
- O’Hare, C.A.J.; Green, A.M. Axion astronomy with microwave cavity experiments. Phys. Rev. D 2017, 95, 063017. [Google Scholar] [CrossRef] [Green Version]
- Caldwell, A.; Dvali, G.; Majorovits, B.; Millar, A.; Raffelt, G.; Redondo, J.; Reimann, O.; Simon, F.; Steffen, F.; MADMAX Working Group. Dielectric haloscopes: A new way to detect axion dark matter. Phys. Rev. Lett. 2017, 118, 091801. [Google Scholar] [CrossRef] [Green Version]
- Battaglieri, M.; Belloni, A.; Chou, A.; Cushman, P.; Echenard, B.; Essig, R.; Estrada, J.; Feng, J.L.; Flaugher, B.; Fox, P.J.; et al. US cosmic visions: New ideas in dark matter 2017: Community report. arXiv 2017, arXiv:1707.04591. [Google Scholar]
- Kawasaki, M.; Saikawa, K.I.; Sekiguchi, T. Axion dark matter from topological defects. Phys. Rev. D 2015, 91, 065014. [Google Scholar] [CrossRef] [Green Version]
- Shellard, E.P.S.; Battye, R.A. Spectrum of radiation from axionic strings. Nucl. Phys. B 1999, 72, 88. [Google Scholar]
- Ballesteros, G.; Redondo, J.; Ringwald, A.; Tamarit, C. Unifying inflation with the axion, dark matter, baryogenesis, and the seesaw mechanism. Phys. Rev. Lett. 2017, 118, 071802. [Google Scholar] [CrossRef] [Green Version]
- Ballesteros, G.; Redondo, J.; Ringwald, A.; Tamarit, C. Standard Model—axion—seesaw—Higgs portal inflation. Five problems of particle physics and cosmology solved in one stroke. J. Cosmol. Astropart. Phys. 2017, 08, 001. [Google Scholar] [CrossRef] [Green Version]
- Borsanyi, S.; Fodor, Z.; Kampert, K.H.; Katz, S.D.; Kawanai, T.; Kovacs, T.G.; Ringwald, A. Lattice QCD for cosmology. Nature 2016, 539, 69–71. [Google Scholar] [CrossRef] [Green Version]
- Khlopov, M.Y.; Sakharov, A.S.; Sokoloff, D.D. The nonlinear modulation of the density distribution in standard axionic CDM and its cosmological impact. Nucl. Phys. B 1999, 72, 105–109. [Google Scholar] [CrossRef] [Green Version]
- Gorghetto, M.; Hardy, E.; Villadoro, G. Axions from strings: The attractive solution. J. High Energy Phys. 2018, 7, 151. [Google Scholar] [CrossRef] [Green Version]
- Buschmann, M.; Foster, J.W.; Safdi, B.R. Early-Universe simulations of the cosmological axion. arXiv 2019, arXiv:1906.00967. [Google Scholar]
- Beck, C. Possible resonance effect of axionic dark matter in Josephson junctions. Phys. Rev. Lett. 2013, 111, 231801. [Google Scholar] [CrossRef] [Green Version]
- Freese, K.; Lisanti, M.; Savage, C. Annual modulation of dark matter: A review. arXiv 2012, arXiv:1209.3339. [Google Scholar]
- Everitt, C.F.; DeBra, D.B.; Parkinson, B.W.; Turneaure, J.P.; Conklin, J.W.; Heifetz, M.I.; Al-Meshari, M. Gravity probe B: Final results of a space experiment to test general relativity. Phys. Rev. Lett. 2011, 106, 221101. [Google Scholar] [CrossRef]
- Iorio, L.; Lichtenegger, H.I.; Ruggiero, M.L.; Corda, C. Phenomenology of the Lense-Thirring effect in the solar system. Astrophys. Space Sci. 2011, 331, 351–395. [Google Scholar] [CrossRef] [Green Version]
- Renzetti, G. History of the attempts to measure orbital frame-dragging with artificial satellites. Cent. Eur. J. Phys. 2013, 11, 531–544. [Google Scholar] [CrossRef] [Green Version]
- Lucchesi, D.M.; Anselmo, L.; Bassan, M.; Magnafico, C.; Pardini, C.; Peron, R.; Pucacco, G.; Visco, M. General Relativity Measurements in the Field of Earth with Laser-Ranged Satellites: State of the Art and Perspectives. Universe 2019, 5, 141. [Google Scholar] [CrossRef] [Green Version]
- Barbieri, R.; Braggio, C.; Carugno, G.; Gallo, C.S.; Lombardi, A.; Ortolan, A.; Pengo, R.; Ruoso, G.; Speake, C.C. Searching for galactic axions through magnetized media: The QUAX proposal. Phys. Dark Universe 2017, 15, 135–141. [Google Scholar] [CrossRef] [Green Version]
- Devoret, M.H.; Schoelkopf, R.J. Superconducting circuits for quantum information: An outlook. Science 2013, 339, 1169–1174. [Google Scholar] [CrossRef] [Green Version]
- Bergeal, N.; Schackert, F.; Metcalfe, M.; Vijay, R.; Manucharyan, V.E.; Frunzio, L.; Devoret, M.H. Phase-preserving amplification near the quantum limit with a Josephson ring modulator. Nature 2010, 465, 64–68. [Google Scholar] [CrossRef] [Green Version]
- Manucharyan, V.E.; Boaknin, E.; Metcalfe, M.; Vijay, R.; Siddiqi, I.; Devoret, M. Microwave bifurcation of a Josephson junction: Embedding-circuit requirements. Phys. Rev. B 2007, 76, 014524. [Google Scholar] [CrossRef] [Green Version]
- Hatridge, M.; Shankar, S.; Mirrahimi, M.; Schackert, F.; Geerlings, K.; Brecht, T.; Schoelkopf, R.J. Quantum back-action of an individual variable-strength measurement. Science 2013, 339, 178–181. [Google Scholar] [CrossRef] [Green Version]
- Crescini, N.; Braggio, C.; Carugno, G.; Falferi, P.; Ortolan, A.; Ruoso, G. Improved constraints on monopole–dipole interaction mediated by pseudo-scalar bosons. Phys. Lett. B 2017, 773, 677–680. [Google Scholar] [CrossRef]
- Opremcak, A.; Pechenezhskiy, I.V.; Howington, C.; Christensen, B.G.; Beck, M.A.; Leonard, E.; Thorbeck, T. Measurement of a superconducting qubit with a microwave photon counter. Science 2018, 361, 1239–1242. [Google Scholar] [CrossRef] [Green Version]
- Robertson, S. Optical Kerr effect in vacuum. Phys. Rev. A 2019, 100, 063831. [Google Scholar] [CrossRef] [Green Version]
- Braaten, E.; Zhang, H. Axion stars. arXiv 2018, arXiv:1810.11473. [Google Scholar]
- Ruffini, R.; Bonazzola, S. Systems of selfgravitating particles in general relativity and the concept of equation of state. Phys. Rev. 1969, 187, 1767–1783. [Google Scholar] [CrossRef] [Green Version]
- Colpi, M.; Shapiro, S.L.; Wasserman, I. Boson stars: Gravitational equilibria of self-interacting scalar fields. Phys. Rev. Lett. 1986, 57, 2485–2488. [Google Scholar] [CrossRef]
- Visinelli, L.; Baum, S.; Redondo, J.; Freese, K.; Wilczek, F. Dilute and dense axion stars. Phys. Lett. B 2018, 777, 64–72. [Google Scholar] [CrossRef]
Figure 1.
The two-vertex axion-photon conversion in a static magnetic field (under a coherent inverse Primakoff process).
Figure 1.
The two-vertex axion-photon conversion in a static magnetic field (under a coherent inverse Primakoff process).

Figure 2.
(a) A plot of the estimated signal power of an axion event plotted against the range of frequencies as per both the axion models (in a discrete manner). We used the values of constants in the Equation (11) as follows; ma = 11.25 to 33.75 μeV, ρa = 0.323 GeV·cm−3, gαγγ = 0.45 or 3.0 GeVcm−3 for KSVZ or DFSZ models, respectively, V ~ 2.0 × 10⁻⁵ m3, B = 8.0 T, = 0.6, νres = 2.7 to 8.1 GHz, and QL = 5 × 10⁵. The flat line at bottom depicts the noise floor. Note the kinks in the plots do not indicate any inherent non-linearity in power, it is an artifact created because of using discrete frequency values in graph. (b) Raw Signal to Noise Ratio (SNR) of DFSZ axion events which are the aim of this search proposal. The calculations were carried out using the Dicke radiometer formula for an ambient physical temperature of the cavity and detector set around 20mK and the integration time and bandwidth were taken as 103 s and 20 KHz, respectively.

Figure 3.
An illustration of the proposed experiment to detect an axion-photon conversion in a resonant cavity under the coherent inverse Primakoff effect in a strong magnetic field. (a) An overview of the experiment whereby a photon generated from an incident axionic field is detected in a resonant microwave cavity operating in a high-intensity magnetic field. A faint microwave signal is generated from an axion-photon conversion in a microwave cavity under the influence of a strong and highly-uniform magnetic field () facilitated by a superconducting magnet at the perimeter of the cavity. A tuning fork antenna critically coupled to the cavity (preferably placed in the center of a waveguide at the perimeter of the cavity endcap to facilitate impedance matching) picks this signal which is amplified by a three-stage cryogenic amplification scheme comprising a Josephson Parametric Amplifier (JPA), a Resonant Tunneling Diode (RTD) and a duo of cryogenic Low-Noise Amplifier’s (cLNA) based on High-Electron Mobility Field Effect Transistors (HEMTs/HFETs). An optimal solution would be a specially-fabricated integrated RTD-gated HEMT device, as discussed in text. (b) A cross-sectional view of the cavity illustrates the hypothetical conversion of an axionic field (φa) into an electromagnetic field photon (γ) under the influence of a transverse magnetic field () in the cavity, resulting into the generation of a photon in the axial direction. The illustration is superimposed on a coarse simulation of the field distribution in the cavity (the intensity shown in descending order in terms of red, yellow and blue contours, respectively), in the axial direction normal to the magnetic field.


Figure 4.
The result of a 15,000-point simulation generated on computer to assess the form of power as generated from axionic events in the cavity in our region of interest, 2–10 GHz. The plot gives a time-domain view of the hypothetical signals registered in the cavity volume.
Figure 4.
The result of a 15,000-point simulation generated on computer to assess the form of power as generated from axionic events in the cavity in our region of interest, 2–10 GHz. The plot gives a time-domain view of the hypothetical signals registered in the cavity volume.

Figure 5.
The spectral distribution of a similar simulation of hypothetical events registered in the cavity volume, however, here as a function of frequency within our region of interest, 1 to 12 GHz.
Figure 5.
The spectral distribution of a similar simulation of hypothetical events registered in the cavity volume, however, here as a function of frequency within our region of interest, 1 to 12 GHz.

Figure 6.
A histogram depicting spectral distribution of power, constructed from the data generated from the spectral simulation, as illustrated in Figure 6.
Figure 6.
A histogram depicting spectral distribution of power, constructed from the data generated from the spectral simulation, as illustrated in Figure 6.

Figure 7.
(a) An overview of our pilot test cryostat, a preliminary glass-stainless steel vacuum chamber, which houses the cavity at the heart of the experiment, and associated components. A coolant, such as LN2 or LHe is circulated in the chamber around the cavity to achieve the operating temperature. A special capsule houses the detector and antenna assembly at one of the ends of the cavity. (b) A cross-sectional view of the cryostat with the cryostat’s end-cap and connections removed.

Figure 8.
The electronics and instrumentation involved with the proposed axion experiment. More details are provided in the Supplementary Methods section at the end of the paper.
Figure 8.
The electronics and instrumentation involved with the proposed axion experiment. More details are provided in the Supplementary Methods section at the end of the paper.

Figure 9.
Raw (unintegrated) Noise Power Spectral Density (PSD), or the spectral density of voltage fluctuations of the measured noise in the cavity (without any stimulus), for the region of interest in our dc measurement scheme (10 KHz–20 KHz). The result is quite satisfactory with deviations of acceptable magnitude in the measured noise. The sensitivity of our scheme would increase by a few orders once we venture down to the regime of mK temperatures.

Figure 10.
The form of a measured raw signal as detected by the RF detector in time domain, without any signal processing, to illustrate the form of measured voltage from the cavity. The peak shown in this plot corresponds to the onset of a synthetic “axionic event” (in the form a weak intensity Lorentzian shape signal from an RF signal generator weakly coupled to the cavity).

Figure 11.
Resonance detection from our scheme. The plot depicts the Phase-Sensitive Detected (PSD) dc output from the Lock-In Amplifier (LIA), as obtained by the DAQ and analyzed by the analysis software, as a result of an artificially injected 11 μeV signal in the form of a high-frequency 2.5 GHz signal from our RF source tapped close to the cavity. The RF resonance detection ability of our PSD scheme can be appreciated from the magnitude and form of this signal.

Figure 12.
Illustration of resonance detection in the frequency domain. The detected signal primary and secondary peaks are illustrated in blue color, whereas the noise, in the absence of any injected signal, is illustrated in amber color at the bottom. The inset in Figure 12 shows a magnified (narrow spectral-range) view of the primary peak, which illustrates the Lorentzian shape of the signal, as expected in resonance. The spectra were constructed from a FFT algorithm using two time-domain data sets from the same batch of experiments, carried out within a short span of seconds, one without any stimulus and one with a weakly coupled artificially injected signal corresponding the axion mass of 11 μeV near the cavity (similar to Figure 11).

Figure 13.
An illustration of accumulated and integrated spectra from eight different data sets corresponding to detected test resonant signals in cavity, on the lines of Figure 12b. The calculated SNR from these and similar events ranges from approximately 7 to 9, which illustrates the efficacy of resonance detection in the cavity corresponding to a fixed mass axion value.


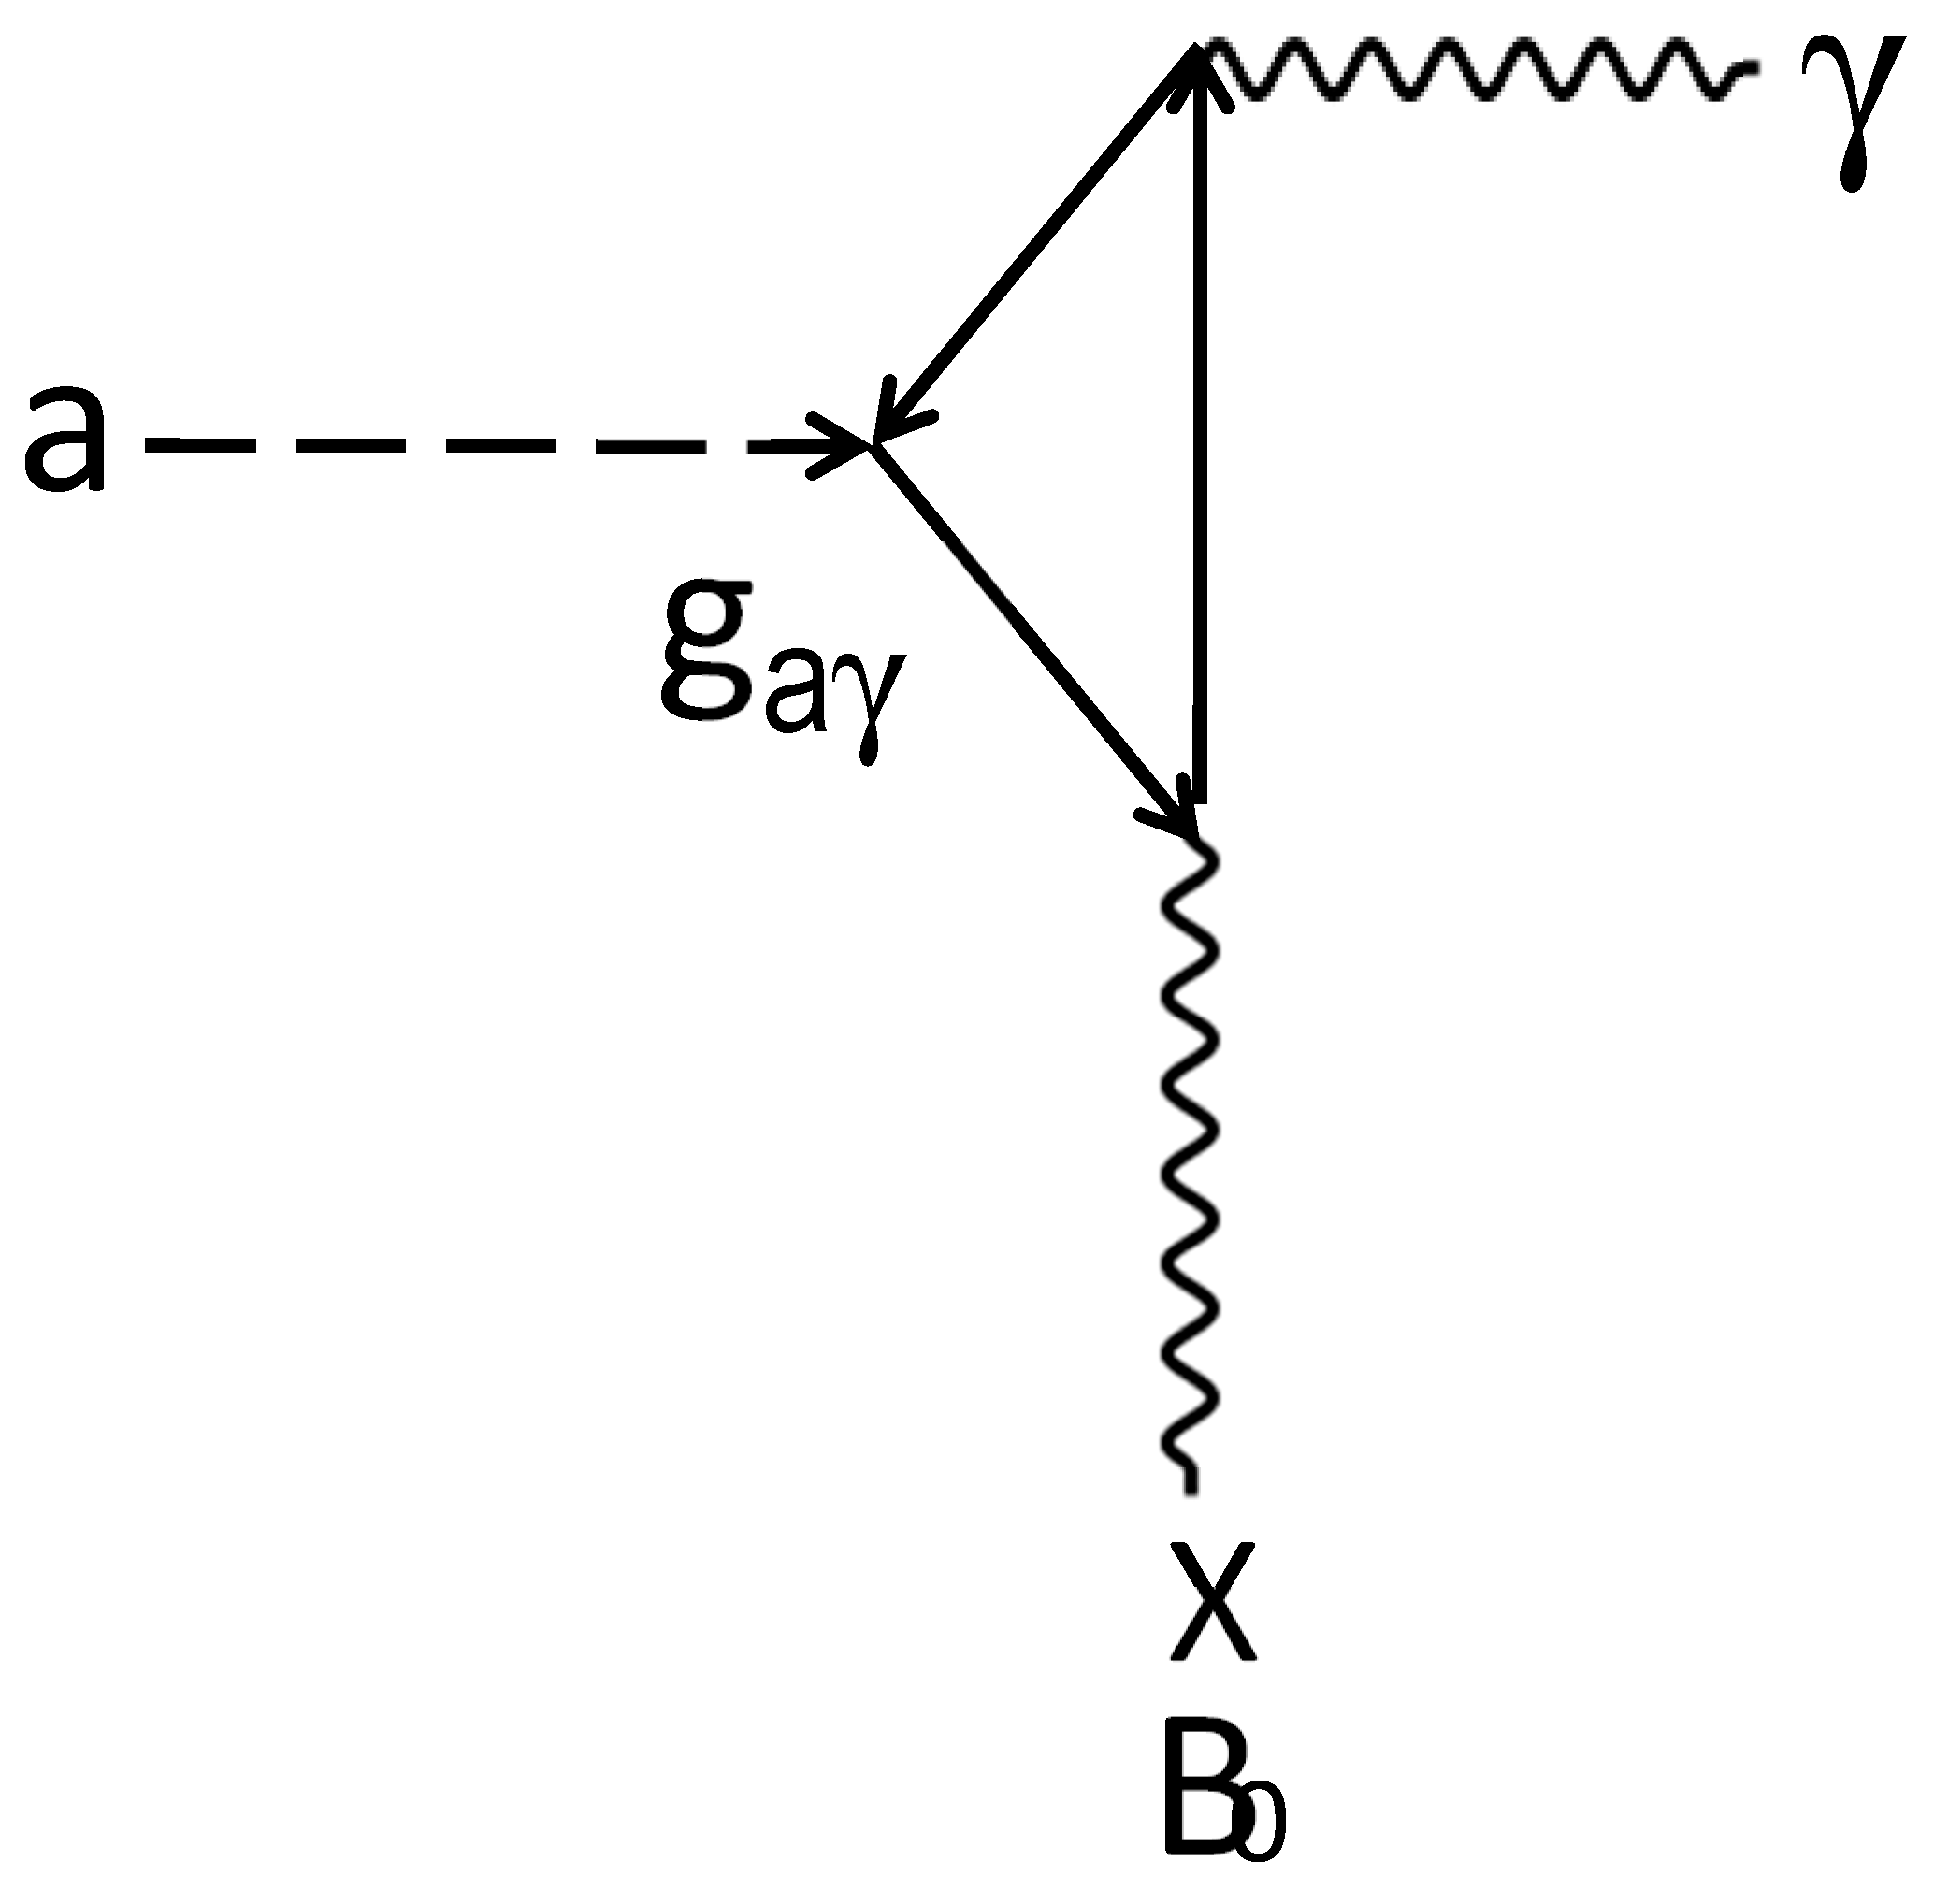
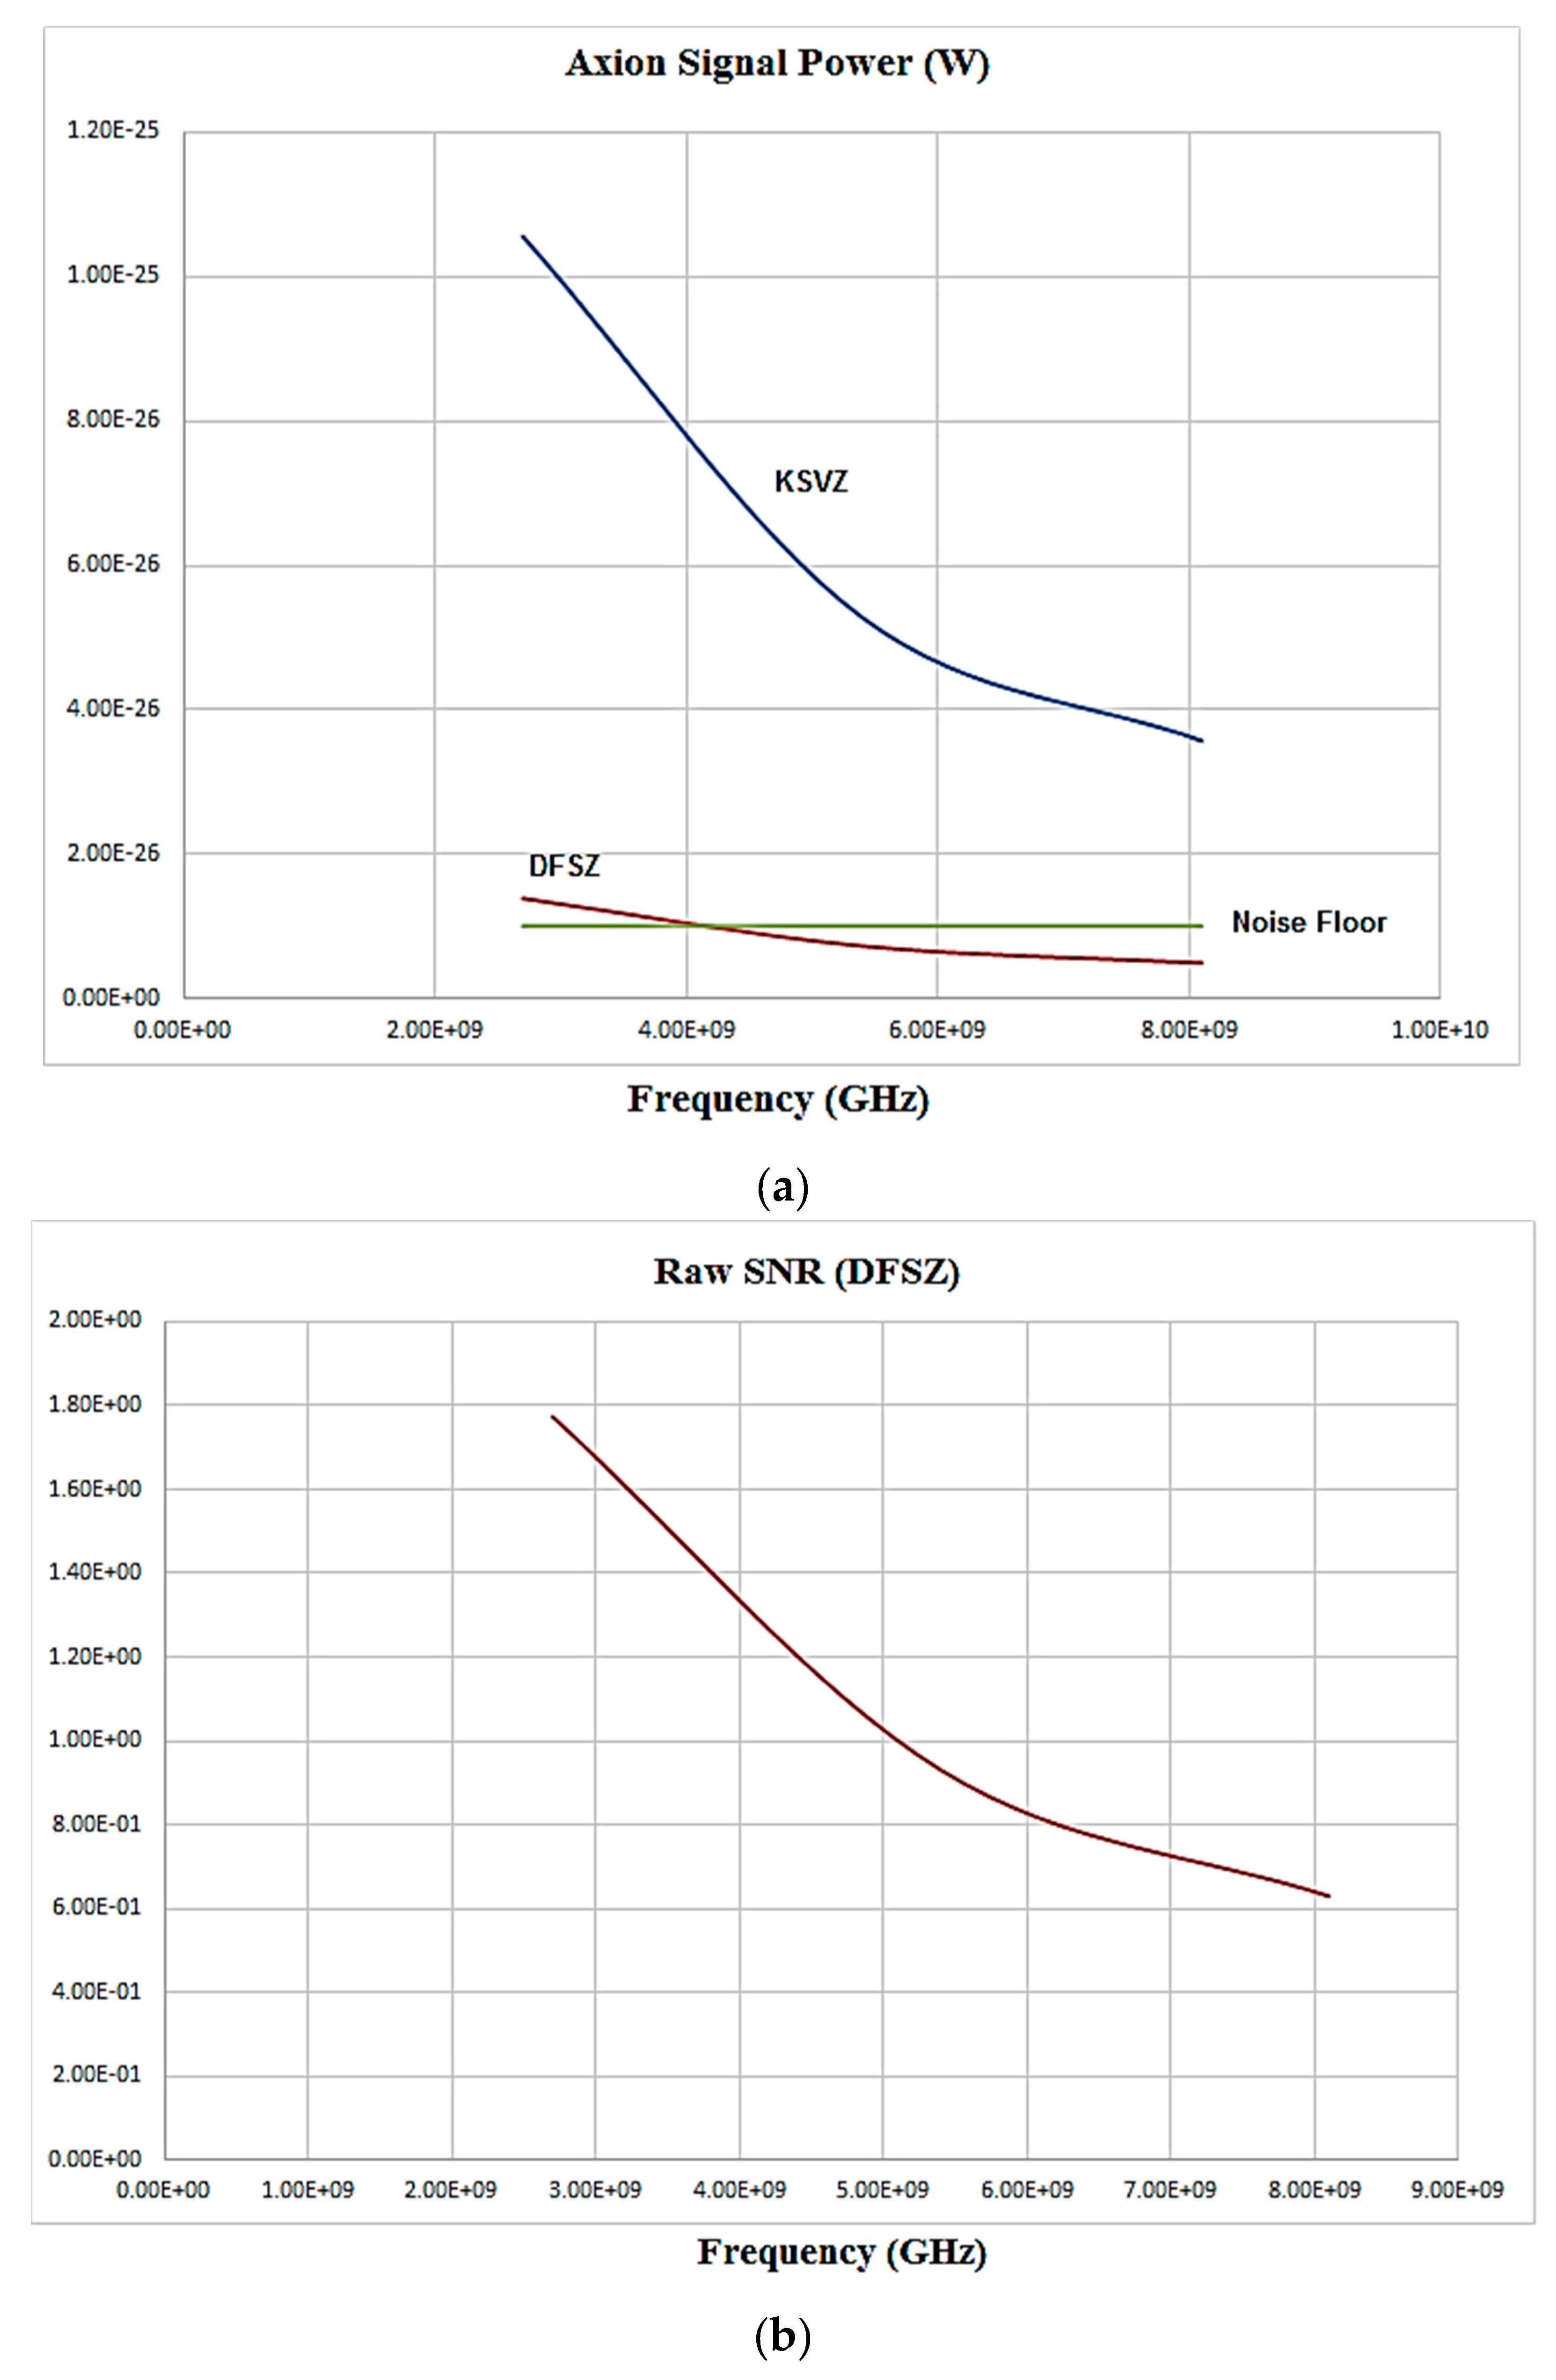
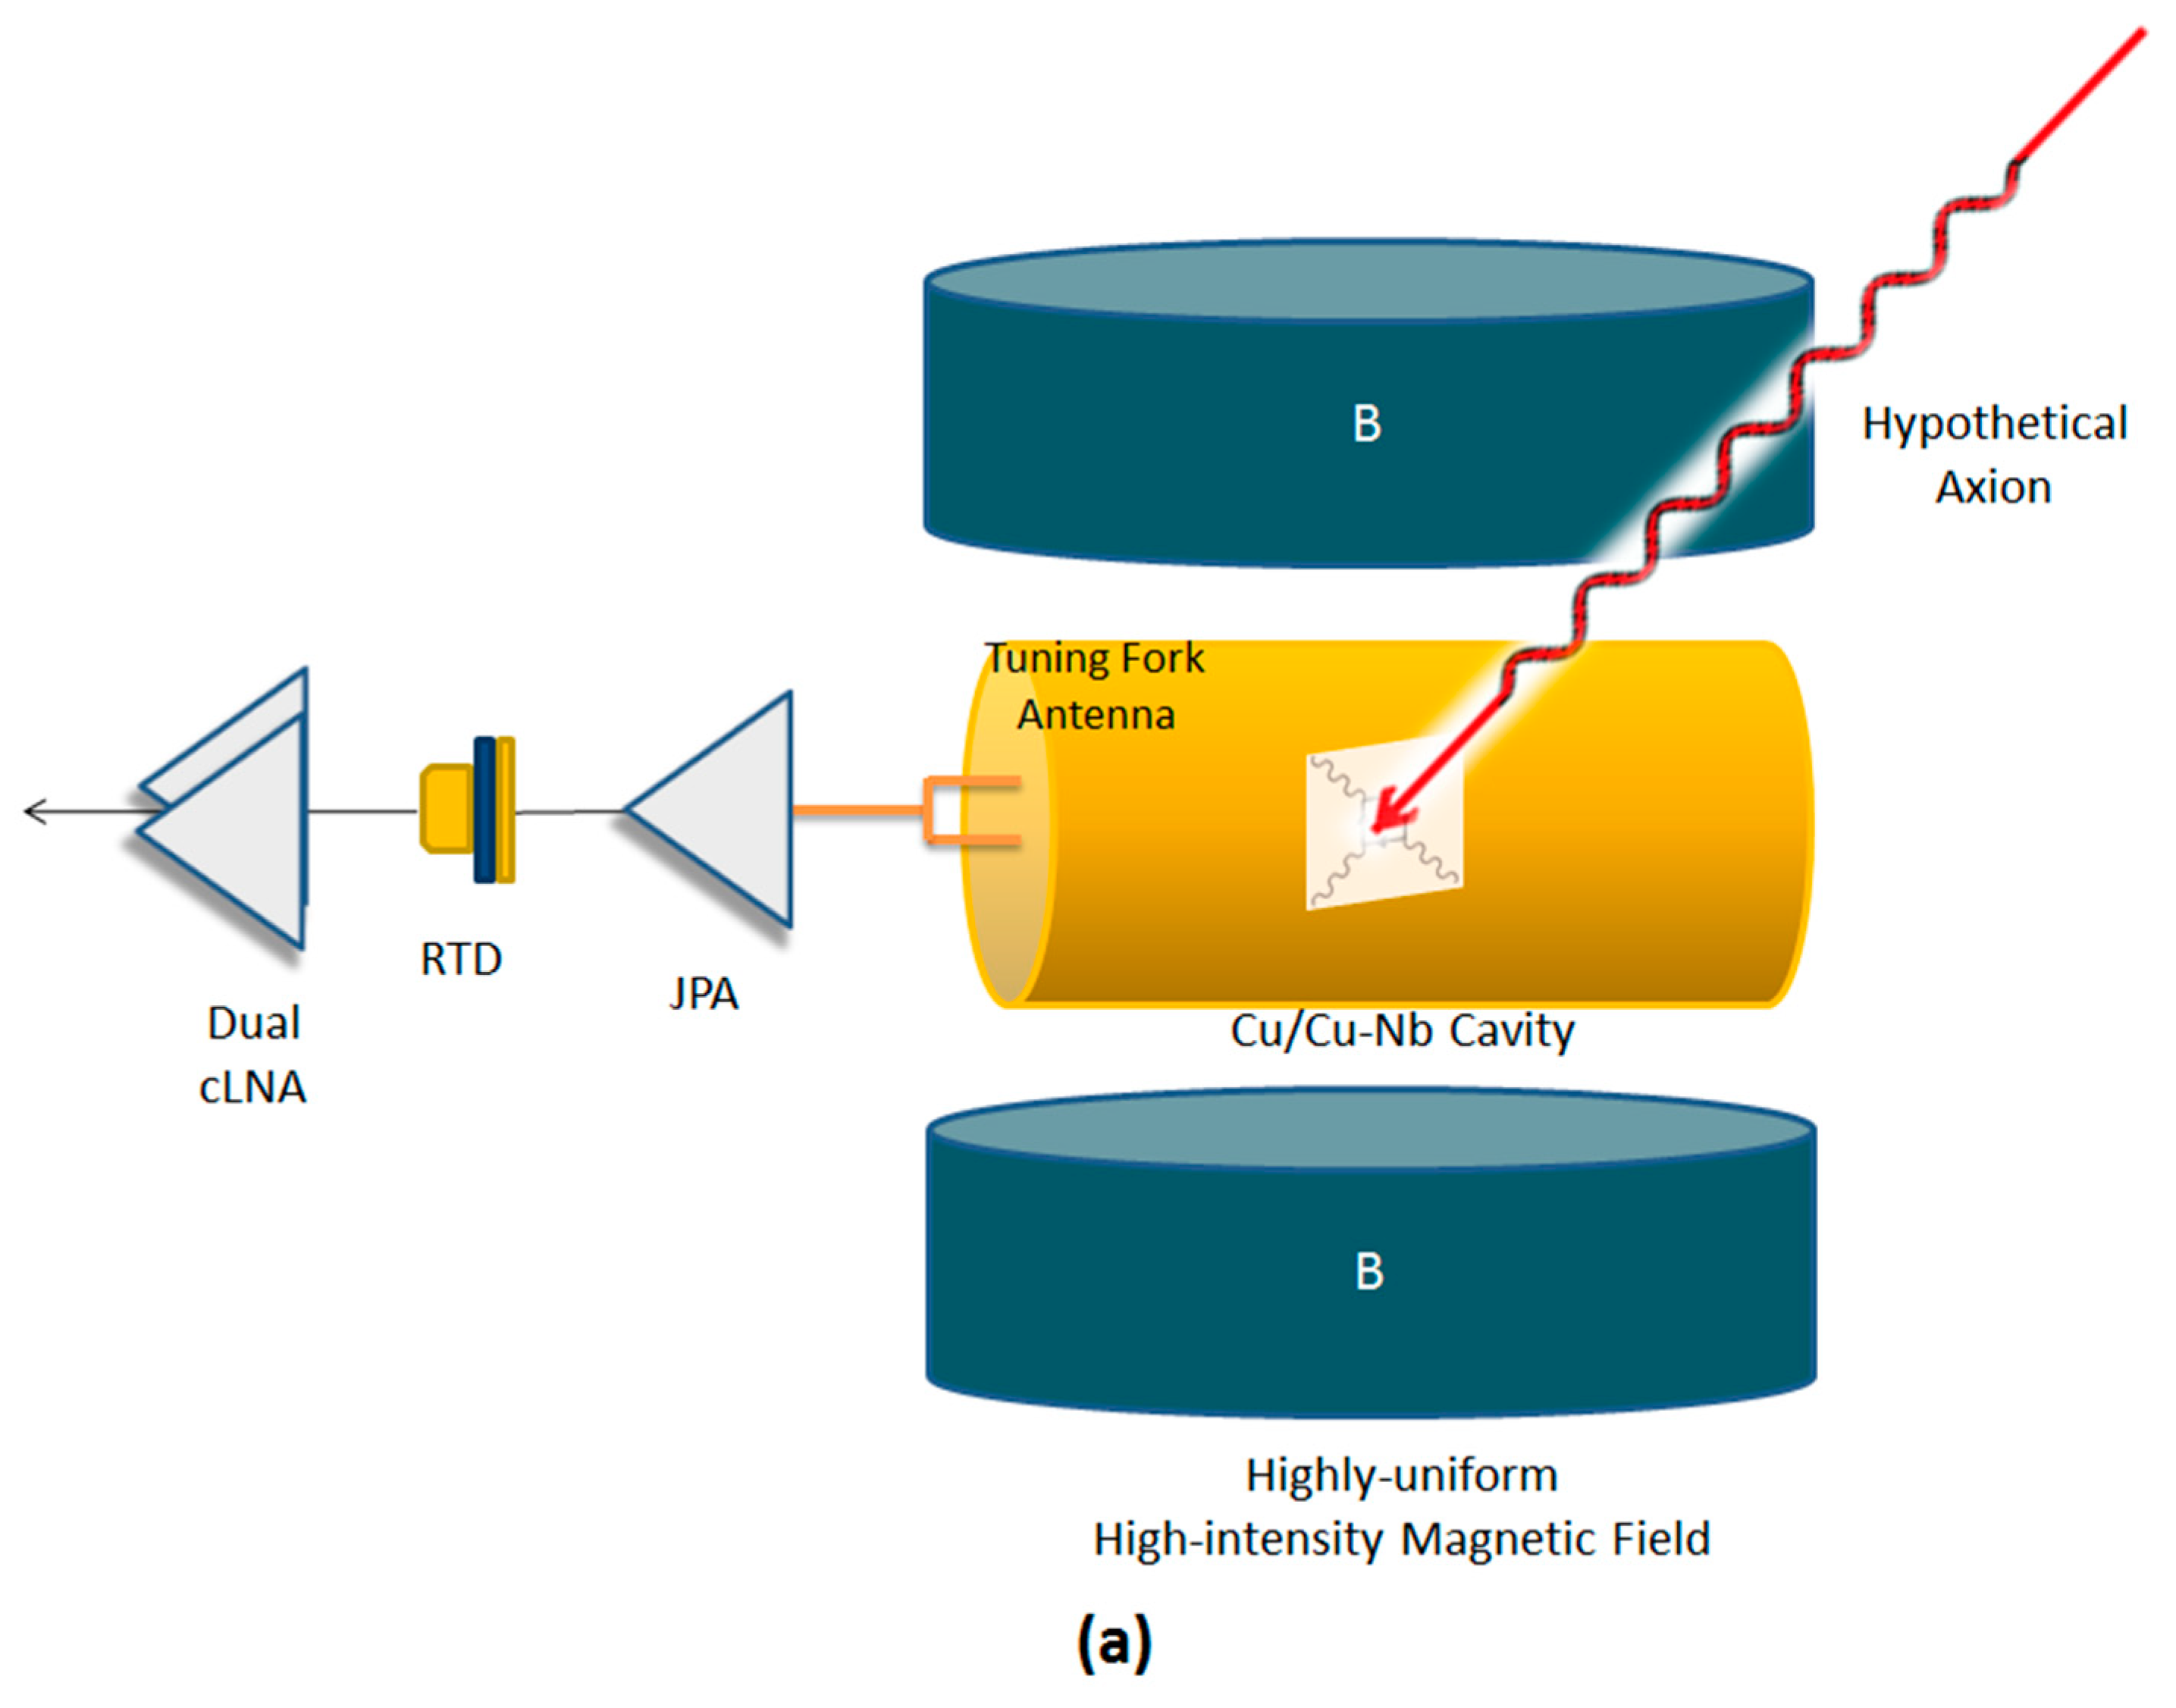
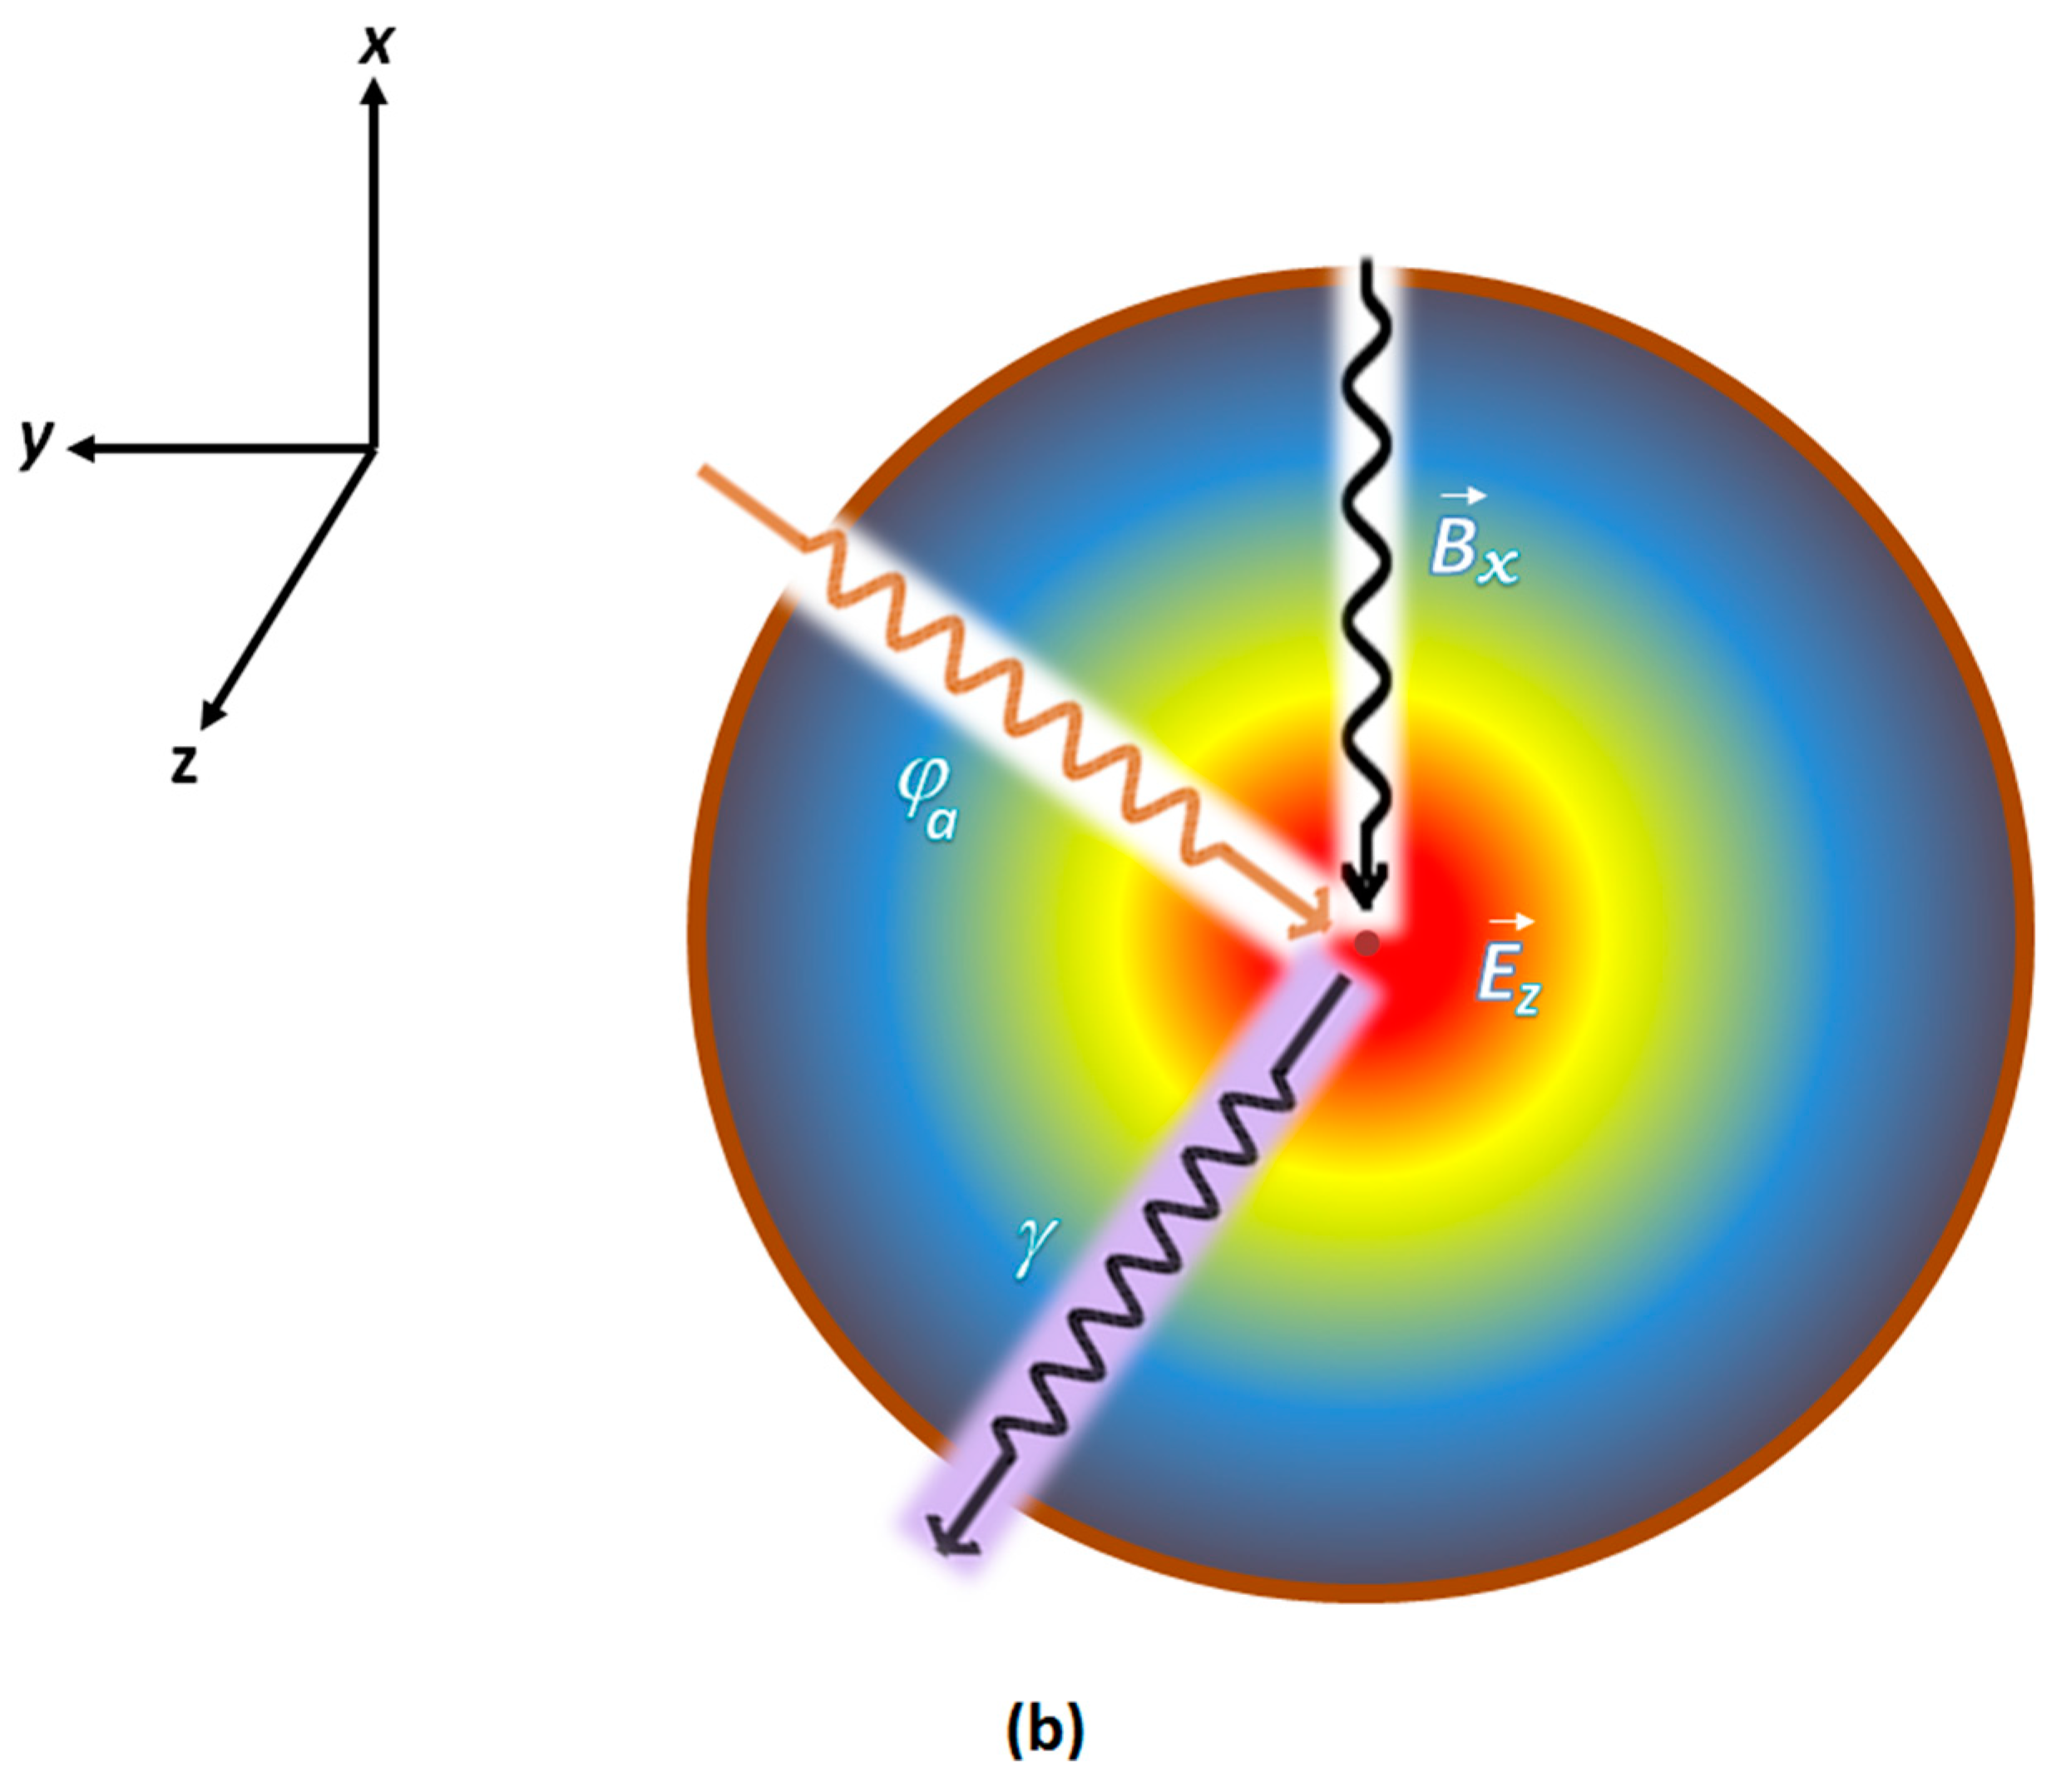
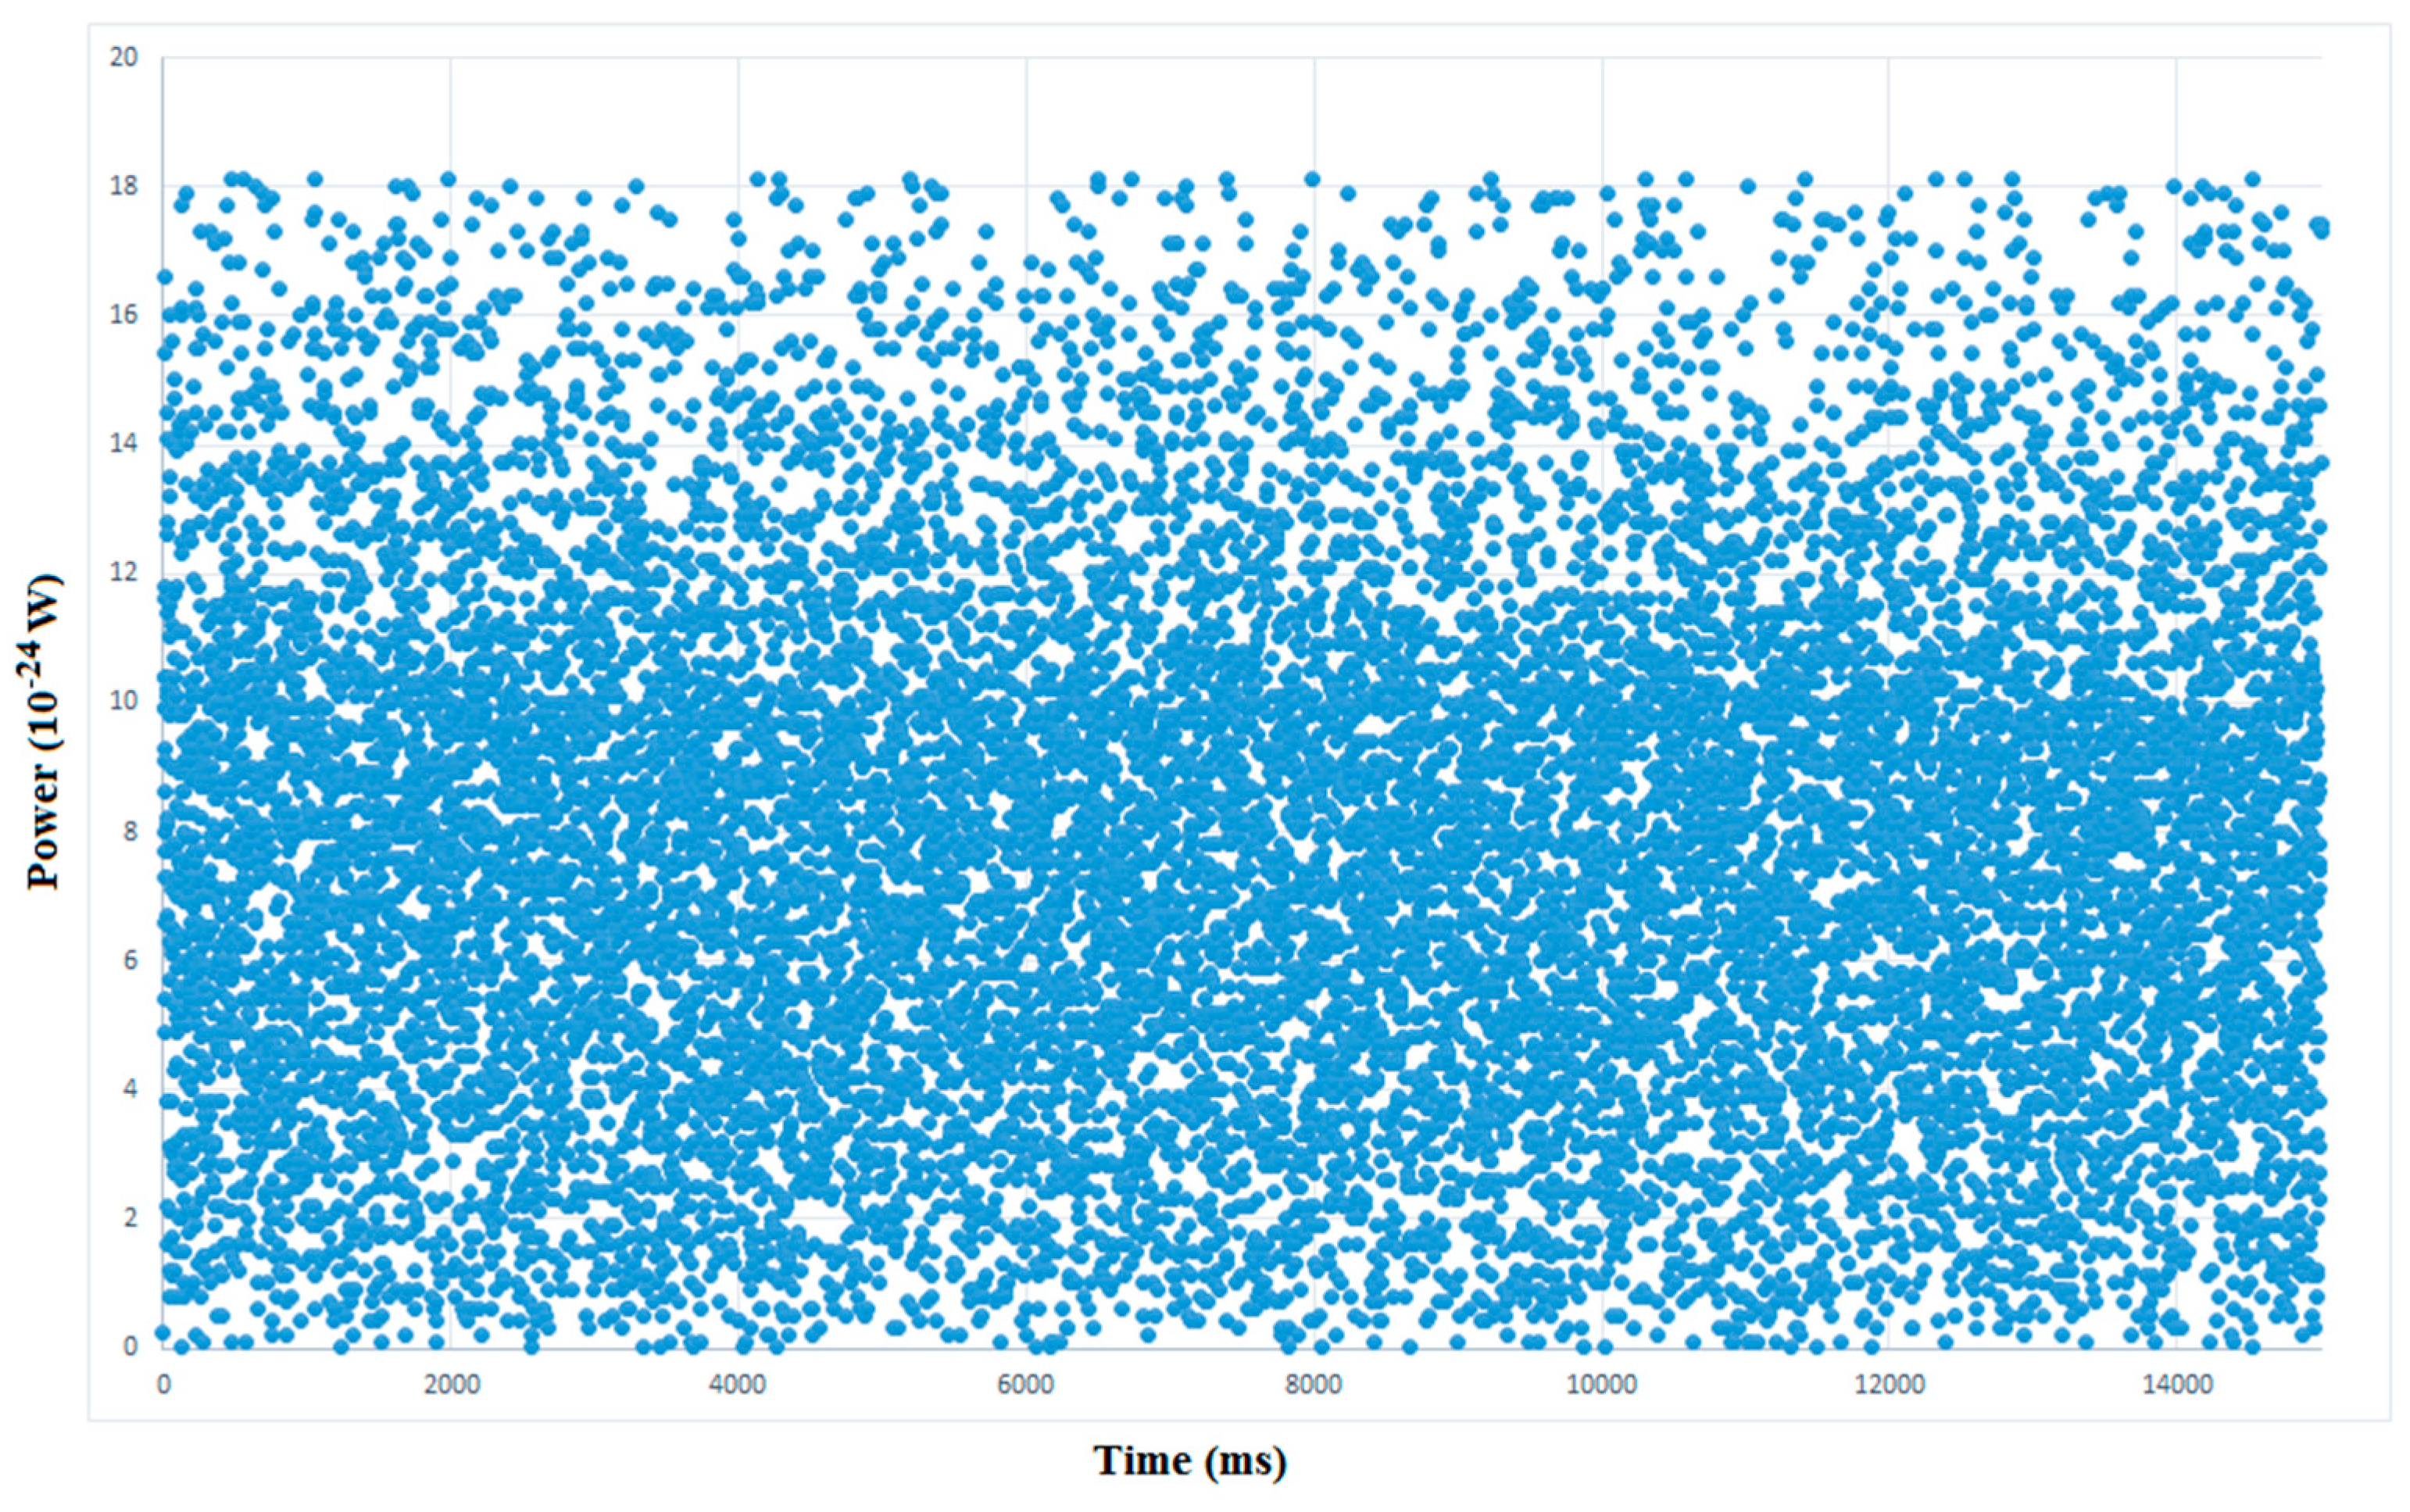
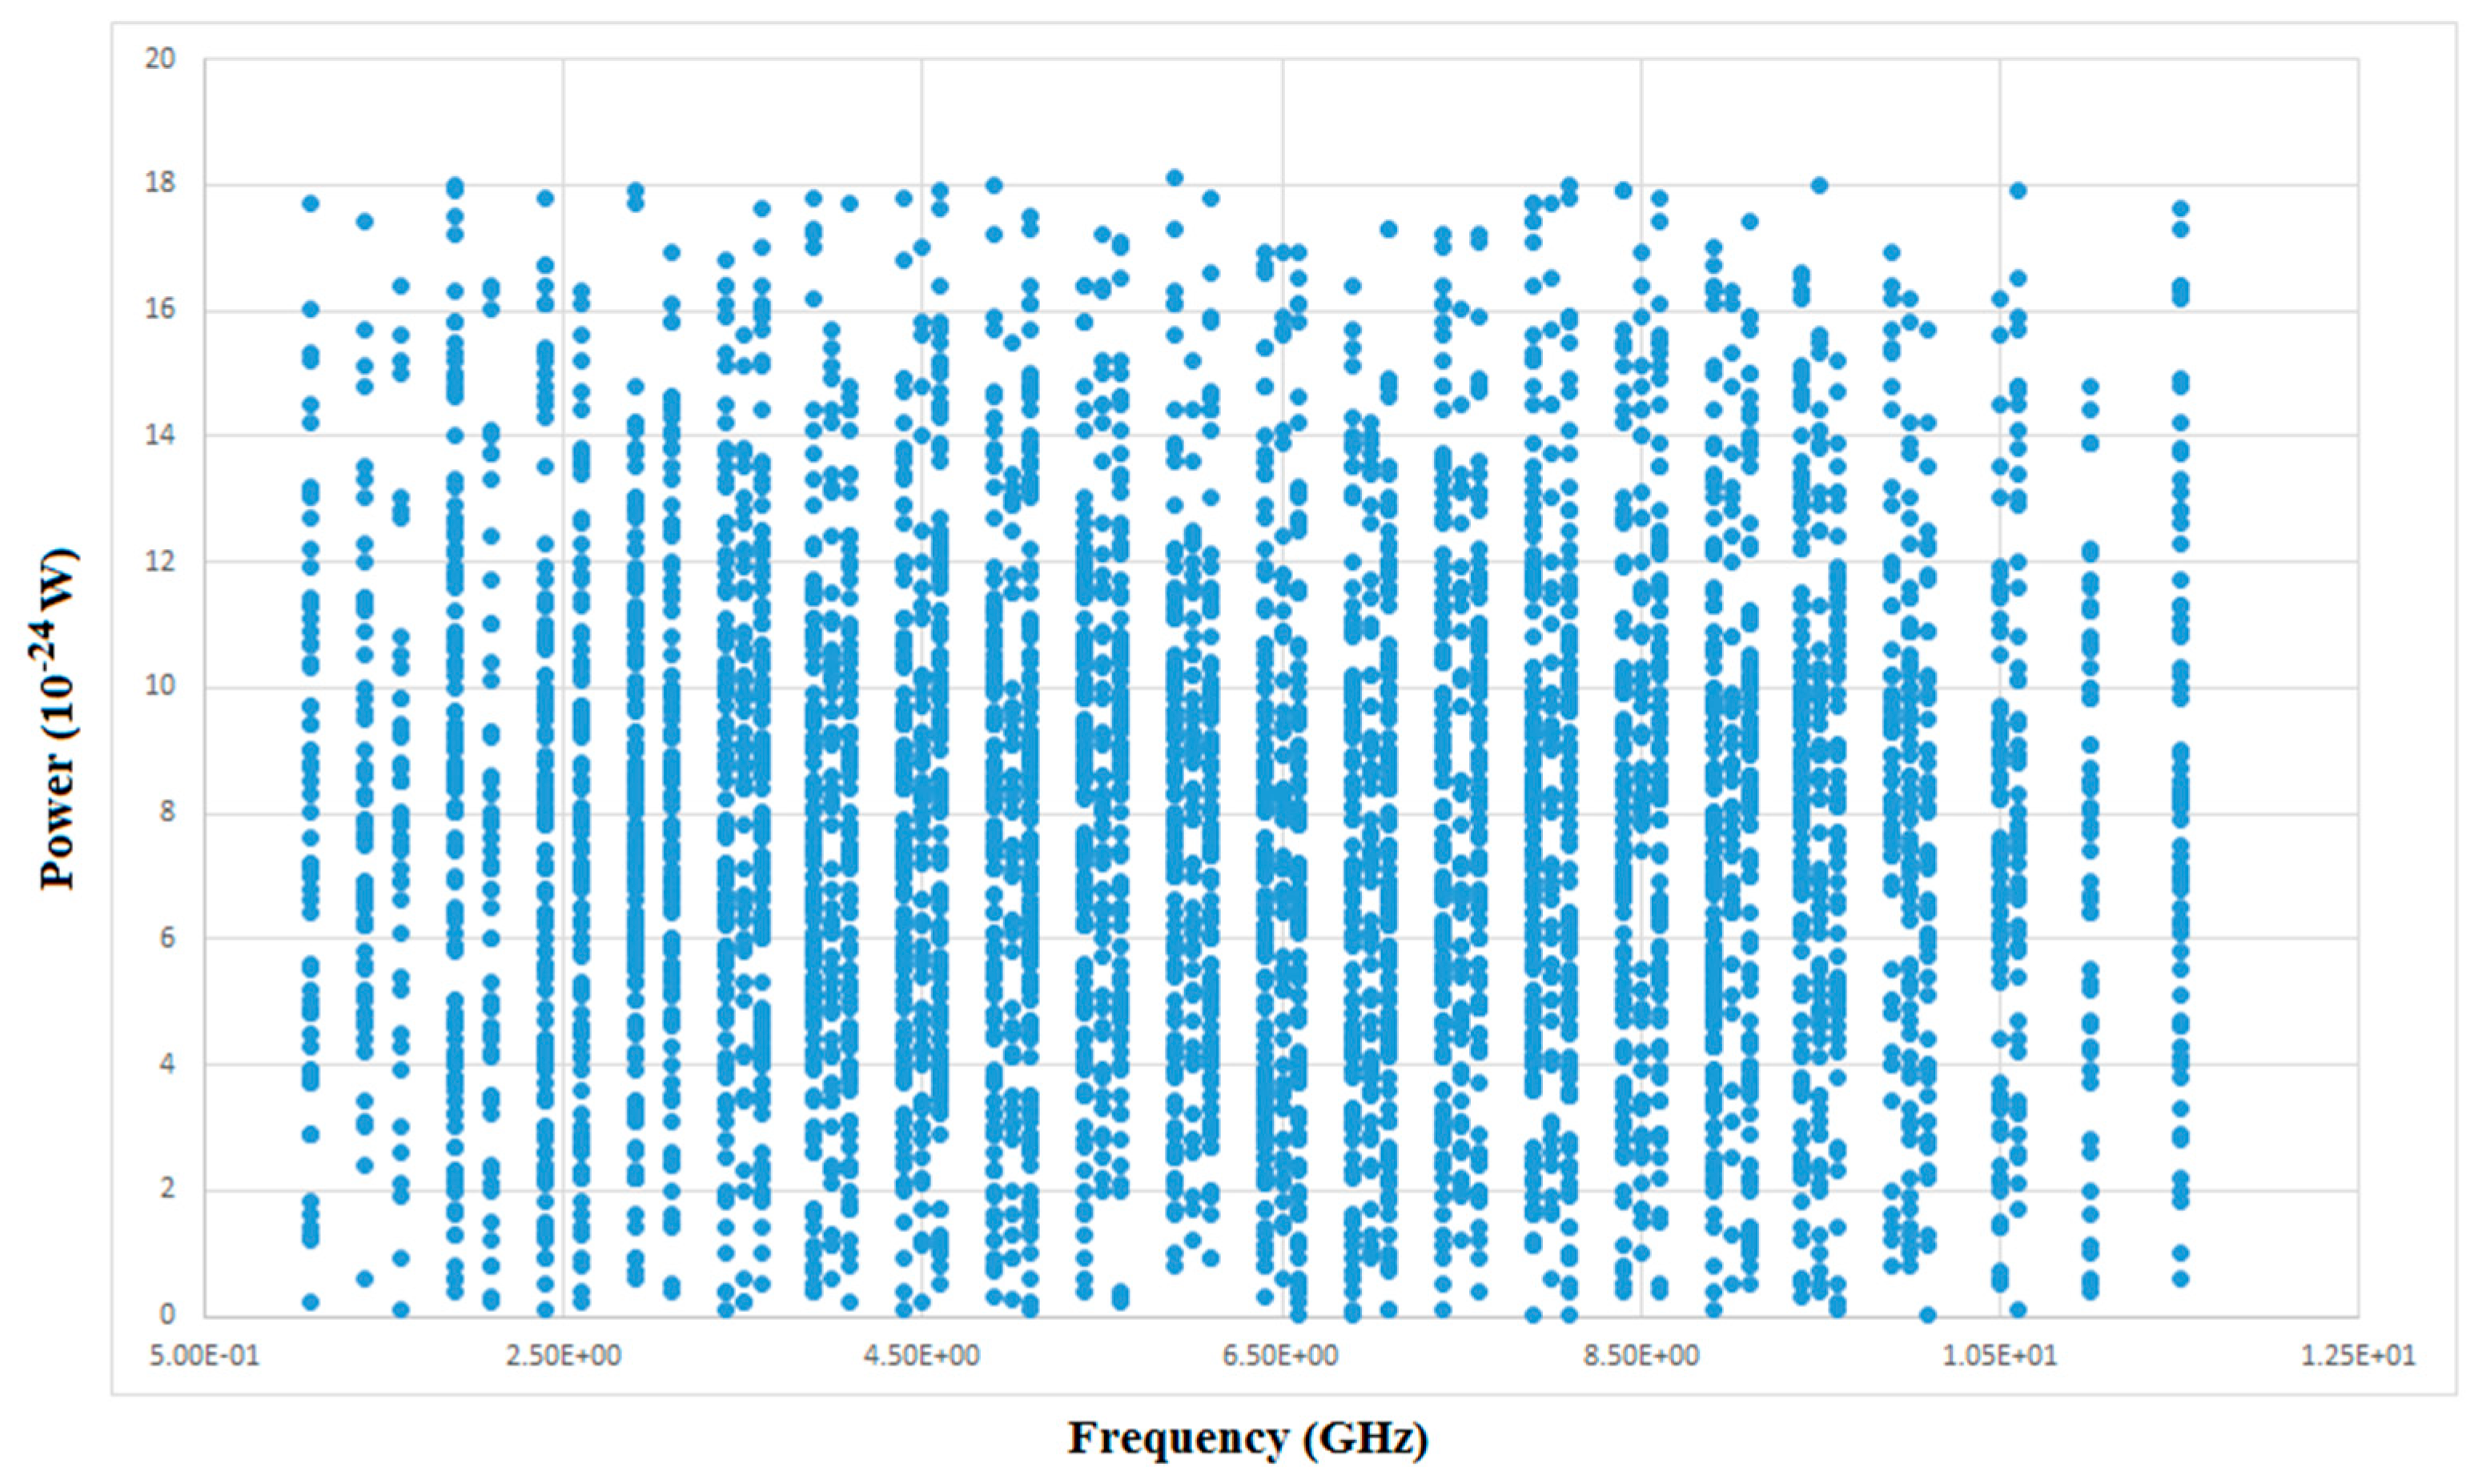
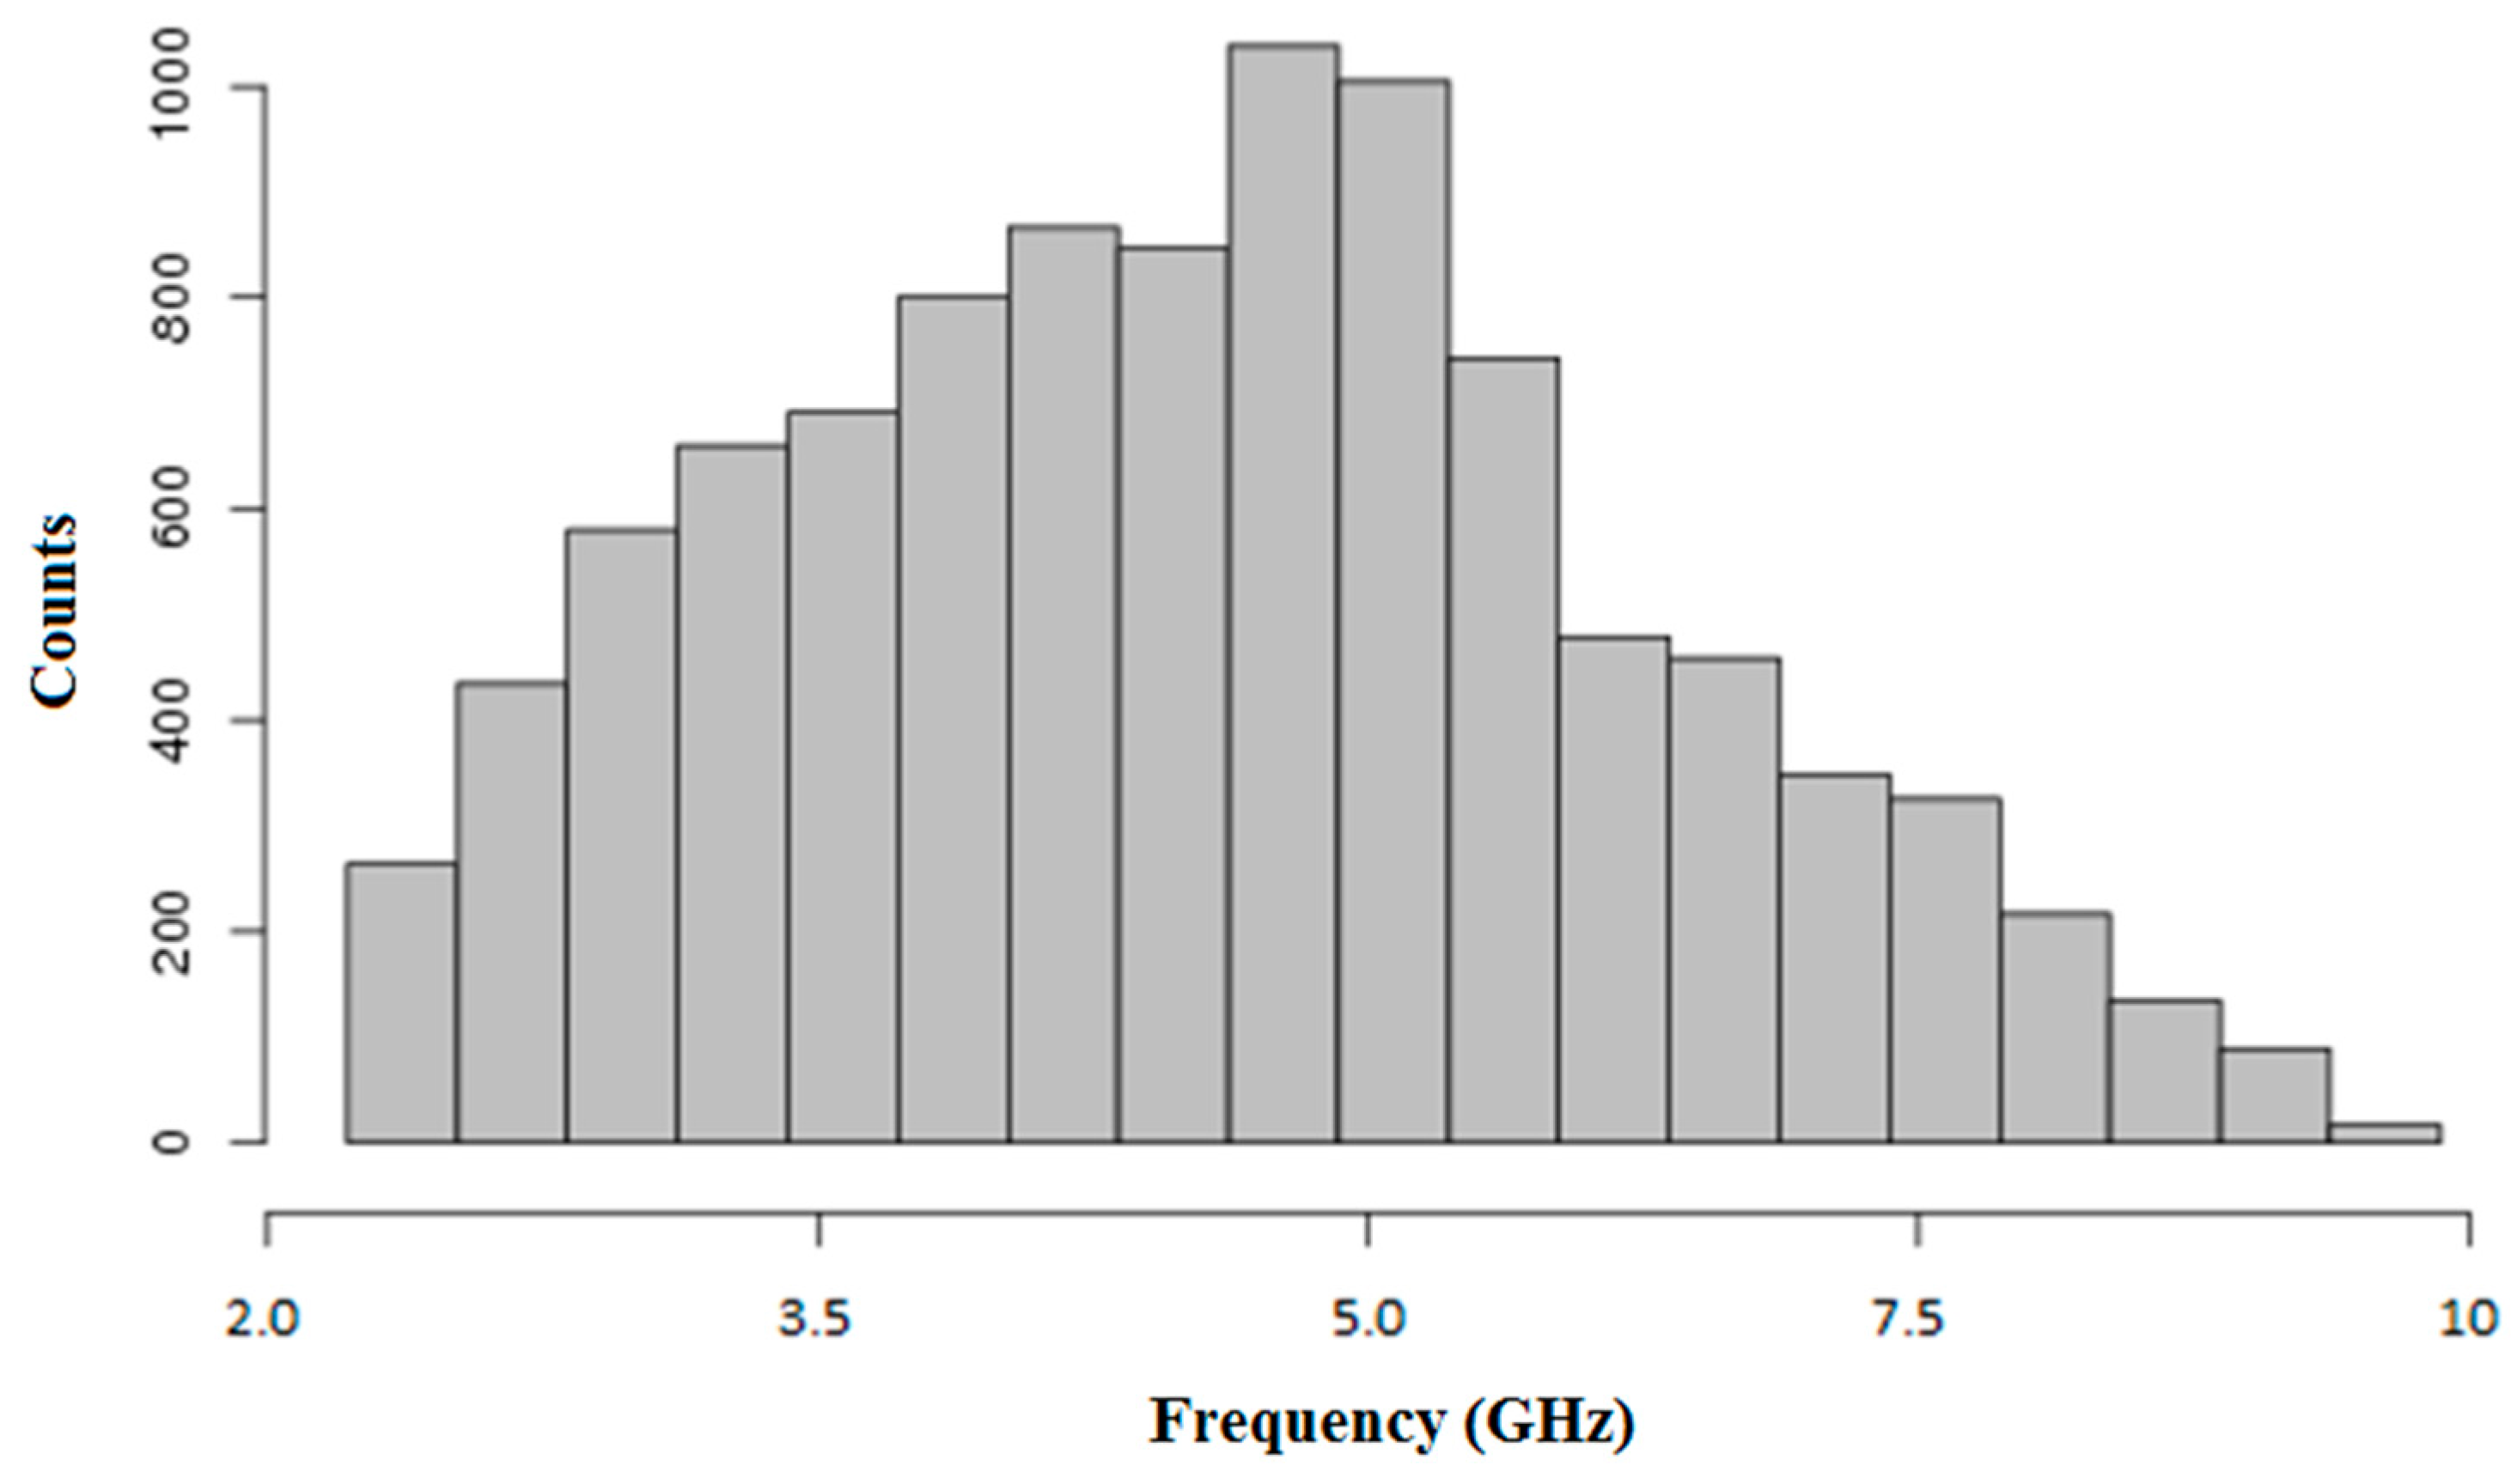
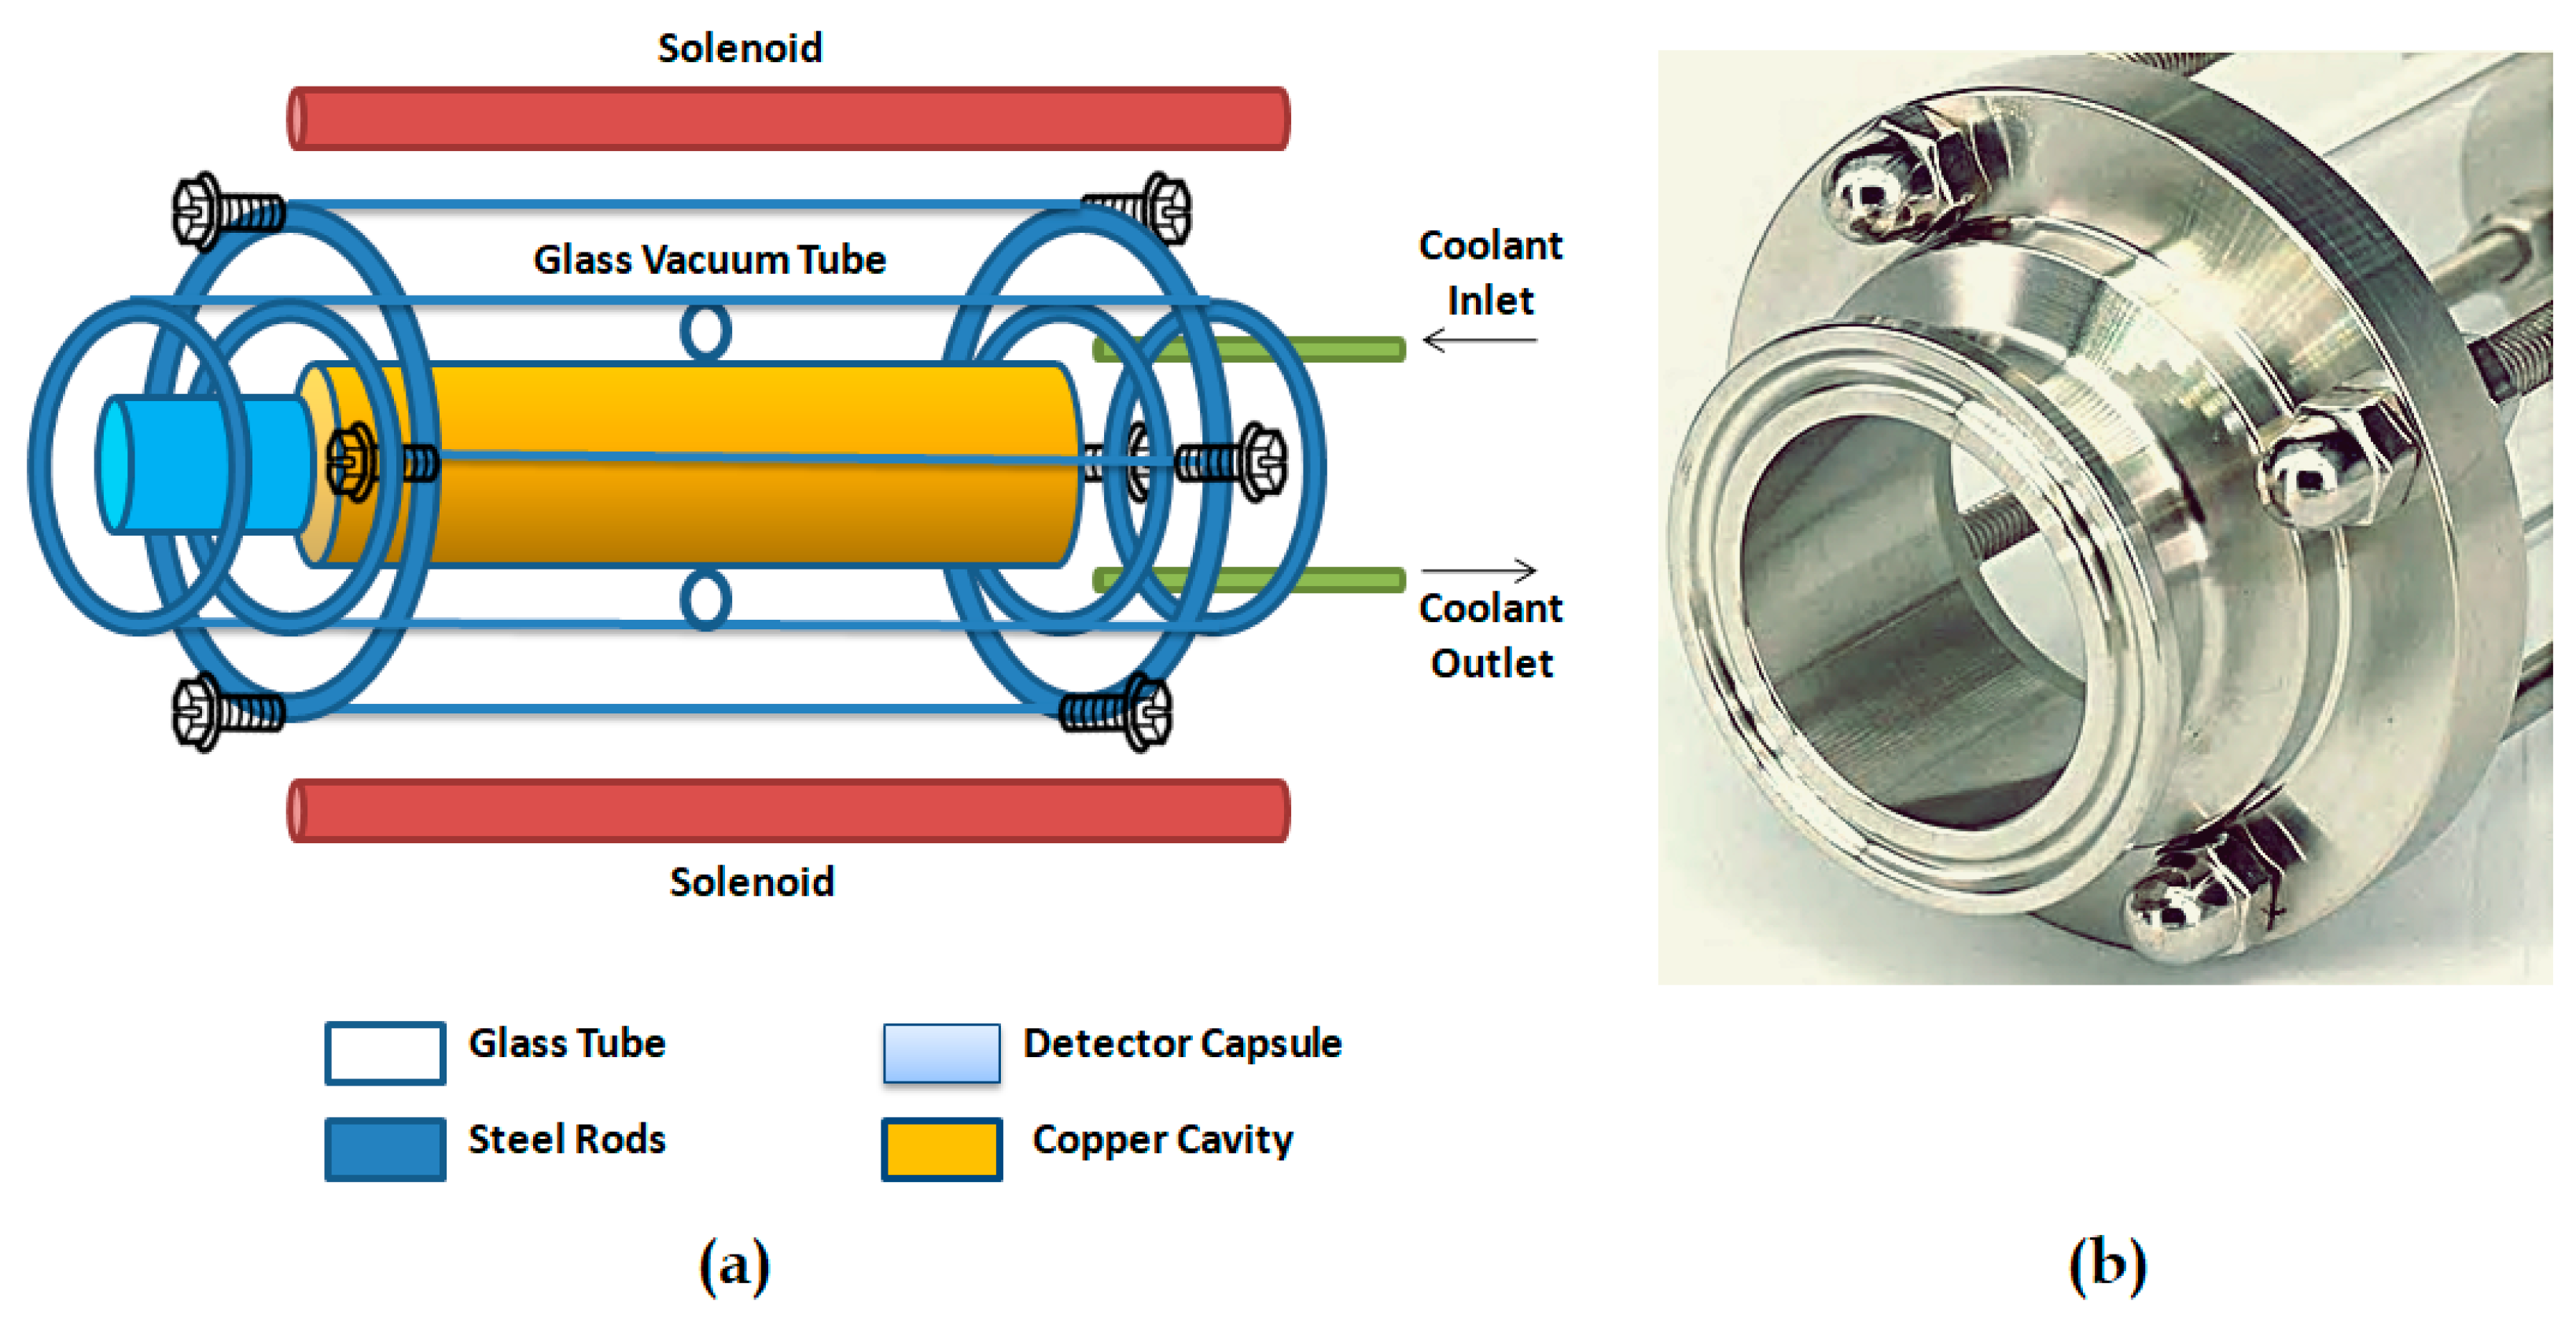
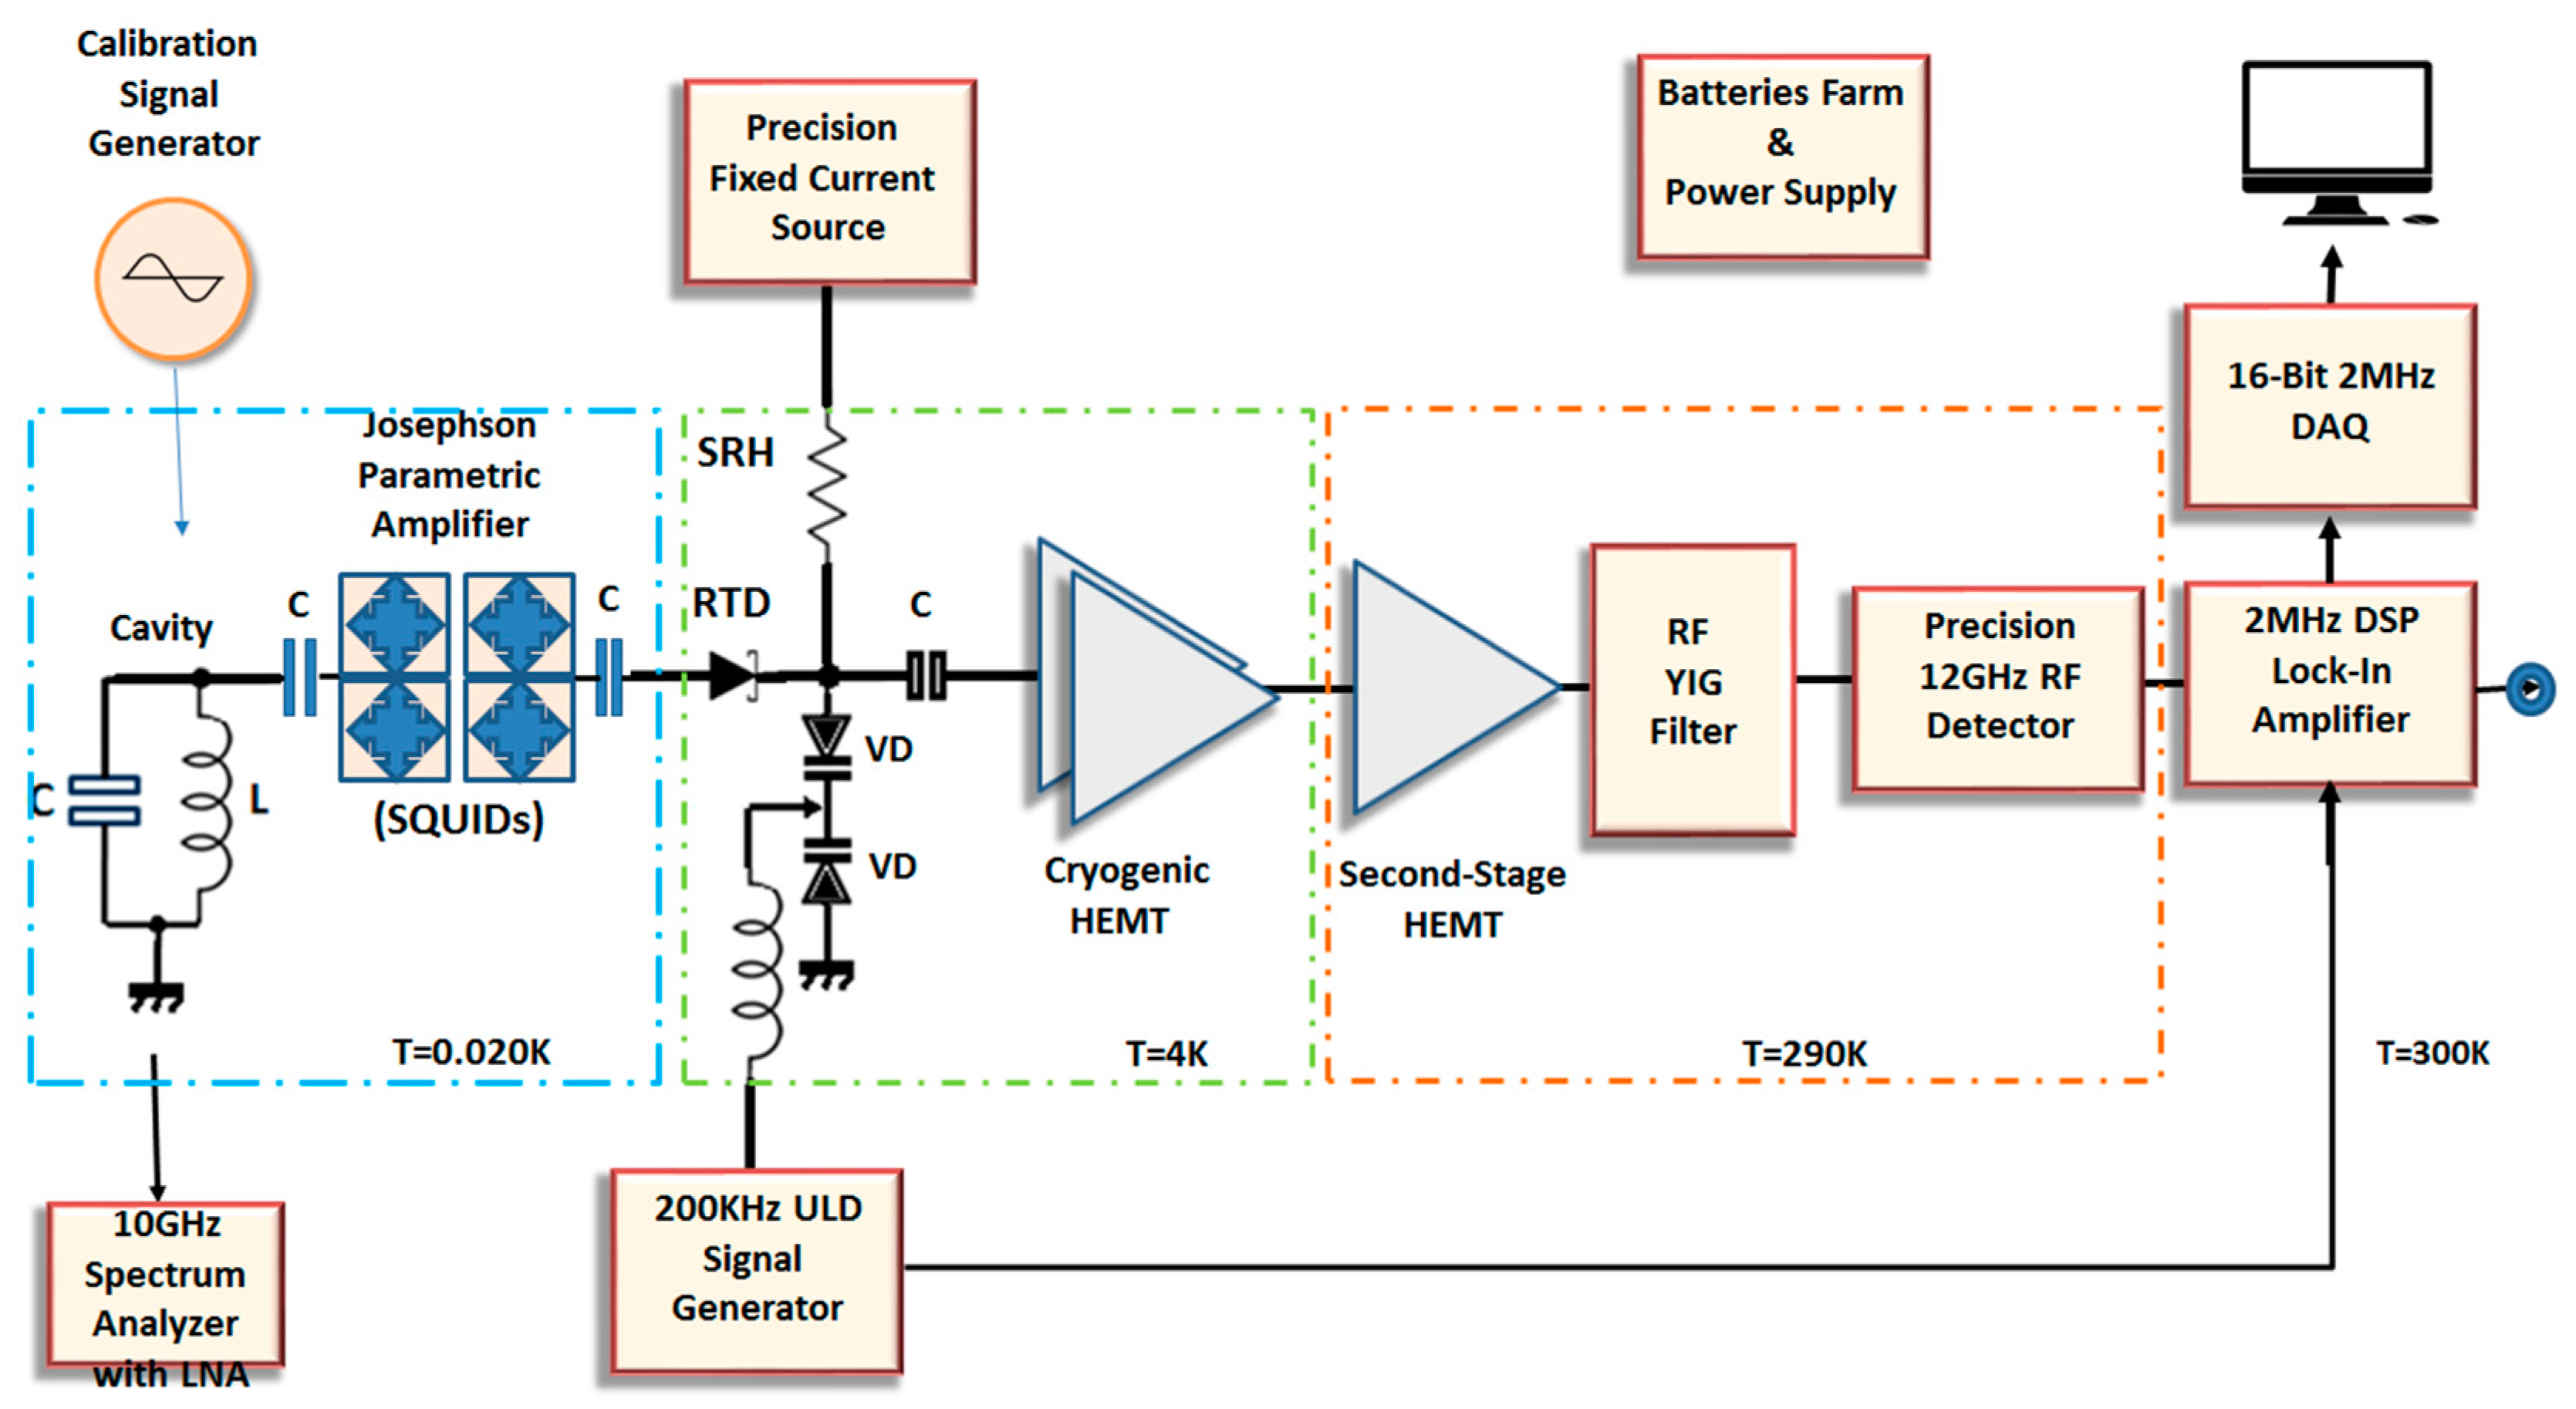
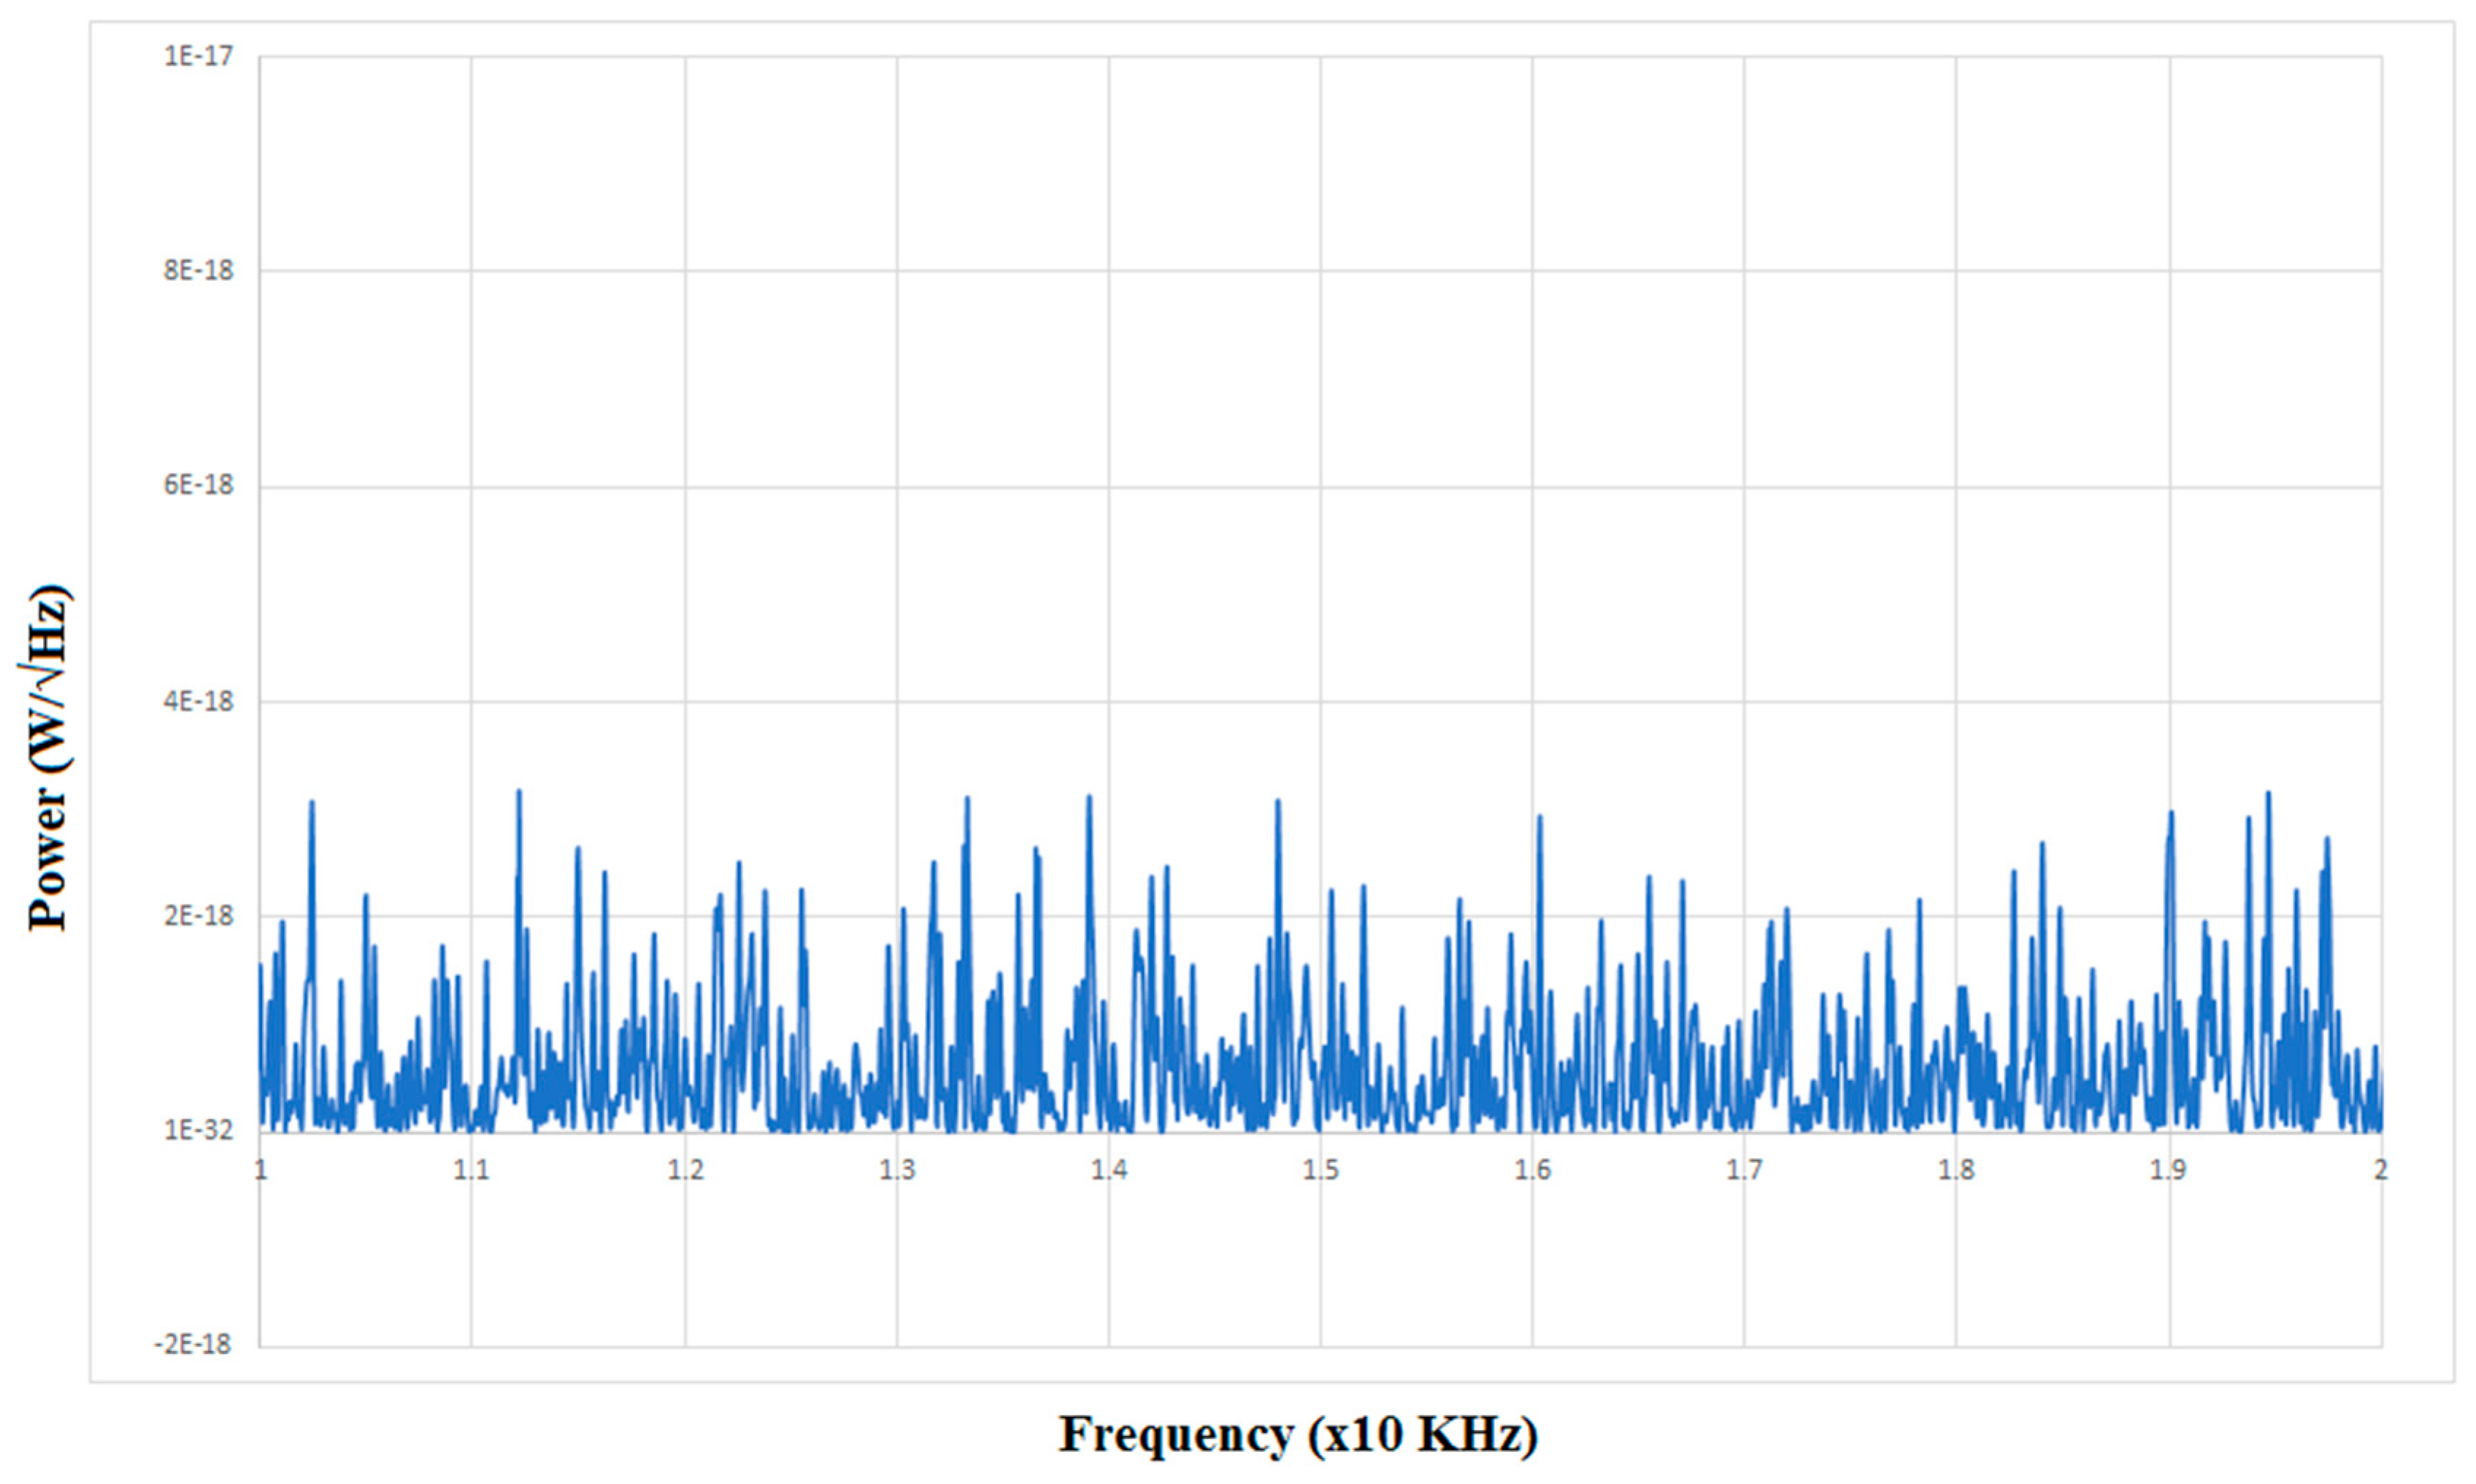
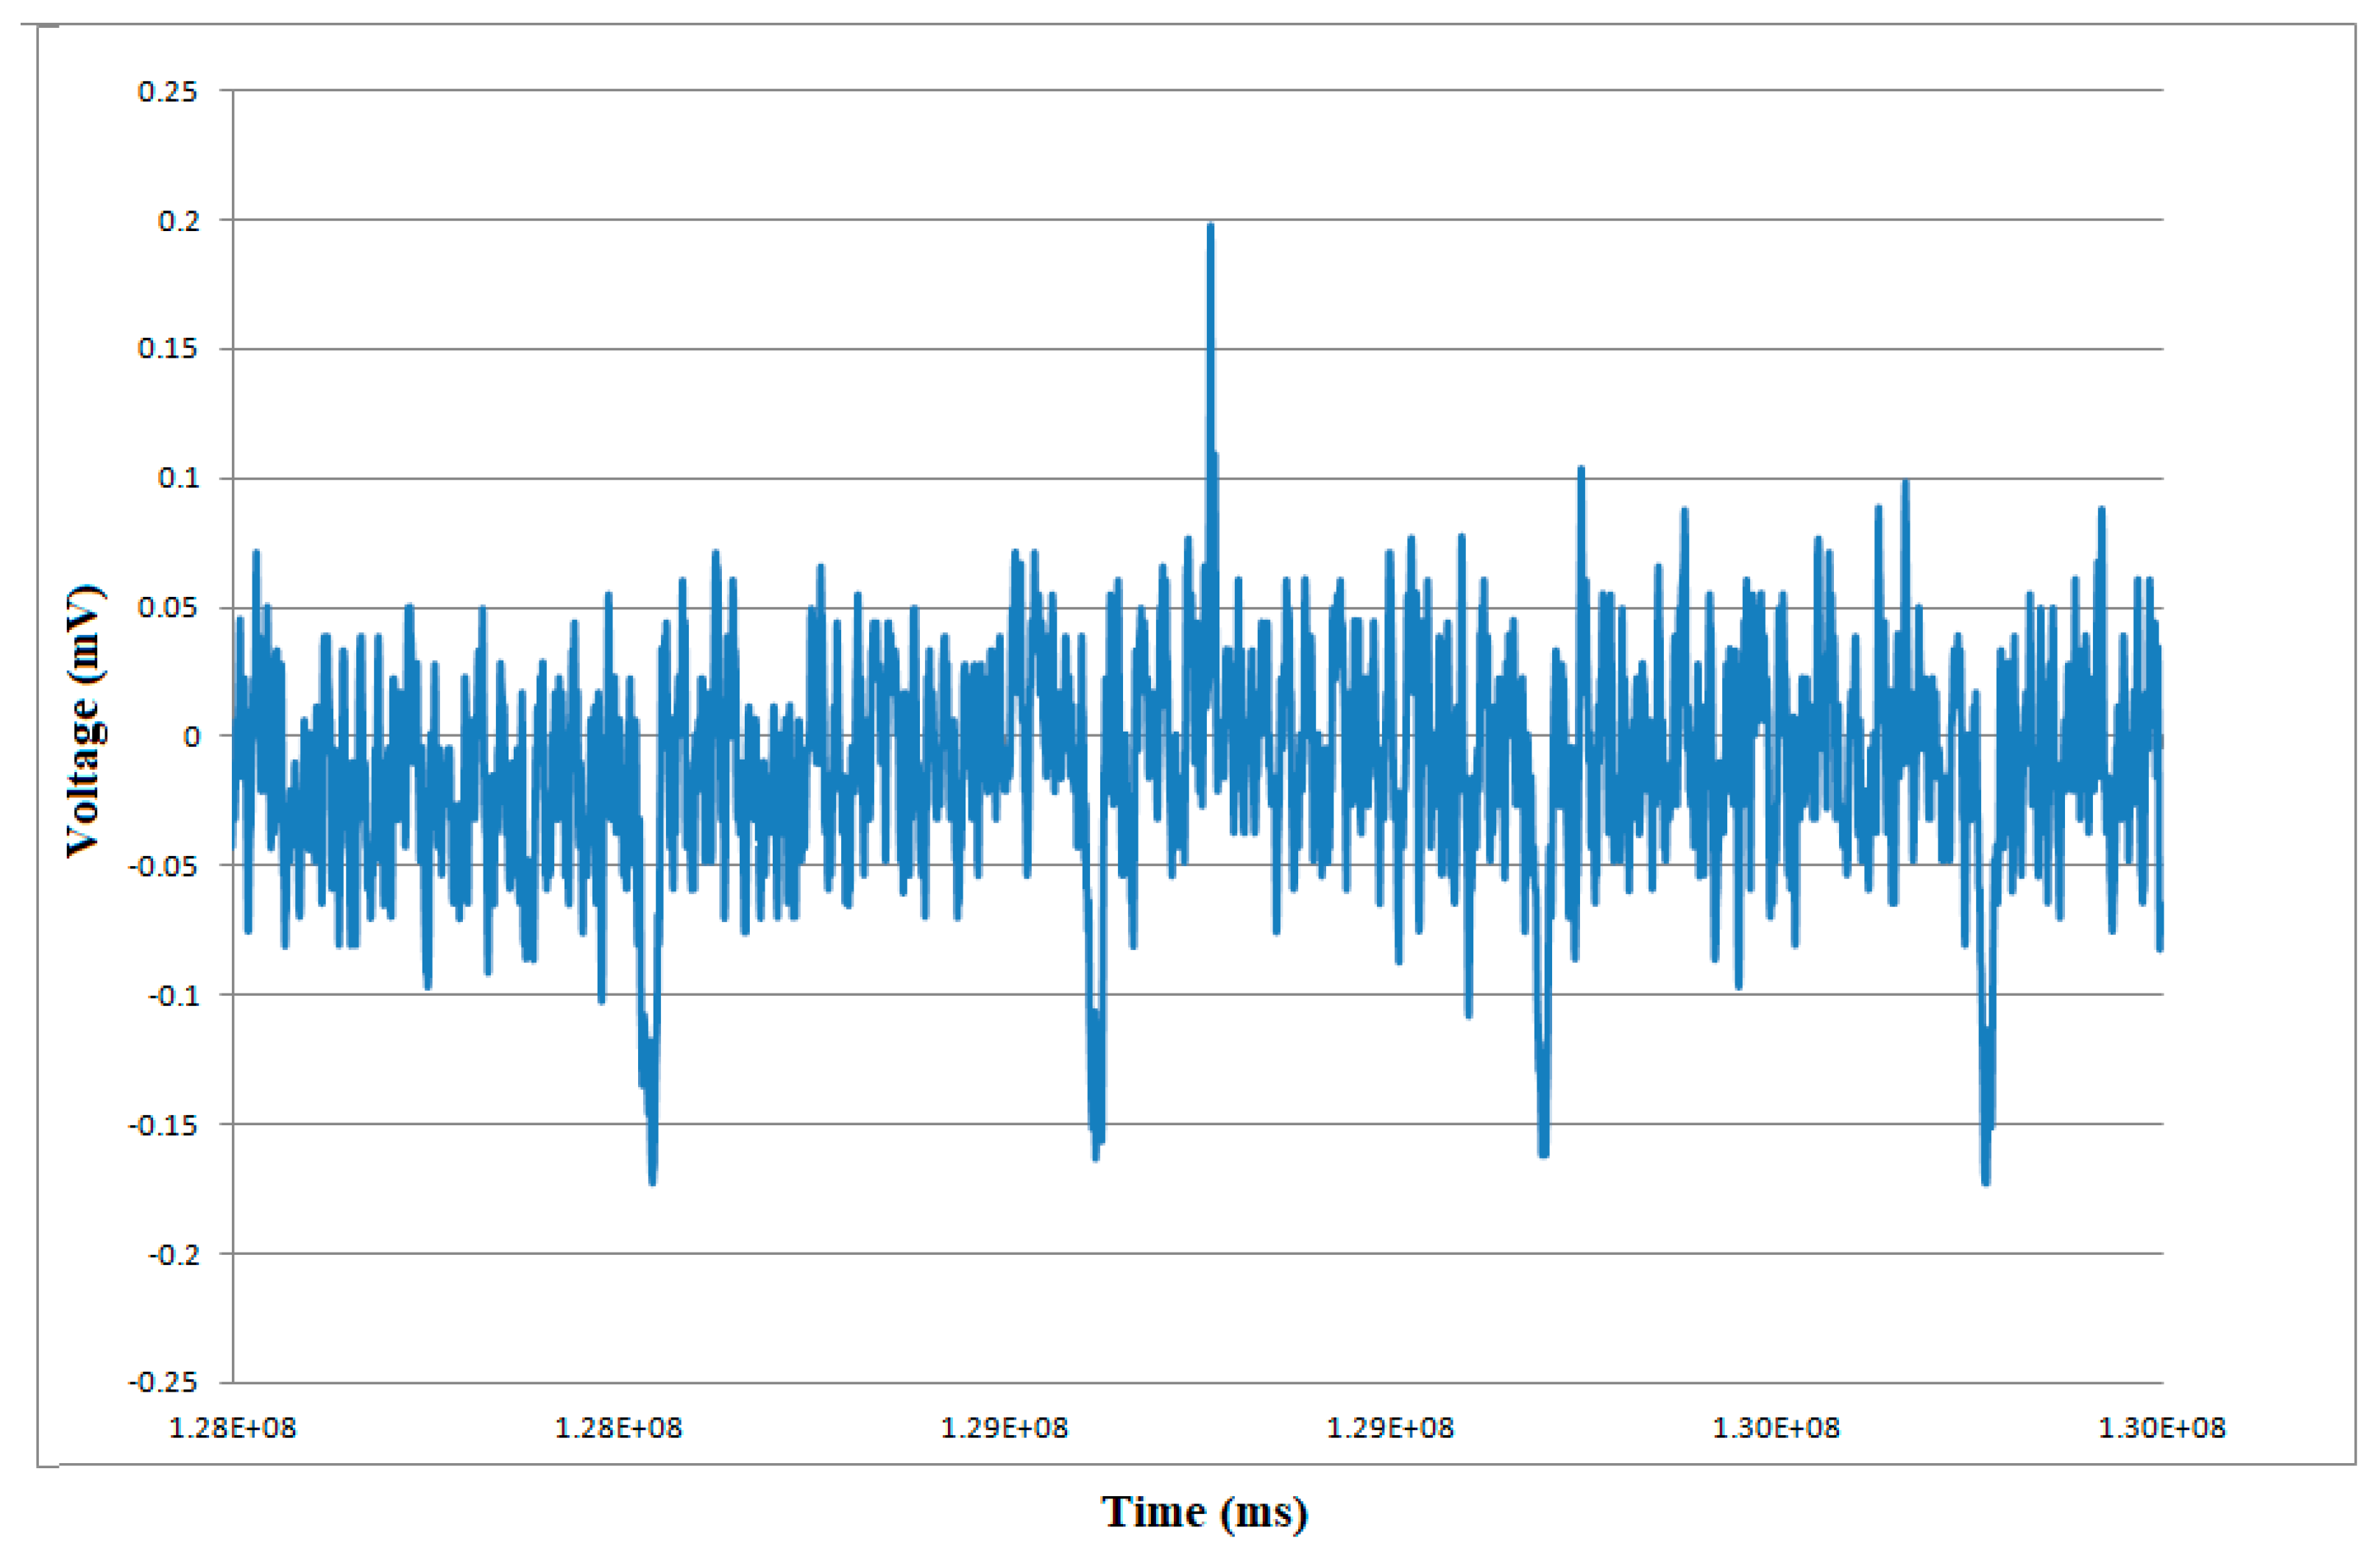
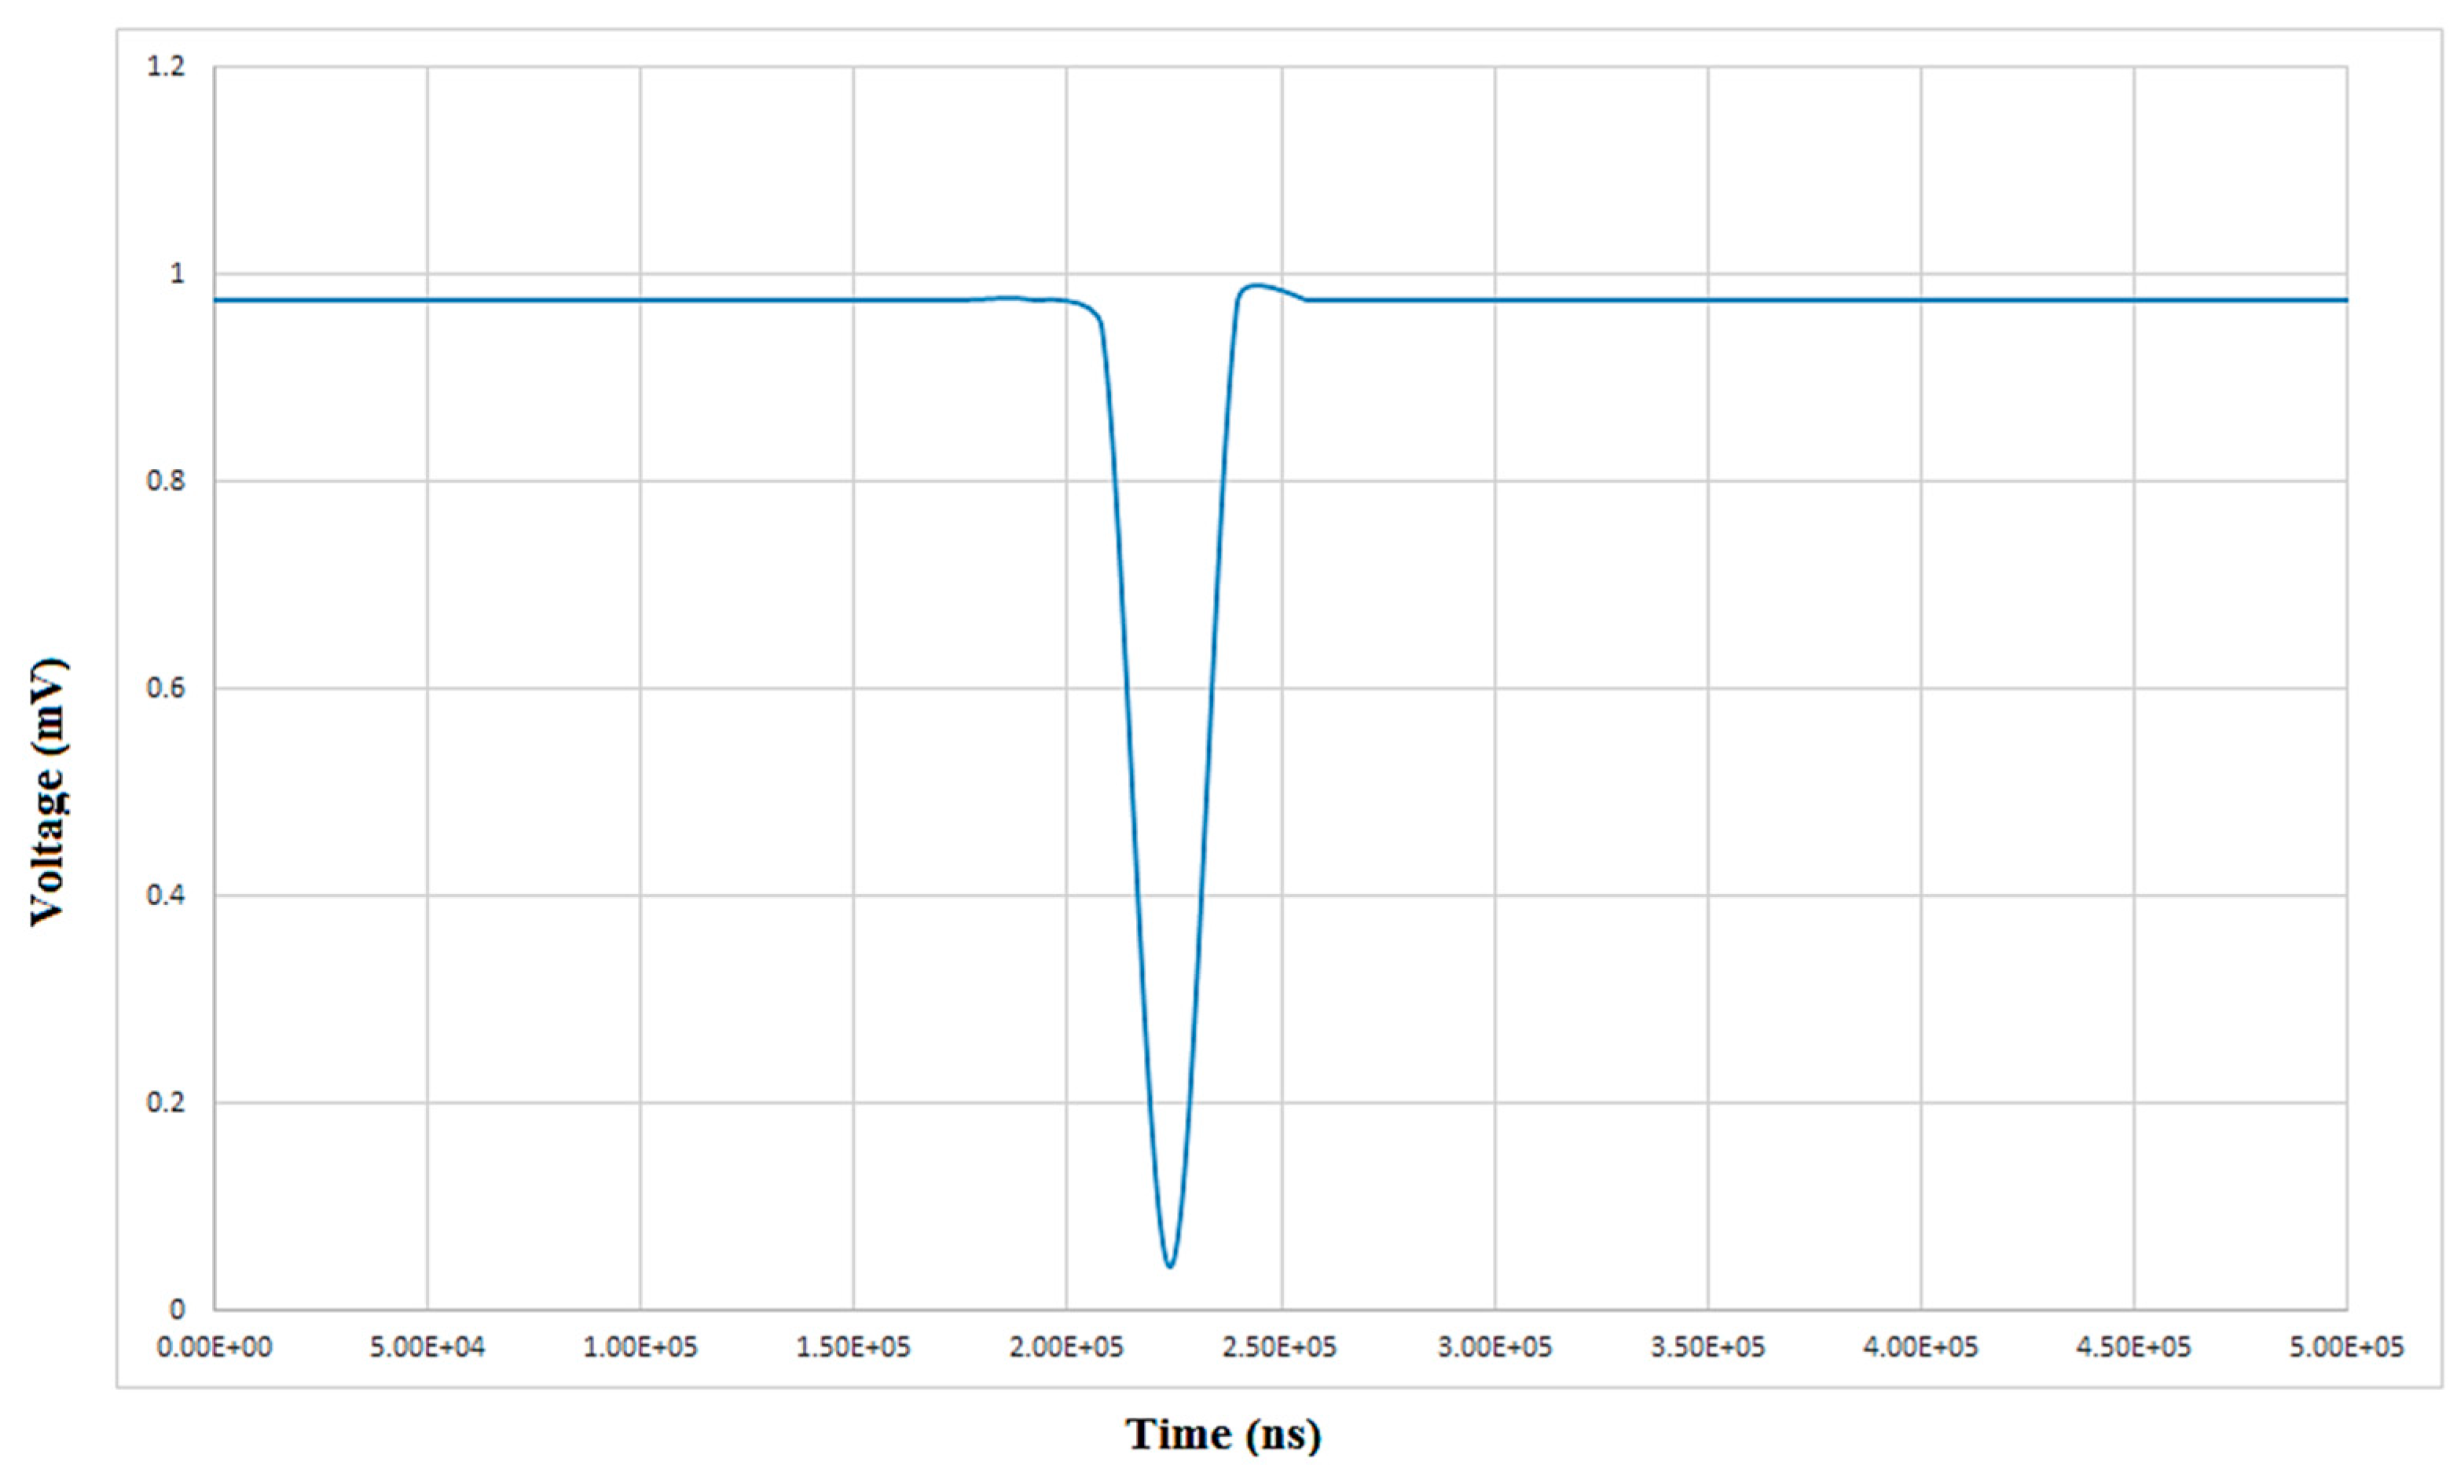
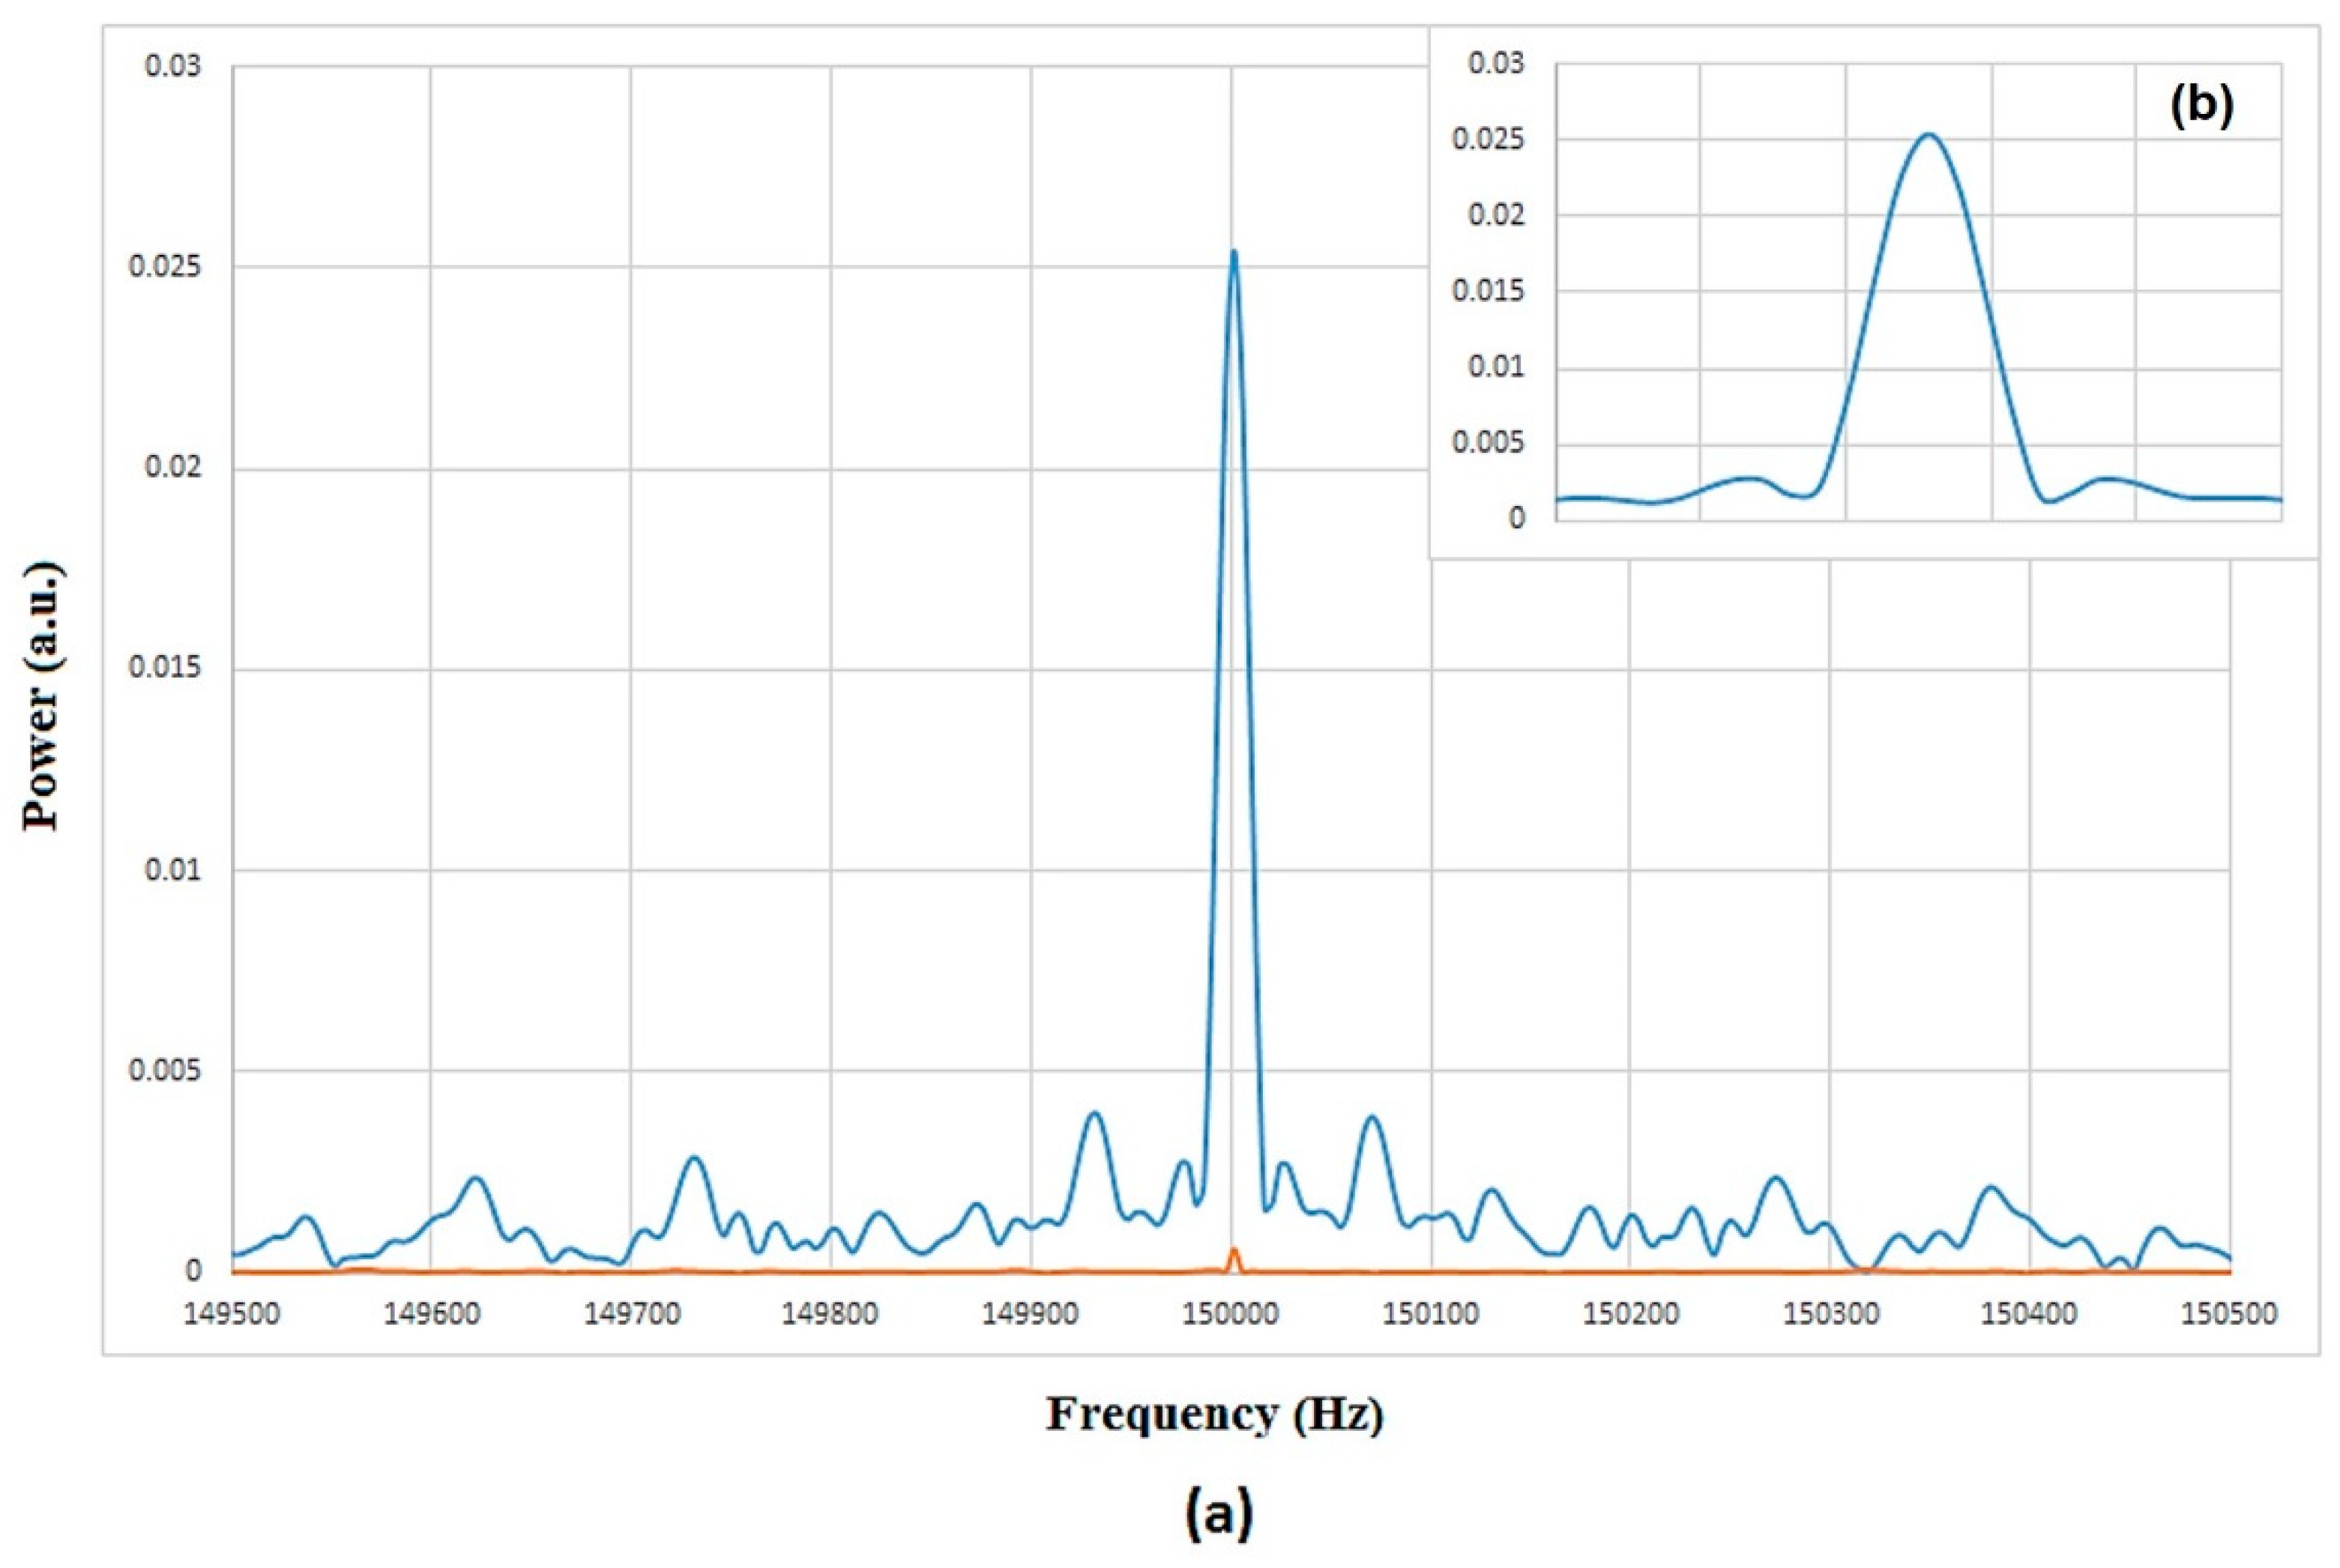
Table 1.
Specifications of our proposed axion model and detection parameters.
| Parameter | Value/Range |
|---|---|
| Mass (ma) | 22.5 ± 0.5 μeV to 112.5 ± 0.5 μeV |
| Corresponding Resonant Frequency (Axion Compton Frequency) (νres/νc) | 5.4 ± 0.12 GHz to 27.0 ± 0.12 GHz |
| Mean Axion Mass (〈m〉) | 101.25 + 0.5 μeV |
| Axion Coupling/Decay Constant (fa) | 1011 to 1010 GeV |
| Cosmological Axion Model | KSVZ/DFSZ |
| Axion-γγ Coupling (gaγγ) | 10−15 to 10−13 GeV−1 |
| Corresponding Compton Wavelength (λc) | 0.05 to 0.01 m |
| Galactic Axion Velocity (va) | 2.3 × 10⁵ ms−1 |
| DM Density (Ωdm) | 0.3 0.1 GeV·cm3 |
| Axion Density (Ωa) | 0.323 ± 0.1 GeV·cm3 |
| Cavity Radius (r) | 2.1 cm to 4.2 mm |
| Cavity Length (l) | 24 cm |
| Cavity Mode (TMφρz) and Form Factor (Cφρz) | TM010~0.5 |
| Cavity Quality Factor (Q0) | 0.75–1.0 × 10⁵ |
| Magnetic Field Intensity (B) | 8.0–10.0 T |
Table 2.
System noise registry. The left column enumerates the working physical temperature (Tphys) of each component whereas the middle column depicts the maximum noise temperature (Tn) of each component in the system and respective percentage of the overall noise overhead. The total overhead is the system temperature (Tsys). The far right column gives an estimate of the gain at each stage. Note that the RTD gain listed is the gain obtained while operating in its negative conductance region and in the wake of resonance.
| Component | Tphys (K) | TnK (%) | Gain (dB) |
|---|---|---|---|
| Cavity | 0.020 | 0.020 (0.2) | 0 |
| JPA | 0.020 | 1.2 (4) | 15–25 |
| RTD | 2.0–4.0 | 1.0 (1) | 5–10 |
| cHEMT | 1.2–2.0 | 2 (5) | 28–38 |
| HEMT | 290 | 65 (80) | 40 |
| Cables | Various | 8 (10) | −10 |
| Total | ~78 (~100) | 78–100 |
© 2020 by the author. Licensee MDPI, Basel, Switzerland. This article is an open access article distributed under the terms and conditions of the Creative Commons Attribution (CC BY) license (http://creativecommons.org/licenses/by/4.0/).
Share and Cite
MDPI and ACS Style
Bukhari, M.H.S. A Table-Top Pilot Experiment for Narrow Mass Range Light Cold Dark Matter Particle Searches. Universe 2020, 6, 28. https://0-doi-org.brum.beds.ac.uk/10.3390/universe6020028
AMA Style
Bukhari MHS. A Table-Top Pilot Experiment for Narrow Mass Range Light Cold Dark Matter Particle Searches. Universe. 2020; 6(2):28. https://0-doi-org.brum.beds.ac.uk/10.3390/universe6020028
Chicago/Turabian StyleBukhari, Masroor H. S. 2020. "A Table-Top Pilot Experiment for Narrow Mass Range Light Cold Dark Matter Particle Searches" Universe 6, no. 2: 28. https://0-doi-org.brum.beds.ac.uk/10.3390/universe6020028
Note that from the first issue of 2016, this journal uses article numbers instead of page numbers. See further details here.