
NuFIT: Three-Flavour Global Analyses of Neutrino Oscillation Experiments


1
Institució Catalana de Recerca i Estudis Avançats (ICREA), Pg. Lluis Companys 23, E-08010 Barcelona, Spain
2
Departament d’Estructura i Constituents de la Matèria, Universitat de Barcelona, 647 Diagonal, E-08028 Barcelona, Spain
3
C.N. Yang Institute for Theoretical Physics, SUNY at Stony Brook, Stony Brook, NY 11794-3840, USA
4
Instituto de Física Teórica UAM/CSIC, Calle de Nicolás Cabrera 13–15, Universidad Autónoma de Madrid, Cantoblanco, E-28049 Madrid, Spain
5
Institut für Astroteilchenphysik, Karlsruher Institut für Technologie (KIT), D-76021 Karlsruhe, Germany
*
Authors to whom correspondence should be addressed.
Universe 2021, 7(12), 459; https://0-doi-org.brum.beds.ac.uk/10.3390/universe7120459
Submission received: 25 October 2021
/
Revised: 18 November 2021
/
Accepted: 20 November 2021
/
Published: 24 November 2021
(This article belongs to the Special Issue Studying the Universe from Spain)
Abstract
:In this contribution, we summarise the determination of neutrino masses and mixing arising from global analysis of data from atmospheric, solar, reactor, and accelerator neutrino experiments performed in the framework of three-neutrino mixing and obtained in the context of the NuFIT collaboration. Apart from presenting the latest status as of autumn 2021, we discuss the evolution of global-fit results over the last 10 years, and mention various pending issues (and their resolution) that occurred during that period in the global analyses.
1. Introduction
The observation of flavour transitions in neutrino propagation in a variety of experiments has established beyond doubt that lepton flavours are not symmetries of nature. The dependence of the probability of observed flavour transitions with the distance travelled by the neutrinos and their energy has allowed for singling out neutrino masses and the mixing in weak charged current interactions of the massive neutrino states as the responsible mechanism for the observed flavour oscillations [1,2] (see [3] for an overview).
At the time of writing this minireview, neutrino oscillation effects have been observed in:
- solar neutrinos produced in nuclear reactions that make the Sun shine. Results included in the present determination of the flavour evolution of solar neutrinos comprise the total event rates in radiochemical experiments Chlorine [7], Gallex/GNO [8], and SAGE [9], and the time- and energy-dependent rates in the four phases of Super-Kamiokande [10,11,12,13], the three phases of SNO [14], and Borexino [15,16,17].
- neutrinos produced in accelerators and detected at distance , in the so-called long baseline (LBL) experiments, and in which neutrino oscillations have been observed in two channels:
- produced in nuclear reactors. Their disappearance was observed in their measured energy spectrum at two distinctive baselines.
These results imply that neutrinos are massive and there is physics beyond the Standard Model (BSM).
The first step towards the discovery of the underlying BSM dynamics for neutrino masses is the detailed characterisation of the minimal low-energy parametrisation that can describe the bulk of results. This requires global analysis of oscillation data as they become available. At present, such combined analyses are in the hands of a few phenomenological groups (see, for example, [26,27,28,29]). Results obtained by the different groups are generically in good agreement, which provides a test of the robustness of the present determination of the oscillation parameters. The NuFIT Collaboration [30] was formed in this context about one decade ago by the three authors of this article with the goal of providing timely updated global analysis of neutrino oscillation measurements determining the leptonic mixing matrix and the neutrino masses in the framework of the Standard Model extended with three massive neutrinos. We published five major updates of the analysis [31,32,33,34,35,36], while intermediate updates are regularly posted in the NuFIT website [30]. Over the years, the work of a number of graduate students and postdocs has been paramount to the success of the project: Johannes Bergström [33], Ivan Esteban [34,35,36], Alvaro Hernandez-Cabezudo [35], Ivan Martinez-Soler [34], Jordi Salvado [31], and Albert Zhou [36].
2. New Minimal Standard Model with Three Massive Neutrinos
The Standard Model (SM) is a gauge theory built to explain the strong, weak, and electromagnetic interactions of all known elementary particles. It is based on gauge symmetry and is spontaneously broken to by the Higgs mechanism, which provides a vacuum expectation value for a Higgs doublet field . The SM contains three fermion generations and the chiral nature of the part of the gauge group that is partly responsible for the weak interactions implies that right- and left-handed fermions experience different weak interactions. Left-handed fermions are assigned to the doublet representation, while right-handed fermions are singlets. Because of the vector nature of and interactions, both left- and right-handed fermion fields are required to build electromagnetic and strong currents. Neutrinos are the only fermions that have neither color nor electric charge. They only feel weak interactions. Consequently, right-handed neutrinos are singlets of the full SM group and thereby have no place in the SM of particle interactions.
As a consequence of the gauge symmetry and group representations in which fermions are assigned, the SM possesses accidental global symmetry , where is the baryon number symmetry, and are the three lepton flavour symmetries.
In the SM, fermion masses are generated by Yukawa interactions that couple the right-handed fermion (-singlet) to the left-handed fermion (-doublet) and the Higgs doublet. After electroweak spontaneous symmetry breaking, these interactions provide charged fermion masses. No Yukawa interaction can be written that would give mass to the neutrino because no right-handed neutrino exists in the model. Furthermore, any neutrino mass term built with the left-handed neutrino fields would violate , which is a subgroup of the accidental symmetry group. As such, it cannot be generated by loop corrections within the model. It can also not be generated by nonperturbative corrections because the subgroup of the global symmetry is nonanomalous.
From these arguments, it follows that the SM predicts that neutrinos are strictly massless. It also implies that there is no leptonic flavour mixing, and that there is no possibility of CP violation of the leptons. However, as described in the introduction, we have now undoubted experimental evidence that leptonic flavours are not conserved in neutrino propagation. The Standard Model must thus be extended.
The simplest extension capable of describing the experimental observations must include neutrino masses. Let us call this minimal extension the Minimally Extended Standard Model (NMSM). In fact, this simplest extension is not unique because, unlike for charged fermions, one can construct a neutrino mass term in two different forms:
- in one minimal extension, right-handed neutrinos are introduced, and that the total lepton number is still conserved is imposed. In this form, gauge invariance allows for a Yukawa interaction involving . and the lepton doublet, in analogy to the charged fermions, after electroweak spontaneous symmetry breaking the NMSM Lagrangian, reads:In this case, the neutrino mass eigenstates are Dirac fermions, and neutrino and antineutrinos are distinct fields, i.e., ( here represents the charge conjugate neutrino field). This NMSM is gauge-invariant under the SM gauge group.
- In another minimal extension, a mass term is constructed employing only the SM left-handed neutrinos by allowing for the violation of the total lepton number. In this case, the NMSM Lagrangian isIn this NMSM, mass eigenstates are Majorana fermions, . The Majorana mass term above breaks electroweak gauge invariance.
Consequently, can only be understood as a low-energy limit of a complete theory, while is formally self-consistent. However, in either NMSM, lepton flavours are mixed into the charged-current interactions of the leptons. We denote the neutrino mass eigenstates by with , and the charged lepton mass eigenstates by ; then, the leptonic charged-current interactions of those massive states are given by
where U is the leptonic mixing matrix analogous to the CKM matrix for the quarks. Leptonic mixing generated this way is, however, slightly more general than the CKM flavour mixing of quarks because the number of massive neutrinos (n) is unknown. This is so because right-handed neutrinos are SM singlets; therefore, there are no constraints on their number. As mentioned above, unlike charged fermions, neutrinos can be Majorana particles. As a consequence, the number of new parameters in the model NMSM depends on the number of massive neutrino states and on whether they are Dirac or Majorana particles.
In most generality U in Equation (3) is a matrix, and verifies but in general . In this review, however, we focus on analyses made in the context of only three neutrino massive states, which is the simplest scheme to consistently describe data listed in the introduction. In this case, the three known neutrinos (, , ) can be expressed as quantum superpositions of three massive states () with masses , and the leptonic mixing matrix can be parametrized as [37]:
where and . In addition to Dirac-type phase , analogous to that of the quark sector, there are two physical phases, and , associated to a possible Majorana character of neutrinos that, however, are not relevant for neutrino oscillations.
A consequence of the presence of neutrino masses and the leptonic mixing is the possibility of mass-induced flavour oscillations in vacuum [1,2], and of flavour transitions when a neutrino traverses regions of dense matter [38,39]. Generically, the flavour transition probability in vacuum presents an oscillatory L dependence with phases proportional to and amplitudes proportional to different elements of mixing matrix. The presence of matter in the neutrino propagation alters both the oscillation frequencies and the amplitudes (see [3] for an overview).
In the convention of Equation (4), the disappearance of solar and long baseline reactor dominantly proceeds via oscillations with wavelength ( and by convention) and amplitudes controlled by , while the disappearance of atmospheric and LBL accelerator dominantly proceeds via oscillations with wavelength and amplitudes controlled by . Generically, controls the amplitude of oscillations involving flavour with wavelengths. Angles can be taken to lie in the first quadrant, , and phase . Values of different from 0 and imply CP violation in neutrino oscillations in vacuum. In this convention, is positive by construction. Moreover, given the observed hierarchy between the solar and atmospheric wavelengths, there are two possible nonequivalent orderings for the mass eigenvalues:
- so , referred to as Normal Ordering (NO);
- so referred to as Inverted Ordering (IO).
The two orderings, therefore, correspond to the two possible choices of the sign of . In NuFIT, we adopted the convention of reporting results for for NO and for IO, i.e., we always use the one that has the larger absolute value. We sometimes generically denote such quantity as , with for NO and for IO.
In summary, oscillation analysis of the existing data involves a total of six parameters: two mass-squared differences (one of which can be positive or negative), three mixing angles, and CP phase . For the sake of clarity, we summarise which experiment contributes dominantly to the present determination of the different parameters in Table 1.
3. NuFIT Results: The Three-Neutrino Paradigm
The latest determination of the six parameters in the new NMSM is presented in Table 2, corresponding to NuFIT 5.1 analysis [30,36]. Progress in the determination of these parameters over the last decade is illustrated in Figure 1, which shows the one-dimensional projections of the from global analysis as a function of each of the six parameters, obtained in the first NuFIT 1.0 analysis and the last NuFIT 5.1 in the upper and lower rows, respectively.
To further illustrate the improvement on the robust precision on the determination of these parameters over the last decade, we could compute the relative precision of parameter x
where and are the upper and lower bounds on parameter x at the level. Doing so, we find the following change in the relative precision (marginalising over ordering):
In the last two columns, numbers between brackets show the impact of including tabulated SK-atm data (see Section 3.3) in the precision of the determination of such a parameter. Since the profile of is not Gaussian, the precision estimation above for is only indicative. In addition, the last line shows the between orderings that, for NuFIT 1.0, changed from to depending on the choice of normalisation for the reactor fluxes.
Besides the expected improvement on the precision associated with the increased statistics of some of the experiments and the addition of data from new experiments, there were a number of issues entering analysis, which changed over the covered period. Next, we briefly comment on those.
3.1. Reactor Neutrino Flux Uncertainties
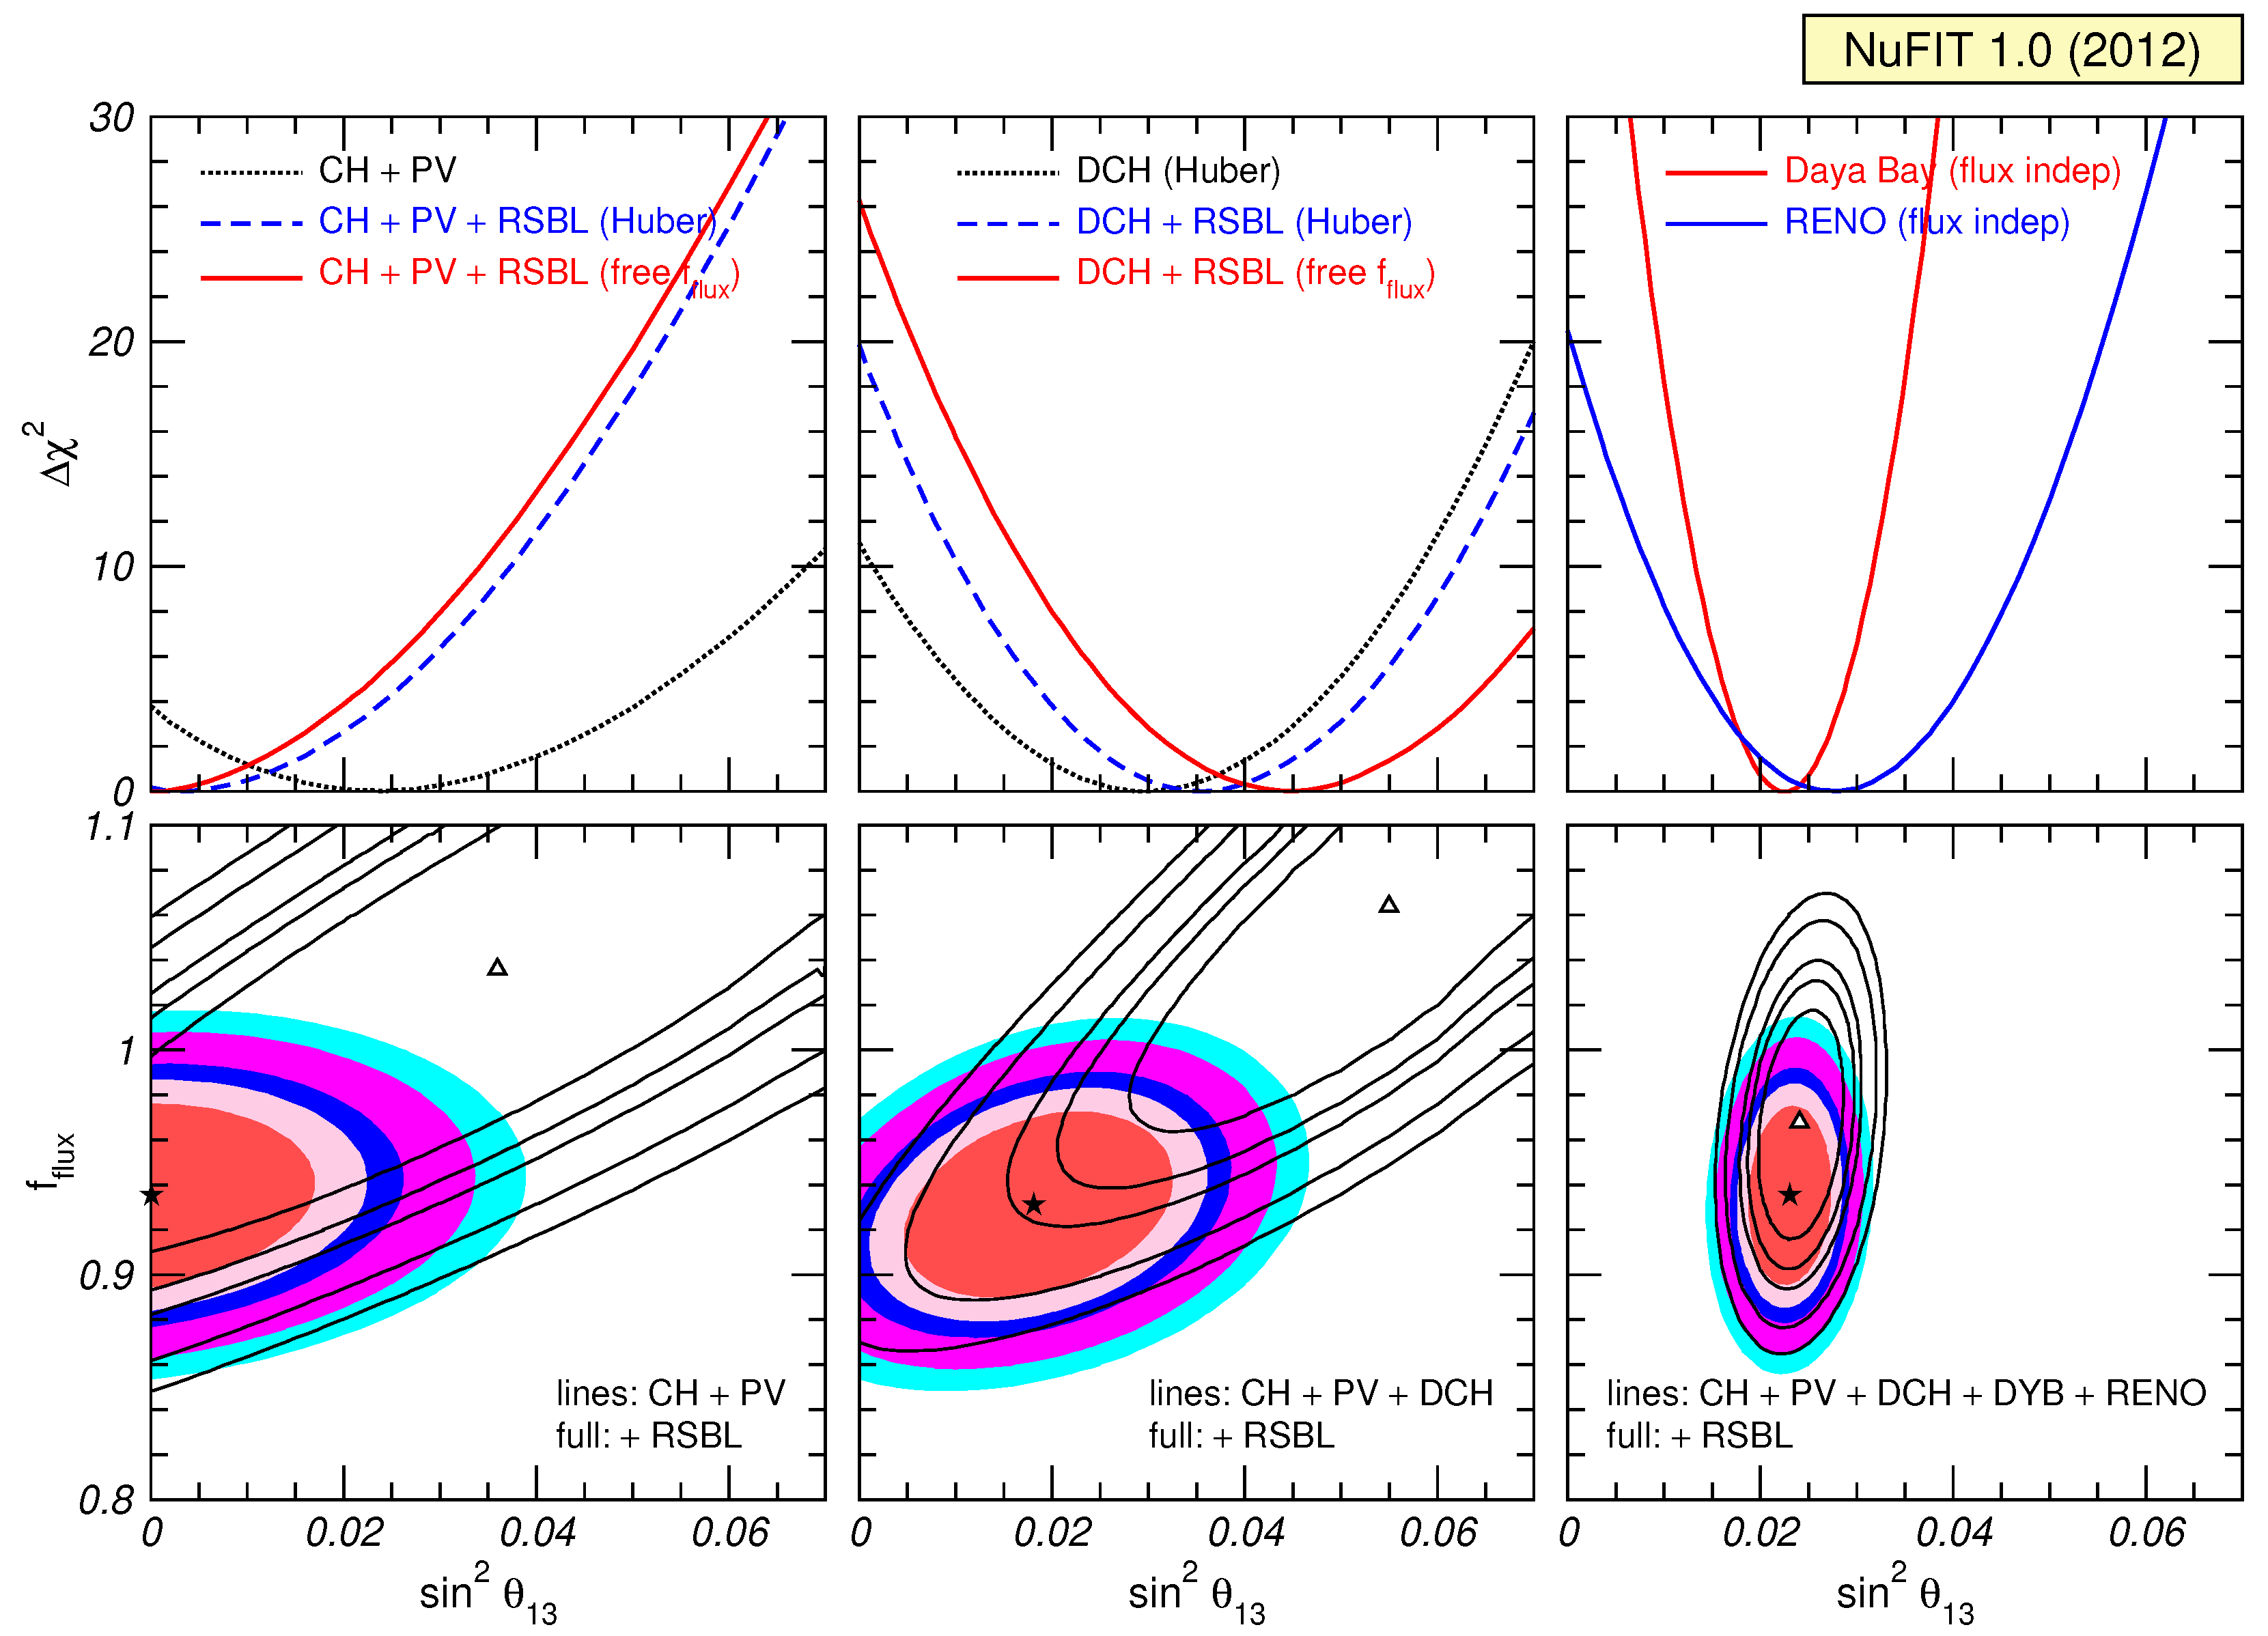
The NuFIT 1.0 analysis, which was conducted soon after the first results from the medium baseline () reactor experiments Daya Bay [41], RENO [42], and Double Chooz [43], provided a positive determination of mixing angle . Data from those experiments were analysed with those from finalised reactor experiments Chooz [44] and Palo Verde [45]. Analysis of reactor experiments without a near detector, in particular Chooz, Palo Verde and the early measurements of Double Chooz, depends on the expected rates as computed with some prediction for the neutrino fluxes from the reactors.
At about the same time, the so-called reactor anomaly was first pointed out. It amounted to the fact that the most updated reactor flux calculations in [40,46,47] resulted in an increase in the predicted fluxes and a reduction in uncertainties. Compared to those fluxes, results from finalised reactor experiments at baselines ≲100 m such as Bugey4 [48], ROVNO4 [49], Bugey3 [50], Krasnoyarsk [51,52], ILL [53], Gösgen [54], SRP [55], and ROVNO88 [56] showed a deficit. In the framework of three flavour oscillations, these reactor short-baseline experiments (RSBL) were not sensitive to oscillations, but at the time played an important role in constraining the unoscillated reactor neutrino flux. So, they could be used as an alternative to theoretically calculated reactor fluxes.
The dependence of these early determinations of on the reactor flux modeling is illustrated in Figure 2. The upper panels contain the from Chooz, Palo Verde, Double Chooz, Daya Bay, and RENO as a function of for different choices for the reactor fluxes. The upper-left panel shows that, when the fluxes from [40] had been employed and RSBL reactor experiments had not been included in the fit, all experiments, including Chooz and Palo Verde, preferred . However, when the RSBL reactor experiments had been added to the fit, such preference vanished [57], and that happened independently of whether flux normalisation was left as a free parameter or not. This can also be inferred from the lower-left panel, which shows contours in the (, ) plane for analysis of Chooz and Palo Verde with and without the inclusion of RSBL data. The central panels show the dependence of the determination of from analysis of Double Chooz on the choice of reactor fluxes: the best-fit value and statistical significance of the nonzero signal in this experiment significantly depended on the reactor flux assumption. This was due to the lack of the near detector in Double Chooz at the time.
In view of this, and in order to properly assess the impact of the reactor anomaly on the allowed range of neutrino parameters in NuFIT 1.0, the global analysis was performed under two extreme choices. In the first choice (“Free fluxes + RSBL” in Figure 1) we left the normalisation of reactor fluxes free, and included data from RSBL experiments. In the second option (“Huber”), we did not include the RSBL data, and assume reactor fluxes and uncertainties as predicted in [40]. The left panels of Figure 1 show that this choice resulted in an additional uncertainty of about on various observables.
Being equipped with a near detector, the determination of from Daya Bay and RENO was unaffected by the reactor anomaly. As their statistics increased, and with the entrance in operation of the Double Chooz near detector, the impact of the reactor flux normalisation uncertainty steadily decreased, reduced to in NuFIT 2.0 analysis, and becoming essentially irrelevant in NuFIT 3.0.
In what respects the analysis of KamLAND long baseline reactor data, since NuFIT 4.0 we have been relying on the precise reconstruction of the reactor neutrino fluxes (both overall normalisation and energy spectrum) provided by the Daya Bay near detectors [58], which renders also the KamLAND analysis largely independent of the reactor anomaly. As a side effect, this change in the KamLAND reactor flux model is responsible for the slight increase (from 14% to 16%) of the uncertainty which can be observed in Equation (5).
3.2. Status of in Solar Experiments versus KamLAND
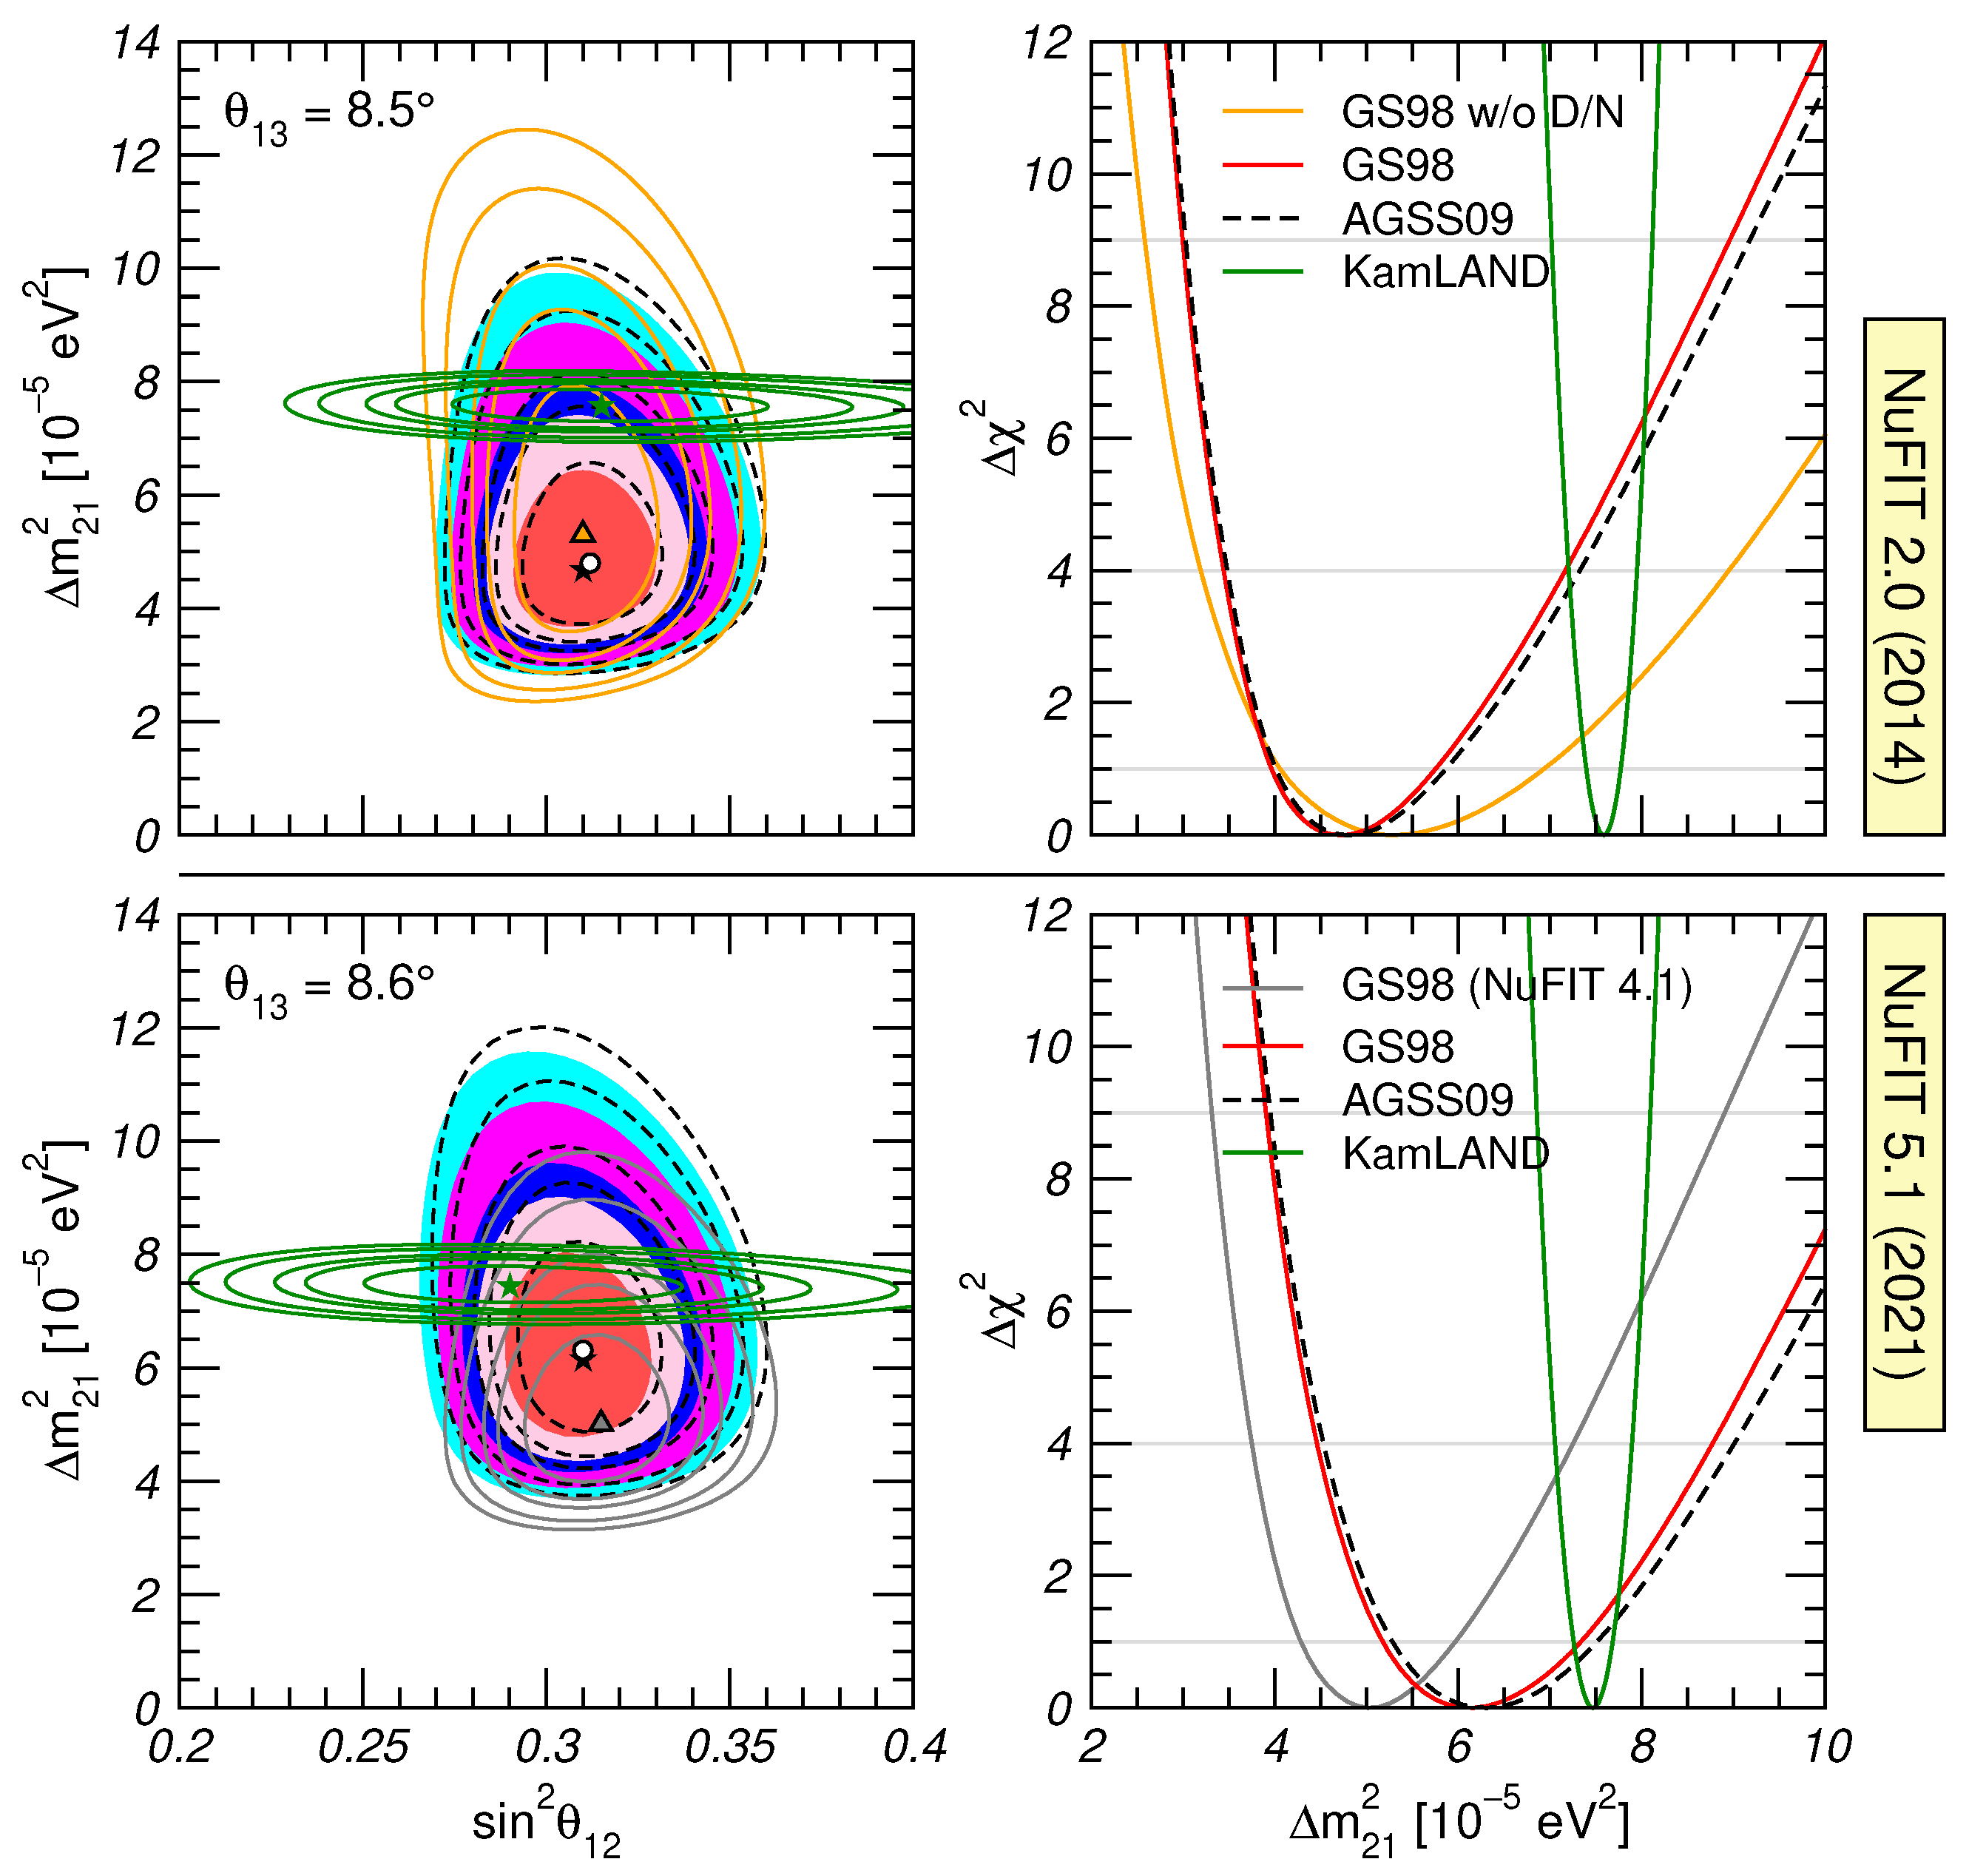
Analyses of the solar experiments and of KamLAND give the dominant contribution to the determination of and . Starting with NuFIT 2.0, and as illustrated in the upper panels in Figure 3, results of global analyses showed a value of preferred by KamLAND, which was somewhat higher than the value favoured by solar neutrino experiments. This tension arose from a combination of two effects that did not significantly change till 2020:
- Super-Kamiokande observed a day–night asymmetry that was larger than expected for the value preferred by KamLAND for which Earth matter effects are very small.
These effects resulted in the best-fit value of of KamLAND in the NuFIT 2.0 fit lying at the boundary of the allowed range of the solar neutrino analysis, as seen in the upper panels in Figure 3. The tension was maintained with the increased statistics from SK-IV included in NuFIT 3.0 and the change in the reactor flux normalisation used in the KamLAND analysis since NuFIT 4.0.
The tension was resolved with the latest SK4 2970-day results included in NuFIT 5.0, which were presented at the Neutrino2020 conference [13] in the form of their total energy spectrum, which showed a slightly more pronounced turn-up in the low-energy part, and the updated day–night asymmetry
which was lower than the previously reported value .
The impact of these new data is displayed in the lower panels of Figure 3. The tension between best fit of KamLAND and that of the solar results decreased, and the preferred value from KamLAND lay at (corresponding to ). This decrease in tension was due to both the smaller day–night asymmetry (which lowered of the KamLAND best fit by units) and the slightly more pronounced turn-up in the low-energy part of the spectrum (which lowered it by one extra unit).
Lastly, in order to quantify the independence of these results on the details of the solar modelling, solar neutrino analysis in NuFIT was performed for the two versions of the Standard Solar Model, namely, the GS98 and the AGSS09 models, which emerged as a consequence of the new determination of the abundances of heavy elements because no viable Solar Standard Model could be constructed that could accommodate these new abundances with observed helioseismological data. Consequently, two different sets of models were constructed that are in better accordance with one or the other [59,60]. From the point of view of solar neutrino analysis, the existence of these two SSM variants is relevant because they differ in the predicted neutrino fluxes, in particular those generated in the CNO cycle. This introduces a possible source of theoretical uncertainty in the determination of relevant oscillation parameters. In NuFIT, we quantify this possible uncertainty by performing analysis with both models. Figure 3 shows that the determination of and is extremely robust over these variations on the modelling of the Sun.
3.3. Inclusion of Super-Kamiokande Atmospheric Neutrino Data
Atmospheric neutrinos are produced by the interaction of cosmic rays on the top of Earth’s atmosphere. In the subsequent hadronic cascades, both and , and and are produced with a broad range of energies. Furthermore, atmospheric neutrinos are produced in all possible directions. Therefore, at any detector positioned on Earth, a good fraction of events generated by the interaction of these neutrinos come from neutrinos that have traveled through Earth. For all these reasons, atmospheric neutrinos constitute a powerful tool to study the evolution of neutrino flavour in their propagation.
In the context of three flavour oscillations, atmospheric neutrino data show that the dominant oscillation channel of atmospheric neutrinos is , which in the standard convention described in Section 2 is driven by and with the amplitude controlled by . In principle, the flavour, and neutrino and antineutrino composition of atmospheric neutrino fluxes, together with a wide range of covered baselines, open up the possibility of sensitivity to subleading oscillation modes, driven by and/or , especially in light of the not-too-small value of . In particular, they could provide relevant information on the octant of , the value of , and the ordering of the neutrino mass spectrum.
In NuFIT 1.0 and NuFIT 2.0, we performed our own analysis of Super-Kamiokande atmospheric neutrino data for phases SK1–4. The analysis was based on classical data samples—sub-GeV and multi-GeV e-like and -like events, and partially contained, stopping, and through-going muons—which accounted for a total of 70 data points, and for which one could perform a reasonably accurate simulation using the information provided by the collaboration. The implications of our last SK analysis of such kind in the global picture is shown in Figure 4: the impact on both the ordering and the determination of was modest.
Around that time, Super-Kamiokande started developing a dedicated analytical methodology for constructing enriched atmospheric neutrino samples and further classifying them into -like and -like subsamples. With those, they seemed to have succeeded at increasing their sensitivity to the subleading effects. With the limited information available outside of the collaboration, it was not possible to reproduce key elements driving the main dependence on these subdominant oscillation effects. Consequently, our own simulation of SK atmospheric data fell short at this task, and since NuFIT-3.0 they have been removed from our global analysis.
In 2017, the Super-Kamiokande collaboration started to publish results obtained with this method [4] providing the corresponding tabulated map [61] as a function of the four relevant parameters , , , and . Such a table could be added to the of our global analysis to address the impact of their data in the global picture. This was performed in NuFIT 4.X and NuFIT 5.0 versions. Super-Kamiokande publicised an updated table with a slight increase in exposure [62]. The effect of adding that information was included in our last analysis, NuFIT 5.1, and is shown as dashed curves in the right panels of Figure 1; see also Table 2). The addition of the SK-atm table to the latest analysis resulted in an increase of the favouring of NO and in the significance of CP violation, and a change in the favoured octant of .
However, this procedure of “blindly adding” the table, as provided by the experimental collaboration, is not optimal as it defeats the purpose of the global phenomenological analysis, whose aim is both reproducing and combining different data samples under a consistent set of assumptions on the theoretical uncertainties, as well as exploring the implication of the results in extended scenarios.
3.4. , and Mass Ordering from LBL Accelerator and MBL Reactor Experiments
From the point of view of data included in analysis, the most important variation over the last decade was in LBL accelerator and MBL reactor experiments.
The data included in NuFIT 1.0 for LBL experiments comprised the spectrum of disappearance events of K2K [63], both () disappearance and () appearance spectra in MINOS with protons on target (pot) [64], and the results from T2K appearance and disappearance data of phases 1–3 ( pot [65]) and phases 1–2 ( pot [66,67]), respectively. NOvA data were first available in NuFIT 3.0. NuFIT 5.X includes the latest results from T2K corresponding to pot ( pot) () spectra in both () disappearance and () appearance data [19], as well as NOvA data corresponding to pot ( pot) () spectra in both () disappearance and () appearance [20]. Regarding MBL reactor data, NuFIT 1.0 included results of 126 live days of Daya Bay [68] and 229 days of data taking of RENO [42] in the form of total event rates in the near and far detectors, together with the initial spectrum from Double Chooz far detector with 227.9 days live time [69,70]. In NuFIT 5.X we account for the results of the 1958-day EH2/EH1 and EH3/EH1 spectral ratios from Daya Bay [23], the 2908-day FD/ND spectral ratio from RENO [24], and the Double Chooz FD/ND spectral ratio with 1276-day (FD) and 587-day (ND) exposures [22].
The increase in available data in both types of experiments and their complementarity played the leading role in the observation of subdominant effects associated to , neutrino mass ordering, and the octant of , with hints of favoured values and their statistical significance changing in time. We illustrate this in Figure 5 which shows profiles as a function of these three parameters in the last two NuFIT analyses.
Qualitatively, the most relevant effects can be understood in terms of approximate expressions for the relevant oscillation probabilities. In particular, the survival probability is given to good accuracy by [71,72]
where L is the baseline, is the neutrino energy, and
The survival probability relevant for reactor experiments with MBL can be approximated as [72,73]:
where
Hence, the determination of the oscillation frequencies in and disappearance experiments provides two independent measurements of the parameter , which already in NuFIT 2.0 were of similar accuracy and therefore allowed for a consistency test of the scenario. Furthermore, as precision increased the comparison of both oscillation frequencies started offering relevant information on the sign of , i.e., contributing to the present sensitivity to the mass ordering.
For the appearance results in T2K and NOvA, following [35,74], qualitative understanding can be obtained by expanding the appearance oscillation probability in the small parameters , , and the matter potential term (L is the baseline, the neutrino energy and V the effective matter potential):
with and
and we used for both T2K and NOvA. Using the average value of Earth’s crust matter density, neutrinos are found with mean energy at T2K , whereas for NOvA, the approximation works best with an empirical value of . Under the approximation that the total number of appearance events observed in T2K and NOvA is proportional to the oscillation probability one can write
When all the well-determined parameters , , , are set to their global best fit values, one gets almost independently of the value of . The normalisation constants can be calculated from the total number of events in the different appearance samples.
For the last few years, T2K data have been favouring a ratio of observed/expected events larger than 1 for neutrinos and smaller than 1 for anti-neutrinos. The expressions in Equations (15) and (16) imply that the square-bracket term in Equation (15) had to be enhanced, and the one in Equation (16) had to be suppressed. With fixed by reactor experiments, this could be achieved by choosing NO and . This is the driving factor for the hints in favour of NO and maximal CP violation since NuFIT 3.0. NOvA neutrino data indicate towards ratios closer to 1, which can be accommodated by either (NO, ) or (IO, ). This behaviour is consistent with NOvA antineutrinos, but the NO option is somewhat in tension with T2K. This small tension between T2K and NOVA resulted in variations in the favoured ordering in combined LBL analysis and the favoured octant of and value of in NuFIT 4.X and NuFIT 5.X.
On the other hand, with respect to the complementary accelerator/reactor determination of the oscillation frequencies in and disappearance experiments, they have been consistently indicating towards a better agreement for NO than that for IO, albeit within the limited statistical significance of the effect.
4. Conclusions
Over the last two decades, neutrino oscillation experiments have provided us with undoubted evidence that neutrinos have mass, and that the lepton flavours mix in the charge current weak interaction of those massive states. Those observations, which cannot be explained within the Standard Model, represent our only laboratory evidence of physics beyond the Standard Model.
The determination of the flavour structure of the lepton sector at low energies is, at this point, our only source of information to understand the underlying BSM dynamics responsible for these observations, and it is therefore fundamental to ultimately establish the New Standard Model.
The task is at the hands of phenomenological groups. NuFIT was formed in this context about 10 years ago as a fluid collaboration. Since then, it has provided updated results from the global analysis of neutrino oscillation measurements. The NuFIT analysis is performed in the framework of the Standard Model extended with three massive neutrinos, which is currently the minimal scenario capable of accommodating all oscillation results that were robustly established. In this contribution, we summarised some results obtained by NuFIT over these decade, in particular describing those issues which were solved by new data and those which are still pending.
Author Contributions
All authors have contributed equally to this article. All authors have read and agreed to the published version of the manuscript.
Funding
This work is supported by Spanish grants PID2019-105614GB-C21 and PID2019-110058GB-C21 financed by MCIN/AEI/10.13039/501100011033, by USA-NSF grant PHY-1915093, and by AGAUR (Generalitat de Catalunya) grant 2017-SGR-929. The authors acknowledge the support of European ITN grant H2020-MSCA-ITN-2019//860881-HIDDeN and of the Spanish Agencia Estatal de Investigación through the grant “IFT Centro de Excelencia Severo Ochoa SEV-2016-0597”.
Institutional Review Board Statement
Not applicable.
Informed Consent Statement
Not applicable.
Conflicts of Interest
The authors declare no conflict of interest.
References
- Pontecorvo, B. Neutrino experiments and the question of leptonic-charge conservation. Sov. Phys. JETP 1968, 26, 984–988. [Google Scholar]
- Gribov, V.N.; Pontecorvo, B. Neutrino astronomy and lepton charge. Phys. Lett. 1969, B28, 493. [Google Scholar] [CrossRef]
- Gonzalez-Garcia, M.C.; Maltoni, M. Phenomenology with Massive Neutrinos. Phys. Rept. 2008, 460, 1–129. [Google Scholar] [CrossRef] [Green Version]
- Abe, K.; Bronner, C.; Haga, Y.; Hayato, Y.; Ikeda, M.; Iyogi, K.; Kameda, J.; Kato, Y.; Kishimoto, Y.; Marti, L.; et al. Atmospheric Neutrino Oscillation Analysis with External Constraints in Super-Kamiokande I–IV. Phys. Rev. 2018, D97, 072001. [Google Scholar] [CrossRef] [Green Version]
- Aartsen, M.G.; Ackermann, M.; Adams, J.; Aguilar, J.A.; Ahlers, M.; Ahrens, M.; Altmann, D.; Anderson, T.; Arguelles, C.; Arlen, T.C.; et al. Determining neutrino oscillation parameters from atmospheric muon neutrino disappearance with three years of IceCube DeepCore data. Phys. Rev. 2015, D91, 072004. [Google Scholar] [CrossRef] [Green Version]
- IceCube Collaboration IceCube Oscillations: 3 Years Muon Neutrino Disappearance Data. Available online: http://icecube.wisc.edu/science/data/nu_osc (accessed on 25 October 2021).
- Homestake Collaboration. Measurement of the solar electron neutrino flux with the Homestake chlorine detector. Astrophys. J. 1998, 496, 505–526. [Google Scholar] [CrossRef]
- Kaether, F.; Hampel, W.; Heusser, G.; Kiko, J.; Kirsten, T. Reanalysis of the GALLEX solar neutrino flux and source experiments. Phys. Lett. 2010, B685, 47–54. [Google Scholar] [CrossRef] [Green Version]
- Sage Collaboration Measurement of the solar neutrino capture rate with gallium metal. III: Results for the 2002–2007 data-taking period. Phys. Rev. 2009, C80, 015807. [CrossRef]
- Hosaka, J.; Ishihara, K.; Kameda, J.; Koshio, Y.; Minamino, A.; Mitsuda, C.; Miura, M.; Moriyama, S.; Nakahata, M.; Namba, T.; et al. Solar neutrino measurements in Super-Kamiokande-I. Phys. Rev. 2006, D73, 112001. [Google Scholar] [CrossRef] [Green Version]
- Cravens, J.P.; Abe, K.; Iida, T.; Ishihara, K.; Kameda, J.; Koshio, Y.; Minamino, A.; Mitsuda, C.; Miura, M.; Moriyama, S.; et al. Solar neutrino measurements in Super-Kamiokande-II. Phys. Rev. 2008, D78, 032002. [Google Scholar] [CrossRef] [Green Version]
- Abe, K.; Haga, Y.; Hayato, Y.; Ikeda, M.; Iyogi, K.; Kameda, J.; Kishimoto, Y.; Marti, L.; Miura, M.; Moriyama, S.; et al. Solar neutrino results in Super-Kamiokande-III. Phys. Rev. 2011, D83, 052010. [Google Scholar] [CrossRef] [Green Version]
- Nakajima, Y. SuperKamiokande. In Proceedings of the XXIX International Conference on Neutrino Physics and Astrophysics, Chicago, IL, USA, 22 June–2 July 2020. [Google Scholar] [CrossRef]
- Aharmim, B.; Ahmed, S.N.; Anthony, A.E.; Barros, N.; Beier, E.W.; Bellerive, A.; Beltran, B.; Bergevin, M.; Biller, S.D.; Boudjemline, K.; et al. Combined Analysis of All Three Phases of Solar Neutrino Data from the Sudbury Neutrino Observatory. Phys. Rev. 2013, C88, 025501. [Google Scholar] [CrossRef]
- Bellini, G.; Benziger, J.; Bick, D.; Bonetti, S.; Bonfini, G.; Avanzini, M.B.; Caccianiga, B.; Cadonati, L.; Calaprice, F.; Carraro, C.; et al. Precision measurement of the 7Be solar neutrino interaction rate in Borexino. Phys. Rev. Lett. 2011, 107, 141302. [Google Scholar] [CrossRef] [PubMed] [Green Version]
- Bellini, G.; Benziger, J.; Bonetti, S.; Avanzini, M.B.; Caccianiga, B.; Cadonati, L.; Calaprice, F.; Carraro, C.; Chavarria, A.; Chepurnov, A.; et al. Measurement of the solar 8B neutrino rate with a liquid scintillator target and 3 MeV energy threshold in the Borexino detector. Phys. Rev. 2010, D82, 033006. [Google Scholar] [CrossRef] [Green Version]
- Bellini, G.; Benziger, J.; Bick, D.; Bonfini, G.; Bravo, D.; Caccianiga, B.; Cadonati, L.; Calaprice, F.; Caminata, A.; Cavalcante, P.; et al. Neutrinos from the primary proton–proton fusion process in the Sun. Nature 2014, 512, 383–386. [Google Scholar] [CrossRef]
- Adamson, P.; Anghel, I.; Backhouse, C.; Barr, G.; Bishai, M.; Blake, A.; Bock, G.J.; Bogert, D.; Cao, S.V.; Castromonte, C.M.; et al. Measurement of Neutrino and Antineutrino Oscillations Using Beam and Atmospheric Data in MINOS. Phys. Rev. Lett. 2013, 110, 251801. [Google Scholar] [CrossRef]
- Dunne, P. Latest Neutrino Oscillation Results from T2K. In Proceedings of the XXIX International Conference on Neutrino Physics and Astrophysics, Chicago, IL, USA, 22 June–2 July 2020. [Google Scholar] [CrossRef]
- Himmel, A. New Oscillation Results from the NOvA Experiment. In Proceedings of the XXIX International Conference on Neutrino Physics and Astrophysics, Chicago, IL, USA, 22 June–2 July 2020. [Google Scholar] [CrossRef]
- Adamson, P.; Anghel, I.; Backhouse, C.; Barr, G.; Bishai, M.; Blake, A.; Bock, G.J.; Bogert, D.; Cao, S.V.; Cherdack, D.; et al. Electron neutrino and antineutrino appearance in the full MINOS data sample. Phys. Rev. Lett. 2013, 110, 171801. [Google Scholar] [CrossRef] [Green Version]
- Bezerra, T. New Results from the Double Chooz Experiment. In Proceedings of the XXIX International Conference on Neutrino Physics and Astrophysics, Chicago, IL, USA, 22 June–2 July 2020. [Google Scholar] [CrossRef]
- Adey, D.; An, F.P.; Balantekin, A.B.; Band, H.R.; Bishai, M.; Blyth, S.; Cao, D.; Cao, G.F.; Cao, J.; Chan, Y.L.; et al. Measurement of Electron Antineutrino Oscillation with 1958 Days of Operation at Daya Bay. Phys. Rev. Lett. 2018, 121, 241805. [Google Scholar] [CrossRef] [Green Version]
- Yoo, J. RENO. In Proceedings of the XXIX International Conference on Neutrino Physics and Astrophysics, Chicago, IL, USA, 22 June–2 July 2020. [Google Scholar] [CrossRef]
- Gando, A.; Gando, Y.; Hanakago, H.; Ikeda, H.; Inoue, K.; Ishidoshiro, K.; Ishikawa, H.; Koga, M.; Matsuda, R.; Matsuda, S.; et al. Reactor On-Off Antineutrino Measurement with Kamland. Phys. Rev. 2013, D88, 033001. [Google Scholar] [CrossRef] [Green Version]
- de Salas, P.; Forero, D.; Gariazzo, S.; Martinez-Mirave, P.; Mena, O.; Ternes, C.; Tortola, M.; Valle, J. 2020 Global Reassessment of the Neutrino Oscillation Picture. J. High Energy Phys. 2020, 2021, 1–36. [Google Scholar] [CrossRef]
- De Salas, P.; Gariazzo, S.; Mena, O.; Ternes, C.; Tortola, M. Neutrino Mass Ordering from Oscillations and Beyond: 2018 Status and Future Prospects. Front. Astron. Space Sci. 2018, 5, 36. [Google Scholar] [CrossRef] [Green Version]
- Capozzi, F.; Di Valentino, E.; Lisi, E.; Marrone, A.; Melchiorri, A.; Palazzo, A. Unfinished fabric of the three neutrino paradigm. Phys. Rev. D 2021, 104, 083031. [Google Scholar] [CrossRef]
- Capozzi, F.; Di Valentino, E.; Lisi, E.; Marrone, A.; Melchiorri, A.; Palazzo, A. Addendum To: Global Constraints on Absolute Neutrino Masses and Their Ordering. Phys. Rev. D 2020, 101, 116013. [Google Scholar] [CrossRef]
- NuFit Webpage. Available online: http://www.nu-fit.org (accessed on 25 October 2021).
- Gonzalez-Garcia, M.; Maltoni, M.; Salvado, J.; Schwetz, T. Global fit to three neutrino mixing: Critical look at present precision. J. High Energy Phys. 2012, 1212, 123. [Google Scholar] [CrossRef] [Green Version]
- Gonzalez-Garcia, M.C.; Maltoni, M.; Schwetz, T. Updated Fit to Three Neutrino Mixing: Status of Leptonic CP Violation. J. High Energy Phys. 2014, 11, 052. [Google Scholar] [CrossRef] [Green Version]
- Bergstrom, J.; Gonzalez-Garcia, M.C.; Maltoni, M.; Schwetz, T. Bayesian global analysis of neutrino oscillation data. J. High Energy Phys. 2015, 09, 200. [Google Scholar] [CrossRef] [Green Version]
- Esteban, I.; Gonzalez-Garcia, M.C.; Maltoni, M.; Martínez-Soler, I.; Schwetz, T. Updated Fit to Three Neutrino Mixing: Exploring the Accelerator-Reactor Complementarity. J. High Energy Phys. 2017, 1, 87. [Google Scholar] [CrossRef] [Green Version]
- Esteban, I.; Gonzalez-Garcia, M.C.; Hernandez-Cabezudo, A.; Maltoni, M.; Schwetz, T. Global analysis of three-flavour neutrino oscillations: Synergies and tensions in the determination of θ23, δCP, and the mass ordering. J. High Energy Phys. 2019, 1, 106. [Google Scholar] [CrossRef]
- Esteban, I.; Gonzalez-Garcia, M.C.; Maltoni, M.; Schwetz, T.; Zhou, A. The fate of hints: Updated global analysis of three-flavor neutrino oscillations. J. High Energy Phys. 2020, 9, 178. [Google Scholar] [CrossRef]
- Tanabashi, M.; Hagiwara, K.; Hikasa, K.; Nakamura, K.; Sumino, Y.; Takahashi, F.; Tanaka, J.; Agashe, K.; Aielli, G.; Amsler, C.; et al. Review of Particle Physics. Phys. Rev. D 2018, 98, 030001. [Google Scholar] [CrossRef] [Green Version]
- Wolfenstein, L. Neutrino oscillations in matter. Phys. Rev. 1978, D17, 2369–2374. [Google Scholar] [CrossRef]
- Mikheev, S.P.; Smirnov, A.Y. Resonance enhancement of oscillations in matter and solar neutrino spectroscopy. Sov. J. Nucl. Phys. 1985, 42, 913–917. [Google Scholar]
- Huber, P. On the determination of anti-neutrino spectra from nuclear reactors. Phys. Rev. 2011, C84, 024617. [Google Scholar]
- An, F.P.; Bai, J.Z.; Balantekin, A.B.; Band, H.R.; Beavis, D.; Beriguete, W.; Bishai, M.; Blyth, S.; Boddy, K.; Brown, R.L.; et al. Observation of electron-antineutrino disappearance at Daya Bay. Phys. Rev. Lett. 2012, 108, 171803. [Google Scholar] [CrossRef] [PubMed] [Green Version]
- Ahn, J.K.; Chebotaryov, S.; Choi, J.H.; Choi, S.; Choi, W.; Choi, Y.; Jang, H.I.; Jang, J.S.; Jeon, E.J.; Jeong, I.S.; et al. Observation of Reactor Electron Antineutrino Disappearance in the RENO Experiment. Phys. Rev. Lett. 2012, 108, 191802. [Google Scholar] [CrossRef] [Green Version]
- Abe, Y.; Aberle, C.; Akiri, T.; Dos Anjos, J.C.; Ardellier, F.; Barbosa, A.F.; Baxter, A.; Bergevin, M.; Bernstein, A.; Bezerra, T.J.C.; et al. Indication for the disappearance of reactor electron antineutrinos in the Double Chooz experiment. Phys. Rev. Lett. 2012, 108, 131801. [Google Scholar] [CrossRef] [Green Version]
- Apollonio, M.; Baldini, A.; Bemporad, C.; Caffau, E.; Cei, F.; Declais, Y.; De Kerret, H.; Dieterle, B.; Etenko, A.; George, J.; et al. Limits on Neutrino Oscillations from the CHOOZ Experiment. Phys. Lett. 1999, B466, 415–430. [Google Scholar] [CrossRef] [Green Version]
- Piepke, A. Final results from the Palo Verde neutrino oscillation experiment. Prog. Part. Nucl. Phys. 2002, 48, 113–121. [Google Scholar] [CrossRef] [Green Version]
- Mueller, T.A.; Lhuillier, D.; Fallot, M.; Letourneau, A.; Cormon, S.; Fechner, M.; Giot, L.; Lasserre, T.; Martino, J.; Mention, G.; et al. Improved Predictions of Reactor Antineutrino Spectra. Phys. Rev. 2011, C83, 054615. [Google Scholar] [CrossRef] [Green Version]
- Mention, G.; Fechner, M.; Lasserre, T.; Mueller, T.A.; Lhuillier, D.; Cribier, M.; Letourneau, A. The Reactor Antineutrino Anomaly. Phys. Rev. 2011, D83, 073006. [Google Scholar] [CrossRef] [Green Version]
- Declais, Y.; De Kerret, H.; Lefievre, B.; Obolensky, M.; Etenko, A.; Kozlov, Y.; Machulin, I.; Martemianov, V.; Mikaelyan, L.; Skorokhvatov, M.; et al. Study of reactor anti-neutrino interaction with proton at Bugey nuclear power plant. Phys. Lett. 1994, B338, 383–389. [Google Scholar] [CrossRef] [Green Version]
- Kuvshinnikov, A.; Mikaelyan, L.; Nikolaev, S.; Skorokhvatov, M.; Etenko, A. Measuring the ν¯e+p→n+e+ cross-section and beta decay axial constant in a new experiment at Rovno NPP reactor. JETP Lett. 1991, 54, 253–257. (In Russian) [Google Scholar]
- Achkar, B.; Aleksan, R.; Avenier, M.; Bagieu, G.; Bouchez, J.; Brissot, R.; Cavaignac, J.F.; Collot, J.; Cousinou, M.C.; Cussonneau, J.P.; et al. Search for neutrino oscillations at 15-meters, 40-meters, and 95-meters from a nuclear power reactor at Bugey. Nucl. Phys. 1995, B434, 503–534. [Google Scholar] [CrossRef]
- Vidyakin, G.S.; Vyrodov, V.N.; Gurevich, I.I.; Kozlov, Y.V.; Martemyanov, V.P.; Sukhotin, S.V.; Tarasenkov, V.G.; Khakimov, S.K. Detection of anti-neutrinos in the flux from two reactors. Sov. Phys. JETP 1987, 66, 243–247. [Google Scholar]
- Vidyakin, G.S.; Vyrodov, V.N.; Kozlov, Y.V.; Martem’yanov, A.V.; Martem’yanov, V.P.; Odinokov, A.N.; Sukhotin, S.V.; Tarasenkov, V.G.; Turbin, E.V.; Tyurenkov, S.G.; et al. Limitations on the characteristics of neutrino oscillations. JETP Lett. 1994, 59, 390–393. [Google Scholar]
- Kwon, H.; Boehm, F.; Hahn, A.A.; Henrikson, H.E.; Vuilleumier, J.L.; Cavaignac, J.F.; Koang, D.H.; Vignon, B.; Feilitzsch, F.V.; Mössbauer, R.L. Search for neutrino oscillations at a fission reactor. Phys. Rev. 1981, D24, 1097–1111. [Google Scholar] [CrossRef] [Green Version]
- Zacek, G.; Feilitzsch, F.V.; Mössbauer, R.L.; Oberauer, L.; Zacek, A.V.; Boehm, F.; Fisher, P.H.; Gimlett, J.L.; Hahn, A.A.; Henrikson, H.E.; et al. Neutrino Oscillation Experiments at the Gosgen Nuclear Power Reactor. Phys. Rev. 1986, D34, 2621–2636. [Google Scholar] [CrossRef] [Green Version]
- Greenwood, Z.D.; Kropp, W.R.; Mandelkern, M.A.; Nakamura, S.; Pasierb-Love, E.L.; Price, L.R.; Reines, F.; Riley, S.P.; Sobel, H.W.; Baumann, N.; et al. Results of a two position reactor neutrino oscillation experiment. Phys. Rev. 1996, D53, 6054–6064. [Google Scholar] [CrossRef]
- Afonin, A.I.; Ketov, S.N.; Kopeikin, V.I.; Mikaelyan, L.A.; Skorokhvatov, M.D.; Tolokonnikov, S.V. A study of the reaction ν¯e+p→e++n on a nuclear reactor. Sov. Phys. JETP 1988, 67, 213–221. [Google Scholar]
- Schwetz, T.; Tortola, M.; Valle, J. Global neutrino data and recent reactor fluxes: Status of three-flavour oscillation parameters. New J. Phys. 2011, 13, 063004. [Google Scholar] [CrossRef]
- An, F.P.; Balantekin, A.B.; Band, H.R.; Bishai, M.; Blyth, S.; Cao, D.; Cao, G.F.; Cao, J.; Cen, W.R.; Chan, Y.L.; et al. Improved Measurement of the Reactor Antineutrino Flux and Spectrum at Daya Bay. Chin. Phys. 2017, C41, 013002. [Google Scholar] [CrossRef]
- Vinyoles, N.; Serenelli, A.M.; Villante, F.L.; Basu, S.; Bergström, J.; Gonzalez-Garcia, M.C.; Maltoni, M.; Peña-Garay, C.; Song, N. A new Generation of Standard Solar Models. Astrophys. J. 2017, 835, 202. [Google Scholar] [CrossRef] [Green Version]
- Bergstrom, J.; Gonzalez-Garcia, M.C.; Maltoni, M.; Pena-Garay, C.; Serenelli, A.M.; Song, N. Updated determination of the solar neutrino fluxes from solar neutrino data. J. High Energy Phys. 2016, 3, 132. [Google Scholar] [CrossRef] [Green Version]
- Atmospheric Neutrino Oscillation Analysis with External Constraints in Super-Kamiokande I–IV. Available online: http://www-sk.icrr.u-tokyo.ac.jp/sk/publications/result-e.html#atmosci2018 (accessed on 25 October 2021).
- SK Atmospheric Oscillation Analysis 2020 (Preliminary) Results. Available online: https://indico-sk.icrr.u-tokyo.ac.jp/event/5517 (accessed on 25 October 2021).
- Ahn, M.H.; Aliu, E.; Andringa, S.; Aoki, S.; Aoyama, Y.; Argyriades, J.; Asakura, K.; Ashie, R.; Berghaus, F.; Berns, H.G.; et al. Measurement of Neutrino Oscillation by the K2K Experiment. Phys. Rev. 2006, D74, 072003. [Google Scholar] [CrossRef] [Green Version]
- Nichol, R. Results from MINOS. In Proceedings of the XXV International Conference on Neutrino Physics, Kyoto, Japan, 3–9 June 2012. [Google Scholar]
- Sakashita, K. Results from T2K. In Proceedings of the 36th International Conference on High Energy Physics, Melbourne, Australia, 4–11 July 2012. [Google Scholar]
- Abe, K.; Abgrall, N.; Ajima, Y.; Aihara, H.; Albert, J.B.; Andreopoulos, C.; Andrieu, B.; Anerella, M.D.; Aoki, S.; Araoka, O.; et al. First Muon-Neutrino Disappearance Study with an Off-Axis Beam. Phys. Rev. 2012, D85, 031103. [Google Scholar] [CrossRef] [Green Version]
- Nakaya, T. Results from T2K. In Proceedings of the XXV International Conference on Neutrino Physics, Kyoto, Japan, 3–9 June 2012. [Google Scholar]
- Dwyer, D. Improved measurement of electron-antineutrino disappearance at Daya Bay. In Proceedings of the XXV International Conference on Neutrino Physics, Kyoto, Japan, 3–9 June 2012. [Google Scholar]
- Abe, Y.; Aberle, C.; Akiri, T.; Dos Anjos, J.C.; Ardellier, F.; Barbosa, A.F.; Baxter, A.; Bergevin, M.; Bernstein, A.; Bezerra, T.J.C.; et al. Reactor Electron Antineutrino Disappearance in the Double Chooz Experiment. 2012. Available online: http://xxx.lanl.gov/abs/1207.6632 (accessed on 25 October 2021).
- Ishitsuka, M. Double Chooz Results. In Proceedings of the XXV International Conference on Neutrino Physics, Kyoto, Japan, 3–9 June 2012. [Google Scholar]
- Okamura, N. Effect of the Smaller Mass-Squared Difference for the Long Base-Line Neutrino Experiments. Prog. Theor. Phys. 2006, 114, 1045–1056. [Google Scholar] [CrossRef] [Green Version]
- Nunokawa, H.; Parke, S.J.; Zukanovich Funchal, R. Another Possible Way to Determine the Neutrino Mass Hierarchy. Phys. Rev. 2005, D72, 013009. [Google Scholar] [CrossRef] [Green Version]
- Minakata, H.; Nunokawa, H.; Parke, S.J.; Zukanovich Funchal, R. Determining Neutrino Mass Hierarchy by Precision Measurements in Electron and Muon Neutrino Disappearance Experiments. Phys. Rev. 2006, D74, 053008. [Google Scholar] [CrossRef] [Green Version]
- Elevant, J.; Schwetz, T. On the determination of the leptonic CP phase. J. High Energy Phys. 2015, 9, 16. [Google Scholar] [CrossRef] [Green Version]
Figure 1.
Comparison of global oscillation analysis results. All panels show profiles minimised with respect to all undisplayed parameters. Red (blue) curves are for normal (inverted) ordering. As atmospheric mass-squared splitting, we used for NO and for IO. (top) NuFIT 1.0 results. Solid curves obtained with free normalisation of reactor fluxes and the inclusion of data from short-baseline (less than 100 m) reactor experiments; for dotted curves, short-baseline data were not included, but reactor fluxes were fixed to the predictions of [40]. (bottom) NuFIT 5.1 results. In all curves, theneutrino fluxes for each reactor experiment were constrained by the corresponding near detector. Solid (dashed) curves obtained without (with) including tabulated SK-atm data. Figure adapted from [30].

Figure 2.
Dependence on reactor flux normalisation choice in NuFIT 1.0. (upper) Dependence of on (for fix value ) for the set of reactor experiments included in the analysis and three different assumptions on the fluxes as labeled in the figure. (lower) Confidence level contours in the plane of and flux normalisation . Full regions and lines correspond to analysis with and without including the RSBL experiments, respectively. Figure adapted from [30].

Figure 3.
(upper-left) NuFIT 2.0 allowed parameter regions (at , 90%, , 99% and CL for 2 d.o.f.) from combined analysis of solar data for GS98 model (full regions with best fit marked by black star) and AGSS09 model (dashed void contours with best fit marked by a white dot), and analysis of KamLAND data (solid green contours with best fit marked by a green star) for fixed . Orange contours are the results of a global analysis for the GS98 model but without including day–night information from SK. (upper-right) NuFIT 2.0 dependence on for the same four analyses after marginalising over . (lower-left) Same as upper-left but for NuFIT 5.1 and fixed . Previous results of global analysis for GS98 model in NuFIT 4.0 shown as orange contours [35]. (lower-right) dependence on for same four analyses as the lower-left panel after marginalising over . Figure adapted from [30].

Figure 4.
Contribution of different sets of experimental data included in NuFIT 2.0 to the determination of mass ordering, octant of , and CP violating phase. Left (right) panels are for IO (NO). Atmos is our analysis of SK1–4 (including SK4 1775-day) combined data. Figure adapted from [30].
Figure 4.
Contribution of different sets of experimental data included in NuFIT 2.0 to the determination of mass ordering, octant of , and CP violating phase. Left (right) panels are for IO (NO). Atmos is our analysis of SK1–4 (including SK4 1775-day) combined data. Figure adapted from [30].

Figure 5.
-profiles as a function of (left), (center) and (right) for different LBL and reactor data sets and their combination obtained in NuFIT 4.1 and NuFIT 5.1. For all curves we have fixed as well as the solar parameters and minimised with respect to the other undisplayed parameters. is shown with respect to the best-fit mass ordering for each curve. Figure adapted from [30].


Table 1.
Experiments contributing to the present determination of oscillation parameters.
| Experiment | Dominant | Important |
|---|---|---|
| Solar Experiments | , | |
| Reactor LBL (KamLAND) | , | |
| Reactor MBL (Daya Bay, RENO, Double Chooz) | , | — |
| Atmospheric Experiments (SK, IC-DC) | — | , , , |
| Accel. LBL disapp. (K2K, MINOS, T2K, NOvA) | , | — |
| Accel. LBL appearance (MINOS, T2K, NOvA) | , |
Table 2.
Determination of three-flavour oscillation parameters from fit to global data NuFIT 5.1 [30,36]. Results in the first and second columns correspond to analysis performed under the assumption of NO and IO, respectively; therefore, they are confidence intervals defined relative to the respective local minimum. Results shown in the upper and lower sections correspond to analysis performed without and with the addition of tabulated SK-atm data respectively. In quoting values for the largest mass splitting, we defined for NO and for IO.
| without SK atmospheric data | Normal Ordering (Best Fit) | Inverted Ordering () | |||
| bfp | Range | bfp | Range | ||
| with SK atmospheric data | Normal Ordering (Best Fit) | Inverted Ordering () | |||
| bfp | Range | bfp | Range | ||
Publisher’s Note: MDPI stays neutral with regard to jurisdictional claims in published maps and institutional affiliations. |
© 2021 by the authors. Licensee MDPI, Basel, Switzerland. This article is an open access article distributed under the terms and conditions of the Creative Commons Attribution (CC BY) license (https://creativecommons.org/licenses/by/4.0/).
Share and Cite
MDPI and ACS Style
Gonzalez-Garcia, M.C.; Maltoni, M.; Schwetz, T. NuFIT: Three-Flavour Global Analyses of Neutrino Oscillation Experiments. Universe 2021, 7, 459. https://0-doi-org.brum.beds.ac.uk/10.3390/universe7120459
AMA Style
Gonzalez-Garcia MC, Maltoni M, Schwetz T. NuFIT: Three-Flavour Global Analyses of Neutrino Oscillation Experiments. Universe. 2021; 7(12):459. https://0-doi-org.brum.beds.ac.uk/10.3390/universe7120459
Chicago/Turabian StyleGonzalez-Garcia, Maria Concepcion, Michele Maltoni, and Thomas Schwetz. 2021. "NuFIT: Three-Flavour Global Analyses of Neutrino Oscillation Experiments" Universe 7, no. 12: 459. https://0-doi-org.brum.beds.ac.uk/10.3390/universe7120459
Note that from the first issue of 2016, this journal uses article numbers instead of page numbers. See further details here.