
Gamma-ray Bursts at the Highest Energies


1
INAF-Osservatorio Astronomico di Brera, I-23807 Merate, Italy
2
INFN-Sezione di Trieste, I-34127 Trieste, Italy
Universe 2021, 7(12), 503; https://0-doi-org.brum.beds.ac.uk/10.3390/universe7120503
Submission received: 22 September 2021
/
Revised: 3 November 2021
/
Accepted: 16 November 2021
/
Published: 17 December 2021
(This article belongs to the Special Issue High-Energy Gamma-Ray Astronomy: Results on Fundamental Questions after 30 Years of Ground-Based Observations)
Abstract
:Emission from Gamma-ray bursts is thought to be powered mainly by synchrotron radiation from energetic electrons. The same electrons might scatter these synchrotron seed photons to higher (>10 GeV) energies, building a distinct spectral component (synchrotron self-Compton, SSC). This process is expected to take place, but its relevance (e.g., the ratio between the SSC and synchrotron emitted power) is difficult to predict on the basis of current knowledge of physical conditions at GRB emission sites. Very high-energy radiation in GRBs can be produced also by other mechanisms, such as synchrotron itself (if PeV electrons are produced at the source), inverse Compton on external seed photons, and hadronic processes. Recently, after years of efforts, very high-energy radiation has been finally detected from at least four confirmed long GRBs by the Cherenkov telescopes H.E.S.S. and MAGIC. In all four cases, the emission has been recorded during the afterglow phase, well after the end of the prompt emission. In this work, I give an overview, accessible also to non-experts of the field, of the recent detections, theoretical implications, and future challenges, with a special focus on why very high-energy observations are relevant for our understanding of Gamma-ray bursts and which long-standing questions can be finally answered with the help of these observations.
1. Introduction on GRBs
Gamma-ray bursts (GRBs) are transient sources of radiation associated to extragalactic catastrophic events. Following the accretion of a massive disk onto a newly-born compact object (most likely a black hole), material is ejected in the form of two opposite jets reaching ultra-relativistic velocities with a typical bulk Lorentz factor . The initial emission phase (called prompt emission) is caused by the conversion of a fraction of the jet energy (which is either in kinetic or magnetic form) into radiation, and is though to occur at a distance R∼– cm from the central engine. The prompt emission is detected as a bright, impulsive emission of soft Gamma-rays (∼10 keV–10 MeV), with variability of the order of 0.01–1 s, total duration between ∼0.1 s and ∼ s, and isotropic equivalent luminosities typically in the range of ∼– erg/s. Two different sub-classes of GRBs have been clearly identified: those related to the merger of a binary system of two neutrons stars or a neutron star and a black hole (producing GRBs with prompt emission duration shorter than ∼2 s) and those triggered by the core collapse of a massive star (in this case, the prompt emission lasts typically more than 2 s). At a distance of R > – cm, the interaction of the jet with the external medium becomes relevant and is responsible for the gradual decrease in the bulk Lorentz factor and the production of the afterglow radiation, a broadband (radio-to-GeV) emission that becomes fainter with time and that is detectable for days or even weeks/months.
The year 2019 marked the beginning of a new epoch in the study of GRBs. The MAGIC and H.E.S.S. collaborations reported for the first time the firm detection of very high-energy (VHE, >100 GeV) radiation from two long GRBs, captured during their afterglow phase [1,2]. These detections came after several years of efforts, where major upgrades in the telescope sensitivities, energy thresholds, and slewing speed did not initially yield to the expected results (for more details on Cherenkov telescopes, their capabilities, and past observations of GRBs, see Section 2). While the community was discussing the implications of the lack of detections by the current generation of Cherenkov telescopes and placing hope in the next generation [3], the bright VHE emission recorded from GRB 190114C answered in one shot many questions, at least about the presence and phenomenology of VHE emission in GRBs. This detection revealed that VHE radiation up to at least 1 TeV can be efficiently produced (i.e., with a luminosity similar to the X-ray luminosity) in GRB environments, for at least one hour after the end of the prompt (a timescale that places its origin in the afterglow phase) and is detectable also at relatively large redshifts (). At this redshift, the absorption of VHE photons via pair-production on photons from the extragalactic background light (EBL) produces already a relevant flux attenuation (at least two orders of magnitude at 1 TeV, according to current EBL models [4,5,6]—for a recent review, see [7], this Special Issue).
Currently, firm detections of GRBs at VHE by imaging atmospheric Cherenkov telescopes (IACTs) amount to four (see Section 3), and they all refer to long GRBs, on timescales much longer than their prompt emission duration. TeV radiation in GRBs is expected to be produced as a result of inverse Compton scattering. In particular, being compact sources of synchrotron radiation, the same electrons producing synchrotron photons might efficiently scatter them to higher (>10 GeV) energies, building a distinct spectral component called synchrotron self-Compton (SSC). Although an SSC origin for the ∼TeV radiation detected so far from GRBs is widely accepted, at this stage other possibilities can not be discarded. In particular, the discussion is currently open on the possibility to explain multi-wavelength observations with a single synchrotron component up to TeV energies. This scenario requires a revision of the shock acceleration model adopted to explain particle acceleration in these relativistic shocks: while synchrotron photons from electrons accelerated be the Fermi mechanism reach a maximum of ∼50 MeV (in the plasma comoving frame), the detection of TeV photons (observer frame) at late times (hours) can be explained in the synchrotron scenario only modifying the assumption that leads to a maximum photon energy of ∼50 MeV, e.g., invoking a different mechanism or specific conditions (such as a decaying magnetic field) able to exceed this limit by at least three orders of magnitude.
Other open questions (besides what is the origin of this radiation and the energy of the emitting particles, which is discussed in Section 6) concerns the conditions (e.g., jet energy, magnetic field strength, size of the region, bulk Lorentz factor, and properties of the ambient medium) leading to efficient production of VHE emission, how typical they are in GRB environments, how well we can trust EBL models to infer the intrinsic properties of GRB VHE spectra, whether short GRBs can also have a relevant VHE component, and whether VHE photons can be produced also during the prompt phase, as the result of internal dissipation processes (Section 7).
There have been several attempts to predict VHE radiation from GRBs from different mechanisms [8,9,10,11,12,13]. In general, the poor knowledge of the conditions at the region where afterglow radiation is produced prevents researchers from making clear predictions on the luminosity of the associated VHE emission. Even more difficult is the prediction of VHE radiation associated to the keV-MeV prompt radiation, since the origin of the latter one is not understood yet.
In the absence of detections with Cherenkov telescopes, studies of GRBs at high energies have relied on observations from the Large Area Telescope (LAT), a pair conversion telescope covering the energy band from 20 MeV to 300 GeV onboard the Fermi satellite, which was launched in 2008. The LAT detected only a fraction of the GRBs discovered at lower energies by the other telescope onboard Fermi, the Gamma-ray Burst Monitor (GBM, 8 keV–40 MeV). This percentage amounts to only about 12% (after taking into account the different fields of view of the two instruments). The study of radiation in the range 100 MeV–100 GeV (hereafter high-energy (HE)) detected by the LAT has improved our understanding of GRB radiation, especially of the afterglow phase, adding valuable information in the high-energy part of the afterglow synchrotron spectrum [14,15,16,17,18,19] and hinting to the presence of a distinct component at higher energies [20]. For the prompt emission, instead, no clear conclusions can be drawn, although it seems fair to state that a strong GeV component associated to the keV–MeV prompt emission has not been found by the LAT [21]. A brief summary of (V)HE observations of GRBs is given in Section 2. For a more complete review on HE emission from GRBs before the VHE era, see [22].
In this work, I first summarise the main properties of the GRBs detected at VHE (Section 3) and the attempts to detect emission from short GRBs (Section 4) and emission simultaneous to the prompt (Section 5). In the second part, I discuss the interpretation of the origin of VHE radiation (Section 6) and then I focus the attention on the importance of studying VHE emission from GRBs (Section 7). In particular, I propose a reflection on the status of the comprehension of the GRB phenomenon at the dawn of the VHE GRB era. I select a few controversial topics in GRB physics and outline how the study of VHE radiation can produce a breakthrough in their comprehension.
2. The Hunt for GRBs at High and Very High Energies
2.1. Scientific Motivation
Both in prompt and afterglow studies, the reason to extend observations towards the highest energies is manifold and is related on the one hand to a better characterisation of the high-energy part of the prompt/afterglow spectra and on the other hand to the search for an additional emission component in the GeV–TeV energy range.
Prompt emission has been detected from thousands of GRBs, and it is typically observed in the energy range between ∼10 keV and a few MeV. At energies above the spectral peak (∼0.1–0.3 MeV), the prompt emission spectrum is difficult to characterise, due to the low signal-to-noise ratio typically available at these energies, except for very bright GRBs. In these cases, the high-energy part of the spectrum is often well described by a single power-law (,23,24,25]). The photon index might enclose information about the energy spectrum of the emitting particles. For power-law (PL) spectra of the accelerated particles () and synchrotron cooling, the high-energy end of the synchrotron spectrum is expected to behave as a PL with index . For typical photon indices ∼, an injection particle spectrum with index p∼2.4 is inferred. Extension of prompt spectral studies to higher energies is possible since 2008 for those GRBs observed by the LAT. The inclusion of LAT data to the study of prompt emission spectra decreases the median value of from ∼ from the GBM-only fits to ∼ [25]. These softer values might point to the presence of intrinsic spectral breaks and/or cutoffs and show the importance of systematically extending the energy range of prompt emission spectral studies. A spectral cutoff at the high-energy end of the prompt spectrum is expected to occur, either caused by internal pair-production opacity or by the high-energy cutoff in the energy spectrum of the emitting particles, which marks the maximum energy up to which particles have been accelerated. Such cutoffs have been constrained only in a few cases, mostly thanks to the inclusion of HE observations by LAT [26,27]. If interpreted as caused by internal opacity, the position of the cutoff/break energy can be related to the size and bulk Lorentz factor of the source, which is typically in the range 100–400.
In the afterglow phase, a high-energy cutoff in the synchrotron spectrum is expected to occur as a result the maximum energy of the accelerated particles. In the basic model for relativistic shock acceleration, the energy gain by particles proceeds at a maximum rate given by Bohm diffusion and is limited by synchrotron cooling. In this scenario, the maximum synchrotron photon energy in the observer frame is estimated to be located at 10 GeV [28] (where ), and it can then reach several tens of GeV in the early phases (seconds) of the afterglow; it decreases towards hundreds MeV at later times (days/weeks), when the beaming decreases as a result of jet deceleration. Any deviation from this prediction carries information either on a smaller efficiency of the relativistic shocks [29] or on the need for a more efficient mechanism and/or deviation from standard assumptions [28,30,31]. Therefore, constraints on the location of the high-energy cutoff in prompt and/or afterglow spectra carry a wealth of information, e.g., about the bulk Lorentz factor, particle acceleration efficiency, and size of the emitting region.
Besides constraining the high-energy part of the prompt and afterglow synchrotron spectra, (V)HE observations can also reveal the presence of a distinct spectral component. The detection of such a component is of great importance for understanding the conditions in the region where the radiation is produced, allowing to discriminate among different models and providing additional constraints to model parameters. Moreover, in case GRBs are GeV–TeV emitters, they could be used as powerful tools (complementary to other sources) for Lorentz invariance violation (LIV) studies [32,33] and for EBL studies [34].
Since the emission from GRBs is characterised by two well-distinguished phases with different origins, physical properties, region sizes, and locations, observational challenges and open questions differ between prompt and afterglow emission and should be treated separately. Observations at (V)HE can be of paramount importance to answer some of the most important questions in both fields. In particular, the identification of prompt emission with synchrotron radiation is still highly debated, and the discussion would benefit from observations at TeV energies. Regarding the afterglow, the origin is more certain, but the physical conditions of the emitting source (which are strictly related to the environment, the jet properties, and to particle acceleration and magnetic field amplification) are largely unknown.
In the next sections, I give a brief overview of past searches of GeV and TeV radiation in prompt and afterglow phases of GRBs by space telescopes, such as EGRET and LAT, and by ground-based telescopes, such as extensive air shower (EAS) detectors and IACTs. For a more complete review, see [22].
2.2. EGRET Detections of GRBs
The first major advances in the study of GRBs have been possible thanks to the Compton Gamma-ray Observatory (CGRO, in orbit from 1991 to 2000), and in particular to the instruments Burst and Transient Source Explorer (BATSE, 30 keV–2 MeV) and the Energetic Gamma Ray Experiment Telescope (EGRET, 20 MeV–30 GeV). While BATSE detected prompt emission from almost three thousand GRBs, EGRET detected only five of them with its spark chambers. The GRB photon with the highest energy ever recorded by EGRET is an 18 GeV photon detected from GRB 940217 more than an hour after the burst onset, well after the end of the prompt emission. Combining simultaneous BATSE and EGRET data, one burst, GRB 941017, resulted of particular interest in the search for a high-energy component. The joint spectral analysis revealed the presence of a rising high-energy component in the spectrum, extending up to 200 MeV (Figure 1). This high-energy component appeared ∼10–20 s after the beginning of the burst and displayed a roughly constant flux and a hard spectral slope () up to 200 s. At these late times, the high-energy (10–200 MeV) tail contained at least 3 times more energy than the 30 keV–2 MeV prompt -rays component [35].
Even though EGRET detected only a few events, it was already evident that high-energy emission from GRBs shows a diversity of behaviours in both its temporal and spectral properties: photons have been detected simultaneously to the prompt emission but also on much longer time scales, and they are sometimes consistent with being the high-energy part of the prompt spectrum, while at least in one case there is evidence for a separated spectral component. This suggests that high-energy radiation can be produced both as a result of internal and external dissipation, explaining the different timescales of GeV detections. Moreover, both in prompt and afterglow radiation, the emission can be the extension of the emission that is commonly detected at lower energies, or it can have a distinct origin. All these different cases produce a wealth of different temporal/spectral behaviours at GeV energies, as later confirmed by observations from the LAT.
2.3. LAT Observations
The Swift satellite launched in 2004 carries onboard the burst alert telescope (BAT, 15 keV–150 keV), the X-ray telescope (XRT, 0.3 keV–10 keV) and the ultraviolet–optical telescope (UVOT). Although it marked undoubtedly a giant leap for the study of GRBs, its instruments are sensitive to frequencies up to hard X-rays, and we had to wait until 2008 to progress the study of GRBs at higher energies. The launch of the Fermi satellite, carrying onboard the LAT telescope, allowed for the first time the systematic study of GRBs between 40 MeV and 100 GeV. Counting only GRBs with emission above 100 MeV, about 16 GRBs per year are detected both by the GBM and the LAT1. LAT photons usually are detected during the prompt emission but starting with a small delay (of the order of seconds) [21]. In about 60% of the cases, emission in the LAT energy range continues also after the end of the prompt. Although it is reasonable to assume that such a long-lasting HE radiation is connected with afterglow emission (e.g., produced as a result of the jet expansion into the external medium), a contribution from internal dissipation at early times cannot be excluded and is even necessary in some cases to explain variability detected in the LAT energy range [36].
The main results concerning the prompt phase can be summarised as follows. The LAT did not systematically identify the position of the high-energy cutoff in the prompt spectrum. The contamination from HE afterglow radiation already during the prompt makes it difficult to identify this feature. There are two clear cases showing an evident high-energy cutoff, which are located at energies of ∼20–60 MeV and ∼80–150 MeV, providing an estimate of bulk Lorentz factors in the ∼100–400 range [27]. Not surprisingly, in both cases the afterglow emission starts after the prompt phase is ended, giving the opportunity in these two bursts to study the prompt spectrum at high energies with no contamination from the HE afterglow component. A more indirect evidence for the presence of a high-energy cutoff in prompt spectra comes from the analysis of LAT non-detections, i.e., GRBs observed by the LAT but for which only upper limits could be placed [26].
If, on the one hand, the high-energy data do not show in general a lack of flux during the prompt emission (indicative of a cutoff ), on the other hand also a strong excess over the extrapolation of the Band function fit is in most cases excluded. In few cases, a clear extra-component has been identified, sometimes extending also at the lower end of the GBM energy range. However, this component rises with a delay as compared to the keV–MeV prompt emission and might be justified with contamination from the afterglow emission. Summarizing, the LAT data have not provided clear evidence about the existence of an SSC component (or any other component) of internal origin dominating the GeV energy range in the prompt emission phase of GRBs.
GeV radiation detected on timescales much longer than the prompt phase is commonly interpreted as synchrotron emission from electrons accelerated by the external forward shock, i.e., in this interpretation, GeV data would lie on the high-energy part of the synchrotron spectrum [19]. Synchrotron photons are expected to be produced below a maximum energy corresponding to the maximum energy of the accelerated electrons. The latter can be estimated by equating the acceleration and cooling timescales. Assuming a Bohm acceleration rate and synchrotron cooling, the maximum electron energy implies a limit for the energy of the observed synchrotron photons of GeV . This limit is time-dependent, as the bulk Lorentz factor decreases in time. Photons with energies in excess of 1–10 GeV at times larger than – s can be hardly explained as synchrotron radiation. The LAT has observed several photons from different GRBs that are in excess of this limit (e.g., [37]). The highest photon energy recorded by the LAT associated with GRBs is ∼100 GeV in the rest frame [37]. As of 2019, the LAT detected more than 160 GRBs, which exhibit photons above 100 MeV and ∼29 with VHE (≳10 GeV) photons [21]. This is probably the most important evidence for the presence of an additional spectral component dominating the afterglow emission at energies >10–100 GeV, even though it is not a final proof. Alternative models for particle acceleration might explain how electrons can attain larger energies and then emit synchrotron photons above the standard limit [30], explaining >10 GeV LAT photons. Unambiguous spectral evidence for the presence of an SSC component associated to the GRB afterglow has never been found, although a strong hint for the need of an extra-PL component in the LAT energy range is present in the spectrum of GRB 130427A (Figure 2) and has been successfully interpreted as SSC emission [20,38]. If an additional emitting component is indeed there, its presence should be revealed by observations at higher (TeV) energies.
2.4. Early Attempts of TeV Detections with Ground-Based Telescopes
The final proof for the presence of an additional emission component at high energies is expected to come from Cherenkov telescopes, sensitive in the GeV–TeV energy range. The main advantages of Cherenkov instruments are (i) their large effective area (several orders of magnitude above space-based instruments such as LAT) which compensates for the smaller photon flux at VHE and (ii) the extension to higher energies.
In the BATSE era, attempts to perform GRB follow up at different wavelengths were limited by slew times and large uncertainties in the GRB source position. To overcome these difficulties, extended air shower (EAS) detectors such as Milagro and ARGO appear to be well suited to perform a search for TeV GRBs, since they can benefit from a large field of view and a high duty cycle.
Milagro began operation in 1999. A prototype detector, Milagrito, operated from February 1997 to May 1998, during which it observed 54 GRBs detected by BATSE. The analysis of Milagrito observations during the prompt emission of each burst showed for one of them, GRB 970417a, an excess above background at a statistical significance of 3 [39], which was not high enough to be conclusive. The VHE -ray fluence inferred from this result is at least an order of magnitude greater than the sub-MeV fluence. If true, this detection would imply that at least for some GRB we might have missed most of the emitted energy, since this has been radiated in the VHE range. Observations at these energies might then be crucial for a correct estimate of the energetics involved in the GRB phenomenon. Unfortunately, no similar TeV signals were found from observations of bursts with the more sensitive Milagro.
2.5. VERITAS, MAGIC and H.E.S.S. Observations
The cosmological nature of GRBs implies that VHE emission from these sources suffers from strong EBL attenuation. At a typical GRB redshift z∼2, the attenuation is about one order of magnitude already at GeV. To limit the impact of EBL attenuation on the capability of ground-based instruments to detect GRBs, the low-energy instrument threshold should be extended as much as possible below 100 GeV. Moreover, the short live time of the prompt emission (< s, typically 20–30 s) and the fast fading nature of the afterglow demands for fast repointing times. All these requirements have been achieved and continuously enhanced by IACTs over the last 10–15 years. As a downside, IACTs have relatively narrow fields of view (a few degrees), can operate only during the night, and reach good performances on dark clear nights, resulting in a low duty cycle. Observations of GRBs with IACTs have led for many years to upper limits, on time scales ranging from a few tens of seconds to days.
Currently, GRB follow-up observations are regularly carried out with the latest generation of IACTs including the Major Atmospheric Imaging Cherenkov Telescope (MAGIC), the High Energy Stereoscopic System (H.E.S.S.), and the Very Energetic Radiation Imaging Telescope Array System (VERITAS).
As of 2018, VERITAS ( GeV, [40]) has observed more than 150 GRB locations [41]. No evidence for emission was reported. Stringent upper limits could be put in two cases: GRB 150323A [41], for which constraints on the density of the external medium could be placed from the lack of an SSC component, and GRB130427A [42], for which VERITAS observations (started 20 h after the burst) could place constraints on the presence of the cutoff of the SSC component (e.g., caused by Klein–Nishina, see Figure 3).
H.E.S.S. has followed-up 49 GRBs between 2008 and 2018 (this number already ignores 19 follow-ups performed in bad weather conditions or with issues in the data taking). Derived upper limits are approximately of the order of – cm s TeV [43].
MAGIC followed-up more than 130 GRBs starting from 2005 [44,45]. After the second telescope was added in 2009, GRB observations have been carried out in stereoscopic mode. Excluding cases when proper data could not be taken due to hardware problems or weather conditions, 105 GRBs were observed from July 2004 to February 2019. Of these, 40 have a measured redshift, but only 8 and 3 had and , respectively [1]. Observations started less than 30 min after the burst for 66 events and less than 60 s for 14 events.
In light of the recent detections (see Section 3), which show the presence of VHE emission both in energetic and sub-energetic GRBs, the paucity of detections and the difficulty faced by IACTs up to some years ago must be ascribed to the combination of several factors, such as the relatively high-energy threshold (∼100–200 GeV) before recent upgrades, a low duty cycle (∼10%), as well as the combination of the IACT narrow field of view (a few degrees) with the poor localization capabilities of the most productive space detectors (e.g., the BATSE and the GBM) and with the time needed to repoint and start follow-up observations.
3. Long GRBs: Detections of TeV Afterglow Radiation
In January 2019, the MAGIC collaboration circulated through the GCN [46] and ATel [47] channels the news of the firm detection (significance above 20 ) of photons with energies in excess of 300 GeV, from GRB 190114C. A few months later, the H.E.S.S. collaboration released the analysis of a GRB observed in 2018, displaying a VHE excess with significance of ∼5. These detections, published by the Nature journal at the end of 2019 [1,2], marked the beginning of the VHE era in GRBs. Since then, two additional GRBs have been firmly (>) detected by IACTs.
In this section, I describe the properties of these four GRBs and their VHE emission, also including in the list an additional GRB with a detection at ∼. All these detections refer to long GRBs, detected at VHE during their afterglow phases. Their main properties are summarized in Table 1.
A hint (∼) of VHE excess recorded by MAGIC from the short GRB 160821B is presented in Section 4. Observations performed during the prompt phase will be discussed in Section 5. A discussion and interpretation of the VHE emission is the topic of Section 6.
3.1. GRB 180720B
Detected by H.E.S.S., this GRB is located at redshift and triggered both the BAT and the GBM. The prompt duration measured by the GBM is s, but, from the BAT and XRT lightcurves, it is evident that the bursting phase continues up to at least 130 s (Figure 4). The energy emitted during the prompt phase in the energy band 50–300 keV is erg, larger than the average value for long GRBs with measured redshift (∼ erg). LAT observations are available from the time of the initial trigger to 700 s after. LAT-detected photons extend in energy above 1 GeV, with a 5 GeV photon that arrived 142 s after the GBM trigger. The XRT lightcurve shows an initial variability, possibly related to the prompt component, a plateau phase extending up to ∼300 s, and then a PL decay. In soft X-rays, during the afterglow emission, this is one of the brightest GRB ever detected.
H.E.S.S. observed the GRB for two hours, starting 10.1 h after the trigger (Figure 4) and detected an excess in the sub-TeV range (0.1–0.44 TeV) with a significance of 5.3 [2]. Given the low signal of the source, the H.E.S.S. spectrum could not be properly constrained, and a fit with an EBL-attenuated PL model returns a value of the photon index with large uncertainties: . No temporal analysis could be performed to check for flux variation in time. The lack of simultaneous XRT or LAT observations at the time of the H.E.S.S. observations prevents us from building the spectral energy distribution (SED). The interpolation of the XRT flux at the time of the H.E.S.S. detection reveals that the energy flux emitted in the 0.1–0.44 TeV range was only ∼2 times smaller than the energy flux in the 0.3–10 keV range (Figure 4).
From this detection we learn that VHE radiation can be efficiently produced several hours after the end of the prompt, with a luminosity that at the time of the H.E.S.S. detection is similar to the luminosity in X-rays.
3.2. GRB 190114C
Located at redshift , this long GRB triggered both BAT and GBM, as well as AGILE [48] (both with Super-AGILE and AGILE-MCAL), KONUS-Wind [49], INTEGRAL [50], and Insight-HXMT [51]. The prompt duration was about 116 s as measured by the GBM and about 360 s as measured by the BAT. However, both from GBM and BAT lightcurves, it is evident that the bursting phase ends at ∼25 s. The X-ray emission after this time fades following a PL function (Figure 5, left). The energy emitted during the prompt phase was erg [52]. The LAT observations are available up to 180 s, when the burst left the LAT FoV. The burst reentered the LAT FoV at 8600 s, and significant emission was still observed by the LAT (Figure 5, left plot, red circles). Photons with energies in excess of 1 GeV have been detected, with a 21 GeV photon that arrived 21 s after the GBM trigger. The XRT lightcurve is well described by a PL with decay index , from 68 s to ∼ s. Similarly to GRB 180720B, the X-ray afterglow of GRB 190114C is one of the brightest ever detected.
MAGIC observed the GRB field starting ∼60 s after the BAT trigger and detected a signal up to 2400 s, in the energy range 0.2–1 TeV, with significance of detection of > [1]. The large signal of the source allowed to perform time-resolved analysis by dividing the whole time-interval into six bins and to study the temporal behaviour of the VHE flux. The lightcurve in the 0.2–1 TeV range decays in time as a PL with index . The spectrum, after correcting for EBL absorption, has a photon index <, possibly evolving in time to softer values (from at 62–90 s to at 635–2400 s). Simultaneous XRT and LAT observations are available from 68 s to 180 s and allowed to build two SEDs from 0.1 keV to 1 TeV (blue and yellow data points in Figure 5). The XRT flux (integrated between 1–10 keV) at the time of the MAGIC observations is a factor ∼2 larger than the 0.3–1 TeV flux, which is in turn very similar to the 0.1–1 GeV flux.
These observations revealed for the first time the temporal behaviour of the TeV emission in GRB afterglows and allowed to build the first GRB SEDs extending up to 1 TeV.
3.3. GRB 190829A
This very nearby () GRB detected by the H.E.S.S. provides a unique possibility to probe the VHE emission with minor effects from EBL attenuation. The prompt duration was ∼63 s (50–300 keV) and the energy emitted in the 10–1000 keV energy range was ∼ erg, falling in the low-energy tail of the distribution for long GRBs. The GRB also triggered BAT with a delay of 51 s as compared to the GBM. At the time of the GBM trigger, the GRB was in the LAT FoV and remained visible until ∼1100 s. No emission has been detected by LAT, and only upper limits on the 0.1–1 GeV flux could be estimated. XRT observations began 158 s after the GBM trigger and showed a flare/peak between 1000 and 3000 s. After this time, the XRT light curve followed a PL decay and was observed up to ∼ s.
The H.E.S.S. observed and detected emission on three consecutive nights, from 4.3 to 55.9 h after the GRB in the TeV range (0.1–3.3 TeV) with a significance of detection of 21.7 in the first night [31]. The H.E.S.S. lightcurve, extracted in the 0.2–4 TeV energy range, is well described by a PL model with index (Figure 6). The intrinsic spectrum could be studied during the first two nights. A fit with an EBL-attenuated PL returns intrinsic PL indices and , respectively. Simultaneous observations by XRT were available during the first two nights and allowed to build an XRT-H.E.S.S. SED. LAT upper limits were also available during the first night but did not help in constraining the SED shape. The comparison with the XRT flux at the time of the H.E.S.S. detections reveals that the luminosity emitted in the 0.2–4 TeV energy range was about three to four times smaller than the luminosity in the 0.3–10 keV range.
The detection of this GRB by the H.E.S.S. revealed for the first time that GRBs can produce VHE radiation on long timescales (days) and up to large energies (≳3 TeV). Additionally, in contrast with previous detections, the isotropic energy of the prompt emission (∼ erg) was quite low and suggests that moderately low-luminosity GRBs can efficiently produce VHE radiation.
3.4. GRB 201015A
An excess at VHE was reported by MAGIC, with a significance of > [54]. This GRB, located at redshift , was detected and localized by BAT and had a duration of ∼10 s. There was no onboard trigger by the GBM, but the GRB was identified by the GBM targeted search. The isotropic-equivalent prompt energy inferred from analysis of GBM data was ∼ erg. XRT started observations only 3214 s after the BAT trigger, due to observing constraints. Observations extend to almost one day and show that the X-ray lightcurve follows a PL decay with index (Figure 7). Late observations by Chandra and XRT (between 8 and 21 days) show that the XRT flux was higher (a factor of 20–100) than the extrapolation of the PL behaviour followed at earlier times.
MAGIC observations started 33 s after the BAT trigger and lasted about 4 h. Preliminary analysis of MAGIC data [55] show evidence for emission above 140 GeV with a significance of ∼.
In terms of intrinsic properties, this GRB was comparable to GRB 190829A, having similar and similar X-ray luminosity of the afterglow phase (Table 1 and Figure 7, bottom panel). Being located at a larger distance, the overall flux was much reduced (Figure 7, top panel) and the EBL attenuation in the VHE range more severe. MAGIC observations were performed under good observational conditions, resulting also in a low energy threshold (∼140 GeV), which is crucial to increase the possibility of detection. A proper comparison with GRB 190829A will be possible after MAGIC final data analysis is published.
3.5. GRB 201216C
This long GRB, which triggered both the GBM and BAT, has been detected by MAGIC even though it is located at large redshift . The prompt duration was about 30 s in the range of 50–300 keV, and about 48 s in the range of 15–350 keV. The energy emitted during the prompt phase was ∼ erg (10–1000 keV). The LAT observations were available from 3500 s to 5500 s after the trigger. No significant emission was detected by the LAT in this time interval. Due to observing constraints, XRT began observations about 3000 s after the trigger (Figure 7).
MAGIC observed the GRB for about 2.2 h, starting 56 s after the BAT trigger. An excess of counts, dominated by events at ∼100 GeV in the first 20 min of observations was detected with a significance of about ≳ [56].
GRB 201216C has a prompt energy and an afterglow X-ray luminosity very similar to those observed from GRB 180720B and GRB 190114C (Figure 7, bottom panel). The higher redshift resulted in a more severe attenuation of the TeV flux by EBL absorption. In spite of this, the detection is quite clear and is probably favoured by the very good observing conditions and low energy threshold (∼100 GeV).
3.6. Comparison between , z and X-ray Lightcurves of VHE GRBs
Figure 7 and Figure 8 propose a comparison between the X-ray lightcurves, the emitted prompt energy , and redshifts of the five long GRBs detected by IACTs. In particular, X-ray (prompt and afterglow) lightcurves (fluxes and luminosities) are shown in Figure 7, while their distribution in the planes -z and - are shown in Figure 8. In this last figure, VHE GRBs are shown, for comparison, together with a sample of Swift long GRBs with a high level of redshift completeness [57,58]. Given its low detection significance in preliminary analysis (∼), GRB 201015A is marked in all plots with a gray colour.
Three GRBs (180720B, 190114C, and 201216C) are very similar in terms of intrinsic properties, such as and luminosity of the X-ray lightcurves. The higher redshift of GRB 201216C explains its slightly lower flux (Figure 7, top panel, purple colour) and the faintness of the VHE detection, caused by the larger distance and more severe EBL attenuation (here we are assuming that X-ray luminosity is a proxy for VHE luminosity). Their X-ray lightcurves (0.3–10 keV, observer frame) have similar behaviours and almost overlap, with typical fluxes around erg cm s and luminosities around 1–4 erg s (both numbers are estimated at 11 h, observer/rest frame for fluxes/luminosities).
GRB 190829A has a much smaller compared to the three GRBs previously mentioned (about times smaller) and a fainter X-ray luminosity (more than two orders of magnitude). The redshift is also very different (), resulting in a X-ray flux that is very similar to those of brighter but more-distant GRBs (Figure 7, top panel, blue colour). The X-ray flux might then act as a proxy for the detection probabilities of VHE emission from IACTs. However, an exception is represented by GRB 201015A. Having a small and intrinsic X-ray luminosity but a redshift very similar to GRB 190114C, the X-ray flux was also very low as compared to all the other GRBs. This might explain the faintness of the VHE excess detected by MAGIC, which, if truly connected with the source, can be explained thanks to the very good observing conditions, low energy threshold, and short delay.
In general, we learned that the intrinsic properties of GRBs able to produce detectable VHE emission span at least two orders of magnitude in X-ray afterglow luminosity and three in . Redshifts are in the interval 0.078–1.1 and imply a variation over three orders of magnitude in the observed X-ray flux.
4. Short GRBs: Observations and Follow Up of GW Events
Short GRBs are thought to be originated by the coalescence of compact binary systems (either a NS-BH or NS-NS), as supported by several indirect pieces of evidence (see [59] and references therein). The detection of a GW signal from the merger of an NS-NS system (GW 170817 [60]) in association with the detection of a short GRB marked the first direct proof. Programs for the follow up of GW alerts and short GRBs at VHE are in place at all major facilities (for a review on the state-of-the-art of observations of electromagnetic counterparts to GWs and also high-energy neutrinos, see [61], in this Special Issue). In this section, I summarise the results of observations at VHE of GW/GRB 170817A and GRB 160821B.
4.1. Follow-Up Observations of GRB 170817A by H.E.S.S., MAGIC, and HAWC
The detection of GW 170817 triggered an extensive observational campaign aimed at covering a very wide range of frequencies (from radio up to VHE -rays). The proximity of the event, located at , implies very limited attenuation by EBL (about 10% at and 30% at ), which favours VHE observations of this event and, more generally, of GW alerts. However, in this specific case, the MWL flux from the associated jet received at Earth was quite reduced by the relatively large viewing angle (the X-ray flux at the peak of the emission reached about erg cm s).
The H.E.S.S. observations [62] of the region of NGC 4993 were performed about 5.3 h after the GW event, before the identification of the optical transient SSS17a (interpreted as emission from the kilonova) as part of the scanning of the GW localization uncertainty region, covering an area of . After the identification of the optical transient, the H.E.S.S. observations focused on the region of SSS17a and continued in the following nights, covering the range 0.22–5.23 days after the GW event. Around the peak of the X-ray, optical, and radio emissions (about 160 days), the H.E.S.S. performed additional observations [63]. The obtained upper limits around the peak of the emission at lower frequency were at a flux level 10 times higher than the observed X-ray flux (Figure 9, top panel).
MAGIC observed the counterpart from January to June 2018, when visibility constraints allowed it, for a total amount of ∼9.5 h in 10 different nights. The time of the MAGIC observations corresponds to the time when the radio and X-ray flux were at their maximum. Assuming a spectrum with photon index , the resulting UL calculated at 400 GeV is erg cm s. The MAGIC UL lies well above the predicted SSC component associated to the synchrotron emission detected at lower frequencies (Figure 9).
GRB 170817A entered the FoV of HAWC ∼8 h after the GRB/GW event. For the first transit, an upper limit of erg cm s for an energy range of 4–100 TeV was derived [65]. Observations continued also at later times, extending to 120 days after the trigger. In the time period of 10–110 days after the merger time, the flux upper limit found was erg cm s in the energy range of 7–170 TeV [66].
The upper limits derived by the different telescopes on the VHE emission from GRB 170817A are not particularly constraining for the models, even though some information on the strength of the magnetic field could be inferred. Theoretical implications will be discussed in Section 6.
4.2. Follow-up Observations of GRB 160821B by MAGIC
GRB 160821B is a short GRB detected by the BAT (∼ s) and GBM (∼1 s). At a redshift , this is one of the nearest short GRBs known. The prompt energy emitted is ∼ erg. Analyses of the multiwavelength observational data of its afterglow emission revealed an optical–infrared component consistent with kilonova emission [67,68]. So far, it is the best sampled kilonova without a GW detection. No emission was detected by LAT.
Follow-up observations with the MAGIC telescopes automatically started 24 s after the burst trigger. The first ∼1.7 h of the data were strongly affected by clouds, while the remaining ∼2.2 h were taken under better weather conditions. Evidence of a -ray excess above 500 GeV was found at a significance of ∼. The flux implied by these observations, in case the excess was interpreted as a real signal from the source, was about a factor of 10 higher than the simultaneous X-ray flux, once the VHE flux was de-absorbed by EBL. Such a large (compared to X-ray emission) VHE flux is surprising for a short GRB and has proved to be challenging to explain [69,70].
Further observations of short GRBs are necessary to understand if such a bright emission component at VHE in short GRBs is present and eventually what is its origin.
5. Prompt Emission: Observations by EAS Arrays
The search for a VHE counterpart to the keV–MeV prompt emission requires that the total time needed to point the GRB location (which is the sum of the delay in receiving the alert and the telescope slewing time) is shorter than the prompt duration. For short GRBs, which have a duration <2 s, only serendipitous detections (which are very unlikely with IACTs) are possible. For long GRBs, the typical duration (∼20–30 s) is comparable with the shortest time delays of past IACTs observations. A combination of short time delay and particularly long GRB is then needed in order to start observations with IACTs while the prompt emission is still ongoing. Since 2013, MAGIC started observations within 100 s about 30 times, but unfortunately in almost all these cases the short delay was longer than the prompt duration. In a few cases, the GRB was observed with a delay similar or shorter than the prompt duration, but the large redshift and/or non-optimal observing conditions prevented the derivation of useful constraints on the presence of a prompt VHE component. These numbers in any case show that these observations are feasible, and it might be only matter of time for IACTs to detect VHE emission during the prompt (or at least place strong constraints on its presence).
Another possibility to observe the prompt with IACTs is represented by those GRBs that are triggered on a precursor event: if the delay time of the telescope is comparable to the delay between the main event and the precursor, it is even possible to observe GRBs with IACTs during the brightest part of the prompt emission.
The observation of X-ray flares (present in a good fraction of GRBs) is a task well within reach with IACTs. X-ray flares are detected over much longer timescales, – s, making simultaneous observations of X-ray flares in the GeV–TeV band highly feasible. In GRB 180720B, high-energy (LAT) observations are available during the flaring activity. This GRB was also detected at VHE (but at much later times, ∼10 h). The spectral analysis of GBM and LAT data around 100–200 s [71] shows the evidence for a distinct spectral component rising above 100 MeV. The full characterization of this component and its relation with the X-ray flare can be performed only with the help of VHE observations. In the last two GRBs detected at VHE, GRB 201015A, and GRB 201216C, MAGIC started observations with a delay <60 s, but unfortunately in both cases XRT could not start observations until thousands of seconds after the trigger time, due to observational constraints.
EAS arrays, such as LHAASO [72] and HAWC [73], might have better chances of observing GRBs during the prompt emission, given their much larger FoV∼2 sr and duty cycle >90%. Observations by LHAASO of GRB 190829A, detected by H.E.S.S. up to 3 TeV, were available both during the prompt and afterglow phase. The analysis shows no indication of emission, but the upper limits on VHE radiation during the prompt show the potential for interesting studies of prompt emission with EAS arrays. GRB 190829A occurred on the edge of the FoV of LHAASO, when a quarter of the WCDA (one of the major parts of LHAASO) was operational. Data from h to h are available. Limits were converted to energy flux upper limits adopting a PL intrinsic spectrum and considering EBL absorption. Two distinct upper limits were derived in two different energy ranges: at >100 GeV and in the TeV domain and compared with a phenomenological model for the VHE emission. This is assumed to be a PL extending up to at least 10 TeV. In the TeV domain, the LHAASO upper limit places strong constraints on the brightness of this putative component. Even though several caveats are in place, these observations, performed with a limited array and non-optimal observing conditions, compared to a simple phenomenological model show the potential of LHAASO, and EAS arrays in general, in producing strong constraints on (or even detect) VHE emission from GRBs in their prompt phase.
6. Interpretation: What We Have Learned
The recent detections of GRBs with IACTs show that, similarly to other extreme sources (such as blazars and pulsar wind nebulae), GRBs can develop physical conditions suitable for the production of VHE radiation. How this radiation is produced is matter of debate: detections are very recent and limited in number, with half of them reaching barely the telescope detection threshold. Current observations leave open a few possibilities, which the community is currently discussing.
The two most likely scenarios are SSC and synchrotron from ultrarelativistic electrons. Although SSC seems the most natural explanation and has not been discarded by observations, the similarity between X-ray and TeV fluxes, spectral indices, and temporal behaviour is pushing the community to take into consideration also a synchrotron origin, although this requires electron energies well in excess of the maximum energy assumed to be achievable in the basic version of acceleration at the external shock.
6.1. Double Bump or Single Component?
A first question, to discriminate among different models, is whether or not there is evidence for a distinct spectral component, producing a double bump in the multi-wavelength SED.
Soft X-ray (∼1 keV) afterglow emission is interpreted as synchrotron radiation from electrons accelerated at the forward shock, driven by the relativistic jet into the external medium. Although the origin of flares and of the plateau phase are still under debate, the PL decay phase is consistent with model predictions. The photon index of XRT spectra measured in different GRBs ranges between −1.5 and −2.5, with an average value of −2 [74]. This suggests that the peak of the synchrotron spectrum can lie both below and above the X-ray band, depending on the GRB conditions and the observing time. In the latter case, brighter LAT emission is expected and indeed observed [74]. LAT photons (at least those with energy below a few GeV, which represent the bulk of the LAT-detected photons) are also consistent with synchrotron forward shock emission [14,15,16,18]. Modeling of MWL afterglow observations, including LAT, have successfully explained observations within this model [18,19].
Current observations of VHE emission by IACTs open the question whether this additional emission is also consistent with being the high-energy part of the synchrotron spectrum or whether it is produced by a different mechanism. From a purely observational point of view, the smoking gun to discriminate among the two possibilities comes from the study of the SED shape: while a synchrotron origin would imply one single broad component, a double bump in the X-ray to TeV SED would reveal the need for an additional emission component.
Simultaneous X-ray/GeV/TeV SEDs are available only for GRB 190114C and GRB 190829A, in both cases for two epochs. A double bump is visible in the first SED (between 68 and 110 s after the trigger time) of GRB 190114C. Evidence comes from the comparison between the TeV and X-ray flux (a single component would require a flat PL spectrum from X-rays to TeV) and especially from the LAT spectral point, which shows that the flux must decrease between the X-ray and GeV band and then rise at higher energies, in order to explain the TeV flux (see Figure 5, blue points). One can wonder whether the uncertainty on the EBL absorption (which at can be quite relevant) affects the results on the consistency of MAGIC data with the extension of the spectral component. MAGIC unabsorbed data (Figure 5) have been inferred adopting the EBL model developed by [5]. At 300 GeV an attenuation five times less severe (which basically means no attenuation) is required to make MAGIC observations consistent with the extrapolation of the fit to X-ray and LAT data. Although the presence of a double bump in GRB 190114C is fairly convincing, the observation of a double bump in one GRB does not necessarily imply that in all TeV GRBs another emission mechanism (other than synchrotron) is at work.
In GRB 190829A, the TeV and X-ray lightcurves decay in time at similar rates and their spectra have a consistent photon index (within the errors), once they are both modelled with PL functions. The extrapolation of the X-ray spectrum to the energy range of the H.E.S.S. detection predicts a flux that is consistent with observations. Unfortunately, in this case, LAT observations do not help in constraining the shape of the SED, as they provide an upper limit that lies well above the extrapolation of the X-ray spectrum (Figure 10).
Concerning GRB 180720B, one single epoch of the H.E.S.S. observations is available, and simultaneous XRT and LAT data are missing. An SED cannot be built, but the interpolation of X-ray lightcurve at the time of H.E.S.S. detection and the extrapolation of the XRT spectrum to 400 GeV shows a rough consistency with the H.E.S.S. flux. The H.E.S.S. spectrum has a photon index , suggesting a rising component, inconsistent with the synchrotron interpretation, but uncertainties are quite large (). Finally, for GRB 201216C, data are not publicly available yet, and the comparison between simultaneous XRT and TeV flux cannot be performed at the time of writing.
Finally, for the short GRB 160821B, the MAGIC flux lies well above the extrapolation of the synchrotron spectrum. If the -ray excess is real and associated to the GRB, then an additional spectral component must be invoked to explain the SED shape. Both SSC and external Compton (EC) models have been considered for this GRB, but the large flux compared to the synchrotron flux is quite challenging to reach in both scenarios [69,70].
In the next session, synchrotron and SSC processes as sources of VHE radiation are discussed, with a particular emphasis on their implications on the physics of GRBs.
6.1.1. Synchrotron Radiation
TeV photons can be produced by the synchrotron mechanism if the energy of the electrons is large enough. To estimate the energy of electrons that would radiate synchrotron photons at VHE, we must first estimate the bulk Lorentz factor and the magnetic field. Considering that the H.E.S.S. detected photons up to 1 TeV during the first two nights of observations and that the energy of the four detected GRBs is in the range – erg, I consider as reference values erg and d. In the following equations, time and energy are in the rest frame, while the magnetic field is in the plasma comoving frame. For a homogeneous medium (H) with number density :
where the assumption was adopted.
where is the fraction of shock-dissipated energy that goes into the magnetic field. The Lorentz factor of electrons emitting synchrotron photons with energy TeV is:
corresponding (for the adopted reference values) to an electron energy of ∼5 PeV. Electrons should then be accelerated beyond PeV energies.
A similar energy is required also in case of expansion in a wind-like medium (W). For number density :
corresponding to an electron energy of ∼3 PeV for the adopted reference values.
This energy exceeds the maximum electron energy inferred assuming a Bohm acceleration rate and synchrotron cooling: Following [28]:
corresponding to for the homogeneous medium case and to in the wind-like case. In both cases, an electron energy two orders of magnitude higher is necessary to explain TeV photons as synchrotron radiation.
The maximum electron energy in Equation (7) was inferred assuming that the magnetic field strength is the same in the acceleration and emission regions. If the shock-amplified magnetic field decays downstream of the shock front on a length-scale smaller than the distance travelled by the electron before loosing a sizable fraction of its energy, higher Lorentz factors can be reached [18,28]. In a modified model where , the maximum attainable electron energy is given by Equation (7) times the factor (e.g., [28]).
A synchrotron origin was suggested so far to explain the emission detected by the H.E.S.S. from GRB 190829A [31]. In this study, the two possible origins were both investigated, and the synchrotron one was found to better account for the data, while the SSC was strongly disfavoured (see Figure 10, top panel). A different interpretation, proposing a SSC scenario, has been put forward by [75] (see Figure 10, bottom panel), which concluded that an SSC interpretation is a viable explanation for the H.E.S.S. detection. The reason why different conclusions are reached in the two different investigations should be probably ascribed to the different regions of parameter space investigated.
6.1.2. Synchrotron Self Compton
Astrophysical sources powered by synchrotron radiation are expected to have an inverse Compton scattering component. The same electrons that produce synchrotron photons may efficiently scatter these synchrotron seed photons to higher energies, depending on the source conditions, and in particular on the energy density of the radiation and of the magnetic field.
If the scattering proceeds in the Thomson regime, the electron energy can be estimated as:
where is the frequency of the upscattered photon, and is the synchrotron target photon. Different electrons contribute to the production of SSC photons with a given energy. For photon energy TeV, the energy of the electrons that mostly contribute to their production depends on which part of the spectrum we are looking at 1 TeV. Considering again as a reference the H.E.S.S. GRB 190829A, the flat spectrum detected both in X-ray and in TeV suggest that the peak of the synchrotron and SSC spectra are around 1 keV and 1 TeV, respectively. The electron Lorentz factor is then , corresponding to an energy of about 10 GeV. The ratio between the height of the two bumps depends on the ratio between energy density of the radiation and of the magnetic field. For the Thomson regime, it is independent from and can be approximated as:
The similarity between X-ray and TeV fluxes implies a Compton parameter Y∼1, where Y is the ratio between the power emitted in SSC and synchrotron.
At 1 d, with the reference values assumed in the previous section, the scattering between 1 keV photons and electrons with ∼ is (barely) in the Thomson regime. It is then worth estimating the required electron energy in case TeV photons are by scattering in the Klein–Nishina regime, . From the bulk Lorentz factor inferred in the previous section, for typical parameters this implies an electron energy ∼200 GeV. The SSC theory has been applied to the detected GRBs for which VHE data have been published (GRB 190114C, 180720B, and 190829A) and was found to be consistent with the data.
The multi-wavelength emission from GRB 190114C has been successfully explained, except for optical and radio late-time data, which are overproduced by the model. X-ray, GeV, and MAGIC data are instead well modelled, both in their temporal and spectral behaviour. Interestingly, according to the modelling, the emission detected by LAT at s, after the GRB re-entered the FoV, is dominated by SSC radiation. It is very likely that in other cases LAT photons detected at late times (difficult to reconcile in the synchrotron scenario) have an SSC origin. From the shape of the full LAT lightcurve and spectral evolution, the presence of two components cannot be guessed, and only the inclusion of VHE observations are able to disentangle the contribution of the two components to the LAT energy range. Previous speculations on the presence in the GeV range of a distinct spectral component were based on the difficulty in producing synchrotron photons in the GeV range at late times. All the investigations focused on inferring the afterglow parameters from the modelling of multi-wavelength observations of GRB 190114C within the SSC scenario [53,76,77] have inferred similar values for the parameters, which lie in the following ranges: 0.07–0.1, = (4–8) , density 0.3–2 cm, 2.5–2.6, and (3–8) erg, with the exception of , which in [77] was found to have a larger value = (2–6) .
For GRB 190829A, an SSC interpretation has been put forward by [75] (see the SED modeling in Figure 10, bottom). They found that in order to obtain a good fit to the data, the fraction of electrons accelerated into the supra-thermal PL tail should be . The other parameters were similar to those inferred from GRB 190114C (except for a harder value of p): , , density cm, , and erg.
GRB 180720B has been modelled as SSC radiation by [76], which again found similar values to those adopted in the modelling of the other GRBs: , , density cm, , and erg.
These applications of the SSC model to the few GRBs detected so far reveals already some interesting features. The range of values is still quite large, but values of 0.1–0.01 (considered typical in the treatment of external shocks) were excluded. Moreover, the need to introduce the parameter suggests that finally, with a larger range of observables available, the degeneracy between the different parameters can be partially solved, and the fraction of accelerated electrons can be constrained. Numerical simulations suggest a fraction between 0.01 and 0.1 (see, e.g., [29]), but given the paucity of constraints, in afterglow modelling, this parameter is usually fixed to the value . In all the investigations, a good modelling of the VHE GRBs has been found both in the case of a homogeneous medium and in the case of a wind-like density profile. All fits are consistent with a homogeneous medium with a density typical of the ISM density ( 0.2–1 cm), even though long GRBs are expected to explode in chaotic media with a radial profile . The uncertainty on the radial profile of the density of the environment surrounding long GRBs is then still an open question.
7. Open Questions for Future Facilities
The study of TeV emission in GRBs is still at an early stage, and the first, most pressing question on which investigations are focusing is the physical origin of the emission. VHE can also be used, especially once its origin has been understood, to shed light on some of those challenging questions that remain unanswered in the physics of GRBs and in particular on the origin of prompt emission, the properties of the environment where GRB explodes, and the nature and properties of particle acceleration and magnetic field amplification. In this section, the potential of VHE radiation in shedding light on these fundamental questions is discussed.
7.1. Prompt Emission
The mechanisms responsible for the production of prompt radiation have not been identified yet. The lack of a satisfying explanation touches many aspects of the prompt emission, such as the nature of the dissipation process, the location of the emitting region (i.e., its distance from the central engine), the role of thermal processes, and the nature of the non-thermal mechanism (what the emitting particles are, how they are accelerated, and what the radiative mechanism is).
The primary candidate for the radiative mechanism is synchrotron radiation from non-thermal electrons. The common understanding of the conditions at the emitting region (i.e., large magnetic field strength ∼ G and electron Lorentz factors ∼–) imply that electrons are in an extremely fast cooling regime [78] and produce a photon spectrum with low-energy index . The low-energy part of the observed spectrum, however, is harder than the predicted value, having ∼. A major ease to this situation came with the discovery that many GRB spectra have a spectral break in the low-energy part [79,80]: in this case, the spectral regime is visible inside the energy rage of the soft/hard X-ray instruments, and the spectral break (identified between 1–100 keV [79,80,81,82,83,84]) connects the segment with the segment . In this configuration (sometimes named marginally fast cooling [85]), the break is identified with the cooling break frequency, and the radiation efficiency is still large and does not affect the estimates on the jet energetics. The identification of the cooling break frequency has major consequences on the inference of the conditions at the emitting region [81,84]. To account for the large cooling frequencies, the required magnetic field must be much smaller than what is usually assumed (∼1–10 G, [81,84]). Such a low value of the magnetic field immediately implies a strong SSC component. HE observations of prompt emission by LAT did not clearly identify the presence of such a component. This information, coming from the study of HE radiation, implies that in order to avoid a huge SSC component, the emission region should be placed at large radii ( cm) barely consistent with variability timescales and close or even larger than the radius where afterglow emission becomes important. In order to face these difficulties, different models have been invoked, such as the mini-jet scenario [86] and synchrotron radiation from protons ([87], see however [88]).
We must notice that the identification of the spectral regime and then the consistency of the overall spectrum with the predicted shape of synchrotron radiation represents a major improvement, but it faces the difficulty in explaining the hardest GRBs (which cross the line-of-death, having a spectrum harder than ) and the possible inconsistency between the relatively large width of theoretical synchrotron spectra and the narrowness of GRB spectra [89,90,91].
From this discussion it is evident how the identification of the radiative mechanism producing the prompt radiation would have strong implications on the physics of the emitting region, revealing size, distance from the central engine, magnetic field strength, and the bulk Lorentz factor, with enormous impact on our knowledge of the outflow and finally on the progenitors and jet-launching mechanisms. The presence (or lack) of an inverse Compton component, or more generally of a GeV–TeV component, would represent an additional and unique probe of the physical conditions at the region producing prompt radiation. After decades of studies of GRB spectra and with no immediate improvement in the capabilities of keV–MeV instruments, the window at GeV–TeV energies, explored with current and under-construction facilities seems the most appropriate tool to advance in the next decade our knowledge of the processes related to the production of prompt emission.
7.2. Short GRBs
Together with the detection of VHE radiation associated to the prompt emission, the detection of VHE emission from short GRBs represent the other main challenge for the present and future generation of Cherenkov telescopes.
In general, the detection of VHE -rays (and in particular of SSC radiation) from short GRBs is more challenging, because they are less energetic than long GRBs and in general explode in less-dense regions. This implies that detections or tight upper limits on -ray emission would provide constraints on the environment surrounding the progenitor [92] and hence on the nature and evolution of the progenitor itself. The importance of observing GW counterparts at VHE relies also on the fact that observations of particularly nearby GRBs are only moderately affected by EBL absorption. This simplifies the study of the spectral shape, allowing the identification of spectral features (such as cutoffs and spectral breaks) directly related to the physics of processes at work in the source. It is evident how the study of GW-GRB-associated signals can shed light on a number of aspects relevant to the study of emission from GRBs, and in particular on -ray radiation, but also on the study of the progenitors.
Chances of detection of VHE emission from short GRBs might increase if additional mechanisms able to produce bright VHE emission are at work. A good fraction of short GRBs have late-time activity, such as extended hard X-ray emission that continues for ∼100–300 s and X-ray flares observed even ∼– s after the prompt emission and the plateau emission (extending for ∼ s). These temporally extended components are commonly interpreted assuming that the central engine activity lasts much longer than the prompt emission, which could be explained by a magnetar or black hole accretion. The prolongued emission is attributed to internal dissipation. Several studies have investigated whether enhanced (V)HE Gamma-ray emission can be produced from prolonged engine activities in SGRBs.
Late photons that are related to the extended and/or plateau emission can be upscattered to the VHE band by high-energy electrons accelerated at the external forward shock via external inverse Compton (EIC) emission [93]. In this scenario, -ray emission can be useful to reveal the compact remnants such as a BH with a remnant disk or a long-lived pulsar. Whether the merger remnant is in general a BH or NS is an open question. This model found an application in GRB 160821B, a short GRB at with an associated kilonova emission [67,68], for which a signal at ∼TeV energies with significance has been found by MAGIC [69].
An additional source of seed photons that can be upscattered to higher energies, producing -ray emission, might be provided by cocoon photons [94]. If the prolonged jet dissipates kinetic energy inside the cocoon radius, non-thermal electrons will be present in the dissipation region. The jet–ejecta interaction also produces copious thermal photons, leading to high-energy Gamma-ray counterparts to GWs, which can be used to probe the prolonged jets and the long-lasting activity of the central engine.
7.3. Circumburst Medium
The detection of VHE emissions associated with the forward external shock can be fundamental in revealing the properties of the external medium surrounding the GRB progenitor.
In a typical case, available afterglow observations (covering the X-ray band and, with a sparser coverage, the optical band, and only in a small fraction also the radio band) are not sufficient to constrain the properties of the environment. Short GRBs are expected to explode in tenuous and homogeneous clean media, typical of the outskirts of the galaxies. Long GRBs are instead expected to explode preferentially in very chaotic media, with density profiles shaped by the wind of the stellar progenitor in the last phases of its life. This diversity should be reflected in a diversity on the afterglow radiation. The properties of the external medium (and in particular its radial profile, homogeneity and density, and magnetic field) shape the properties of the radiative output, since they affect the fireball dynamics (i.e., the deceleration time and the Lorentz factor ) but also the amount of emitting particles and the magnetic field (). Efforts to model the observations of the afterglow of long GRBs, which are usually more complete and sampled than the ones of short GRBs, often result in a impossibility in discriminating among a constant or wind-shaped medium, as both scenarios can account for the observations. The degeneracy among the many unknown parameters of the afterglow model can be sensitively reduced with the inclusion of complementary information obtained at VHE. Studies of the progenitors, conditions giving rise to the birth of a GRB explosion, environments, and stellar evolution might largely benefit from a study of the circumburst environment by means of its broadband afterglow emission.
7.4. Particle Acceleration at Ultra-Relativistic Shocks
The outcome of particle acceleration at the external shock is described adopting several free parameters, such as the fraction of electrons accelerated in the supra-thermal tail, the fractions and of dissipated energy converted into non-thermal energy of the electrons and into magnetic energy, respectively, and the maximum Lorentz factor . Modelling of afterglow observations and theoretical/numerical predictions both suggest a typical value of ∼. The fraction is still highly uncertain and usually fixed to 1 in the modelling, while simulations point to a fraction between 0.01 and 0.1 [29]. The parameter inferred from observations spans a wide range of values, from to 0.1. Finally, has never been inferred from observations and (if needed) is introduced in the modelling assuming Equation (7).
The inclusion of HE data from LAT has provided constraints on , suggesting a value much smaller than the one close to equipartition usually assumed (∼0.01–0.1). On the other hand, they did not help in identifying the location of the synchrotron cutoff, due to the limited signal in the high-energy part of the LAT instrument (a simple power-law model is usually a good fit to the LAT spectra) and to the possible presence of a VHE component already dominating at energies >1–10 GeV. The extension of the energy range thanks to VHE instruments can allow to model the VHE component and its contribution to the LAT energy range while disentangling the two spectral components, possibly inferring the cutoff of the synchrotron one. If, on the other hand, VHE data are consistent with being the continuation of the synchrotron emission, the maximum energy of the particles exceeds the limit currently assumed and gives information on the need for a more efficient mechanism able to accelerate electrons up to multi-PeV energies. VHE detections can complete the picture and allow a better interpretation of the SED.
8. Concluding Remarks and Future Prospects
At the dawn of the VHE era in GRBs, the few detections currently available are proving the enormous potential of this energy band in shedding light on several aspects of GRB physics and are giving a major boost to the field.
For a full exploitation of TeV data, first a comprehension of the origin of this emission needs to be achieved. The sources of uncertainty come from the difficulty in having simultaneous X-ray, GeV, and TeV observations to build a proper SED and also on the relatively large redshift of the detected GRBs: for three out of four detected GRBs the redshift is between 0.42 and 1.1, where EBL attenuation is severe and increases the uncertainties on the intrinsic spectrum at VHE. The detection of nearby events () is then fundamental, but their rate is much smaller as compared to the bulk of the population.
Even though the current generation of IACTs has allowed the discovery of VHE radiation from GRBs, the understanding and the full exploitation of observations in this energy band are expected to come with the next generation of Cherenkov telescopes. The Cherenkov Telescope Array (CTA) will represent an improvement in several technical aspects which are fundamental to increase the possibilities of a GRB detection. CTA will have an appreciably lower energy threshold (≲30 GeV), and cover the entire sky, featuring a sensitivity considerably better than existing instruments and rapid slewing capabilities (180 degrees azimuthal rotation in 20 s, comparable to MAGIC). Moreover, CTA will be able to measure the spectra and variability of GRBs at multi-GeV energies with unprecedented photon statistics. Preliminary estimates of the expected GRB detection rate amount to a few events per year, depending mostly on the energy threshold and on the delay time [95].
The detection of GRB 190829A up to ∼3.3 TeV opens the interesting possibility to detect GRBs also with small-sized telescopes (SSTs). The planned ASTRI Mini-Array, composed of nine imaging atmospheric dual-mirror Cherenkov telescopes at the Teide Observatory site, will play a crucial role in the study of the new TeV component, by further extending the explored range to energies greater than few TeV. The target sources are those GRBs at a particularly low redshift: their detection (even though it will not constitute the bulk of the population) would be very important for studying the properties of GRBs at the highest energies, with minor attenuation by the EBL (and then smaller uncertainties related to our limited knowledge of EBL at higher redshifts). Figure 11 shows preliminary results on the detectability of GRBs with the ASTRI-Mini-Array. In particular, GRB 190114C was taken as a template, used at its original redshift (), and moved to closer redshifts ( and , with the latter one being the redshift of the H.E.S.S.-detected GRB 190829A). The lightcurves at 1 TeV in the three different cases are compared to the ASTRI Mini-Array sensitivity in the left-hand panel, and the spectra accumulated from 200 s to 800 s are shown in the right-hand panel.
For a full exploitation of current and future GRB observations at VHE, the role of other facilities is fundamental. IACTs require external alerts and localization with error , which currently are assured by BAT and, in minor part, by GBM triggers, but, in the near future, no additional space telescopes will be available. The role and importance of synergies with other facilities is not limited to providing external alerts. The nature of VHE emission can be unveiled only by means of multi-wavelength observations. In particular, GeV observations simultaneous to the VHE detections have been of paramount importance in GRB 190114C to show the presence of a deep in the SED and then to support the existence of two distinct components.
At present, it is still unclear whether VHE emission can be accommodated within the standard scenario and whether its physics can be satisfactorily captured by a simple one-zone SSC model. Future observations by current facilities, and in a few years by the CTA, will be able to tell us if a modification (or even a radical change) in our description of afterglow radiation is needed, e.g., in terms of the nature of the radiating particles, the physics of the particle acceleration process, or even the need for developing more accurate two-zone models.
Funding
This research received no external funding.
Conflicts of Interest
The authors declare no conflict of interest.
| 1 | https://heasarc.gsfc.nasa.gov/W3Browse/fermi/fermilgrb.html accessed on 22 September 2021. |
References
- MAGIC Collaboration; Acciari, V.A.; Ansoldi, S.; Antonelli, L.A.; Arbet Engels, A.; Baack, D.; Babić, A.; Banerjee, B.; Barres de Almeida, U.; Barrio, J.A.; et al. Teraelectronvolt emission from the γ-ray burst GRB 190114C. Nature 2019, 575, 455–458. [Google Scholar] [CrossRef]
- Abdalla, H.; Adam, R.; Aharonian, F.; Ait Benkhali, F.; Angüner, E.O.; Arakawa, M.; Arcaro, C.; Armand, C.; Ashkar, H.; Backes, M.; et al. A very-high-energy component deep in the γ-ray burst afterglow. Nature 2019, 575, 464–467. [Google Scholar] [CrossRef] [PubMed] [Green Version]
- Vurm, I.; Beloborodov, A.M. On the Prospects of Gamma-ray Burst Detection in the TeV Band. Astrophys. J. 2017, 846, 152. [Google Scholar] [CrossRef] [Green Version]
- Gilmore, R.C.; Somerville, R.S.; Primack, J.R.; Domínguez, A. Semi-analytic modelling of the extragalactic background light and consequences for extragalactic Gamma-ray spectra. Mon. Notices RAS 2012, 422, 3189–3207. [Google Scholar] [CrossRef] [Green Version]
- Domínguez, A.; Primack, J.R.; Rosario, D.J.; Prada, F.; Gilmore, R.C.; Faber, S.M.; Koo, D.C.; Somerville, R.S.; Pérez-Torres, M.A.; Pérez-González, P.; et al. Extragalactic background light inferred from AEGIS galaxy-SED-type fractions. Mon. Notices RAS 2011, 410, 2556–2578. [Google Scholar] [CrossRef] [Green Version]
- Franceschini, A.; Rodighiero, G. The extragalactic background light revisited and the cosmic photon-photon opacity. Astron. Astrophys. 2017, 603, A34. [Google Scholar] [CrossRef]
- Franceschini, A. Photon–Photon Interactions and the Opacity of the Universe in Gamma Rays. Universe 2021, 7, 146. [Google Scholar] [CrossRef]
- Pilla, R.P.; Loeb, A. Emission Spectra from Internal Shocks in Gamma-ray Burst Sources. Astrophys. J. Lett. 1998, 494, L167–L171. [Google Scholar] [CrossRef] [Green Version]
- Dermer, C.D.; Chiang, J.; Mitman, K.E. Beaming, Baryon Loading, and the Synchrotron Self-Compton Component in Gamma-ray Bursts. Astrophys. J. 2000, 537, 785–795. [Google Scholar] [CrossRef]
- Wang, X.Y.; Dai, Z.G.; Lu, T. The Inverse Compton Emission Spectra in the Very Early Afterglows of Gamma-ray Bursts. Astrophys. J. 2001, 556, 1010–1016. [Google Scholar] [CrossRef]
- Wang, X.Y.; Li, Z.; Mészáros, P. GeV-TeV and X-Ray Flares from Gamma-ray Bursts. Astrophys. J. Lett. 2006, 641, L89–L92. [Google Scholar] [CrossRef] [Green Version]
- Fan, Y.Z.; Piran, T.; Narayan, R.; Wei, D.M. High-energy afterglow emission from Gamma-ray bursts. Mon. Notices RAS 2008, 384, 1483–1501. [Google Scholar] [CrossRef] [Green Version]
- Bošnjak, Ž.; Daigne, F.; Dubus, G. Prompt high-energy emission from Gamma-ray bursts in the internal shock model. Astron. Astrophys. 2009, 498, 677–703. [Google Scholar] [CrossRef] [Green Version]
- Kumar, P.; Barniol Duran, R. On the generation of high-energy photons detected by the Fermi Satellite from Gamma-ray bursts. Mon. Notices RAS 2009, 400, L75–L79. [Google Scholar] [CrossRef]
- Ghisellini, G.; Ghirlanda, G.; Nava, L.; Celotti, A. GeV emission from Gamma-ray bursts: A radiative fireball? Mon. Notices RAS 2010, 403, 926–937. [Google Scholar] [CrossRef] [Green Version]
- Ghirlanda, G.; Ghisellini, G.; Nava, L. The onset of the GeV afterglow of GRB 090510. Astron. Astrophys. 2010, 510, L7. [Google Scholar] [CrossRef]
- Barniol Duran, R.; Kumar, P. Implications of electron acceleration for high-energy radiation from Gamma-ray bursts. Mon. Notices RAS 2011, 412, 522–528. [Google Scholar] [CrossRef] [Green Version]
- Lemoine, M. Synchrotron signature of a relativistic blast wave with decaying microturbulence. Mon. Notices RAS 2013, 428, 845–866. [Google Scholar] [CrossRef] [Green Version]
- Beniamini, P.; Nava, L.; Duran, R.B.; Piran, T. Energies of GRB blast waves and prompt efficiencies as implied by modelling of X-ray and GeV afterglows. Mon. Notices RAS 2015, 454, 1073–1085. [Google Scholar] [CrossRef] [Green Version]
- Tam, P.H.T.; Tang, Q.W.; Hou, S.J.; Liu, R.Y.; Wang, X.Y. Discovery of an Extra Hard Spectral Component in the High-energy Afterglow Emission of GRB 130427A. Astrophys. J. Lett. 2013, 771, L13. [Google Scholar] [CrossRef] [Green Version]
- Ajello, M.; Arimoto, M.; Axelsson, M.; Baldini, L.; Barbiellini, G.; Bastieri, D.; Bellazzini, R.; Bhat, P.N.; Bissaldi, E.; Blandford, R.D.; et al. A Decade of Gamma-ray Bursts Observed by Fermi-LAT: The Second GRB Catalog. Astrophys. J. 2019, 878, 52. [Google Scholar] [CrossRef] [Green Version]
- Nava, L. High-energy emission from Gamma-ray bursts. Int. J. Mod. Phys. D 2018, 27, 1842003. [Google Scholar] [CrossRef] [Green Version]
- Kaneko, Y.; Preece, R.D.; Briggs, M.S.; Paciesas, W.S.; Meegan, C.A.; Band, D.L. The Complete Spectral Catalog of Bright BATSE Gamma-ray Bursts. Astrophys. J. Suppl. 2006, 166, 298–340. [Google Scholar] [CrossRef]
- Nava, L.; Ghirlanda, G.; Ghisellini, G.; Celotti, A. Spectral properties of 438 GRBs detected by Fermi/GBM. Astron. Astrophys. 2011, 530, A21. [Google Scholar] [CrossRef] [Green Version]
- Gruber, D.; Goldstein, A.; Weller von Ahlefeld, V.; Narayana Bhat, P.; Bissaldi, E.; Briggs, M.S.; Byrne, D.; Cleveland, W.H.; Connaughton, V.; Diehl, R.; et al. The Fermi GBM Gamma-ray Burst Spectral Catalog: Four Years of Data. Astrophys. J. Suppl. 2014, 211, 12. [Google Scholar] [CrossRef] [Green Version]
- Fermi Large Area Telescope Team; Ackermann, M.; Ajello, M.; Baldini, L.; Barbiellini, G.; Baring, M.G.; Bechtol, K.; Bellazzini, R.; Blandford, R.D.; Bloom, E.D.; et al. Constraining the High-energy Emission from Gamma-ray Bursts with Fermi. Astrophys. J. 2012, 754, 121. [Google Scholar] [CrossRef] [Green Version]
- Vianello, G.; Gill, R.; Granot, J.; Omodei, N.; Cohen-Tanugi, J.; Longo, F. The Bright and the Slow—GRBs 100724B and 160509A with High-energy Cutoffs at ≲100 MeV. Astrophys. J. 2018, 864, 163. [Google Scholar] [CrossRef] [Green Version]
- Kumar, P.; Hernández, R.A.; Bošnjak, Ž.; Barniol Duran, R. Maximum synchrotron frequency for shock-accelerated particles. Mon. Notices RAS 2012, 427, L40–L44. [Google Scholar] [CrossRef] [Green Version]
- Sironi, L.; Spitkovsky, A.; Arons, J. The Maximum Energy of Accelerated Particles in Relativistic Collisionless Shocks. Astrophys. J. 2013, 771, 54. [Google Scholar] [CrossRef] [Green Version]
- Kouveliotou, C.; Granot, J.; Racusin, J.L.; Bellm, E.; Vianello, G.; Oates, S.; Fryer, C.L.; Boggs, S.E.; Christensen, F.E.; Craig, W.W.; et al. NuSTAR Observations of GRB 130427A Establish a Single Component Synchrotron Afterglow Origin for the Late Optical to Multi-GeV Emission. Astrophys. J. Lett. 2013, 779, L1. [Google Scholar] [CrossRef] [Green Version]
- H.E.S.S. Collaboration; Abdalla, H.; Aharonian, F.; Ait Benkhali, F.; Angüner, E.O.; Arcaro, C.; Armand, C.; Armstrong, T.; Ashkar, H.; Backes, M.; et al. Revealing X-ray and gamma ray temporal and spectral similarities in the GRB 190829A afterglow. Science 2021, 372, 1081–1085. [Google Scholar] [CrossRef] [PubMed]
- Acciari, V.A.; Ansoldi, S.; Antonelli, L.A.; Arbet Engels, A.; Baack, D.; Babić, A.; Banerjee, B.; Barres de Almeida, U.; Barrio, J.A.; Becerra González, J.; et al. Bounds on Lorentz Invariance Violation from MAGIC Observation of GRB 190114C. Phys. Rev. Lett. 2020, 125, 021301. [Google Scholar] [CrossRef] [PubMed]
- Terzić, T.; Kerszberg, D.; Strišković, J. Probing Quantum Gravity with Imaging Atmospheric Cherenkov Telescopes. Universe 2021, 7, 345. [Google Scholar] [CrossRef]
- Desai, A.; Ajello, M.; Omodei, N.; Hartmann, D.H.; Domínguez, A.; Paliya, V.S.; Helgason, K.; Finke, J.; Meyer, M. Probing the EBL Evolution at High Redshift Using GRBs Detected with the Fermi-LAT. Astrophys. J. 2017, 850, 73. [Google Scholar] [CrossRef] [Green Version]
- González, M.M.; Dingus, B.L.; Kaneko, Y.; Preece, R.D.; Dermer, C.D.; Briggs, M.S. A γ-ray burst with a high-energy spectral component inconsistent with the synchrotron shock model. Nature 2003, 424, 749–751. [Google Scholar] [CrossRef]
- Ajello, M.; Arimoto, M.; Asano, K.; Axelsson, M.; Baldini, L.; Barbiellini, G.; Bastieri, D.; Bellazzini, R.; Berretta, A.; Bissaldi, E.; et al. Bright Gamma-ray Flares Observed in GRB 131108A. Astrophys. J. Lett. 2019, 886, L33. [Google Scholar] [CrossRef]
- Ackermann, M.; Ajello, M.; Asano, K.; Atwood, W.B.; Axelsson, M.; Baldini, L.; Ballet, J.; Barbiellini, G.; Baring, M.G.; Bastieri, D.; et al. Fermi-LAT Observations of the Gamma-ray Burst GRB 130427A. Science 2014, 343, 42–47. [Google Scholar] [CrossRef] [PubMed] [Green Version]
- Liu, R.Y.; Wang, X.Y.; Wu, X.F. Interpretation of the Unprecedentedly Long-lived High-energy Emission of GRB 130427A. Astrophys. J. Lett. 2013, 773, L20. [Google Scholar] [CrossRef] [Green Version]
- Atkins, R.; Benbow, W.; Berley, D.; Chen, M.L.; Coyne, D.G.; Dingus, B.L.; Dorfan, D.E.; Ellsworth, R.W.; Evans, D.; Falcone, A.; et al. Evidence for TEV Emission from GRB 970417A. Astrophys. J. Lett. 2000, 533, L119–L122. [Google Scholar] [CrossRef]
- Holder, J.; Atkins, R.W.; Badran, H.M.; Blaylock, G.; Bradbury, S.M.; Buckley, J.H.; Byrum, K.L.; Carter-Lewis, D.A.; Celik, O.; Chow, Y.C.K.; et al. The first VERITAS telescope. Astropart. Phys. 2006, 25, 391–401. [Google Scholar] [CrossRef] [Green Version]
- Abeysekara, A.U.; Archer, A.; Benbow, W.; Bird, R.; Brose, R.; Buchovecky, M.; Bugaev, V.; Connolly, M.P.; Cui, W.; Errando, M.; et al. A Strong Limit on the Very-high-energy Emission from GRB 150323A. Astrophys. J. 2018, 857, 33. [Google Scholar] [CrossRef] [Green Version]
- Aliu, E.; Aune, T.; Barnacka, A.; Beilicke, M.; Benbow, W.; Berger, K.; Biteau, J.; Buckley, J.H.; Bugaev, V.; Byrum, K.; et al. Constraints on Very High Energy Emission from GRB 130427A. Astrophys. J. Lett. 2014, 795, L3. [Google Scholar] [CrossRef] [Green Version]
- Piel, Q.; Arcaro, C.H.E.; Ashkar, H.; Bissaldi, E.; Böttcher, M.; Carosi, A.; Egbert, K.; Hoischen, C.; Holler, M.; O’Brien, P.; et al. Gamma-ray Burst observation at Very High Energy with H.E.S.S. In Proceedings of the 36th International Cosmic Ray Conference (ICRC2019), Madison, WI, USA, 24 July–1 August 2019; Volume 36, p. 761. [Google Scholar]
- Longo, F.; Berti, A.; Bosnjak, Z.; Donini, A.; Fukami, S.; Green, J.G.; Miceli, D.; Moretti, E.; Nava, L.; Noda, K.; et al. Upper limits on the very high energy emission from GRBs observed by MAGIC. In Proceedings of the 37th International Cosmic Ray Conference—PoS(ICRC2021), Berlin, Germany, 12–23 July 2021; Volume 395, p. 820. [Google Scholar] [CrossRef]
- Berti, A.; Antonelli, L.A.; Bosnjak, Z.; Cortina, J.; Covino, S.; D’Elia, V.; Espiñeira, E.d.S.; Fukami, S.; Inoue, S.; Longo, F.; et al. Searching for GRBs at VHE with MAGIC: The status before CTA. In Proceedings of the 36th International Cosmic Ray Conference (ICRC2019), Madison, WI, USA, 24 July–1 August 2019; Volume 36, p. 634. [Google Scholar]
- Mirzoyan, R.; Noda, K.; Moretti, E.; Berti, A.; Nigro, C.; Hoang, J.; Micanovic, S.; Takahashi, M.; Chai, Y.; Moralejo, A.; et al. MAGIC detects the GRB 190114C in the TeV energy domain. GRB Coord. Netw. 2019, 23701, 1. [Google Scholar]
- Mirzoyan, R. First time detection of a GRB at sub-TeV energies; MAGIC detects the GRB 190114C. Astron. Telegr. 2019, 12390, 1. [Google Scholar]
- Tavani, M.; Barbiellini, G.; Argan, A.; Boffelli, F.; Bulgarelli, A.; Caraveo, P.; Cattaneo, P.W.; Chen, A.W.; Cocco, V.; Costa, E.; et al. The AGILE Mission. Astron. Astrophys. 2009, 502, 995–1013. [Google Scholar] [CrossRef]
- Aptekar, R.L.; Frederiks, D.D.; Golenetskii, S.V.; Ilynskii, V.N.; Mazets, E.P.; Panov, V.N.; Sokolova, Z.J.; Terekhov, M.M.; Sheshin, L.O.; Cline, T.L.; et al. Konus-W Gamma-ray Burst Experiment for the GGS Wind Spacecraft. Space Sci. Rev. 1995, 71, 265–272. [Google Scholar] [CrossRef] [Green Version]
- Winkler, C.; Courvoisier, T.J.L.; Di Cocco, G.; Gehrels, N.; Giménez, A.; Grebenev, S.; Hermsen, W.; Mas-Hesse, J.M.; Lebrun, F.; Lund, N.; et al. The INTEGRAL mission. Astron. Astrophys. 2003, 411, L1–L6. [Google Scholar] [CrossRef] [Green Version]
- Zhang, S.N.; Li, T.; Lu, F.; Song, L.; Xu, Y.; Liu, C.; Chen, Y.; Cao, X.; Bu, Q.; Chang, Z.; et al. Overview to the Hard X-ray Modulation Telescope (Insight-HXMT) Satellite. Sci. China Phys. Mech. Astron. 2020, 63, 249502. [Google Scholar] [CrossRef] [Green Version]
- Ajello, M.; Arimoto, M.; Axelsson, M.; Baldini, L.; Barbiellini, G.; Bastieri, D.; Bellazzini, R.; Berretta, A.; Bissaldi, E.; Blandford, R.D.; et al. Fermi and Swift Observations of GRB 190114C: Tracing the Evolution of High-energy Emission from Prompt to Afterglow. Astrophys. J. 2020, 890, 9. [Google Scholar] [CrossRef]
- MAGIC Collaboration; Acciari, V.A.; Ansoldi, S.; Antonelli, L.A.; Engels, A.A.; Baack, D.; Babić, A.; Banerjee, B.; Barres de Almeida, U.; Barrio, J.A.; et al. Observation of inverse Compton emission from a long γ-ray burst. Nature 2019, 575, 459–463. [Google Scholar] [CrossRef]
- Blanch, O.; Gaug, M.; Noda, K.; Berti, A.; Moretti, E.; Miceli, D.; Gliwny, P.; Ubach, S.; Schleicher, B.; Cerruti, M.; et al. MAGIC observations of GRB 201015A: Hint of very high energy Gamma-ray signal. GRB Coord. Netw. 2020, 28659, 1. [Google Scholar]
- Suda, Y.; Artero, M.; Asano, K.; Berti, A.; Nava, L.; Noda, K.; Terauchi, K.; Acciari, V.A.; Ansoldi, S.; Antonelli, L.A.; et al. Observation of a relatively low luminosity long duration GRB 201015A by the MAGIC telescopes. In Proceedings of the 37th International Cosmic Ray Conference—PoS(ICRC2021), Berlin, Germany, 12–23 July 2021; Volume 395, p. 797. [Google Scholar] [CrossRef]
- Fukami, S.; Berti, A.; Loporchio, S.; Suda, Y.; Nava, L.; Noda, K.; Bosnjak, Z.; Asano, K.; Longo, F.; Acciari, V.A.; et al. Very-high-energy Gamma-ray emission from GRB 201216C detected by MAGIC. In Proceedings of the 37th International Cosmic Ray Conference—PoS(ICRC2021), Berlin, Germany, 12–23 July 2021; Volume 395, p. 788. [Google Scholar] [CrossRef]
- Salvaterra, R.; Campana, S.; Vergani, S.D.; Covino, S.; D’Avanzo, P.; Fugazza, D.; Ghirlanda, G.; Ghisellini, G.; Melandri, A.; Nava, L.; et al. A Complete Sample of Bright Swift Long Gamma-ray Bursts. I. Sample Presentation, Luminosity Function and Evolution. Astrophys. J. 2012, 749, 68. [Google Scholar] [CrossRef] [Green Version]
- D’Avanzo, P.; Salvaterra, R.; Sbarufatti, B.; Nava, L.; Melandri, A.; Bernardini, M.G.; Campana, S.; Covino, S.; Fugazza, D.; Ghirlanda, G.; et al. A complete sample of bright Swift Gamma-ray bursts: X-ray afterglow luminosity and its correlation with the prompt emission. Mon. Notices RAS 2012, 425, 506–513. [Google Scholar] [CrossRef] [Green Version]
- Metzger, B.D.; Berger, E. What is the Most Promising Electromagnetic Counterpart of a Neutron Star Binary Merger? Astrophys. J. 2012, 746, 48. [Google Scholar] [CrossRef] [Green Version]
- Abbott, B.P.; Abbott, R.; Abbott, T.D.; Acernese, F.; Ackley, K.; Adams, C.; Adams, T.; Addesso, P.; Adhikari, R.X.; Adya, V.B.; et al. GW170817: Observation of Gravitational Waves from a Binary Neutron Star Inspiral. Phys. Rev. Lett. 2017, 119, 161101. [Google Scholar] [CrossRef] [PubMed] [Green Version]
- Dorner, D.; Mostafá, M.; Satalecka, K. High-Energy Alerts in the Multi-Messenger Era. Universe 2021, 7, 393. [Google Scholar] [CrossRef]
- Abdalla, H.; Abramowski, A.; Aharonian, F.; Ait Benkhali, F.; Angüner, E.O.; Arakawa, M.; Arrieta, M.; Aubert, P.; Backes, M.; Balzer, A.; et al. TeV Gamma-ray Observations of the Binary Neutron Star Merger GW170817 with H.E.S.S. Astrophys. J. Lett. 2017, 850, L22. [Google Scholar] [CrossRef] [Green Version]
- Abdalla, H.; Adam, R.; Aharonian, F.; Ait Benkhali, F.; Angüner, E.O.; Arakawa, M.; Arcaro, C.; Armand, C.; Armstrong, T.; Ashkar, H.; et al. Probing the Magnetic Field in the GW170817 Outflow Using H.E.S.S. Observations. Astrophys. J. Lett. 2020, 894, L16. [Google Scholar] [CrossRef]
- Salafia, O.S.; Berti, A.; Covino, S.; D’Elia, V.; Miceli, D.; Nava, L.; Patricelli, B.; Righi, C.; Inoue, S.; Antonelli, L.A.; et al. Follow-up observations of GW170817 with the MAGIC telescopes. In Proceedings of the 37th International Cosmic Ray Conference—PoS(ICRC2021), Berlin, Germany, 12–23 July 2021; Volume 395, p. 944. [Google Scholar] [CrossRef]
- Galvan-Gamez, A.; Fraija, N.; Magdalena Gonzalez, M. Search for very-high-energy emission with HAWC from GW170817 event. arXiv 2019, arXiv:1908.10031. [Google Scholar]
- Fraija, N.; Gonzalez, M.M. Search for very-high-energy photons from Gamma-ray bursts with HAWC. In Proceedings of the 36th International Cosmic Ray Conference (ICRC2019), Madison, WI, USA, 24 July–1 August 2019; Volume 36, p. 679. [Google Scholar]
- Troja, E.; Castro-Tirado, A.J.; Becerra González, J.; Hu, Y.; Ryan, G.S.; Cenko, S.B.; Ricci, R.; Novara, G.; Sánchez-Rámirez, R.; Acosta-Pulido, J.A.; et al. The afterglow and kilonova of the short GRB 160821B. Mon. Notices RAS 2019, 489, 2104–2116. [Google Scholar] [CrossRef] [Green Version]
- Lamb, G.P.; Tanvir, N.R.; Levan, A.J.; de Ugarte Postigo, A.; Kawaguchi, K.; Corsi, A.; Evans, P.A.; Gompertz, B.; Malesani, D.B.; Page, K.L.; et al. Short GRB 160821B: A Reverse Shock, a Refreshed Shock, and a Well-sampled Kilonova. Astrophys. J. 2019, 883, 48. [Google Scholar] [CrossRef]
- Acciari, V.A.; Ansoldi, S.; Antonelli, L.A.; Arbet Engels, A.; Asano, K.; Baack, D.; Babić, A.; Baquero, A.; Barres de Almeida, U.; Barrio, J.A.; et al. MAGIC Observations of the Nearby Short Gamma-ray Burst GRB 160821B. Astrophys. J. 2021, 908, 90. [Google Scholar] [CrossRef]
- Zhang, B.T.; Murase, K.; Yuan, C.; Kimura, S.S.; Mészáros, P. External Inverse-Compton Emission Associated with Extended and Plateau Emission of Short Gamma-ray Bursts: Application to GRB 160821B. Astrophys. J. Lett. 2021, 908, L36. [Google Scholar] [CrossRef]
- Duan, M.Y.; Wang, X.G. Origin for the Prompt Spectral Evolution Characteristics and High Energy Emission during the X-Ray Flare in GRB 180720B. Astrophys. J. 2019, 884, 61. [Google Scholar] [CrossRef]
- Cao, Z.; Chen, M.J.; Chen, H.B.; Liu, C.; Liu, Y.; Ma, L.L.; Ma, X.H.; Sheng, X.D.; Wu, H.R.; Xiao, G.; et al. Introduction to Large High Altitude Air Shower Observatory (LHAASO). Chin. Astron. Astrophys. 2019, 43, 457–478. [Google Scholar] [CrossRef]
- Abeysekara, A.U.; Aguilar, J.A.; Aguilar, S.; Alfaro, R.; Almaraz, E.; Álvarez, C.; Álvarez-Romero, J.d.D.; Álvarez, M.; Arceo, R.; Arteaga-Velázquez, J.C.; et al. On the sensitivity of the HAWC observatory to Gamma-ray bursts. Astropart. Phys. 2012, 35, 641–650. [Google Scholar] [CrossRef] [Green Version]
- Ajello, M.; Baldini, L.; Barbiellini, G.; Bastieri, D.; Bellazzini, R.; Bissaldi, E.; Blandford, R.D.; Bonino, R.; Bottacini, E.; Bregeon, J.; et al. Investigating the Nature of Late-time High-energy GRB Emission through Joint Fermi/Swift Observations. Astrophys. J. 2018, 863, 138. [Google Scholar] [CrossRef]
- Salafia, O.S.; Ravasio, M.E.; Yang, J.; An, T.; Orienti, M.; Ghirlanda, G.; Nava, L.; Giroletti, M.; Mohan, P.; Spinelli, R.; et al. Multi-wavelength view of the close-by GRB~190829A sheds light on Gamma-ray burst physics. arXiv 2021, arXiv:2106.07169. [Google Scholar]
- Wang, X.Y.; Liu, R.Y.; Zhang, H.M.; Xi, S.Q.; Zhang, B. Synchrotron Self-Compton Emission from External Shocks as the Origin of the Sub-TeV Emission in GRB 180720B and GRB 190114C. Astrophys. J. 2019, 884, 117. [Google Scholar] [CrossRef]
- Derishev, E.; Piran, T. GRB afterglow parameters in the era of TeV observations: The case of GRB~190114C. arXiv 2021, arXiv:2106.12035. [Google Scholar]
- Ghisellini, G.; Celotti, A.; Lazzati, D. Constraints on the emission mechanisms of Gamma-ray bursts. Mon. Notices RAS 2000, 313, L1–L5. [Google Scholar] [CrossRef] [Green Version]
- Oganesyan, G.; Nava, L.; Ghirlanda, G.; Celotti, A. Detection of Low-energy Breaks in Gamma-ray Burst Prompt Emission Spectra. Astrophys. J. 2017, 846, 137. [Google Scholar] [CrossRef] [Green Version]
- Oganesyan, G.; Nava, L.; Ghirlanda, G.; Celotti, A. Characterization of Gamma-ray burst prompt emission spectra down to soft X-rays. Astron. Astrophys. 2018, 616, A138. [Google Scholar] [CrossRef]
- Oganesyan, G.; Nava, L.; Ghirlanda, G.; Melandri, A.; Celotti, A. Prompt optical emission as a signature of synchrotron radiation in Gamma-ray bursts. Astron. Astrophys. 2019, 628, A59. [Google Scholar] [CrossRef] [Green Version]
- Ravasio, M.E.; Oganesyan, G.; Ghirlanda, G.; Nava, L.; Ghisellini, G.; Pescalli, A.; Celotti, A. Consistency with synchrotron emission in the bright GRB 160625B observed by Fermi. Astron. Astrophys. 2018, 613, A16. [Google Scholar] [CrossRef] [Green Version]
- Ravasio, M.E.; Ghirlanda, G.; Nava, L.; Ghisellini, G. Evidence of two spectral breaks in the prompt emission of Gamma-ray bursts. Astron. Astrophys. 2019, 625, A60. [Google Scholar] [CrossRef]
- Ronchi, M.; Fumagalli, F.; Ravasio, M.E.; Oganesyan, G.; Toffano, M.; Salafia, O.S.; Nava, L.; Ascenzi, S.; Ghirlanda, G.; Ghisellini, G. Rise and fall of the high-energy afterglow emission of GRB 180720B. Astron. Astrophys. 2020, 636, A55. [Google Scholar] [CrossRef] [Green Version]
- Daigne, F.; Bošnjak, Ž.; Dubus, G. Reconciling observed Gamma-ray burst prompt spectra with synchrotron radiation? Astron. Astrophys. 2011, 526, A110. [Google Scholar] [CrossRef] [Green Version]
- Burgess, J.M.; Bégué, D.; Greiner, J.; Giannios, D.; Bacelj, A.; Berlato, F. Gamma-ray bursts as cool synchrotron sources. Nat. Astron. 2020, 4, 174–179. [Google Scholar] [CrossRef]
- Ghisellini, G.; Ghirlanda, G.; Oganesyan, G.; Ascenzi, S.; Nava, L.; Celotti, A.; Salafia, O.S.; Ravasio, M.E.; Ronchi, M. Proton-synchrotron as the radiation mechanism of the prompt emission of Gamma-ray bursts? Astron. Astrophys. 2020, 636, A82. [Google Scholar] [CrossRef] [Green Version]
- Florou, I.; Petropoulou, M.; Mastichiadis, A. A marginally fast-cooling proton-synchrotron model for prompt GRBs. Mon. Notices RAS 2021. [Google Scholar] [CrossRef]
- Beloborodov, A.M. Regulation of the Spectral Peak in Gamma-ray Bursts. Astrophys. J. 2013, 764, 157. [Google Scholar] [CrossRef] [Green Version]
- Yu, H.F.; van Eerten, H.J.; Greiner, J.; Sari, R.; Narayana Bhat, P.; von Kienlin, A.; Paciesas, W.S.; Preece, R.D. The sharpness of Gamma-ray burst prompt emission spectra. Astron. Astrophys. 2015, 583, A129. [Google Scholar] [CrossRef] [Green Version]
- Vurm, I.; Beloborodov, A.M. Radiative Transfer Models for Gamma-ray Bursts. Astrophys. J. 2016, 831, 175. [Google Scholar] [CrossRef] [Green Version]
- Zhu, Q.Y.; Wang, X.Y. Probing the Environment of Gravitational-wave Transient Sources with TeV Afterglow Emission. Astrophys. J. Lett. 2016, 828, L4. [Google Scholar] [CrossRef] [Green Version]
- Murase, K.; Toomey, M.W.; Fang, K.; Oikonomou, F.; Kimura, S.S.; Hotokezaka, K.; Kashiyama, K.; Ioka, K.; Mészáros, P. Double Neutron Star Mergers and Short Gamma-ray Bursts: Long-lasting High-energy Signatures and Remnant Dichotomy. Astrophys. J. 2018, 854, 60. [Google Scholar] [CrossRef] [Green Version]
- Kimura, S.S.; Murase, K.; Ioka, K.; Kisaka, S.; Fang, K.; Mészáros, P. Upscattered Cocoon Emission in Short Gamma-ray Bursts as High-energy Gamma-ray Counterparts to Gravitational Waves. Astrophys. J. Lett. 2019, 887, L16. [Google Scholar] [CrossRef]
- Inoue, S.; Granot, J.; O’Brien, P.T.; Asano, K.; Bouvier, A.; Carosi, A.; Connaughton, V.; Garczarczyk, M.; Gilmore, R.; Hinton, J. Gamma-ray burst science in the era of the Cherenkov Telescope Array. Astropart. Phys. 2013, 43, 252–275. [Google Scholar] [CrossRef] [Green Version]
- Stamerra, A.; Saturni, F.G.; Green, J.G.; Nava, L.; Lucarelli, F.; Antonelli, L.A. TeV Transients with the ASTRI Mini-Array: A case study with GRB 190114C. In Proceedings of the 37th International Cosmic Ray Conference—PoS(ICRC2021), Berlin, Germany, 12–23 July 2021; Volume 395, p. 890. [Google Scholar] [CrossRef]
Figure 1.
Gamma-ray spectra of GRB 941017. Five time intervals are shown in five separated panels, from the beginning of the prompt phase to more than 200 s (panel a: 18–14 s; b: 14–47 s; c: 47–80 s; d: 80–113 s; e: 113–211 s). Crosses and filled circles show BATSE and EGRET data, respectively. The model fit (solid curve) is composed by a superposition of a smoothly broken PL (Band model) and a PL function. Two distinct spectral component are clearly present, except in the first time interval. From [35].

Figure 2.
GRB 130427A: fit of the LAT spectrum at two different times. A modelling with a synchrotron component (dashed line) and an SSC component (dot-dashed line) was proposed to explain the spectral hardening at GeV. From [38].
Figure 2.
GRB 130427A: fit of the LAT spectrum at two different times. A modelling with a synchrotron component (dashed line) and an SSC component (dot-dashed line) was proposed to explain the spectral hardening at GeV. From [38].

Figure 3.
Joint LAT-VERITAS SED of GRB 130427A. The VERITAS upper limits at the observing time 71 ks to 75 ks were calculated assuming an SSC model with breaks at 100, 140, and 180 GeV (solid, dot-dashed, and dashed lines, respectively). The gray shaded region shows the range of PL models compatible with the LAT data after temporal extrapolation from 10 ks to 70 ks. From [42].

Figure 4.
Temporal evolution of the emission from GRB 180720B. Upper panel: light curve detected by GBM (green), LAT (blue), and XRT (grey). The early 0.3–10 keV lightcurve is derived extrapolating the BAT spectra (15 keV–150 keV) to the XRT band (0.3–10 keV). The optical (r-band) lightcurve is also shown (purple). The 0.1–0.44 TeV flux inferred from H.E.S.S. observations is shown with a red circle. Observations at 18 days did not show any evidence for a VHE excess from the source (red arrow, upper limit at 95% confidence level). Bottom panel: photon index of the LAT and Swift and H.E.S.S. spectra (error bars at 1 ). From [2].

Figure 5.
Observations of GRB 190114C, detected at VHE by the MAGIC telescopes. Left: lightcurves at different wavelengths, from radio to -rays, versus time since the BAT trigger time. The MAGIC light curve (in the energy range 0.3–1 TeV, green circles) is compared with light curves at lower frequencies. The vertical dashed line marks approximately the end of the prompt emission phase, identified with the end of the last flaring episode. For the data points, vertical bars show the errors on the flux. Right: multi-band spectra in the time interval 68–2400 s. Five time intervals were considered: 68–110 s (blue), 110–180 s (yellow), 180–360 s (red), 360–625 s (green), and 625–2400 s (purple). MAGIC data points have been corrected for attenuation caused by the EBL. Data from other instruments are shown when available (i.e., for the first two time-intervals): XRT, BAT, GBM, and LAT. For each time interval, the LAT contour regions are shown limiting the energy range to the range where photons are detected. MAGIC and LAT contour regions were drawn from the error of their best-fit power law functions. For Swift data, the regions show the 90% confidence contours for the joint fit XRT-BAT obtained, fitting to the data a smoothly broken power law. Filled regions were used for the first time interval (68–110 s, blue color). Both figures are from [53].

Figure 6.
GRB 190829A detected by the H.E.S.S. Panel (A): X-ray (XRT, blue closed squares) and VHE gamma rays (the H.E.S.S., red circles) energy flux light curves. Upper limits on MeV -rays by LAT are also shown (grey arrows). The dashed blue line is the PL fit to the XRT temporal decay obtained by considering only the XRT data that were simultaneous with the H.E.S.S. observations (open squares). Panel (B): the corresponding intrinsic photon indices are shown. The H.E.S.S. intrinsic spectral index (red line) is the mean value of determined over all three nights of observation. Panel (C) shows the energy flux evolution of the prompt emission observed by the BAT. All error bars correspond to uncertainty, and the LAT upper limits are at the 95% confidence level.

Figure 7.
X-ray lightcurves of the long GRBs detected at VHE by MAGIC or H.E.S.S.. Different colours were used for different GRBs (see legend). For each GRB, the darker colour refers to the XRT, and the lighter colour was used for the BAT. Top: flux as a function of observer frame time since the trigger time (XRT: 0.3–10 keV observer-frame, unabsorbed; BAT: 15–50 keV). Bottom: luminosity as a function of the rest frame time (XRT: 2–10 keV rest frame, unubsorbed; BAT: 15–50 keV).

Figure 8.
GRBs detected at VHE compared to GRBs from the complete sample BAT6. Top: isotropic equivalent energy emitted in the prompt phase versus redshift. Bottom: X-ray afterglow luminosity (2–10 keV, rest frame) at 11 h (rest frame) versus .
Figure 8.
GRBs detected at VHE compared to GRBs from the complete sample BAT6. Top: isotropic equivalent energy emitted in the prompt phase versus redshift. Bottom: X-ray afterglow luminosity (2–10 keV, rest frame) at 11 h (rest frame) versus .

Figure 9.
VHE observations of GRB 170817A. Top: the H.E.S.S. 1–10 TeV energy flux upper limits (green arrows) are compared with VLA radio data at 3 GHz (blue stars) and 6 GHz (orange circles) and with X-ray data from Chandra (red crosses). Bottom: multi-wavelength SED (radio, optical and X-ray) as computed between 123 and 195 d post-merger. The fit with a synchrotron model and the predicted SSC at 155 days post-merger are shown in red. The MAGIC upper limit is shown by a yellow circle. From [64].

Figure 10.
SEDs and MWL modelling of GRB 190829A at two different epochs (first and second night of H.E.S.S. observations). Top: XRT (black regions), LAT (green arrow, available only for the first night), and H.E.S.S. intrinsic spectrum with its uncertainty (statistical only, red regions). The shaded areas represent the 68% confidence intervals for the SSC model (light blue) and for the synchrotron model (orange). Dashed lines indicate the synchrotron component, while the dash-dotted lines show the inverse Compton components, neglecting internal - absorption. Bottom: modelling from radio to TeV proposed by [75]. The predicted SEDs at the times of the H.E.S.S. detections are shown with blue and red solid lines at 5 and 30 h, respectively, and are based on a synchrotron and SSC interpretation. A reverse shock component (dotted curve) dominates the radio observations. Confidence bands with 90% and 50% confidence levels are marked in lighter shades.

Figure 11.
Left: lightcurve of GRB 190114C at 1 TeV (dotted purple curve) also moved to redshift (dashed yellow) and (dot-dashed green). The sensitivity of the ASTRI Mini-Array at 1 TeV is shown with a black solid line. Right: simulation of the spectrum of GRB 190114C integrated between 200 and 800 s as detected by the ASTRI Mini-Array (purple). Simulations of the same spectrum moved at closer redshift are also shown. From [96].


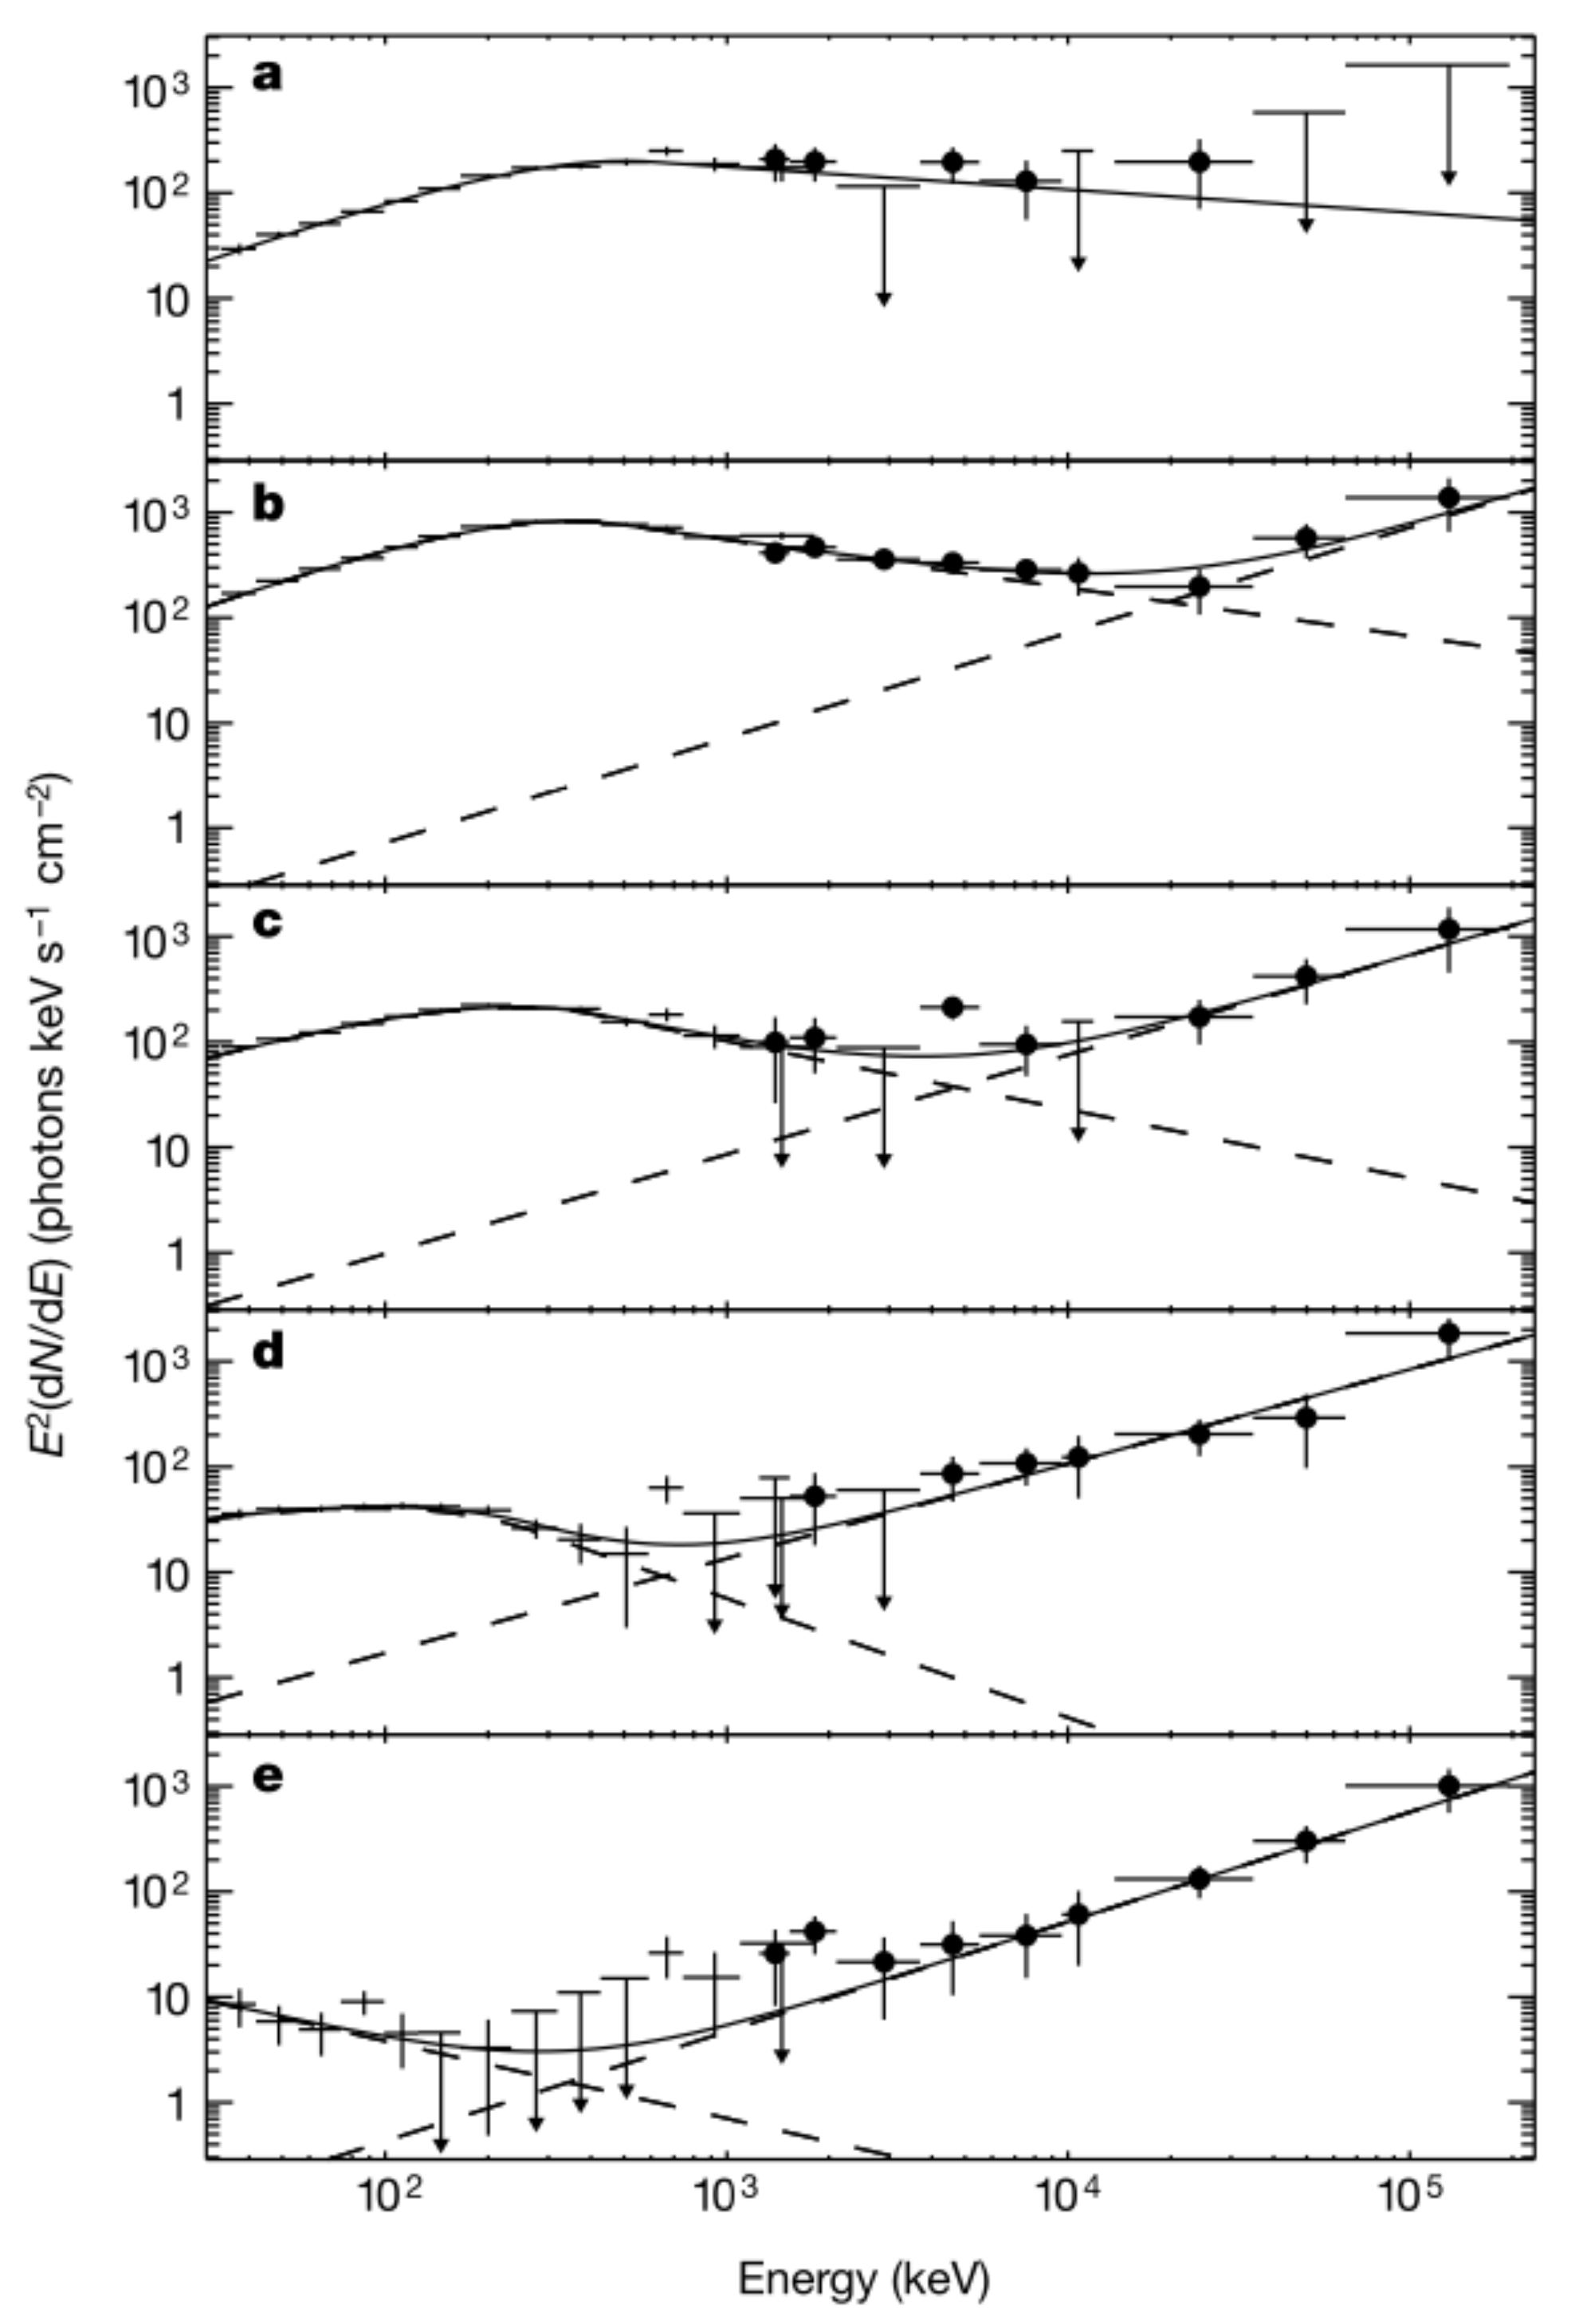
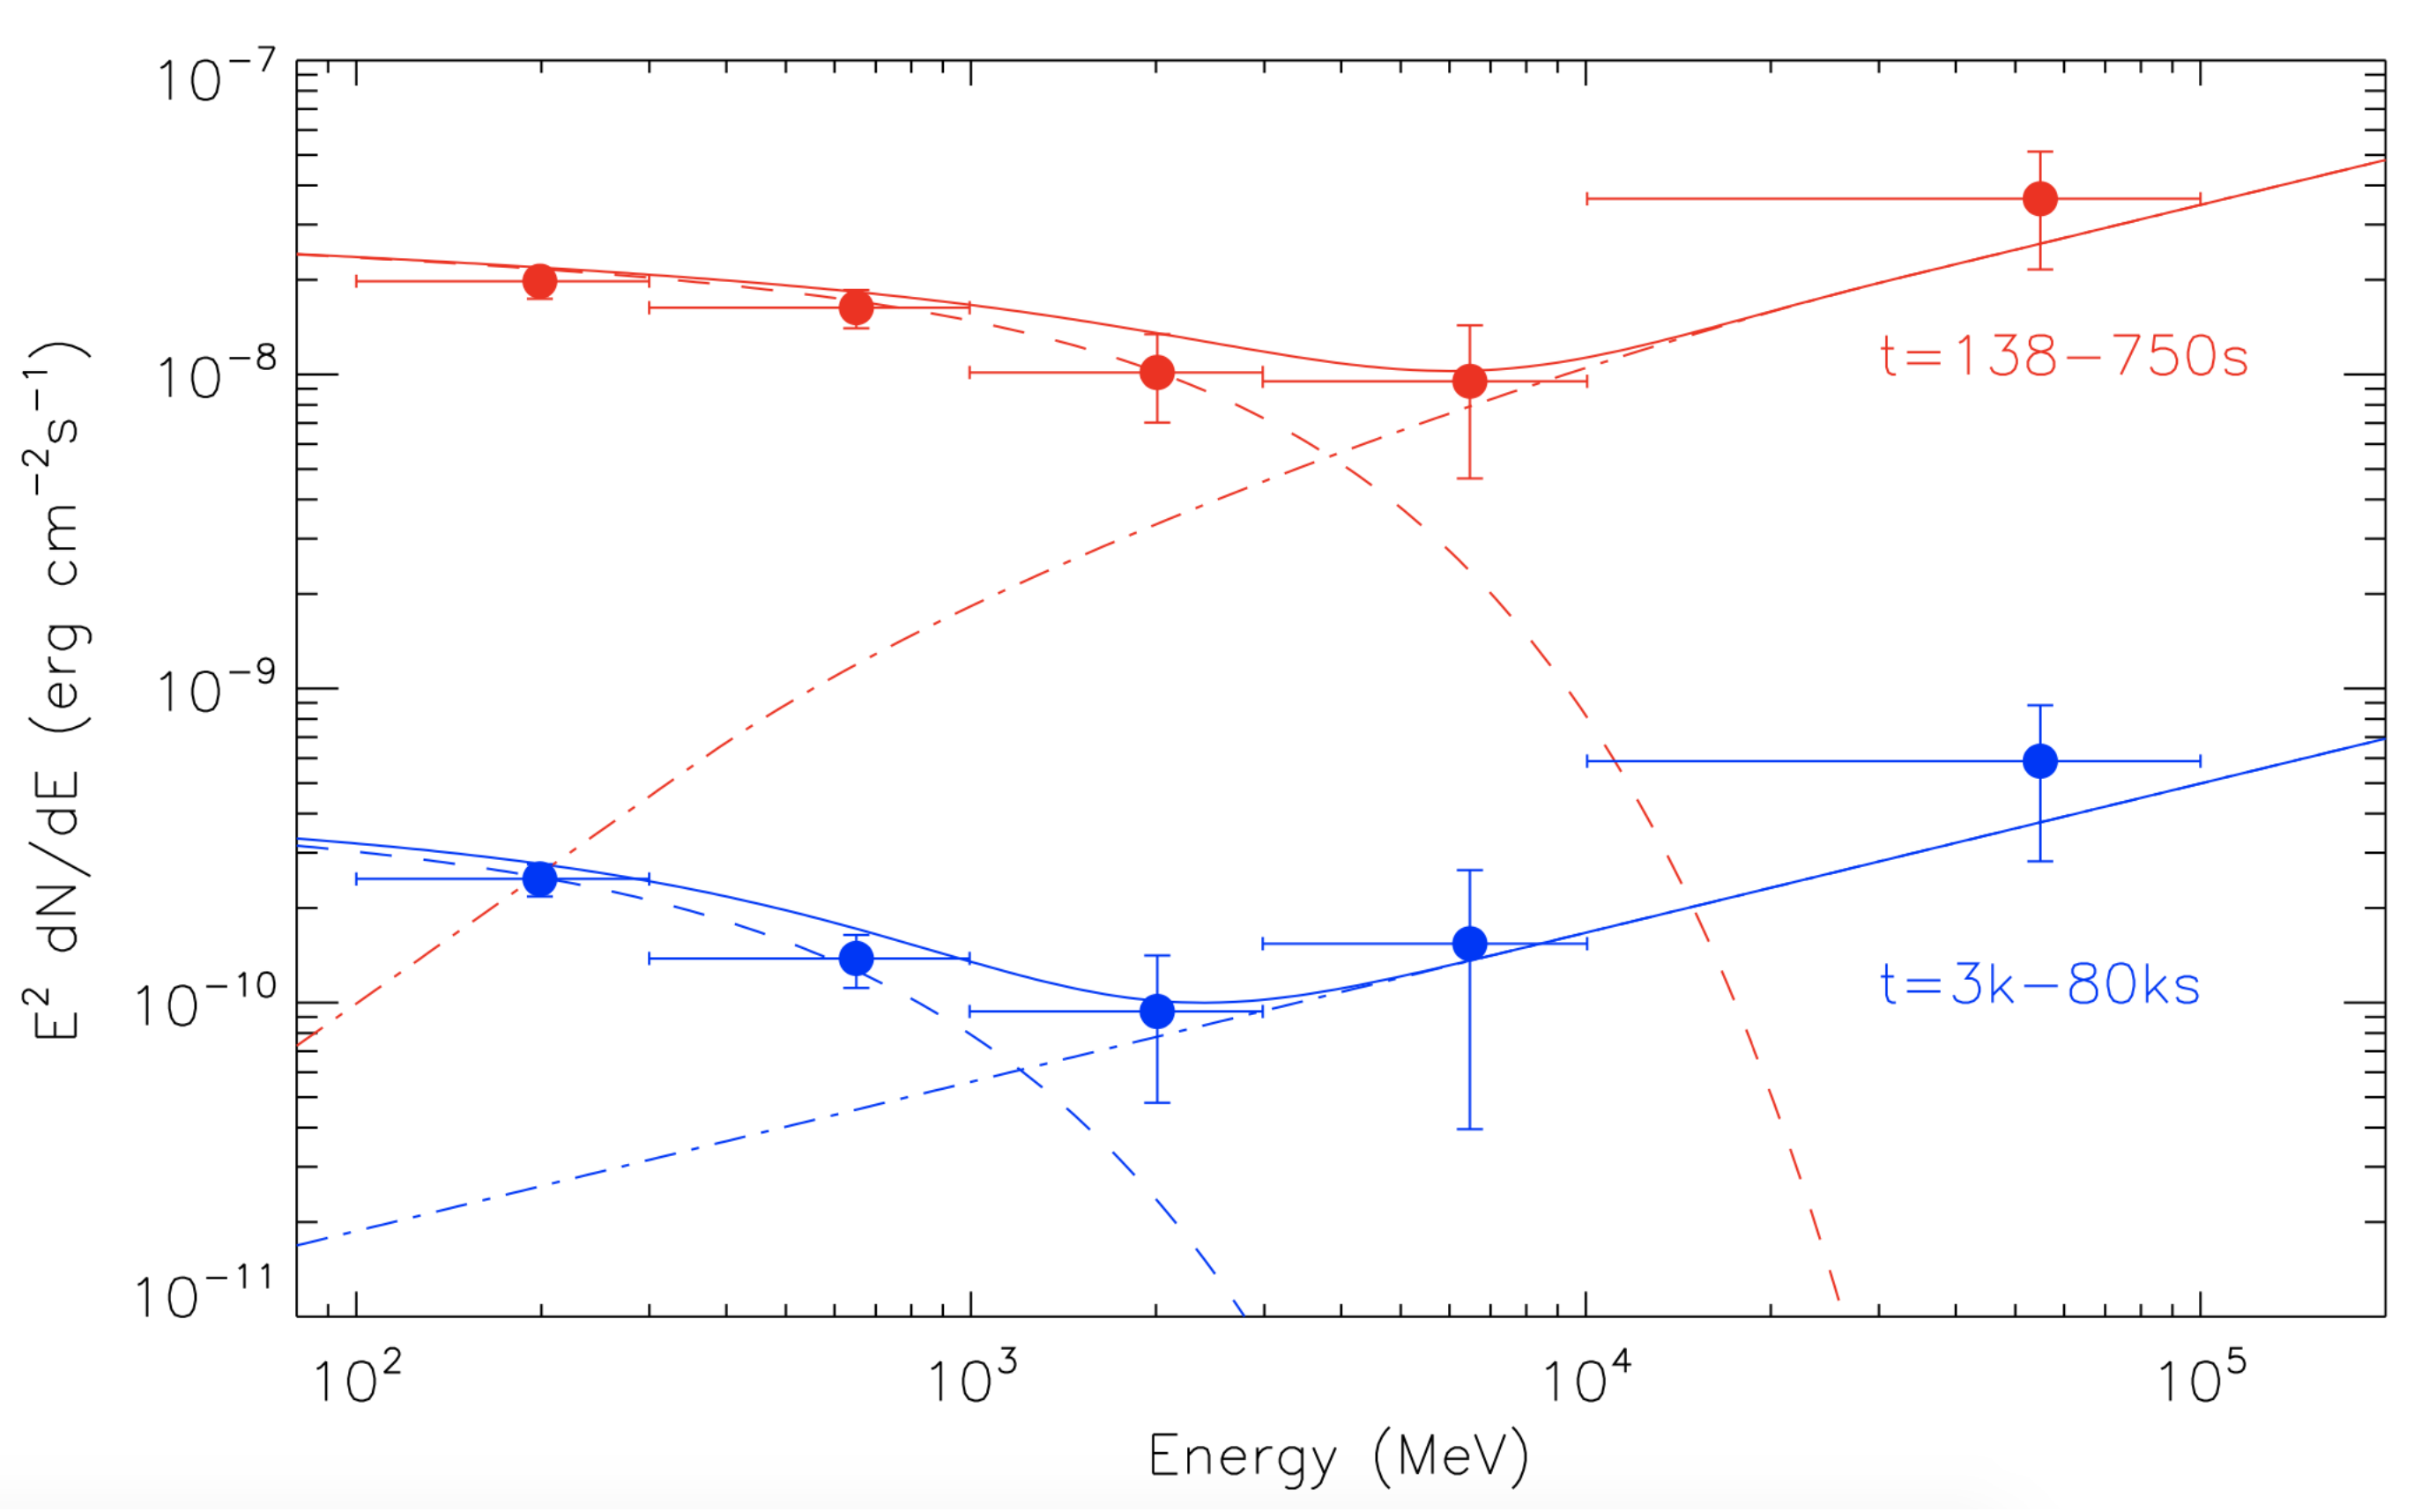
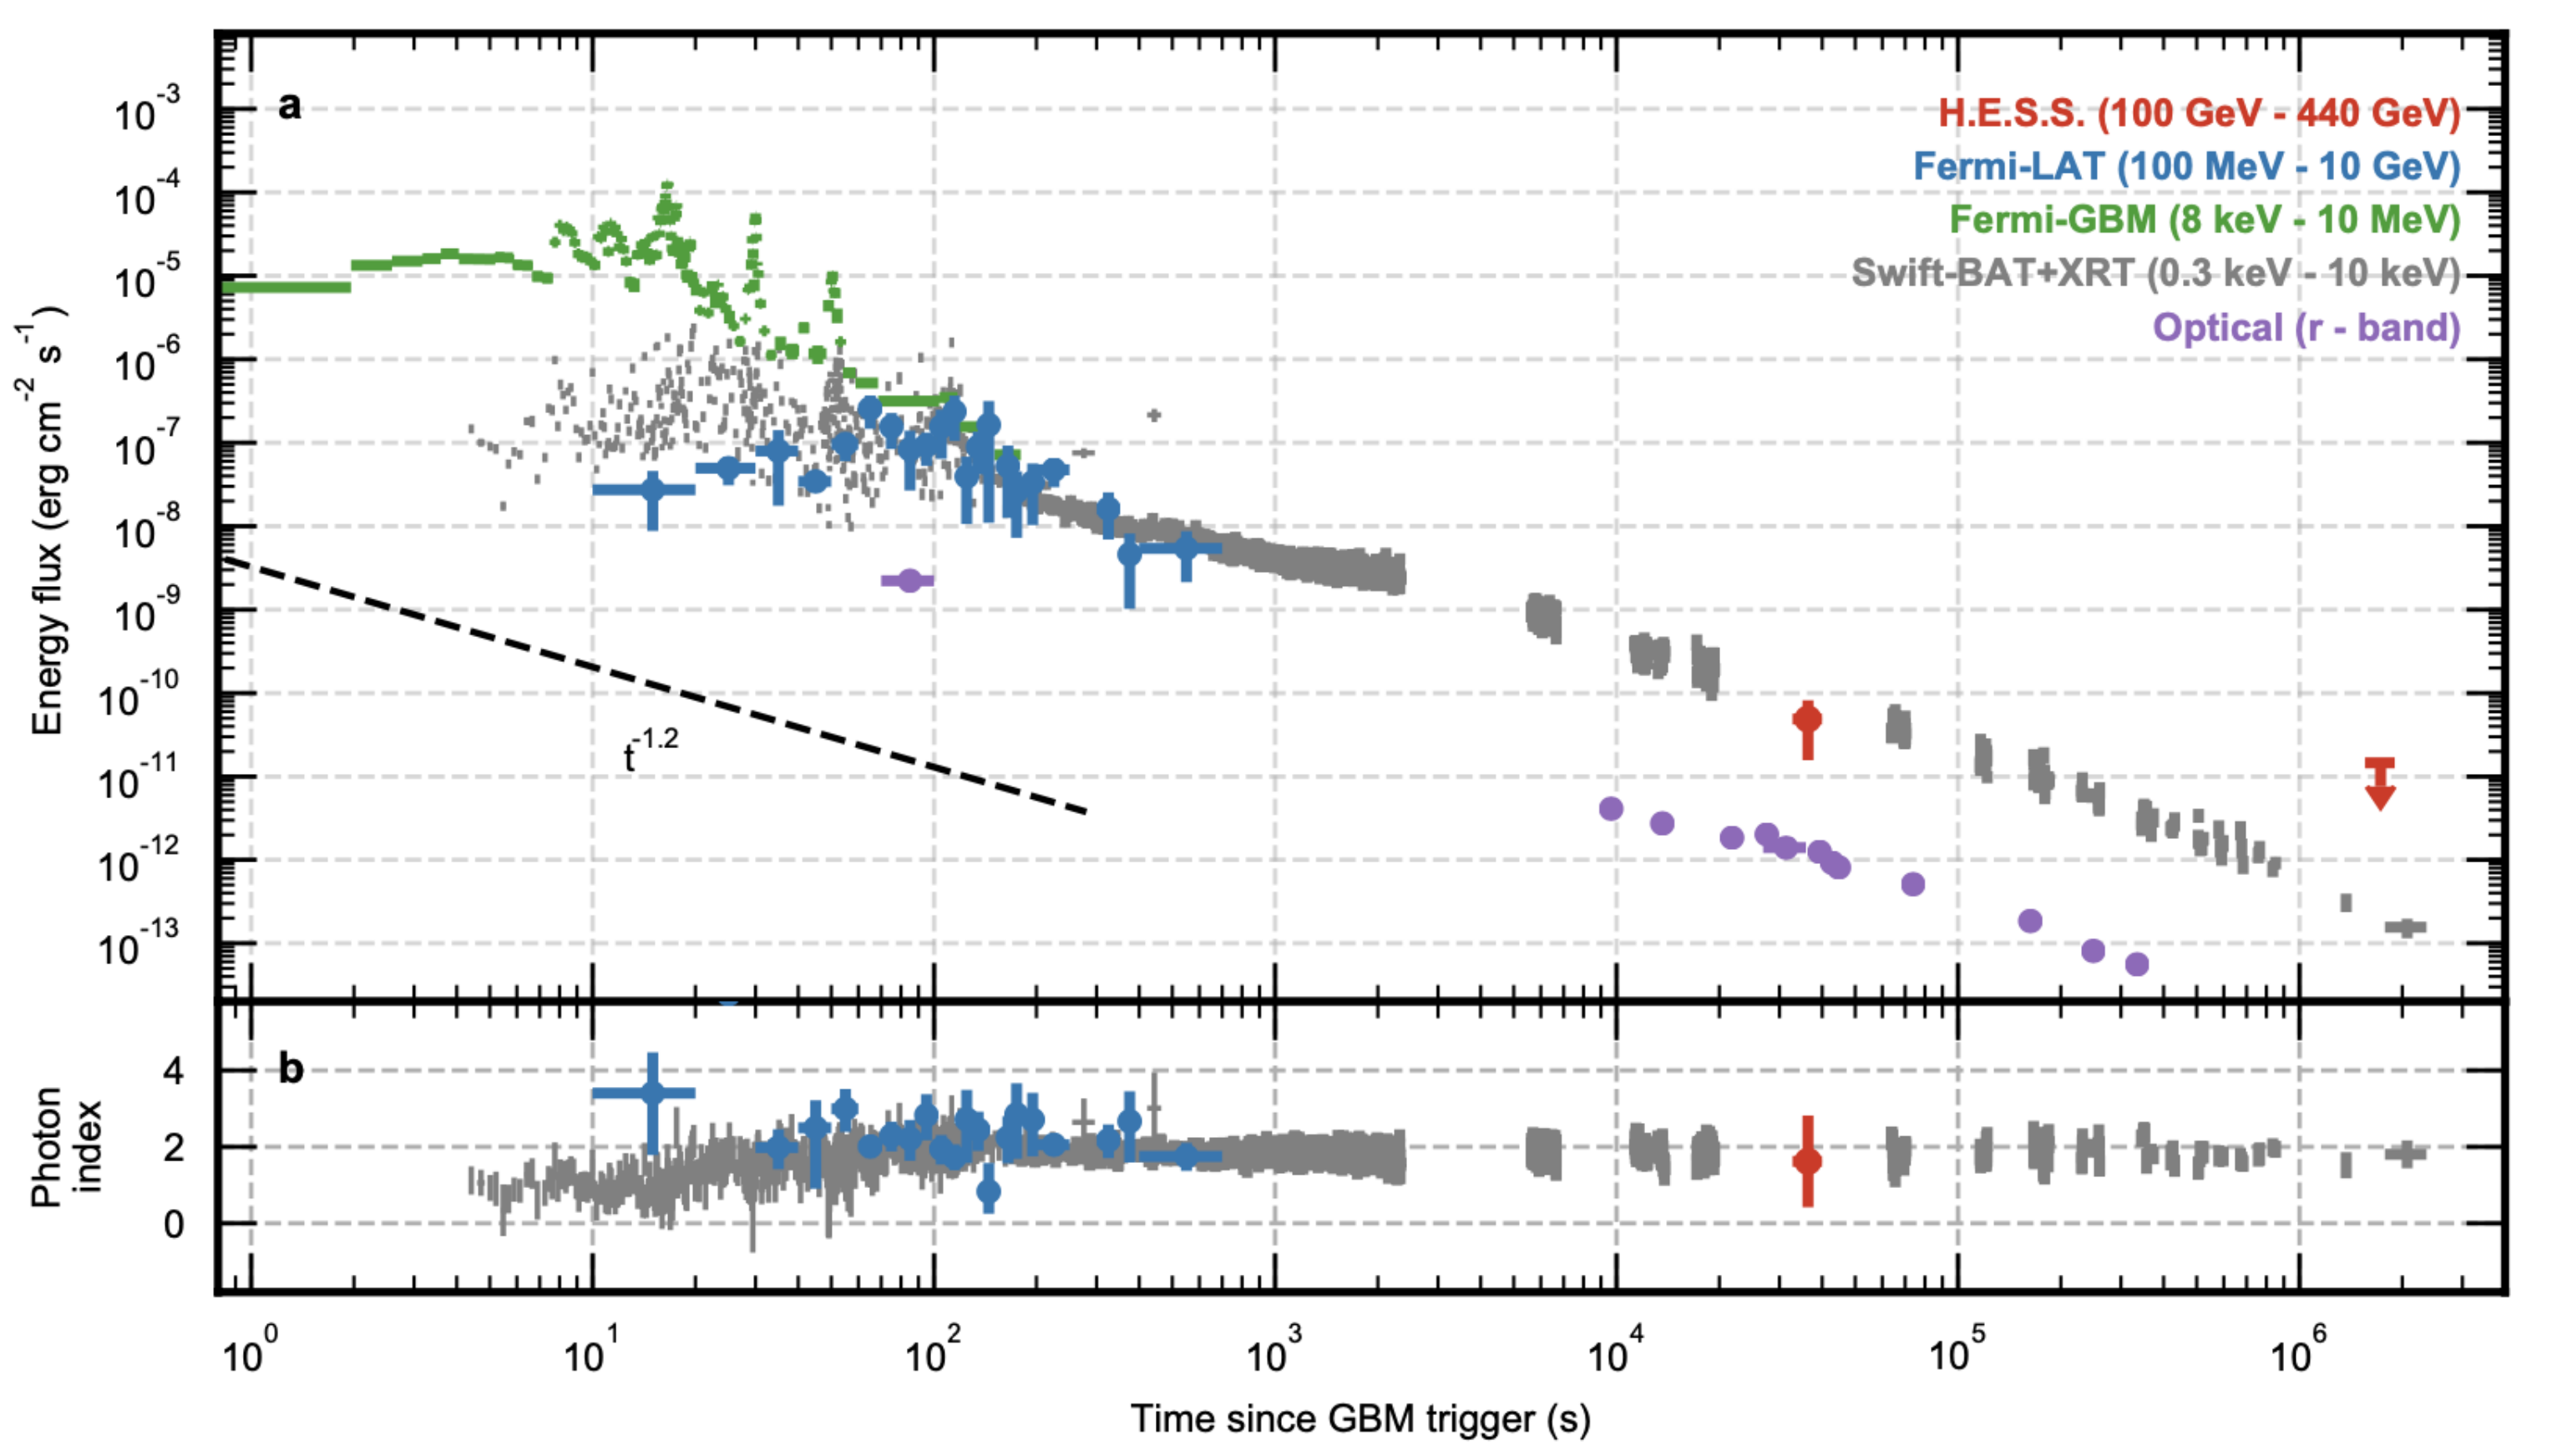
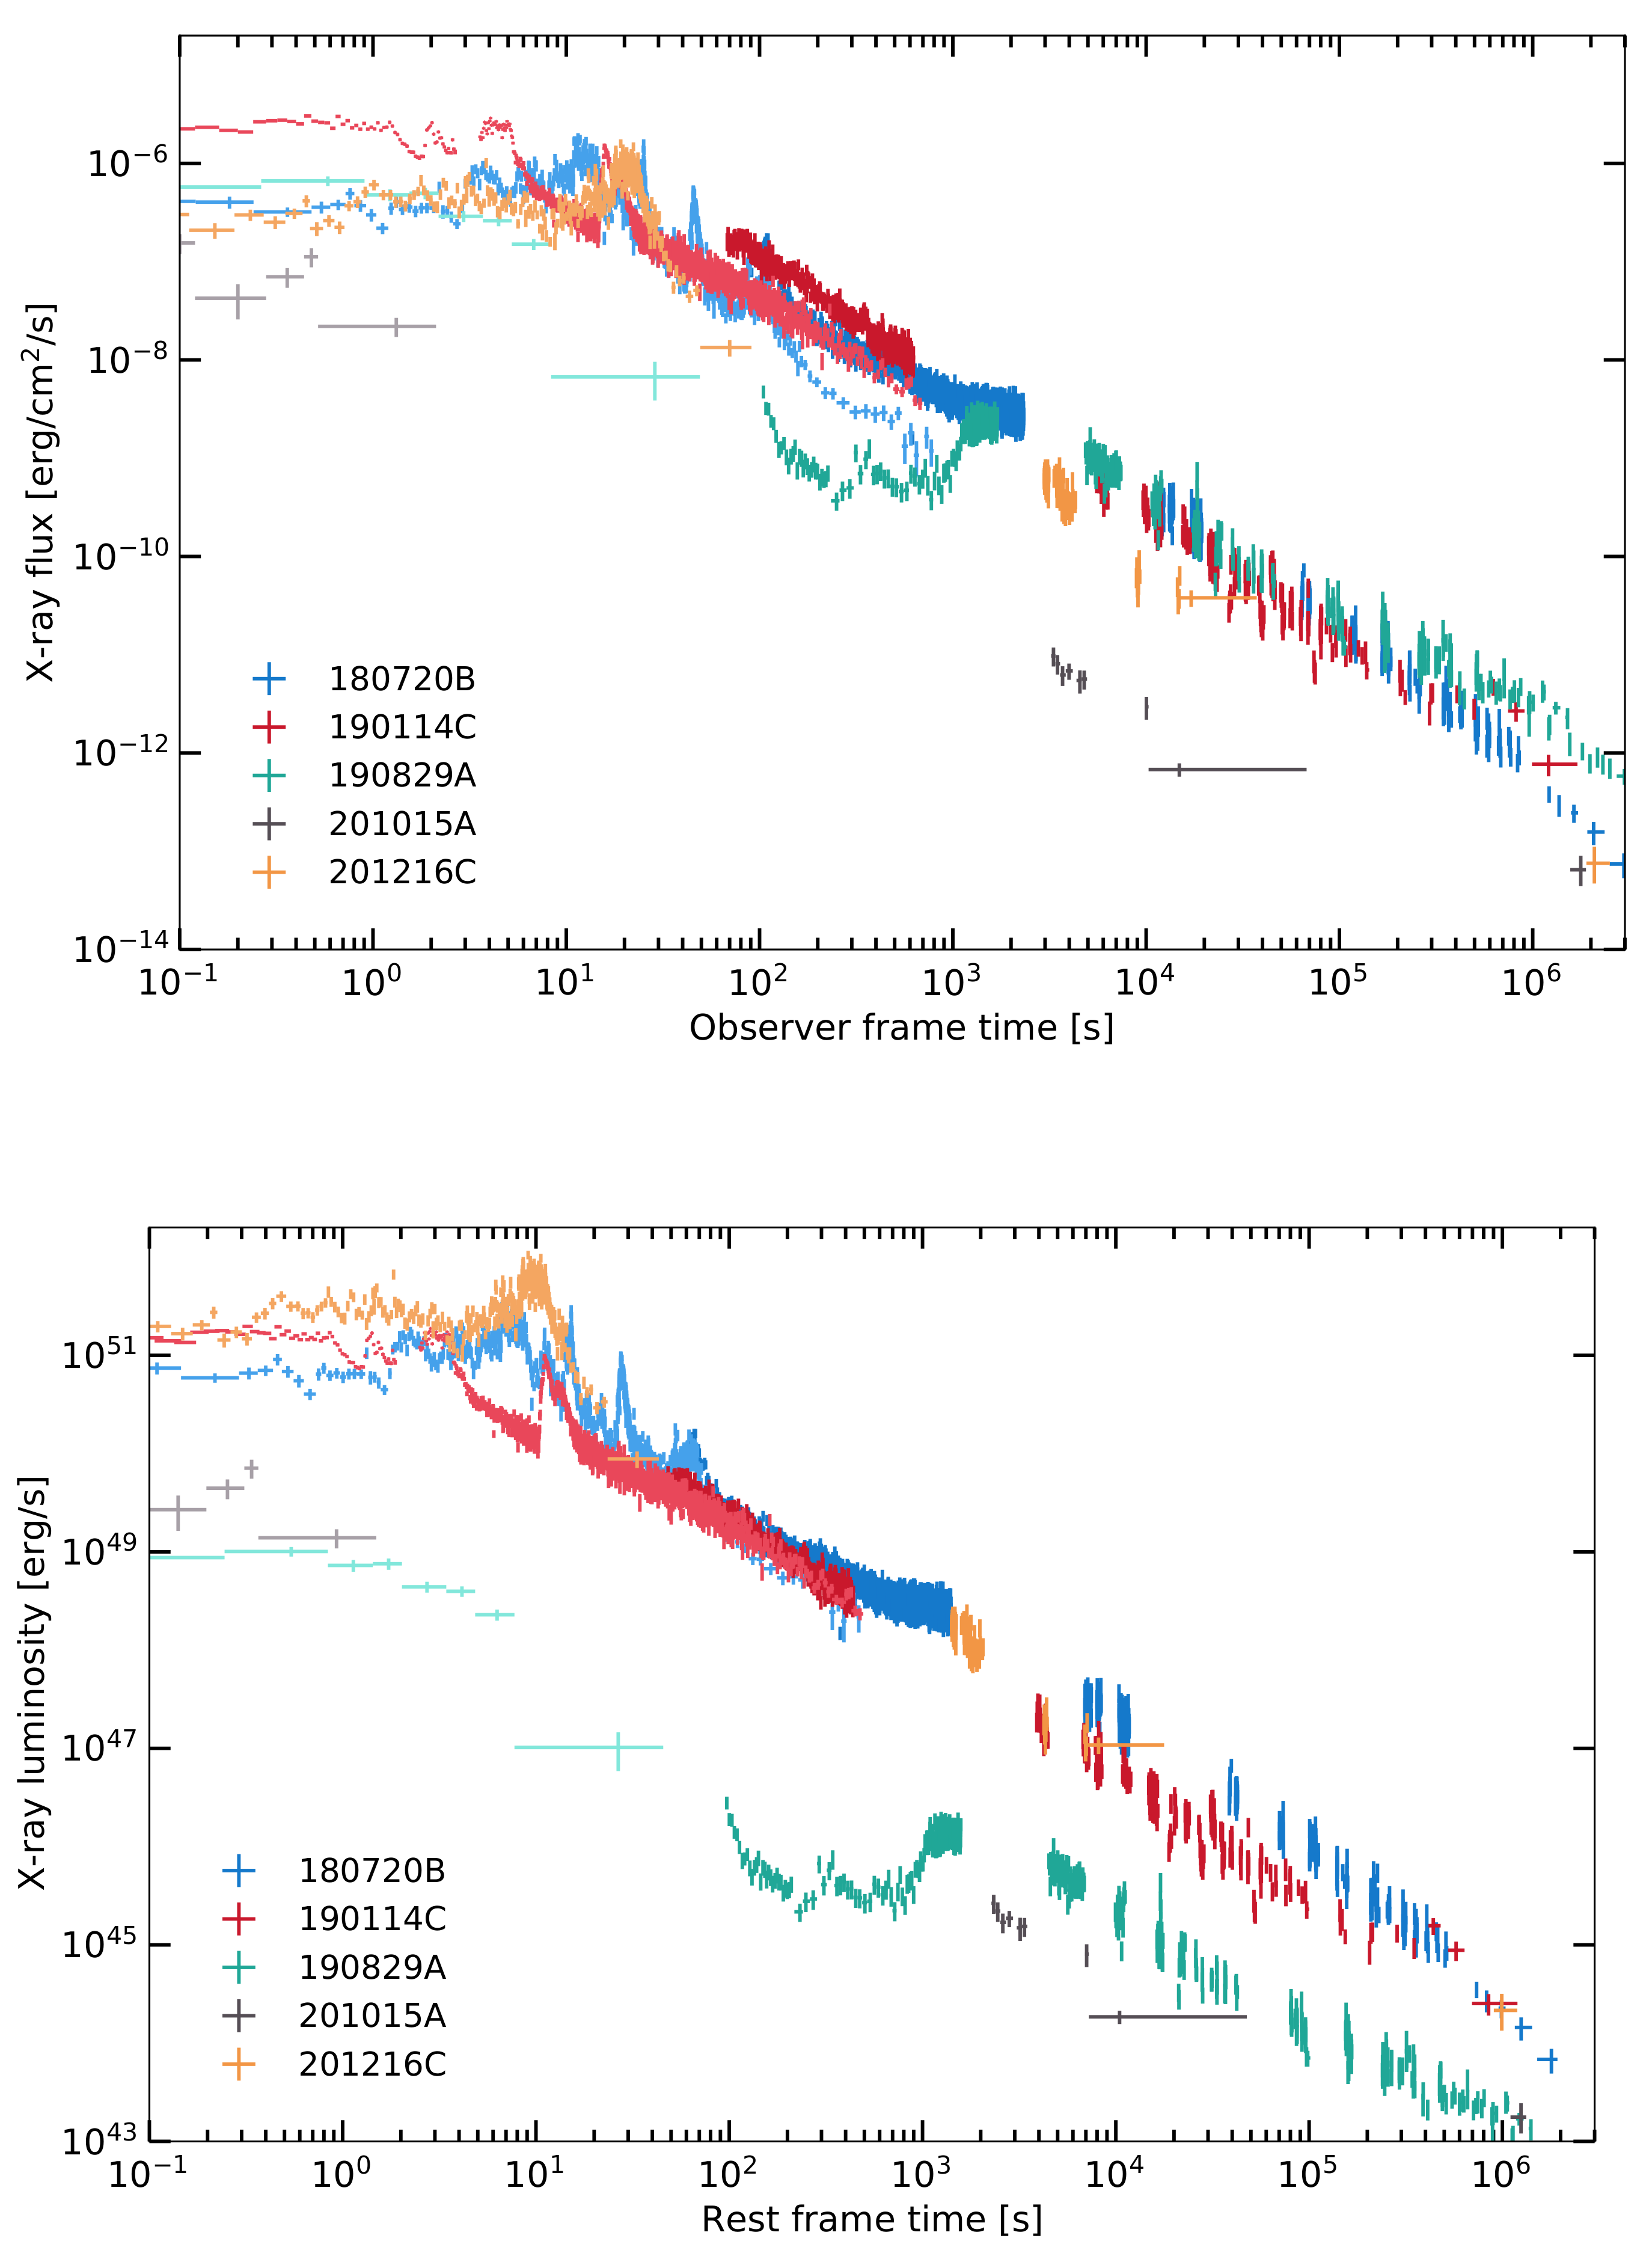
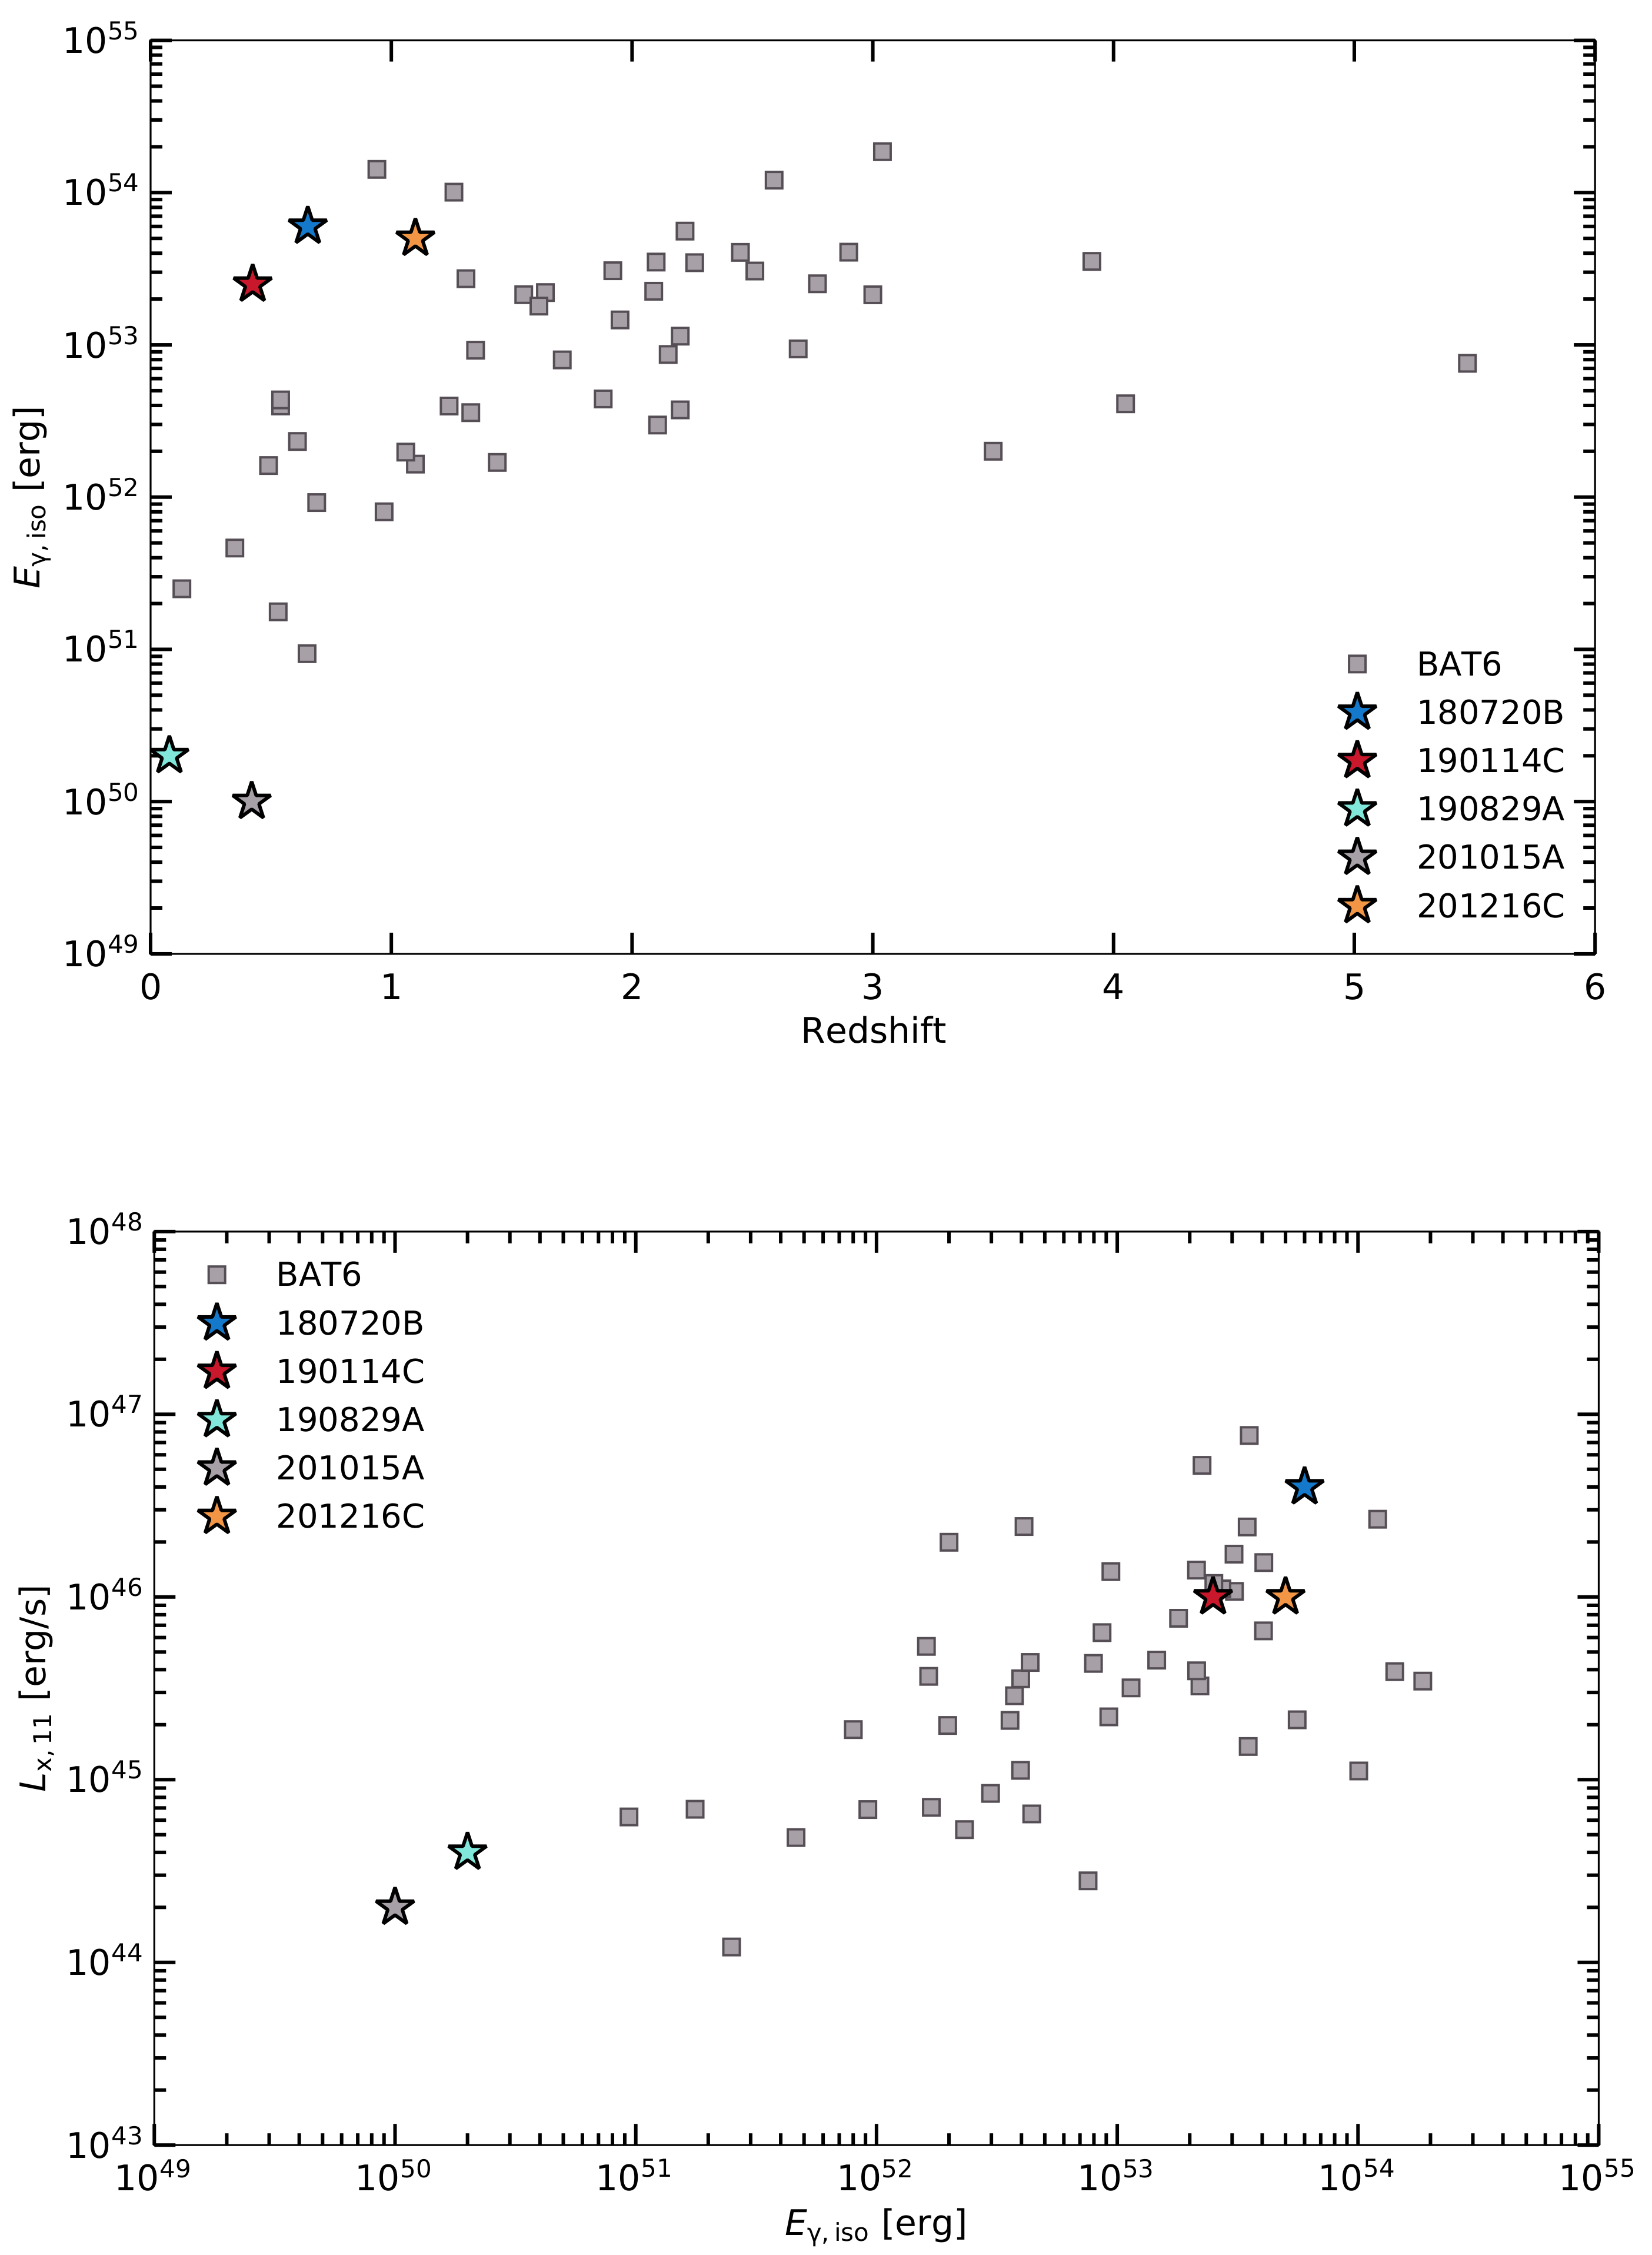
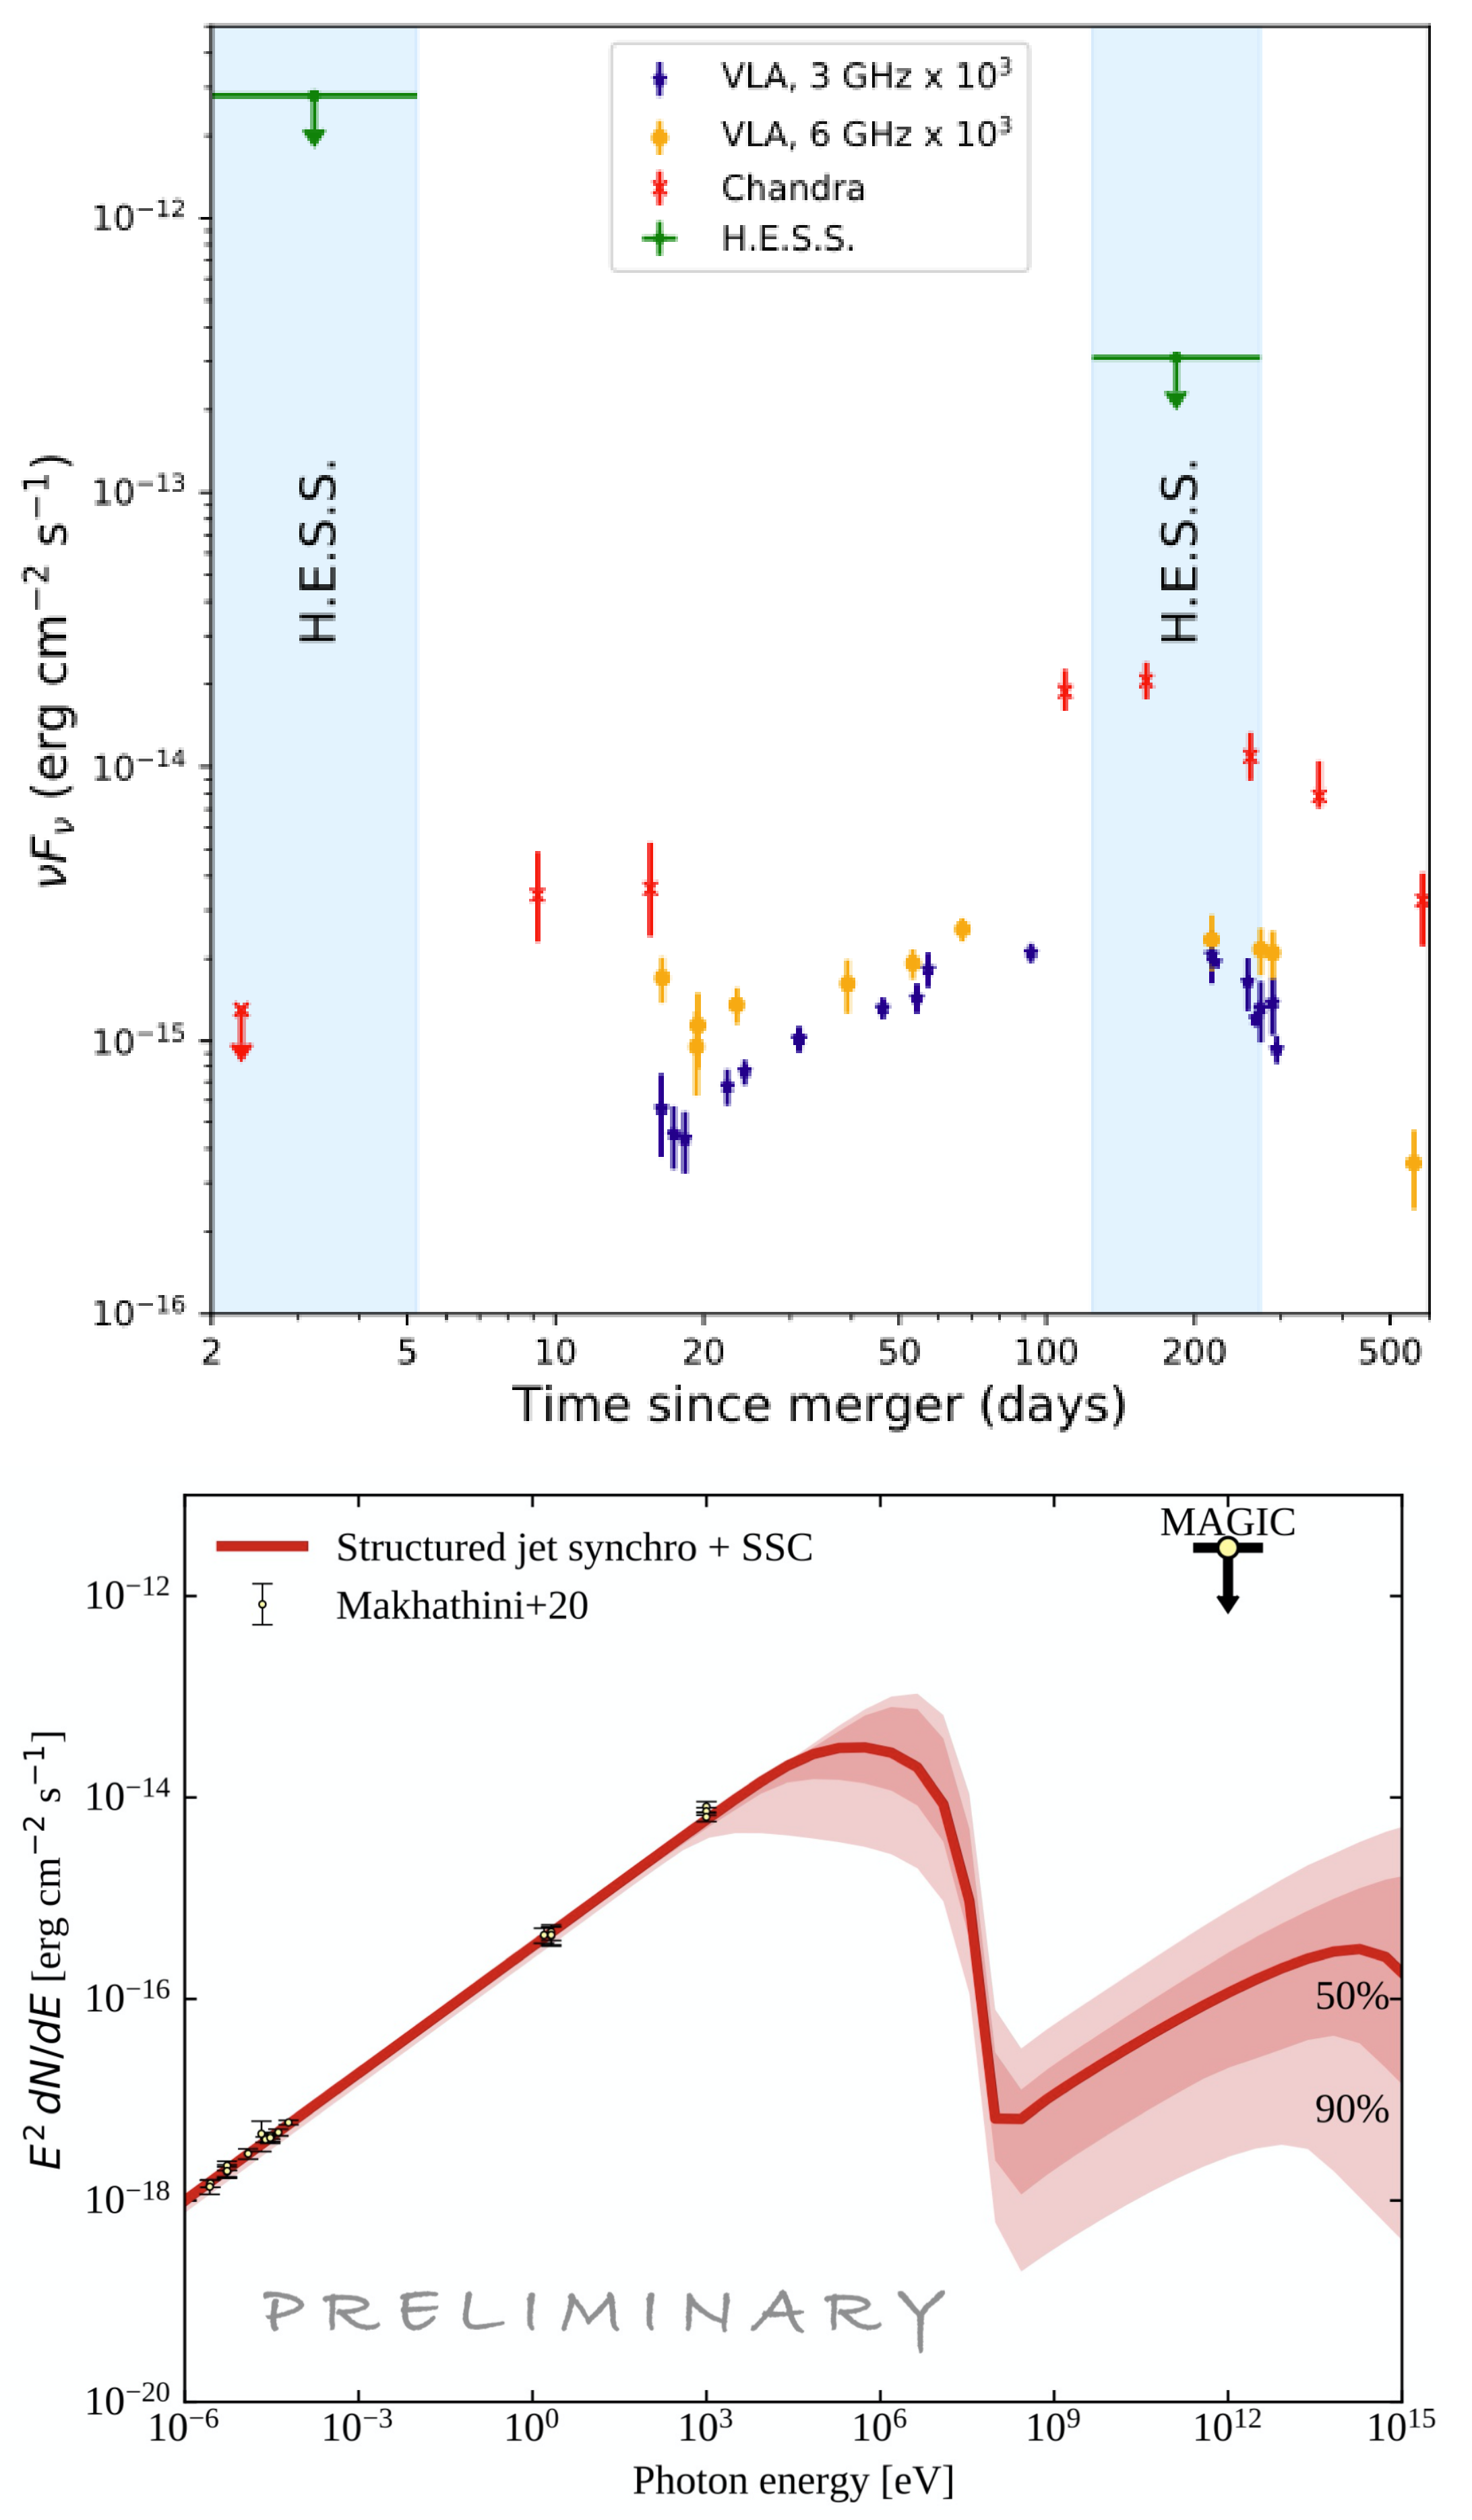
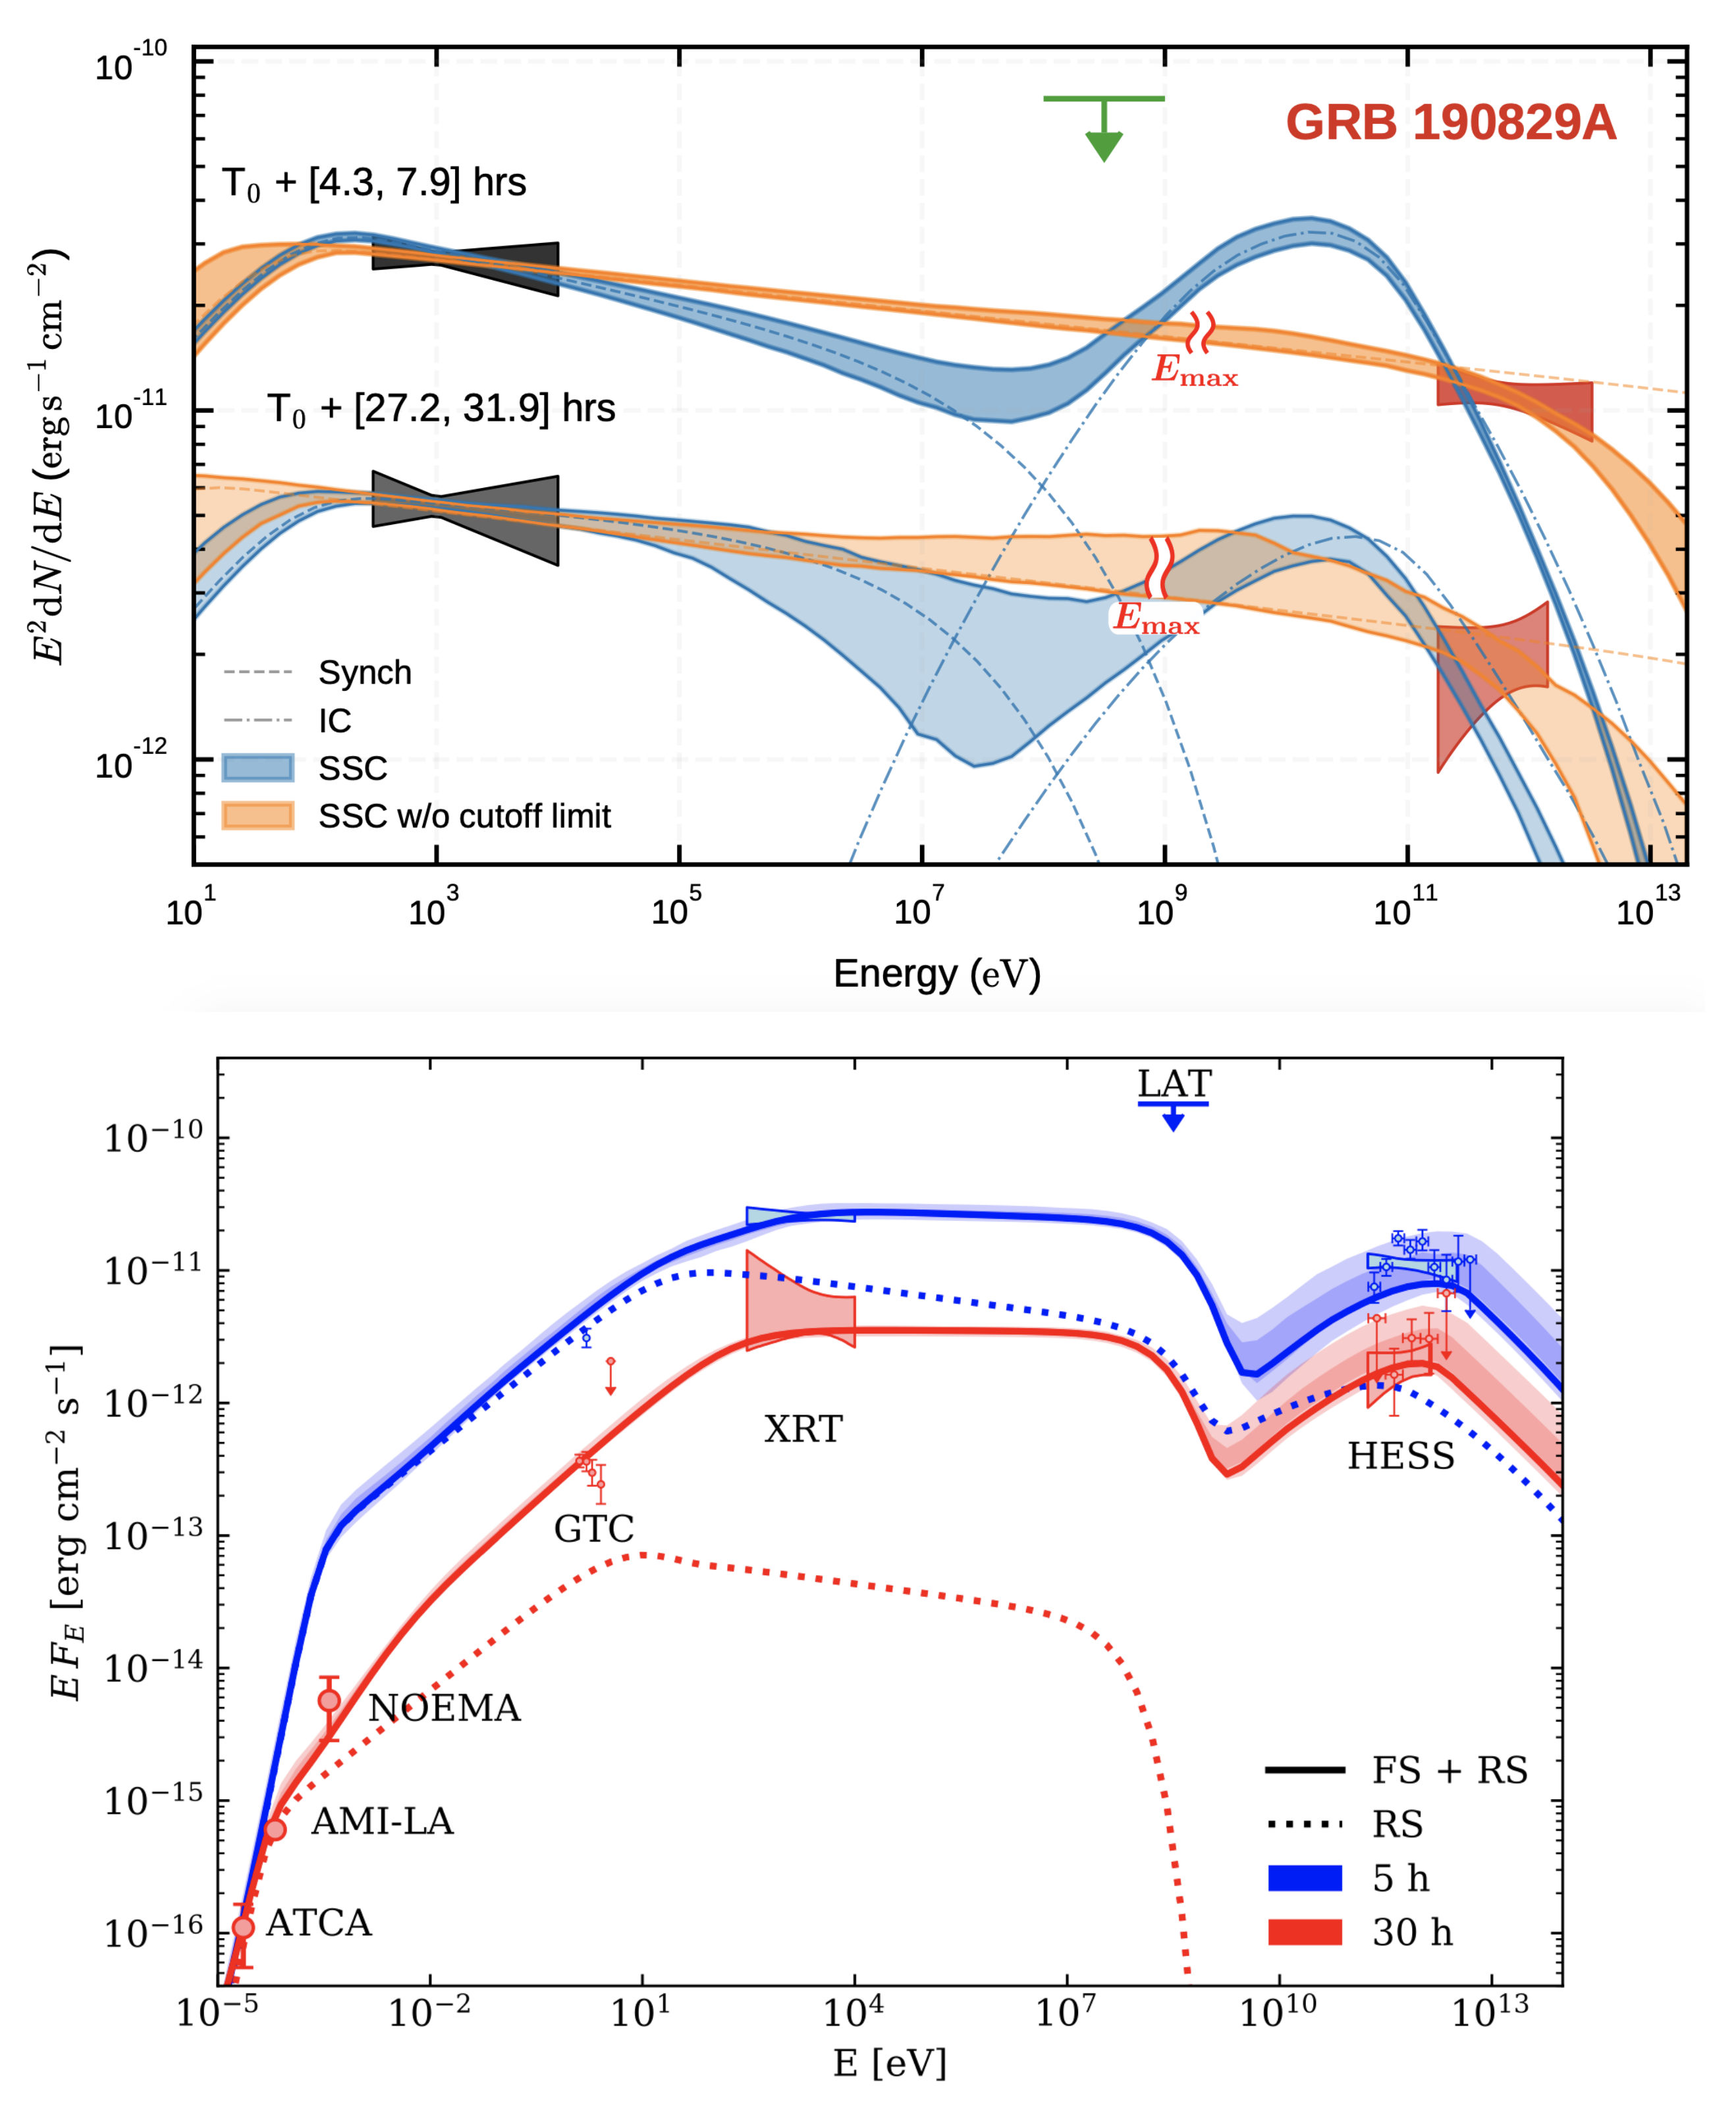
Table 1.
List of the GRBs detected by IACTs. The columns refer to the GRB name, redshift, duration () and isotropic-equivalent emitted energy of the prompt emission, XRT luminosity () integrated between 2–10 keV (rest frame) at 11 h after , the energy range of detected TeV photons, the initial and final time of VHE detection, and the name of the IACT that detected VHE radiation. For all GRBs the time of the VHE detection refers to BAT trigger, except for 190829A, for which the GBM trigger was adopted. For GRBs listed in the first four rows, the significance of the VHE detection was >, while for the last GRB in the table, the significance was . 10–1000 keV; 50–300 keV; 1– keV.
| Name | z | E | Energy | Time | IACT | ||
|---|---|---|---|---|---|---|---|
| s | erg | erg s | TeV | s | |||
| 180720B | 0.653 | 49 | 0.1–0.44 | (3.6–4.3) | H.E.S.S. | ||
| 190114C | 0.424 | 25 | 0.2–1 | 62–2454 | MAGIC | ||
| 190829A | 0.078 | 0.18–3.3 | (1.5–20) | H.E.S.S. | |||
| 201216C | 1.1 | 0.1 | 56– | MAGIC | |||
| 201015A | 0.42 | 10 | 0.14 | 33– | MAGIC |
Publisher’s Note: MDPI stays neutral with regard to jurisdictional claims in published maps and institutional affiliations. |
© 2021 by the author. Licensee MDPI, Basel, Switzerland. This article is an open access article distributed under the terms and conditions of the Creative Commons Attribution (CC BY) license (https://creativecommons.org/licenses/by/4.0/).
Share and Cite
MDPI and ACS Style
Nava, L. Gamma-ray Bursts at the Highest Energies. Universe 2021, 7, 503. https://0-doi-org.brum.beds.ac.uk/10.3390/universe7120503
AMA Style
Nava L. Gamma-ray Bursts at the Highest Energies. Universe. 2021; 7(12):503. https://0-doi-org.brum.beds.ac.uk/10.3390/universe7120503
Chicago/Turabian StyleNava, Lara. 2021. "Gamma-ray Bursts at the Highest Energies" Universe 7, no. 12: 503. https://0-doi-org.brum.beds.ac.uk/10.3390/universe7120503
Note that from the first issue of 2016, this journal uses article numbers instead of page numbers. See further details here.