
Scaling Properties of Galaxy Groups


1
INAF—Osservatorio di Astrofisica e Scienza dello Spazio di Bologna, via Piero Gobetti 93/3, 40129 Bologna, Italy
2
Center for Astrophysics|Harvard & Smithsonian, 60 Garden Street, Cambridge, MA 02138, USA
3
INFN, Sezione di Bologna, Viale Berti Pichat 6/2, 40127 Bologna, Italy
4
Department of Astrophysical Sciences, Princeton University, 4 Ivy Lane, Princeton, NJ 08544, USA
5
Department of Physics and Astronomy, University of Sussex, Falmer, Brighton BN1 9QH, UK
*
Author to whom correspondence should be addressed.
†
All authors contributed equally to this work.
Universe 2021, 7(5), 139; https://0-doi-org.brum.beds.ac.uk/10.3390/universe7050139
Submission received: 31 March 2021
/
Revised: 24 April 2021
/
Accepted: 28 April 2021
/
Published: 10 May 2021
(This article belongs to the Special Issue The Physical Properties of the Groups of Galaxies)
Abstract
:Galaxy groups and poor clusters are more common than rich clusters, and host the largest fraction of matter content in the Universe. Hence, their studies are key to understand the gravitational and thermal evolution of the bulk of the cosmic matter. Moreover, because of their shallower gravitational potential, galaxy groups are systems where non-gravitational processes (e.g., cooling, AGN feedback, star formation) are expected to have a higher impact on the distribution of baryons, and on the general physical properties, than in more massive objects, inducing systematic departures from the expected scaling relations. Despite their paramount importance from the astrophysical and cosmological point of view, the challenges in their detection have limited the studies of galaxy groups. Upcoming large surveys will change this picture, reassigning to galaxy groups their central role in studying the structure formation and evolution in the Universe, and in measuring the cosmic baryonic content. Here, we review the recent literature on various scaling relations between X-ray and optical properties of these systems, focusing on the observational measurements, and the progress in our understanding of the deviations from the self-similar expectations on groups’ scales. We discuss some of the sources of these deviations, and how feedback from supernovae and/or AGNs impacts the general properties and the reconstructed scaling laws. Finally, we discuss future prospects in the study of galaxy groups.
1. Introduction
Following the hierarchical scenario of structure formation, galaxy systems form through episodic mergers of small mass units. The less massive ones (often referred as groups) are the building blocks for the most massive ones (clusters), and trace the filamentary components of the large-scale structure (e.g., Eke et al. [1]). However, the distinction between groups and clusters is quite loose and no universal definition exists in the literature. Also, because the halo mass function is continuous, a naive starting point would be to not single out the low-mass end objects. Nonetheless, these poor systems have some notable differences (e.g., lack of dominance of the gas mass over the stellar/galactic component; Giodini et al. [2]) with respect to their more massive counterpart and they cannot be simply considered their scaled-down versions.
A conventional “rule of thumb” definition is to label systems of less than 50 galaxies as groups and above as clusters. More in general, galaxy groups have been broadly classified into three main classes based on their optical and physical characteristics: poor/loose groups, compact groups, and fossil groups (e.g., Eigenthaler and Zeilinger [3]). Poor/loose groups are aggregate of galaxies with a space density of ∼10 Mpc (e.g., Nolthenius and White [4]). Compact groups are small and relatively isolated systems of typically 4–10 galaxies with a space density of ∼10 Mpc (e.g., Hickson [5]). Fossil groups are objects dominated by a single bright elliptical galaxy (a formal definition is provided in Jones et al. [6]). Early studies (e.g., Helsdon and Ponman [7]) showed that subsamples of loose and compact groups share the same scaling relations. Thus, in this review, we do not make distinction between poor/loose and compact groups, and hereafter we simply refer to them as galaxy groups. The properties of fossil groups are instead discussed in the companion review by Aguerri et al. However, since the optical properties are not always available, a threshold of M∼10M, corresponding to a temperature of 2–3 keV, is also often used to classify these systems. We will show later that this threshold roughly corresponds to the temperature for which there is a significant change in the X-ray emissivity.
Despite the crucial role played by groups in cosmic structure formation and evolution, they have received less attention compared to massive clusters. One of the reasons is that typical groups contain only a few bright galaxies in their inner regions, making very difficult to detect them in optical with a relatively good confidence. A much easier method of detecting them is to study the X-ray emission from the hot intragroup medium (IGrM). The detection of hot plasma carries witness that galaxy groups (and clusters) are not simple conglomerate of galaxies put together by projection effects, but real physical systems which are undergoing some degree of virialization. Galaxy groups often show lower and flatter X-ray surface brightness than clusters (e.g., Ponman et al. [8], Sanderson et al. [9]). Therefore, the physical properties of the gas derived for galaxy groups are presumably less robust than the properties derived for galaxy clusters. Nonetheless, they represent a more common environment because the mass function of virialized systems, which describes the number density of clusters above a threshold mass M, is higher at lower masses (with a factor of ∼30/210/1500 more objects in the mass range M M than in M, and M at ; see, e.g., [10]). Hence, the detection and characterization of galaxy groups is especially important for astrophysical and cosmological studies.
1.1. Galaxy Groups and Astrophysics
Galaxy groups cover the intermediate mass range between large elliptical galaxies and galaxy clusters and contain the bulk of all galaxies and baryonic matter in the local Universe (e.g., Tully [11], Fukugita et al. [12], Eke et al. [1]). Because of that, they are crucial for understanding the effects of the local environment on galaxy formation and evolution processes. Moreover, the feedback from supernovae (SNe) and supermassive black holes (SMBHs) is expected to significantly alter the properties of these systems being the energy input associated with these sources comparable to the binding energies of groups (e.g., Brighenti and Mathews [13], McCarthy et al. [14], Gaspari et al. [15]). However, the relative contributions of the different feedback processes are still a matter of debate and it will constitute a major subject of research for the next decade. These factors make galaxy groups great laboratories to understand the complex baryonic physics involved, and to study the differences with their massive counterpart. For instance, we know that the fraction of strong cool-cores (CC; i.e., systems with a central cooling time 1 Gyr, as described in Hudson et al. [16]), weak cool-cores (1 7.7 Gyr), and non-cool-cores (NCC; 7.7 Gyr) objects at the group scale are similar to those in galaxy clusters (Bharadwaj et al. [17]). However, O’Sullivan et al. [18] found that the CC fraction increases dramatically when the samples are restricted to low-temperature systems (i.e., kT < 1.5 keV) showing a correlation between system temperature and CC status. Bharadwaj et al. [17] also found that brightest group galaxies have a higher stellar mass than brightest cluster galaxies, suggesting that there is less gas available to feed the SMBHs. Recent results suggest that the IGrM and intracluster medium (ICM) are also providing a source of gas which feeds and grows the central SMBHs, in particular leading to novel scaling relations between the SMBH mass and the X-ray properties of their host gaseous halos (e.g., Bogdán et al. [19], Gaspari et al. [20], Lakhchaura et al. [21]). These findings imply an interplay between the feedback mechanisms connected with the SMBHs and the macro-scale halos, which could explain some features of cosmological simulations driving a relative break of the L–T and L–M relations at low temperatures (e.g., McCarthy et al. [14], Sijacki et al. [22], Puchwein et al. [23], Fabjan et al. [24], Le Brun et al. [25]). This deviation is often attributed to active galactic nucleus (AGN) feedback (e.g., Planelles et al. [26], Gaspari et al. [27], Truong et al. [28]).
The properties described above have an important effect on the correlation between different physical quantities. For instance, it is well established that CC and NCC objects populate different regions of the X-ray luminosity space of any scaling relations (e.g., Markevitch [29], Pratt et al. [30], Mittal et al. [31], Bharadwaj et al. [32], Mantz et al. [33], Lovisari et al. [34]). Therefore, a change in the fraction of CC/NCC systems as a function of the temperature (mass) will have an impact to the slope, normalization, and scatter of the observed scaling relations. Hence, it is crucial to have a full coverage for the whole sample to minimize the systematic errors due to the incompleteness. In fact, if all the missing objects happen to belong to one of the subsamples (e.g., NCC), the normalization (and the scatter) of the studied scaling relations will be wrong. Moreover, the CC/NCC fraction of systems in a sample depends on the selection function and may not be representative of the underlying population. For instance, X-ray selected samples are known to be biased toward centrally peaked and relaxed systems, in particular in the low-mass regime (Eckert et al. [35]). In fact, recent results by O’Sullivan et al. [18], who analyzed a sample of optically selected groups, show that ∼20% of X-ray bright groups (probably the most disturbed ones, or with no concentrated CC) in the local Universe may have been missed. Thus, the scaling relations of galaxy groups (and clusters) are the result of the various processes that govern the formation and evolution of these systems making them ideal targets for studying the effect of the interplay between galaxy evolution, the development of the IGrM, and feedback.
1.2. Galaxy Groups and Cosmology
Clusters of galaxies have proven to be remarkably effective probes of cosmology (e.g., [36,37,38,39,40,41,42,43,44,45,46]). However, since galaxy groups represent a large fraction of the number density of virialized systems, their impact might be relevant (in particular, on the reconstruction of halo mass function). For instance, recent results of the Dark Energy Survey (DES) collaboration show that the – posteriors have a 5.6 tension with Planck CMB results, and a 2.4 tension with galaxy clustering and cosmic shear results [47]. The cause of this tension is thought to reside at the low-mass (low richness) end of the cluster population, specifically, clusters with a richness of (corresponding to ∼10 M). The removal of low richness systems from the analysis significantly reduces the tension with comparative cosmological probes. However, various tests undertaken in Abbott et al. [48] suggest that the discrepancy is probably due to the modeling of the weak-lensing signal rather than the group and cluster abundance. The mass calibration for the DESY1 analysis is based upon a stacked weak-lensing analysis, through application of the weak-lensing–richness relation [49]. This relation is derived over the full richness range, which would not account for any deviations at the low-mass end. Furthermore, since the mass analysis relies on stacked quantities, information on scatter in mass with richness is lost and must be informed from external relations. In the case of the DESY1 analysis, the mass scatter information is inferred from the temperature–richness relation using X-ray data [50]. This scatter is assumed constant with richness, which again, could evolve as a function of richness. The investigation of these effects will become of critical importance as the low-mass end of the mass scales are increasingly probed by future surveys (e.g., those constructed from the Legacy Survey of Space and Time undertaken by the Vera C. Rubin Observatory).
Excluding low-mass systems significantly reduces the cosmological parameter constraints. Thus, despite the important complications present at the group scale, it is becoming generally appreciated that galaxy groups should be included in the cosmological analysis. To use them to constrain the cosmological parameters we need a good knowledge of the selection function to properly correct for the incompleteness, otherwise studies employing the cluster mass function may find lower and/or values than the true values. This scenario is supported by the finding of Schellenberger and Reiprich [44], who showed how the increasing incompleteness of parent samples in the low-mass regime together with a steeper L–M relation observed for groups, can lead to biased cosmological parameters. It is worth noticing that if a large fraction of galaxy systems is missed, then the tension between cluster counts and primary CMB cosmological constraints may become less severe.
Most of the upcoming large surveys will push the measurements down to the low-mass regime. Thus, to fully exploit the future datasets to constrain the cosmological parameters, we need to properly characterize the properties of galaxy groups and the differences with galaxy clusters, accounting for the different selection effects, and estimating the amplitude of the various biases.
1.3. This Review
In this work, we present an overview of the most recent studies on scaling relations between several integrated observed quantities of galaxy groups, and complement/update the previous reviews in the field by, e.g., Mulchaey [51] and Sun [52]. The review is organized as follows. In Section 2, we derive the self-similar X-ray scaling relations and overview the observed deviations. In Section 3, we discuss the relations between X-ray and optical properties. In Section 4, we discuss the relation between the SMBH mass and the global group quantities. In Section 5, we shortly discuss the most relevant upcoming missions and their expected contribution to the field. In Section 6 we provide our final remarks.
2. X-ray Scaling Relations
2.1. Theoretical Expectations
The X-ray scaling relations for galaxy systems were derived by Kaiser [53], based on the simple assumption that the thermodynamic properties of the ICM are only determined by gravity (i.e., gas just follow the dark matter collapse). Since gravity is scale free, this model predicts that objects of different sizes are the scaled version of each other. For that reason, this model is often referred as self-similar, and the derivation of the predicted relations has been extensively covered in the literature (e.g., Kitayama and Suto [54], Bryan and Norman [55], Voit [56], Maughan et al. [57], Borgani et al. [58], Böhringer et al. [59], Ettori [60], Giodini et al. [61], Maughan [62], Ettori [63], Ettori et al. [64]). Here, we only provide a brief review of the standard derivation of the self-similar scaling relations for massive systems, and then extend them, when necessary, to the low-mass regime where gas physics is playing a significant role.
In the self-similar scenario, two galaxy systems which have formed at the same time have the same mean density. Hence,
where M is the mass contained within the radius R, encompassing a mean density times the critical density of the Universe , so that M. The critical density of the Universe scales with redshift as =E, where E = H/H describes the evolution of the Hubble parameter with redshift z.
During the gravitational collapse, the gas density increases, and a shock propagates outward from the cluster center and heats the gas. After the passage of the shock, IGrM and ICM can be considered in hydrostatic equilibrium, so the temperature T provides an estimate of the gravitational potential well (i.e., T GM/R), and therefore of the total mass of the cluster:
In the self-similar scenario, where the gas fraction, f, of galaxy groups and clusters is universal, one expects for the total gas mass, M, a similar dependence on the gas temperature: M.
The hot gas in galaxy systems is typically described as an optically thin plasma in collisional ionisation equilibrium. Its X-ray emissivity (i.e., the energy emitted per time and volume) is equal to
where and are the number densities of electrons and protons, respectively, that are related to the gas mass density through the relation =, is the mean molecular weight (∼0.6 for a plasma with solar abundance), is the proton mass, and is the cooling function which depends on the mechanism of the emission1 and on the considered energy window. At high temperatures (i.e., kT > 3 keV) the main mechanism of emission is thermal bremsstrahlung and the cooling function in the full energy band mainly depends only on T (i.e., T). Thus, for sufficiently massive systems the bolometric X-ray luminosity (i.e., 0.01–100 keV band) is given by
with the last scaling obtained assuming a constant gas fraction as predicted by the self-similar scenario. By combining Equations (2) and (4) one obtains the well-known relation between bolometric luminosity and total mass (i.e., L M).
In the literature the X-ray luminosities are also often provided in soft energy bands (e.g., 0.1–2.4 or 0.5–2 keV), more representative of the bandpass covered by current (and past) X-ray facilities used for the study of groups and clusters. In Figure 1 (left panel), we show that for massive systems with typical cluster abundance the X-ray emissivity in soft band is almost independent of the system temperature (e.g., for Z = 0.3Z the change in between 3 and 10 keV plasmas in the 0.5–2 keV band is <10% for given emission measure), so that LT, and hence using Equation (2), L M.
However, the gas fraction is not constant, with a difference of almost a factor of two between groups and clusters (e.g., Vikhlinin et al. [72], Gonzalez et al. [73], Gastaldello et al. [74], Pratt et al. [30], Dai et al. [75], Gonzalez et al. [76], Lovisari et al. [77], Eckert et al. [78]; see also the companion reviews by Eckert et al. and Oppenheimer et al.). Moreover, at low temperatures, line cooling becomes very important, and the emissivity (both in soft and bolometric bands) becomes strongly abundance (Z) and temperature dependent. In Figure 1 (left and middle panels) we show the dependence of the emissivity on the temperature and metallicity for widely used energy bands for scaling relations, clearly showing that a simple scaling cannot be derived. In Table 1, we provide the dependence for a set of interesting cases.
The complexity of the emissivity function in the low-temperature regime may lead to a wrong interpretation of the results of scaling relation studies. In fact, it is conventional to compare the slopes of the scaling relations obtained with sample of groups to the self-similar predictions derived for massive clusters. However, if there is no feedback (i.e., the relations follow the self-similar predictions), then the L–T and L–M relations should flatten at low temperatures and masses. Thus, without accounting for the increasing contribution of the line emission in the low-temperature regime, one could interpret the agreement between group and cluster relations such that feedback processes play a negligible role in shaping the IGrM. Thus, the impact of the feedback could be underestimated. To visualize the contribution of line emission as function of the temperature, we follow the simple approach of Zou et al. [79] in which we measure the luminosity (L) in different energy bands (i.e., bolometric, 0.1–2.4, and 0.5–2) of APEC spectra with a metal abundance of Z = 1.0 (not rare at the center of galaxy groups, see companion review by Gastaldello et al.), and then setting Z = 0 without changing any other parameters to approximate the luminosity of the pure bremsstrahlung component (L). We repeated the exercise for a more standard Z = 0.3. The results are shown in Figure 1 (right panel) where it is clear the significant contribution of line emission to the total luminosity in the low-temperature regime. Thus, the luminosity–temperature and luminosity–mass relations can be approximated as L T and L M, where is the slope of the X-ray emissivity in the considered energy band (e.g., soft or bolometric) and temperature range covered by the systems in the studied dataset (see Table 1). It follows that the self-similar L–T and L–M relations for galaxy groups are expected to be significantly flatter than the ones for galaxy clusters. It is also worth noticing that even for massive systems with Z = 0.3 there is a ∼5% contribution from line emission. Thus, the bolometric emissivity slope is smaller than 0.5 (i.e., the value one gets from pure bremsstrahlung emission) with the net effect being that the correct self-similar expectation becomes LT.
The abundance and temperature dependence of the X-ray emissivity at low temperatures need to be taken into account when determining the luminosities of galaxy groups. Normally, the luminosities are estimated applying a conversion factor to the observed count rates to obtain the X-ray fluxes. From Figure 1 it is clear that this conversion factor in the low-temperature regime depends strongly on the metallicity of the system. Given the observed temperature and abundance gradients in groups (e.g., Rasmussen and Ponman [80], Sun et al. [81], Mernier et al. [82], Lovisari and Reiprich [83]; see also the companion review by Gastaldello et al.), a possible strategy is to use the observed profiles of temperature, abundance, and surface brightness to estimate the luminosity in each radial bin obtained during the spectral analysis (e.g., Sun [52], Lovisari et al. [77]). Sun [52] pointed-out that although the average luminosities (soft band or bolometric) only change by ∼5% when the overall values of temperature and abundance are used in the conversion instead of the profiles, the scatter increases by 10–15%. This is an important point to keep in mind when using survey data (e.g., ROSAT, eROSITA) for which simple assumptions such as isothermality and single overall abundance are chosen to obtain an estimate of the luminosity.
The dependence of the cooling function on the metallicity also implies that the use of different abundance tables can lead to different estimates of the rest-frame X-ray luminosities. Typically, one recovers the source count rate within a given radius from the surface-brightness profile, and then obtain the X-ray flux by setting the normalization of a thermal model (with proper temperature and metallicity) to match the observed count rate. However, the shape of the thermal model (which depends only on the abundance for a given temperature and column density) can diverge at lower and higher energies than the ones used to derive the surface brightness. To visualize the impact, we ran a set of simulations in which the normalization of the thermal model for systems at z = 0.02 (i.e., median redshift of the current local group samples, see Table 2) was set in order to match a count rate of 1 count/sec in the 0.5–2 keV energy band (i.e., the bandpass where many X-ray facilities have most of their effective area, and often used to derive the surface-brightness profiles) for each abundance table. Then, we estimated the luminosity in different energy bands. In Figure 2 (top panels) we show the impact on the estimated luminosity as function of the system temperature and common abundance tables. There is a very good agreement in the 0.5–2 keV band luminosity, regardless of the abundance table used for the analysis. Instead, small differences (i.e., in the order of a few percent) in the 0.1–2.4 keV band and bolometric luminosities arise for low-temperature systems (i.e., kT ≲ 1 keV) when the abundances of (Grevesse and Sauval [84], GRSA), (Asplund et al. [71], ASPL), or (Lodders et al. [85], LODD) are used. The disagreement is much more significant (i.e., up to ∼10%) when the luminosities are estimated with the abundance table by (Anders and Grevesse [86], ANGR). Most of the differences are due to the much higher Fe abundance in ANGR with respect to the other tables investigated here. When the Fe abundance of ANGR is set to the value of ASPL (leaving unchanged all the other ANGR abundances) the estimated luminosities are in much better agreement (see the dashdot lines in the middle panels of Figure 2). The reason for the differences highlighted in Figure 2 is that by switching the abundance table we change the emissivity and the relative contribution of the line emission with respect to the bremsstrahlung emission (see Figure 1). The difference between the rest-frame luminosity estimated with one or another table tends to increase at higher redshifts (see bottom panels of Figure 2). However, unless very high redshifts are considered, the effect is usually smaller than a few percent. In general, the soft-bands (in particular the 0.5–2 keV band) are the ones showing a smaller impact on the estimated luminosity by switching abundance table and should be preferred for galaxy groups studies. Although in most cases the effect is relatively small, it can lead to systematic effects and should be kept in mind when comparing independent literature results.
Another very useful quantity to describe the IGrM and ICM is the entropy which is generated during the hierarchical assembly process. In X-ray studies of galaxy groups and clusters, the entropy is usually defined as
where k is the Boltzmann constant. Entropy is conserved during adiabatic processes and it is only modified by processes changing the physical characteristics of the gas. Entropy increases when heat energy is introduced and decreases when radiative cooling carries heat energy away (e.g., [56]), keeping a record of the energy injection and dissipation in the intracluster gas. Thus, entropy measurements provide a useful tool for our understanding of the thermodynamic history of galaxy groups and clusters. Gas entropy in galaxy groups shows a significant excess to that achievable by pure gravitational collapse (e.g., Ponman et al. [8], Lloyd-Davies et al. [87], Ponman et al. [88], Finoguenov et al. [89], Sun et al. [81], Johnson et al. [90], Panagoulia et al. [91]), indicating a substantial IGrM heating often ascribed to non-gravitational processes. In fact, due to the shallower potential well of the small systems, it is expected that the energy released by past star formation and AGN activities leaves a clear imprint on the thermodynamic properties of IGrM and ICM (see companion reviews by Eckert et al. and Oppenheimer et al.). An effect that can be seen in both the integrated properties (i.e., in the scaling relations) and in the shape of the entropy profiles which are expected to follow K∝R.
2.2. Observed Scaling Relations
The L–T relation involves two of the easiest quantities that can be derived using X-ray data. It was one of the first X-ray correlations to be studied and is still one of the most disputable scaling law between integrated observed properties. In fact, there have been conflicting reports in the literature about whether the relation for groups behaves as the one derived for massive clusters (i.e., whether groups are simply scaled-down versions of clusters or not). It has been clear for many years that the L–T relation for massive systems does not scale self-similarly (see, e.g., Giodini et al. [61] for a review about the relation for galaxy clusters), with slopes significantly higher than 2. Although pioneering studies of the relation for galaxy groups suggested considerably steeper slopes (i.e., slopes larger than 4; Helsdon and Ponman [92], Helsdon and Ponman [7], Xue and Wu [93]), later investigations found relations only slightly steeper than the ones for clusters (e.g., Osmond and Ponman [94], Shang and Scharf [95], Eckmiller et al. [96], Sun [52], Lovisari et al. [77]). In Figure 3, we show a compilation of data for the L–T relation taken from recent studies of galaxy groups observed with XMM–Newton and Chandra, and in Table 2 we list the best-fit slopes from these and other studies. The results show that indeed the slope obtained for poor systems (i.e., kT < 3 keV) is consistent to the one derived for the more massive clusters (with hints of a slightly different normalization that cause a flattening when all the systems are fitted together). However, since the L–T relation is expected to flatten in the low-mass regime (see Section 2.1) these results clearly indicate a more significant contribution of the non-gravitational processes at the group scale. In fact, feedback processes (e.g., AGN heating) are expected to increase the entropy of the gas reducing its density (and hence the X-ray luminosity, steepening the relation). For massive systems, the binding energy is so large that only the very central regions are affected, and the integrated properties of galaxy clusters remain essentially unchanged. Conversely, at the group scale the gas can be easily removed towards or beyond the virial radius modifying their global properties. The agreement between the L–T relation of groups and clusters seems to stand also when the Malmquist bias (i.e., the preferential detection of intrinsically bright objects) is accounted for in galaxy groups studies as previously done for massive clusters. The Malmquist bias is expected to flatten the observed X-ray relations because only objects above a certain flux value are considered (either because one enforces an observational threshold or because faint systems are not detected). The correction needed to recover the underlying relation depends on the real intrinsic scatter with larger values requiring a larger correction (i.e., if the scatter increases in the low-mass regime then the magnitude of the flattening is larger than for galaxy clusters). Although an attempt to correct this bias in cluster scaling relations has been provided in many different X-ray studies (e.g., Ikebe et al. [97], Stanek et al. [98], Pacaud et al. [99], Vikhlinin et al. [38], Pratt et al. [30], Mittal et al. [31], Schellenberger and Reiprich [100]), there are only a few papers providing the correction in the galaxy group regime. For instance, Lovisari et al. [77] analyzing an X-ray flux-selected sample of local groups showed an increase of the L–T relation slope after correcting for the Malmquist bias. A similar result was obtained by Bharadwaj et al. [32], who estimated a correction for an archival sample of groups observed with Chandra. In contrast to these results, are the finding by Kettula et al. [101] and Zou et al. [79] who did not find any significant steepening after the bias correction. However, all the bias corrected relations obtained in the different studies show a great agreement (once they are converted into the same energy band). This agreement may suggest that the observational discrepancies arise from differences in the sample selection (which might cause the sample to be more or less biased). Once the biases are accounted for, then the results are not sensitive to the initial choices. Zou et al. [79] showed that even once selection biases are taken into account the L–T relation at the group scale is consistent with the one for clusters. This finding confirms the stronger impact of the non-gravitational processes in the low-mass regime (otherwise a flattening should be observed). Of course, these corrections work under the assumption that the X-ray selected samples are representative of the underlying population which might not be the case as suggested by, e.g., Rasmussen et al. [102], Anderson et al. [103], Andreon et al. [104], and O’Sullivan et al. [18] who argued that the X-ray surveys miss a large fraction of galaxy systems. One possible reason for this incompleteness is related to the source detection algorithms mostly based on sliding cell detection methods. These algorithms work efficiently at finding point-like sources but has difficulties in detecting extended features, especially for nearby objects and for sources close to the detection limit (e.g., Valtchanov et al. [105]; see also Šuhada et al. [106] for a performance comparison between sliding cell and wavelet detection algorithms). Xu et al. [107], using a method optimized for the extended source detection, found a large number of new group candidates which are not included in any existing X-ray or Sunyaev-Zel’dovich (SZ) cluster catalogs. If studies are restricted to groups that are a priori known to be X-ray bright and which properties may be quite different from those of optically selected groups, as argued by Miniati et al. [108], then our view could be significantly biased.
Beside the selection biases there are other issues complicating the comparison between different studies and between systems with different temperatures (masses). The first is the cross-calibration uncertainty between different instruments. For instance, (Schellenberger et al. [111], see also Nevalainen et al. [116]) showed that the cluster temperatures derived with XMM–Newton are systematically lower than those obtained with Chandra. To complicate this issue is the temperature dependence of this difference. Fortunately, in the low-temperature regime the differences are relatively small, a result that seems to hold also when including Suzaku data (e.g., Kettula et al. [113]). Although some caution is still needed, one can expect that calibration differences do not significantly affect the derived relations at the group scale. However, the impact of the calibrations needs to be taken into account when comparing the results obtained for sample of groups and sample of clusters. Another issue, pointed out by Osmond and Ponman [94], is related to the flattening of the fitted relation because the scatter in will be asymmetric (assuming that the scatter in temperature is symmetric) with larger scatter towards low . Moreover, if the quality of the data is homogeneous across the sample, the statistical errors are expected to be larger in systems with low luminosities, which also tend to flatten the fitted relation. Finally, each study employs a different fitting algorithm (each with pros and cons) and treatment of the scatter and selection biases which impact the final results (see, e.g., Lovisari et al. [34]). To remove this last uncertainty and provide comparable results we fit the published data with the same fitting method (i.e., using LIRA; Sereno [112]) and assumptions (e.g., self-similar redshift evolution). The results are given in Table 2.
The correlation between X-ray luminosity and gas temperature reflects the fact that a deeper potential well (leading to a higher T) generally contains more hot gas (leading to a higher L). However, it has been shown that the gas fraction varies as function of the total mass with galaxy groups showing almost a factor of two lower gas fraction than galaxy clusters. Since the X-ray luminosity is proportional to the amount of gas in the IGrM and ICM, a change in the gas content in low-mass systems translates into a lower luminosity with the effect of steepening the L–T relation. Anyway, the mass dependence of the gas fraction seems to vanish in the outer regions (e.g., Sun et al. [81]) implying that the low gas fraction observed in groups is mainly due to the low gas fraction of groups within ∼R. This weak ability of the groups to retain the gas in the inner regions is probably a consequence of their shallow gravitational potential and thus of the increasing contribution of different non-gravitational processes. These mechanisms are expected to provide an extra heating to the gas preventing the gas from falling toward the center, and by that, reducing gas density and X-ray emissivity in the cores. The effect is expected to play a significant role in poor systems leading to the steepening of the L–T relation, as observed, and of the L– relation which, however, is not currently supported by observations (see Section 3.2). Supporting this scenario is the fact that when the core regions of galaxy clusters are ignored (i.e., by removing the regions where non-gravitational processes are expected to affect more the gas properties) the slope of the L–T relation is more in agreement with the self-similar prediction. This is also in agreement with the suggestion by Mittal et al. [31] that, for low-temperature systems (i.e., kT < 2.5 keV), AGN heating becomes more important than ICM cooling (which is the dominant mechanism in massive clusters). Colafrancesco and Giordano [117] suggested that intracluster magnetic fields can also affect more strongly the gas properties in the low-mass regime, resulting in an effective steepening of the scaling relations. In fact, as shown in Colafrancesco and Giordano [117], the magnetic pressure tends to counterbalance part of the gravitational pull of the cluster preventing the gas from a further infalling. Thus, the presence of a magnetic field determines the final distribution of the gas density resulting in a less concentrated core (i.e., leading to a lower luminosity). The effect is mild for massive systems (due to their large gravitational potential) but is relevant in the group regime. The presence of the magnetic field is also expected to decrease the temperature because of the additional magnetic field energy term that needs to be included in the virial theorem. However, since galaxy groups and clusters are not isolated systems, the presence of an external pressure induced by the infalling gas from filaments, would tend to compensate the decrease of T caused by the magnetic field.
The non-gravitational heating implies the existence of an entropy floor (i.e., an excess of entropy with respect to the level referable to the gravity only) calling for some energetic mechanisms that can be summarized in three classes: preheating, local heating, and cooling (see the companion review by Eckert et al. for detailed description of these mechanisms). Indeed, entropy in excess with respect to that achievable by pure gravitational collapse is observed in the inner regions of groups and poor clusters (e.g., Mahdavi et al. [118], Finoguenov et al. [89], Sun et al. [81], Johnson et al. [90], Panagoulia et al. [91]). The excess is found to be radial and mass-dependent, being smaller for massive systems and extending to larger radii in low-mass objects. Moreover, Johnson et al. [90] found that the excess is higher for groups with higher feedback (roughly estimated assuming that both the integrated feedback from SNe and AGNs scale with the stellar mass). Since entropy is expected to remain unchanged when neglecting non-gravitational processes, in the self-similar scenario it simply scales with the gas temperature. The finding by Sun et al. [81] shows that the slope of the relation depends on the scaled radius at which the measurement is taken, and groups behave more regularly in the outer regions (e.g., beyond R) than in the core. This was already pointed-out by Ponman et al. [88]. Thus, the slope of the K-T relation approaches the self-similar value at R, where there is no significant entropy excess above the entropy baseline (see the companion review by Eckert et al.). This agrees with the finding by Pratt et al. [119] for a sample of galaxy clusters.
Less studied than the L–T relation, but of paramount importance for cosmological studies, is the relationship between X-ray luminosity and total mass (i.e., L–M). This is particularly true for shallow X-ray surveys because it can be used to directly convert the easiest to derive observable (luminosity requires only source detection and redshift information) to the total mass. The calibration of this relation down to the low-mass regime will allow the breaking of the degeneracy between and (e.g., Reiprich and Böhringer [36]). A large number of observations of galaxy clusters (e.g., see Mantz et al. [120], Schellenberger and Reiprich [44], Mantz et al. [121], Bulbul et al. [122], and Lovisari et al. [34] for recent studies; we refer to Böhringer et al. [59] and Giodini et al. [61] for older investigations) found that most of the values for the relation slope range from 1.4 to 1.9, steeper than the self-similar prediction of 4/3 suggesting that the luminosity is affected by non-gravitational processes. Unfortunately, the literature in the low-mass regime is still quite limited (in the left panel of Figure 4 we show a compilation of recent galaxy groups studies). Eckmiller et al. [96] found a slope of 1.34 ± 0.18 and suggested that the single power-law modeling of the relation holds also for low-mass objects (see also the illustrative fit in Figure 4). However, given the considerations provided in the previous section, for the sample analyzed by Eckmiller et al. [96] the luminosity should scale with the total mass to the power of [0.4:0.8] (see Table 2) significantly lower than the finding by Eckmiller et al. [96]. A similar slope was also obtained by Lovisari et al. [77] but, after correcting for the selection biases, the corrected slope is steeper (i.e., 1.66 ± 0.22) than the observed one (i.e., 1.32 ± 0.24). making the deviations from the self-similar prediction even larger than what observed for galaxy clusters. This behavior can be explained by a gradual steepening of the true underlying L–M relation towards the low-mass regime. This implies that as expected, also the luminosity of groups is heavily affected by non-gravitational processes. However, one should keep in mind that a mass-dependent bias in the total mass can also affect the shape of the L–M relation. Because of the difficulties to distinguish the low-temperature emitting gas of these systems from the galactic foreground, the properties of galaxy groups can usually be observed out to a smaller radial extent than what is done for galaxy clusters. Thus, an estimate of the group masses at R requires an extrapolation for most of the systems making the groups more prone to biases. Moreover, mass biases can also arise from the assumptions of hydrostatic equilibrium and spherical symmetry which are not valid for most of the systems. One way to overcome the problem is to use the weak-lensing masses which are expected to provide a less biased view of the true masses. Because of the difficulties to obtain shear maps for low-mass systems the first attempts have been performed via stacking analysis. Leauthaud et al. [123] stacked the weak-lensing measurements of a sample of X-ray-selected galaxy groups and found an L–M relation in agreement with the finding of galaxy clusters. This result suggests that the L–M relation is well described by a single power-law down to the low-mass regime. However, the lensing analysis of galaxy groups by [101] led to a shallower slope although the agreement in the low-mass regime of the two relations is fairly good, with significant tension appearing only at high masses (i.e., above a few 10 M). With the advent of multi-wavelength surveys, which uniformly scan large areas of sky, there has been significant progress in the weak-lensing analysis of large samples of galaxy groups. For instance, in the XXL framework (see Pierre et al. [124]), the L–M relation was investigated by Sereno et al. [115] who found a quite good agreement with previous X-ray studies. The results suggest that the measured hydrostatic bias is consistent with a small role of non-thermal pressure. However, due to the large uncertainties associated with the derived weak-lensing masses a large deviation from hydrostatic equilibrium cannot be completely excluded and further investigations with larger samples and higher quality data are required to make progress in the field.
In contrast to the L–T and L–M relations, the M–T relation is expected to follow the same behavior for galaxy groups and clusters, under the assumption that the gas temperature reflects the depth of the underlying potential well. However, while the assumption is probably reasonable for many clusters (at least for the most relaxed ones) it may not be strictly true for groups where the gas has probably been significantly heated by non-gravitational processes. For this reason, the expectation is that the scatter should increase in the low-mass regime where the global temperature is not insensitive to the details of the heating/cooling processes as in the high-mass regime. However, these processes are definitely more important in the inner regions with their effect fading at large distances from the center. Nonetheless, some simulations suggested that the gas removed by AGN activity in groups can affect the gas properties out to several Mpc (e.g., Schaye et al. [125]), potentially affecting also cosmic shear measurements (e.g., Semboloni et al. [126]). Thus, it is important to define the region within which the characteristic cluster temperature is determined. This is not trivial because, for instance, we have evidence that the central drop (i.e., the region in the center of relaxed clusters showing a significant temperature decline, probably caused by radiative cooling), typically present in relaxed clusters, does not scale uniformly with the mass (Hudson et al. [16]). However, a common practice is to exclude the regions within 0.15R.
There had been a lot of studies investigating the M–T relation before the Chandra and XMM–Newton era. Many of them (e.g., Finoguenov et al. [127], Sanderson et al. [9], and references therein) suggested that the low- and high-mass end of the relation is characterized by different slopes with the cross-over temperature between the two regimes at ∼3 keV. However, most of these studies could not constrain the gas properties (i.e., gas density and temperature gradients) at large radii making the estimated hydrostatic masses more prone to biases. Thanks to Chandra and XMM–Newton, the measurements could be extended to larger fraction of R reducing the impact of the extrapolation. Sun et al. [81] found a relation only slightly steeper than the prediction of the self-similar scenario. Both Eckmiller et al. [96] and Lovisari et al. [77] found that the slope for galaxy groups is consistent with the one of galaxy clusters but with a normalization 10–30% lower. The net effect of this finding is a steepening of the relation when groups and clusters are fitted together (see, e.g., right panel of Figure 4). Indeed, due to the limited field-of-view of Chandra and the high and variable XMM–Newton background level, X-ray measurements are still not tracing well the outer regions (despite the improvement with respect to previous missions, measurements extend out to R only for a few systems). If the density profiles of groups are steepening at large radii then the masses could be underestimated explaining the lower normalization of the M–T relation. Another possible issue is that the samples analyzed in the above-mentioned papers are biased toward relaxed systems. Thus, if relaxed and disturbed systems do not share the same relation (e.g., because hydrostatic masses are more biased for disturbed systems) the relative fraction of relaxed/disturbed groups can impact the normalization (and possibly the slope) of the observed M–T relations. Lovisari et al. [34] showed that this is probably not the case for massive systems, but a dedicated study in the group regime is still missing. Focusing on the slopes, the results of the most recent papers on galaxy groups agree with the results for galaxy clusters for which most of the slope values range from 1.5 to 1.7 (see Table 2). This agreement suggests a small impact of the non-gravitation processes to this relation. Again, before overinterpreting these results, one of the key questions is to assess if the level of mass bias in these systems is similar to the one of galaxy clusters. For instance, (Kettula et al. [128], see also Kettula et al. [101]) argued that the hydrostatic mass bias at 1 keV reaches a level of 30%–50%, higher than what usually observed for galaxy clusters (e.g., by calibrating the hydrostatic masses with other mass proxies, such as weak-lensing or velocity dispersion). However, the sample consists of only 10 galaxy groups and the dynamical state of the systems is not discussed. A much larger sample was investigated by Umetsu et al. [114] who found the relation to be consistent within statistical uncertainties with the self-similar expectations. However, the uncertainties of the individual weak-lensing mass measurements in the group regime are still quite large and tighter constraints are needed in the future to exclude deviations from self-similarity. An increasing mass bias in the low-mass regime would not be fully unexpected. In fact, in the unmagnetized case, the viscosity scales as T (Spitzer [129]) favoring the development of strong turbulences. Acting as additional pressure support against gravity, turbulent motions may increase the mass bias. Anyway, the IGrM is magnetized and the real magnitude of the turbulence is still unknown.
Beside the shape of the scaling relations another important information is given by the scatter (i.e., the dispersion around the best-fit). Minimizing the scatter of the scaling relations is of paramount importance to obtain accurate constraints on cosmological parameters which are dominated by uncertainties in the mass–observable relations. Moreover, understanding the scatter in the relations is the key to pinpoint the physical processes at play in the group regime. However, the measurement errors for most of the groups are large, thus the intrinsic scatter is not well constrained, yet. Because of that, refs. [77,81] were not able to constrain the intrinsic scatter in their samples. [96] instead suggested that the scatter in galaxy groups (kT < 3 keV) is much larger than the one derived for the HIFLUGCS sample (Reiprich and Böhringer [36]).
A mass proxy which has been shown by simulations to bear a low scatter is the Y parameter (i.e., the product of the gas temperature and the gas mass; see Kravtsov et al. [130]). Sun et al. [81] were the first to investigate the M–Y relation in the low-mass regime finding that a single power-law model can fit very well both galaxy groups and clusters. This result was also confirmed by Eckmiller et al. [96] and Lovisari et al. [77]. Unfortunately, given the sample size and the relatively large measurements errors, the intrinsic scatter is not properly constrained. However, both Sun et al. [81] and Eckmiller et al. [96] suggested that the scatter of the M–Y relation is almost half of the M–T relation. The findings by Eckmiller et al. [96] also suggest that the scatter for galaxy groups is significantly higher than for galaxy clusters.
The self-similar model also predicts the X-ray scaling relations to be redshift-dependent (e.g., Giodini et al. [61] and references therein), reflecting the decrease with time of the mean density of the Universe. Non-gravitational processes are expected to affect the evolution of the X-ray scaling relations because of the increasing importance of such processes to the energy budget of galaxy systems as a function of redshift. Unfortunately, although groups are more common than clusters, because of their fainter and cooler nature it is more difficult to detect them over the background, especially at higher redshifts. Thus, due to the big challenges to detect large and representative samples of galaxy groups beyond the local Universe the literature on this subject is very limited. The few studies (e.g., Jeltema et al. [131], Pacaud et al. [99], Alshino et al. [132], Umetsu et al. [114], Sereno et al. [115]) which have tried to address the evolution of the X-ray properties of galaxy groups did not find convincing evidence for such evolution. A characterization of the evolution of the scaling relations also on galaxy group scales is one of the goal of the next-generation instruments (such as Athena; see Section 5).
3. Optical Scaling Relations
Due to the low X-ray flux at the group scale, there is high probability that X-ray selected samples are biased toward groups with rich IGrM. Moreover, since the luminosity strongly depends on the metallicity (see Section 2.1), variations in the metal abundance between groups (possibly related to their feedback history) can significantly impact the selection function. Thus, it is advantageous to explore scaling relations between an X-ray property that can be measured relatively well in the low count regime (e.g., X-ray luminosity or gas temperature) and an optical property that can be used as a proxy for the group mass (e.g., velocity dispersion, optical band luminosity).
3.1. Velocity Dispersion
The velocity dispersion () of galaxy groups (and indeed clusters) can be used to estimate dynamical masses via the application of the virial theorem. Furthermore, the velocity of member galaxies complements X-ray information about the cluster morphology projected onto the sky. For example, studying the luminosity–velocity dispersion (L–) relation provides an understanding of the dynamical properties of galaxy clusters and their impact on the scaling relations.
One of the most commonly used estimators of the velocity dispersion at the group regime is via the use of the gapper estimator from [133]. Of critical importance at the group scale, the gapper estimator is unbiased when using low numbers of member galaxies (down to ∼10 members, e.g., [134]), and is robust against outliers. The gapper velocity estimator () is given by
where, for ordered velocity measurements, the gaps between each velocity pair are defined as (for ), as well as Gaussian weights defined as .
As stated above, one can study the L– relation to understand dynamical properties and the impact on scaling relations. In Equation (4), it is shown that in the self-similar scenario the bolometric luminosity is expected to scale with the gas temperature as LT. Under the consideration that both the cluster/group hot gas and galaxies feel the same potential, assuming that they both have the same kinetic energy, the temperature can be converted to velocity dispersion using
where the parameter is the ratio of the specific energy in galaxies to the specific energy in the hot gas. Using Equation (7) and the self-similar scaling of L and T above, the self-similar scaling of velocity dispersion and X-ray properties can be given by
However, because of the behavior of the X-ray emissivity in the low-temperature regime, the dependence of the luminosity on the temperature is more complicated (see discussion in Section 2.1) and can be approximated as LT, where is the slope of the X-ray emissivity in the considered energy band (e.g., soft or bolometric) and temperature range (see Table 1). Using this dependent relation, it follows that
For temperatures lower than 3 keV, the value of is negative (unless very cool systems are considered), implying that the expected L– relation for galaxy groups is shallower than what is predicted for galaxy clusters (e.g., Equation (8)).
3.2. The Luminosity-Velocity Dispersion Relation
At the cluster scale, generally, it has been found that the observed luminosity–velocity dispersion (L–) relation follows, or is slightly steeper than, the expectation of Equation (8) (e.g., [135,136,137,138,139,140]). Furthermore, at the cluster scale, studies of the L– relation now use samples of clusters numbering in the high hundreds (e.g., [141], using 755 clusters to investigate the L– relation). Studies of the L– relation at the group scale attempt to compare the form of the relation at the high-mass regime to investigate differences at these two mass scales (e.g., to probe the effect of AGN feedback processes at high and low masses). Early studies comparing the slope of the relation between the two mass regimes provided a mixed picture, with studies finding groups have a flatter (e.g., [7,93,94]) or consistent (e.g., Ponman et al. [142], Mulchaey and Zabludoff [136], Mahdavi and Geller [137]) relation than their high-mass counterparts. Figure 5 (left-panel) provides a (non-comprehensive) compilation of the slope of the L– relation from various studies in the literature. The solid horizontal line represents the dividing line between studies using clusters (top half) and groups (bottom half). The L expectation is given by the vertical dashed line. Although there appears to be a clear division between the slopes for groups and clusters, many of the group scale studies compare to the usual L expectation at the cluster scale. As shown in Equation (10), the scaling can be given by L, with dependent on the X-ray emissivity and energy band used. If we assume a group temperature range of 0.7–3.0 keV, then given the range of emissivities in Table 1, the bolometric scaling in the group regime becomes L. This range is highlighted by the blue shaded region in Figure 5 (left-panel) at the group scale. For comparison, using these same arguments, the bolometric scaling for clusters (assuming 3.0–10.0 keV) becomes L (again highlighted by the blue shaded region in Figure 5, appropriate to the cluster scale). Considering the above, studies investigating the group scale relation can indeed be considered consistent with the self-similar expectation (e.g., [94]). Although this is the case, many authors note caveats when studying groups, which are discussed below.
Many early studies were based upon ensemble collections of groups that can lead to biases in the derived scaling relations. In recent years, studies of the L– relation have used groups selected over contiguous survey regions. One such study was performed by [144]. Groups were selected from regions of the Canadian Network for Observational Cosmology Field Galaxy Redshift Survey 2 (CNOC2, [145]) that were covered by XMM–Newton and Chandra observations, totaling 0.2 and 0.3 deg contiguous areas of two fields of the CNOC2 survey. Using X-ray selected groups with high quality redshift information, they find a slope of the L– of 2.40 (including groups with lower quality redshift information yields a slope of 1.35). Although initial inspection of the value of the slopes would imply the slope is shallower than the self-similar expectation (as noted in [144]), we note that the luminosities are reconstructed in the 0.1–2.4 keV band (from the flux in the 0.5–2 keV band, and by correcting for extension and K-correction as described in Finoguenov et al. [146]). Assuming the scaling follows L, then for luminosities in the 0.1–2.4 keV band, the scaling can be given by L (depending on the metallicity of the groups). This expectation is shown in Figure 5 (left-panel), highlighted by the grey shaded region at the group regime. The slope determined by [144] is coincident with this scaling. Therefore, if the energy band is considered, the [144] relation is consistent with the self-similar expectation. Hence, it can be assumed that the groups studied in [144] are consistent with the cluster scale (assuming clusters follow the self-similar expectation). Another study using contiguous fields is presented in [143], using groups selected from the 2 deg Cosmic Evolution Survey (COSMOS, [147]). This study constructs a catalog of galaxy groups based upon those identified in [148], using XMM–Newton and Chandra observations of the COSMOS field, reaching an X-ray flux limit of ∼10 erg s cm. Ref. [143] use galaxy redshift information from a wide variety of surveys in the literature and associate them with the X-ray detected groups, compiling a final sample of 146 groups with at least three spectroscopic members. Based upon a cleaned sample of 74 groups, ref. [143] showed that the relation for individual groups appears to follow a shallower relation than clusters (consistent with that found by previous studies, e.g., [137]). However, they note that this trend may be affected by a small number of groups that appear to have anomalously low velocity dispersions (at 125 km s) for their measured X-ray luminosity (discussed further in Section 3.4). To overcome this, Ref. [143] estimated the median velocity dispersion for 7 bins of groups created from the 74 groups in their sample, finding a slope of L. This study considers luminosities in the 0.1–2.4 keV band, therefore, as discussed above, the measured slope is in fact steeper than the self-similar expectation.
Although contiguous regions have been used to study the L– relation, an extremely small number of studies have attempted to correct for X-ray selection biases. One study that attempts to do so is presented in [149], using 14 groups with at least 5 galaxy members selected from the 9 deg X-Boötes survey [150]. They find that the group scale relation is consistent with the self-similar expectation. To test the effects of Malmquist bias on the observed relations, ref. [149] determined the limiting X-ray luminosity in two survey volumes (z = 0.20 and z = 0.35). The resulting relations are consistent with the sample relation, with the authors concluding the sample may not be dominated by Malmquist bias effects. However, due to the associated large error on each relation, making this conclusion is challenging and requires the construction of larger samples. Another use of contiguous surveys, particularly those covered by multiple wavelengths, is the possibility to compare the relations derived using groups selected via multiple selection methods (e.g., X-ray, optical). Furthermore, the use of optically selected groups allows one to estimate the form of scaling relations independent of the usual X-ray selection biases (e.g., [104]). The study by [144], as detailed above, also constructed a sample of 38 optically (spectroscopically) selected groups. Using this optically selected sample, they derive a slope of the L– relation of 1.78. Given the large uncertainties on the measured slopes, the comparison of the X-ray and optically selected samples is somewhat limited (note that the comparison is not affected by the energy band used, as discussed above, since they are consistent between the X-ray and optically selected samples).
3.3. The Velocity Dispersion-Temperature Relation
Velocity dispersion and gas temperature are two independent probes of the depth of the cluster potential well, estimated by using baryons as tracers. Therefore, this relation can provide useful information about the effect of non-gravitational processes, which are responsible for the deviation from thermal equilibrium of the IGrM and ICM. Hence, it is useful to compare group and cluster relations to investigate the differences between these mass scales. Figure 5 (right-panel) shows a compilation (again, a non-comprehensive picture) of the slope of the -T relation from studies in the literature. The horizontal lines represent the division between studies using groups (bottom section), clusters (top section) and those using systems which straddle the group/cluster regime (middle section). Based upon Equation (7), it is expected that the velocity dispersion of the galaxies should scale with the square-root of the temperature of the gas, T. In the context of clusters, various studies have found that the –T relation has a slope steeper than the self-similar expectation (e.g., [138,151]), with others finding a steeper slope but with errors too large to confirm a deviation (e.g., [140]). Unfortunately, the study of the –T relation for groups is somewhat limited in the literature. An early investigation presented in [94] showed evidence for steepening of the relation at the group scale (where they find a slope of 1.15 ± 0.23). However, they caution that there is both large uncertainties on the measured X-ray temperatures and a large amount of scatter observed in the relation, which could be the cause of tension with previous studies attempting to investigate any steepening of the relation for groups. Although [94] found evidence for a steepening of the relation, they remarked that a comparison cluster-based relation passes through the center of the group relation data, and represents adequately the cluster-based relation. However, recent studies of the relation, especially at the group scale, become scarce. One recent study of the –T is presented in [151], making use of groups/clusters detected serendipitously in the XMM Cluster Survey [152]. Using 19 groups/clusters with redshifts z < 0.5, spanning the temperature range 1.0 ≲ Tx ≲ 5.5 keV (with 50% of clusters with a temperature < 3 keV), the –Tx relation is found to have a slope of ± 0.16.
Although again steeper than the self-similar expectation, the result is somewhat shallower (although not significant) than that presented in [94]. Finally, the last relation considered is that given in [153], which investigated the –T relation for a sample of X-ray selected clusters detected in the XXL survey [124]. Clusters were selected from the 25 deg XXL-N region, with spectroscopic data compiled from a range of surveys (see [154], for full details of the spectroscopic coverage). Using a sample of 132 clusters (the majority of which have T 3 keV), ref. [153] found a relation of the form T. Please note that the relation is fitted using an ensemble maximum likelihood method, with fitted slope in tension with the self-similar expectation. Since both velocity dispersion and X-ray temperature scales with total mass, one can combine the information to determine a useful mass calibration (e.g., [153]). However, consideration must be given to velocity anisotropies during mass modeling using velocity information, which can vary for loose, compact and virialized groups [155]. However, corrections based upon halo concentration have been developed (e.g., [156]). The study of the -T relation can also be probed down to the galaxy scale. Ref. [157] used galaxies from the volume-limited MASSIVE survey [158], to study the relation between galaxy kinematics () and X-ray temperature. Ref. [157] found a relation of the form T (note the inverse of the relation as discussed above), noted as being marginally flatter than the self-similar expectation.
As discussed in Section 3.4, AGN feedback and its effects on the ICM could result in deviations from self-similarity, in particular, the steepening observed above in the T–. Although an observational consensus on the magnitude of the deviation from self-similarity at the group scale compared to the cluster scale has yet to be reached, simulations have indeed shown a mass dependence (e.g., Le Brun et al. [159], Farahi et al. [160], Truong et al. [28]). The deviations discussed for the L– and –T are thought to arise due to the effects of AGN feedback on the ICM (as shown in simulations, e.g., [161]), which has little effect on the galaxy velocity dispersions. Furthermore, Ref. [157] measured a median value of = 0.6 for their galaxy sample, suggesting the galaxies have undergone, or still in the process of, additional heating due to, e.g., AGN feedback, as discussed above.
3.4. Low Velocity Dispersion Groups
One observation made by various authors studying the L– relation, is the presence of low velocity dispersion groups (appearing at 200 km s) that have a high X-ray luminosity in comparison to their (conversely, it can be stated that these groups have a low for their L). These low velocity outliers have been noted in various studies in the literature (e.g., [137,162]), attributed as the cause of the flattening of the L– relation at the group scale (e.g., Vajgel et al. [149], Sohn et al. [143]). Although it has been shown in Section 3.2 that the group scale relations may be consistent with self-similar predictions when accounting for the differing emissivity, the presence of these outliers are extreme cases. A physical interpretation of the low outliers is therefore currently lacking. Furthermore, the presence of these outliers remains somewhat of a mystery if one considers the effects of AGN feedback on the intragroup medium. During an AGN outburst, gas will be removed from the group potential, hence lowering the group overall X-ray luminosity. With the group velocity dispersion unaffected by this process, the expectation would be that the group should have a lower L for a given , contrary to this outlier population. It could therefore be argued that it is in fact the velocity dispersion that have been underestimated for these groups. Potential explanations for the presence of these low outliers were given in [162]. It is postulated the cause could be: (i) through dynamical friction, energy is transferred from a large orbiting body to the sea of dark matter particles through which it moves; (ii) due to tidal interactions, the orbital energy may be converted into internal energy of the galaxies; and (iii) the orbital motion happens in the plane of the sky, therefore contributing little to the line-of-sight velocity dispersion. Although a current physical interpretation is lacking, the presence of low velocity dispersion outliers could be due to X-ray selections effects (e.g., Eddington and Malmquist biases). Extreme outliers (e.g., [143]) may not be attributed to selection; however various relations involving L when using X-ray selected samples characteristically show a flattening when not account for selection (e.g., [163,164]). In fact, the preferential selection of higher luminosity groups for a given velocity dispersion (i.e., Malmquist bias), leads to the presence of “moderate” outliers. Ref. [104] argues that an unbiased sample of clusters can be obtained when selecting clusters from optical properties and therefore able to probe the full range of scatter and the true form of the relation. As stated, [144] have used an optically selected sample of clusters to investigate the form of the L– relation; however, they find constancy in both the form and scatter of the X-ray and optically selected group samples (due to the large errors on the scaling parameters). This sample only covered an area of 0.5 deg, therefore the comparison of optically and X-ray selected samples over overlapping contiguous fields requires further attention to truly probe the differences in selection.
3.5. Stellar Gas Content of Galaxy Groups
The gas mass fraction of clusters can be used as a probe of cosmology (e.g., Allen et al. [37], Ettori et al. [165], Mantz et al. [166], Schellenberger and Reiprich [44]). However, as mentioned in the previous sections, it has been shown that the fraction decreases as a function of total mass. Interestingly, the opposite is true for the stellar mass fraction (f = M/M), with an increasing stellar mass fraction as a function of decreasing total mass (e.g., Lin et al. [167], Gonzalez et al. [73], Giodini et al. [2], Behroozi et al. [168], Zhang et al. [169], Leauthaud et al. [170], Laganá et al. [171], Chiu et al. [172], Decker et al. [173]). To investigate this trend, much effort has been afforded to the study of the gas mass and stellar mass content in groups and clusters (e.g., to determine star formation rates). One such observation is that the stellar mass has a correlation with the halo mass with a slope <1 (see discussion below). This has the implication that at the group scale, star formation is more efficient. One early study that specifically used groups to constrain the form of the stellar mass–halo mass relation (M–M) and the group f is that of [2]. An X-ray selected sample of groups was constructed from the COSMOS survey, in which X-ray extended sources were detected based upon a wavelet detection routine [174]. Mean photometric redshifts were assigned to each candidate and checked against available spectroscopic redshifts from zCOSMOS [175]. After quality checks, a final sample of 91 groups were used to constrain the form of the M–M relation. Masses were estimated based upon a stacked weak-lensing analysis [123] and the construction of a L–M relation, from which the catalog masses were estimated (note that M masses were used in the final analysis, estimated from the M assuming an NFW profile -Navarro et al. [176], Navarro et al. [177], and constant concentration, ). Within R the M–M relation was found to follow a form of M M and a stellar mass fraction of the form f M (extending this to higher masses with the inclusion of clusters, the form follows a relation of f M). More recent studies have used increased area X-ray surveys. The XMM Blanco Cosmology Survey (XMM-BCS, [106]) covers 12 deg of the sky with XMM–Newton, and was used by [178] to study the form and evolution of the M–M relation using 46 groups/clusters within a mass and redshift range of ( and 0.1 1.02, respectively. The M–M relation is fitted including an evolutionary redshift term, with parameters estimated by evaluating a likelihood based upon observing a cluster with observed properties (L and M) given a mass, redshift, L–M relation (mass calibration) and the M–M relation. The likelihood is weighted by the mass function, with full details given in [179]. The fitted relation has the form M M, again consistent with previous results showing a shallower than unity slope of the relation. Furthermore, these results indicate little evolution in the stellar content with stellar mass fraction staying constant out to 1. In Figure 6, we plot the M–M relation for various results obtained in the literature (namely [2,178,180,181,182]). We note that no attempt has been made to correct for the differences in mass calibration used in the various studies. For reference, two constant stellar mass fractions are given by the black dashed lines. As discussed above, the relations for [2,178] are derived at the group scale, whereas [182] straddles the high-mass groups/low-mass cluster regime (see below) and [180] used primarily high-mass clusters (note that the relation plotted here includes clusters from Gonzalez et al. [76], as detailed in Kravtsov et al. [180]). All the relations have a slope less than unity, and show the trend of decreasing stellar mass fraction from the group to cluster regime. The observed relations are also consistent with that found in simulations. Results obtained from the IllustrisTNG simulations show the same trend in stellar mass (shown by the red dot-dashed line in Figure 6, taken from [181]).
Due to the difficulty of measuring the stellar masses of groups directly, requiring deep observations, it is beneficial to use a proxy for the stellar mass. One such proxy as a tracer of the stellar mass is the K-band luminosity (L), as shown in various studies (e.g., [167,183]). The use of L as a stellar mass proxy was investigated in [182] using a sample of 20 groups/clusters selected from the XXL survey. The clusters were selected from the overlap of the XXL and CFHTLS, using clusters with an individual weak-lensing mass estimate. Ref. [182] found a relation of the form L M, which while shallower than unity, a slope of 1 cannot be ruled out. Furthermore, when combined with a sample of high-mass clusters from LoCuSS, ref. [182] measured a slope of 1.05. The relation derived for the XXL sample is shown in Figure 6 (purple line, with the shaded light purple region highlighting the 1 uncertainty), which is derived from the L–M relation assuming a constant mass-to-light ratio of 0.73 (as adopted in [182]).
4. The Role of SMBHs: Observed Scaling Relations and Predictions via HD Simulations
As introduced in Section 1, the evolution of the IGrM filling galaxy groups cannot be merely understood in isolation as giant self-similar gaseous spheres. Particularly in the last decade, a wide range of evidence has accumulated showing that the SMBHs at the center of each galaxy group are tightly co-evolving with the hot X-ray halo. Such co-evolution works in both directions: the hot-halo acts as an active atmosphere and reservoir of gas which recurrently feeds the central SMBH (Gaspari et al. [184], Prasad et al. [185], Voit et al. [186], Temi et al. [187], Tremblay et al. [188], Gaspari et al. [189], Rose et al. [190], Storchi-Bergmann and Schnorr-Müller [191]). In turn, the SMBH re-ejects back large amount of mass and energy (in particular via jets and outflows; e.g., Tombesi et al. [192], Sa̧dowski and Gaspari [193], Fiore et al. [194]), thus re-heating and re-shaping the IGrM via bubbles, shocks, and turbulence up to the group outskirts (McNamara and Nulsen [195], Fabian [196], Gitti et al. [197], Brighenti et al. [198], Gaspari [199], Liu et al. [200], Yang et al. [201], Wittor and Gaspari [202], Voit et al. [203]). Although the small-scale AGN self-regulation thermodynamics/kinematics is respectively tackled in the companion Eckert/Gastaldello et al. reviews, here we focus on the macro-scale integrated (X-ray) IGrM properties and group scaling relations, which complete and complement Section 2 and Section 3. Furthermore, we compare with high-resolution and hydrodynamical (HD) simulations, in particular to discuss what the X-ray scaling relations can constrain and tell us in terms of the baryonic physics shaping the IGrM.
Figure 7 shows several key macro X-ray halo scaling relations, which are usually employed in cosmological studies (see Section 2), but now plotted against the SMBH mass M, which is also an integrated property. These SMBH masses are retrieved only via robust direct measurements, i.e., resolving the stellar or gas kinematics within the SMBH influence region (e.g., via HST). The current largest sample correlated with the available X-ray hot gas properties is presented by Gaspari et al. [20], which includes central galaxies and satellites, with morphological types such as ellipticals (blue circles), lenticulars (green), and a few spirals (cyan). The 85 systems span a range of M M, with most systems in the group regime (T keV) and a few in the poor or cluster tails. The companion Eckert et al. review shows that the M correlation with is significantly tighter than the classical optical scaling, such as the Magorrian relation (e.g., Kormendy and Ho [204], Saglia et al. [205]), with intrinsic scatter down to 0.2 dex, in particular within the circumgalactic and core region. Here, in Figure 7 we show the other key X-ray properties integrated up to R, namely the plasma X-ray luminosity (in the 0.3–7.0 keV band), gas mass, total mass (gas plus stars plus dark matter), gas density, Compton parameter, and gas fraction. All the fits parameter–including the intercept, slope, scatter, and correlation coefficient–are shown in the top-left inset. The related Bayesian analysis (Gaspari et al. [20]) shows the 1- intrinsic scatter as light red bands with the dotted lines enveloping the rare 3- loci. As indicated by all correlation coefficients, even the macro-scale IGrM (several 100 kpc to Mpc scale) is tightly linked to the central M. The tighter correlations are those involving the gas mass/luminosity, X-ray Compton parameter Y, and total mass, while the loosest one is that with the gas density. It is interesting to note that using the core radius (or smaller) as extraction radius (not shown) leads to similar results, except that the total mass scatter increases by 0.1 dex, with the gas properties emerging as dominant drivers (in particular M and f). In other words, we suggest using the R scaling to probe the total mass, while smaller extraction radii to probe gas mass (and related properties).
The X-ray correlations shown in Figure 7 are important to probe models of galaxy group evolution. A key debated topic in current extragalactic astrophysics is which mode of accretion feeds internally the IGrM and eventually the central SMBH. In hot accretion modes (usually Bondi or ADAF; e.g., Bondi [206], Narayan and Fabian [207]), the larger the thermal entropy of the gas, the stronger the feeding is stifled, as the inflowing gas must overcome the hot-halo thermal pressure, increasing toward the center. This would induce negative correlations with the IGrM properties, which are ruled out by the slopes shown in Figure 7. Conversely, cold-mode accretion—typically in chaotic form due to the turbulent IGrM condensation generating randomly colliding clouds (e.g., Gaspari et al. [184], Prasad et al. [185], Voit [208], Olivares et al. [209])—would produce major positive and tight correlations with the gas mass and X-ray luminosity (e.g., the cooling rate is ∝ L). Therefore, X-ray correlations favor chaotic cold accretion (CCA) over hot mode accretion. Hierarchical mergers (of both SMBHs and galaxies) are another channel to potentially grow such correlations. However, cosmological simulations (Bassini et al. [210], Truong et al. [211]) show this to be effective only at the high-mass end. Moreover, Figure 7 shows that all the mass scaling is either sub- or super-linear, far off from any simple self-similar expectation. In other words, a positive baseline due to hierarchical assembly is present, but gas feeding (dominated by CCA, in terms of mass) substantially shapes the slope and scatter of such M correlations over the long-term evolution. Overall, observed scaling relations of macro X-ray halo properties (shown in Section 2 and Section 3) cannot be thought as disjointed from scaling relations of micro properties (e.g., M), since both systems are tightly co-evolving and intertwined through the several billion years evolution and over 10 orders of magnitude in spatial scale (cf. the diagram in Gaspari et al. [212] linking the micro, meso, and macro scales). As striking as it appears, such scaling relations allow us to convert back and forth between vastly different scales, depending on the availability of either the micro (Section 4) or macro (Section 2) properties for each detected galaxy group.
The X-ray scaling relations presented in Section 2 can be also leveraged to test feedback models in large-scale simulations or to calibrate semi-analytic models of group evolution, thus giving us hints on the dominant baryonic processes in the IGrM (e.g., Puchwein et al. [23], McCarthy et al. [14], Kravtsov and Borgani [213], Tremmel et al. [214]). Figure 8 shows the key impact of archetypal feedback models on the evolution of the diffuse hot atmospheres (Gaspari et al. [27]). The filled black points indicate the Gyr evolution of the hot halos IGrM and ICM as it suffers recurrent injections of either anisotropic mechanical energy via jets (left column) or a strong impulsive thermal quasar-like blast (right column). Evidently, the latter model has a dramatic impact on the main L–T relation (even when the core is excised), producing a catastrophic evacuation of gas that lowers luminosities by 3 orders of magnitude, especially toward lower-mass group regime ( keV). Such quasar-like models are inconsistent with the observed X-ray scaling relations, in particular those probing the very low-mass regime via stacking analysis (e.g., Anderson et al. [103] shown via empty circles and solid line fit). Conversely, a tight self-regulation (e.g., achieved via CCA feeding) and a flickering injection via gentle AGN jets can preserve the hot-halo throughout the several 100 outburst cycles. The bottom panels show indeed that the initial cool-core (magenta contour) can be preserved even in less-bound halos, such as poor galaxy groups, without becoming overheated above half of the Hubble time. Such overheating is instead catastrophic for an impulsive AGN blast injection, transforming all hot halos into perennial non-cool-core systems, which is ruled out by observations finding groups to have almost universally a low central (Sun et al. [81], Babyk et al. [215]). Such self-regulated, gentle SMBH feedback has thus become a staple for subgrid models of cosmological simulations which can reproduce other tight scaling relations without any major break at the group scale, such as the M–Y or M–T computed over R (e.g., Planelles et al. [216], Truong et al. [28], Weinberger et al. [217]). For comparisons with further cosmological simulations, we refer the interested reader to the companion reviews by Oppenheimer et al. and Eckert et al. (Section 5).
5. Galaxy Groups with the Next-Generation Instruments
Over the next decade, dedicated survey instruments will increase the number of known groups and clusters out to high redshift, constraining the scenario for their formation and evolution. Examples include eROSITA in X-rays, Vera Rubin Observatory and Euclid in the Optical/Infrared, and several “Stage 3” ground-based mm-wave observatories. The SZ-effect surveys, in particular, will break new ground by providing robustly selected, large catalogs of clusters at , as well as the first informative absolute mass calibration from CMB-cluster lensing. All future observatories list the baryonic mass and energy distribution on groups’ scales resolved up to redshift ∼2 and beyond, when they first appeared as collapsed X-ray bright structures, as one of their main scientific goals.
Currently, a big step forward in the collection and characterization of low-mass systems is expected from the ongoing observations of the all X-ray sky with the extended ROentgen Survey with an Imaging Telescope Array (eROSITA2, Predehl et al. [220]). eROSITA is operating in the X-ray energy band (0.2–10 keV) at L2 orbit on-board the ‘Spectrum-Roentgen-Gamma’ (SRG) satellite. eROSITA has a spatial resolution comparable to the XMM–Newton one, a similar effective area at low energies, but a wider field of view, while it will be 20–30 times more sensitive than the ROSAT sky survey in the soft band and will provide the first all-sky imaging survey in the hard band. Optimizing galaxy group and cluster detection has been one of the most important tasks during the mission preparation (e.g., Clerc et al. [221], and Käfer et al. [222] in particular for a detection and characterization through ICM outskirts that reduces possible biases due the peaked X-ray emission associated with cool cores). During its 4-yr-long all-sky survey, with an average exposure of 2.5 ks (whereas the average exposure in the ecliptic plane region is ∼1.6 ks), eROSITA is planned to deliver a sample of about 3 million active galactic nuclei (AGNs) and about 125,000 galaxy systems (mostly groups) detected with more than 50 photons and M up to redshift ∼1 (median: ) [223,224,225,226,227]. Almost all groups (and clusters) detected with eROSITA will lack sufficient X-ray photons to accurately constrain temperature and mass profiles (Borm et al. [225]). Thus, cosmological studies using group and cluster of galaxies to be detected with eROSITA, will rely heavily on a detailed understanding of the scaling relations where systematic effects would have to be factored in to ensure that the cosmological applications of these relations are not hampered. Hence, a thorough investigation of these systems, to understand the interplay between the development of the hot IGrM and feedback processes, becomes highly important, not only for cosmology but also to understand complex baryonic physics. Moreover, to reach the planned goals of errors of 1%, 1%, 7%, and 25% on , , , and , respectively, the critical passages will be: (i) a better knowledge (by a factor of ∼4) of the parameters describing the L–M relation to improve the constraints on and , and (ii) a lower mass threshold to enlarge the analyzed sample to reduce the statistical uncertainties in DE sector.
The physics of IGrM and ICM will be the main scientific driver for the exposures with the Advanced Telescope for High-ENergy Astrophysics (Athena3), the X-ray observatory mission selected by ESA as the second L(large)-class mission (due for launch in early 2030s) within its Cosmic Vision programme to address the Hot and Energetic Universe scientific theme. Among the main scientific goals, Athena will have the capabilities to find evolved groups of galaxies with MM and hot gaseous atmospheres at . For about ten of those, a global gas temperature estimate is expected to be measurable [228]. Athena will determine the magnitude of the injection of non-gravitational energy into the IGrM and ICM as a function of cosmic epoch by measuring the structural properties (e.g., the entropy profiles) out to R, and their evolution up to , for a sample of galaxy groups and clusters, improving significantly the constraints, presently unknown, on the evolution of the scaling relations between bulk properties of the hot gas [228,229]. In local systems, Athena will be also in condition to determine the occurrence and impact of AGN feedback phenomena by searching for ripples in surface brightness in the cores of a statistical sample of objects. Using temperature-sensitive line ratios, Athena’s observations will trace how much gas is at each temperature in the cores of these systems, providing a complete description of the gas heating-cooling balance [230] and transport processes such as turbulence and diffusion (Cucchetti et al. [231], Roncarelli et al. [232], Mernier et al. [233]).
Presently, concepts funded for study by NASA for consideration in the 2020 Astrophysics Decadal Survey, Lynx4 (as high-energy flagship mission) and AXIS5 (as probe-class mission) are proposing to investigate with sub-arcsecond resolution over a FoV of 400–500 arcmin the X-ray sky, improving this capability of a factor ∼100 with respect to Chandra ACIS-I. Their predicted low background level and capability to resolve embedded and background AGN will allow the tracking of group and cluster emissions at very low surface-brightness values. For example, AXIS is expected to reach a flux limit of ∼ erg/s/cm (0.5–2 keV) over the 50 deg of the proposed Wide Survey (e.g., [234]), providing the detection of thousands of groups and clusters, and evidence of merging and effects of feedback resolved even at high-z. With a larger collection of instruments, Lynx will be also able to resolve the thermodynamic and kinematic structure of systems at , as well as determine the role of feedback from AGN and stars.
Complementary data will be provided from the ongoing (and planned) SZ surveys. SPT-3G6 will extend the work of SPT-SZ by covering a nearly identical area of 2500 deg but with noise levels about 12, 7, and 20 times lower at 95, 150, and 220 GHz, respectively. This will enhance the sensitivity, allowing to a reduction of the mass limit and extending the redshift coverage with respect to SPT-SZ. About 5000 clusters with M 1014M⊙ at a signal-to-noise > 4.5(corresponding to a 97% purity threshold) are expected by the completion of the survey (2023; [235]). The next-generation ground-based cosmic microwave background experiment CMB-S47, with a planned beginning of science operations in 2029, will build catalogs more than an order of magnitude larger than current ones, lowering the mass limit M to 6–8 M at and being especially adept at finding the most distant groups and clusters. Large catalogs of low-mass systems together with the progress on the measurement of the thermal SZ power spectrum will open a new window into groups.
In the optical and near-infrared bands, space missions (Euclid8-from 2022- and Nancy Grace Roman Space Telescope9-formerly WFIRST; launch date: 2025) and ground-based missions (Vera Rubin Observatory10 and the 4-metre Multi-Object Spectroscopic Telescope, 4MOST11) will map the large-scale structures over more than 15,000 deg, extending the current catalogs of systems with MM (see, e.g., results from DES12 in [48]) by orders of magnitude, in particular at high () redshifts (e.g., [236]). Of particular interest for the measurement of the velocity dispersions, is the WFIRST and 4MOST observatories. The 4MOST observatory has been designed as a survey instrument at the forefront, with plans underway to combine the power of 4MOST with eROSITA [237] to provide dynamical mass estimates for ∼10,000 clusters at redshift z < 0.6 and masses M. will also provide spectroscopic confirmation of detected groups at redshifts <0.2 down to a mass limit of 10 M. Additionally, the wide area vista extragalactic survey (WAVES, [238]) being planned using , is aiming to perform the WAVES-Wide and WAVES-Deep surveys, allowing for the construction of optically selected groups catalogs. The WAVES-WIDE(-DEEP) surveys aiming to cover an area of ∼70 (1200) deg, identifying ∼50,000 (20,000) dark matter halos down to a mass of () M and out to a redshift of 0.2 (0.8). As with X-ray selected objects, optically selected groups are physically heterogenous systems (e.g., see the dynamical analysis by Zheng and Shen [239] for a sample of compact groups). However, it is possible that the physical processes at work in the IGrM of optically- and X-ray-selected systems are different. Thus, the comparison of group samples selected via distinct methods can shed light on these physical phenomena.
6. Final Remarks
Bridging the gap in mass between field galaxies and massive clusters, galaxy groups are key systems to make progress in our understanding of structure formation and evolution. Thanks to the current generation of X-ray satellites, together with dedicated hydrodynamical simulations, there have been significant improvement in our comprehension of the interplay between the hot ambient gas, radiative cooling and feedback due to, e.g., AGN activity and SNe winds, in particular in the central regions. Indeed, the thermodynamic structure of galaxy groups is more complex than in massive galaxy clusters, with the physics associated with non-gravitational processes playing a significant role in shaping their general properties. The scaling relations capture the result of the various (thermal and non-thermal) processes and show that galaxy groups are not simply the scaled-down versions of rich clusters. Thanks to the enlarged catalogs of low-mass systems that the current (and upcoming) wide surveys at X-ray, millimeter, and optical wavelengths will provide, such scaling relations can be measured with very high precision. The comparison between results obtained from differently selected samples will shed light on the intrinsic properties of the groups’ population.
Due to the complexity of the X-ray emitting processes in the low-temperature regime, and of how AGN heating impacts the general properties of the core of poor systems, the interpretation will depend on the specific choices of the individual analyses. For instance, many X-ray studies on groups (and clusters) provide integrated measurements within a certain aperture. However, the definition of such aperture is often quite different, and the comparison between the various works is not always straightforward. In the future, it is desirable to provide the global properties using a unified definition of the regions that are efficiently accessible from observations. This will ease the comparison between different observational and theoretical studies, improving our understanding of the physical processes at work in the complex group regime. Of course, in each study there are good reasons to use a specific energy band or definition of region of interest. However, regardless of the choices made in each paper to reach specific goals, we suggest to also provide, whenever possible, both global and core-excised properties within R. Although there is evidence that the cool-core radius does not scale uniformly with the virial radius, we think that the common choice of excising 0.15R is a good starting point. For the rest-frame luminosities, we have shown that the 0.5–2 keV band is less sensitive to the choice of the abundance table and is easily accessible for all the current and future facilities (differently from the 0.1–2.4 keV band which extend to a regime where, for instance, Chandra and XMM–Newton are not well calibrated and also the choice of the abundance table start to play a role as discussed in Section 2.1). However, to ease the comparison with the literature it is useful to also provide the rest-frame bolometric and 0.1–2.4 keV band luminosities. Finally, until R will be routinely achieved for most of the systems in the low-mass regime, we also suggest providing the properties at R (i.e., ∼0.5R). Of course, there are further complications (e.g., the impact on the temperature of using a certain abundance table or spectral code, Lovisari et al. [77]; the choice of the column density, Lovisari and Reiprich [83]; the fitting technique, Balestra et al. [240]) which play a relevant role in the low-mass (but not only) systems. Nonetheless, starting to set standard definitions will definitely help the analysis in this critical regime.
Author Contributions
Conceptualization, L.L., S.E., M.G. and P.A.G.; resources, L.L., S.E., M.G. and P.A.G.; data curation, L.L., S.E., M.G. and P.A.G.; writing—original draft preparation, L.L., S.E., M.G. and P.A.G.; writing—review and editing, L.L., S.E., M.G. and P.A.G.; visualization, L.L., S.E., M.G. and P.A.G.; supervision, L.L.; project administration, L.L. All authors have read and agreed to the published version of the manuscript.
Funding
L.L. and S.E. acknowledge financial contribution from the contracts ASI-INAF Athena 2015-046-R.0, ASI-INAF Athena 2019-27-HH.0, “Attività di Studio per la comunità scientifica di Astrofisica delle Alte Energie e Fisica Astroparticellare” (Accordo Attuativo ASI-INAF n. 2017-14-H.0), and from INAF “Call per interventi aggiuntivi a sostegno della ricerca di main stream di INAF”. M.G. acknowledges partial support by NASA Chandra GO8-19104X/GO9-20114X and HST GO-15890.020-A grants. P.A.G. acknowledges support from the UK Science and Technology Facilities Council via grants ST/P000525/1 and ST/T000473/1.
Institutional Review Board Statement
Not applicable.
Informed Consent Statement
Not applicable.
Data Availability Statement
Not applicable.
Acknowledgments
The authors thank the anonymous referees for useful comments and suggestions that helped to improve and clarify the presentation of this work. We thank M. Sun for providing the luminosity values for the group sample analysed in his work. We also thank MNRAS and the AAS, together with the authors of the corresponding publications, for granting permission to use images published in their journals.
Conflicts of Interest
The authors declare no conflict of interest.
References
- Eke, V.R.; Baugh, C.M.; Cole, S.; Frenk, C.S.; Norberg, P.; Peacock, J.A.; Baldry, I.K.; Bland-Hawthorn, J.; Bridges, T.; Cannon, R.; et al. Galaxy groups in the 2dFGRS: The group-finding algorithm and the 2PIGG catalogue. MNRAS 2004, 348, 866–878. [Google Scholar] [CrossRef] [Green Version]
- Giodini, S.; Pierini, D.; Finoguenov, A.; Pratt, G.W.; Boehringer, H.; Leauthaud, A.; Guzzo, L.; Aussel, H.; Bolzonella, M.; Capak, P.; et al. Stellar and Total Baryon Mass Fractions in Groups and Clusters Since Redshift 1. ApJ 2009, 703, 982–993. [Google Scholar] [CrossRef] [Green Version]
- Eigenthaler, P.; Zeilinger, W.W. The Search for Fossil Groups of Galaxies. Astron. Nachr. 2007, 328, 699. [Google Scholar]
- Nolthenius, R.; White, S.D.M. Groups of galaxies in the CfA survey and in cold dark matter universes. MNRAS 1987, 225, 505–530. [Google Scholar] [CrossRef] [Green Version]
- Hickson, P. Systematic properties of compact groups of galaxies. ApJ 1982, 255, 382–391. [Google Scholar] [CrossRef]
- Jones, L.R.; Ponman, T.J.; Horton, A.; Babul, A.; Ebeling, H.; Burke, D.J. The nature and space density of fossil groups of galaxies. MNRAS 2003, 343, 627–638. [Google Scholar] [CrossRef] [Green Version]
- Helsdon, S.F.; Ponman, T.J. Are X-ray properties of loose groups different from those of compact groups? MNRAS 2000, 319, 933–938. [Google Scholar] [CrossRef]
- Ponman, T.J.; Cannon, D.B.; Navarro, J.F. The thermal imprint of galaxy formation on X-ray clusters. Nature 1999, 397, 135–137. [Google Scholar] [CrossRef] [Green Version]
- Sanderson, A.J.R.; Ponman, T.J.; Finoguenov, A.; Lloyd-Davies, E.J.; Markevitch, M. The Birmingham-CfA cluster scaling project—I. Gas fraction and the M-TX relation. MNRAS 2003, 340, 989–1010. [Google Scholar] [CrossRef] [Green Version]
- Despali, G.; Giocoli, C.; Angulo, R.E.; Tormen, G.; Sheth, R.K.; Baso, G.; Moscardini, L. The universality of the virial halo mass function and models for non-universality of other halo definitions. MNRAS 2016, 456, 2486–2504. [Google Scholar] [CrossRef] [Green Version]
- Tully, R.B. Nearby Groups of Galaxies. II. an All-Sky Survey within 3000 Kilometers per Second. ApJ 1987, 321, 280. [Google Scholar] [CrossRef]
- Fukugita, M.; Hogan, C.J.; Peebles, P.J.E. The Cosmic Baryon Budget. ApJ 1998, 503, 518–530. [Google Scholar] [CrossRef]
- Brighenti, F.; Mathews, W.G. Heated Cooling Flows. ApJ 2002, 573, 542–561. [Google Scholar] [CrossRef] [Green Version]
- McCarthy, I.G.; Schaye, J.; Ponman, T.J.; Bower, R.G.; Booth, C.M.; Dalla Vecchia, C.; Crain, R.A.; Springel, V.; Theuns, T.; Wiersma, R.P.C. The case for AGN feedback in galaxy groups. MNRAS 2010, 406, 822–839. [Google Scholar] [CrossRef] [Green Version]
- Gaspari, M.; Brighenti, F.; Temi, P. Mechanical AGN feedback: Controlling the thermodynamical evolution of elliptical galaxies. MNRAS 2012, 424, 190–209. [Google Scholar] [CrossRef] [Green Version]
- Hudson, D.S.; Mittal, R.; Reiprich, T.H.; Nulsen, P.E.J.; Andernach, H.; Sarazin, C.L. What is a cool-core cluster? a detailed analysis of the cores of the X-ray flux-limited HIFLUGCS cluster sample. Astron. Astrophys. 2010, 513, A37. [Google Scholar] [CrossRef] [Green Version]
- Bharadwaj, V.; Reiprich, T.H.; Schellenberger, G.; Eckmiller, H.J.; Mittal, R.; Israel, H. Intracluster medium cooling, AGN feedback, and brightest cluster galaxy properties of galaxy groups. Five properties where groups differ from clusters. Astron. Astrophys. 2014, 572, A46. [Google Scholar] [CrossRef] [Green Version]
- O’Sullivan, E.; Ponman, T.J.; Kolokythas, K.; Raychaudhury, S.; Babul, A.; Vrtilek, J.M.; David, L.P.; Giacintucci, S.; Gitti, M.; Haines, C.P. The Complete Local Volume Groups Sample—I. Sample selection and X-ray properties of the high-richness subsample. MNRAS 2017, 472, 1482–1505. [Google Scholar] [CrossRef] [Green Version]
- Bogdán, Á.; Lovisari, L.; Volonteri, M.; Dubois, Y. Correlation between the Total Gravitating Mass of Groups and Clusters and the Supermassive Black Hole Mass of Brightest Galaxies. ApJ 2018, 852, 131. [Google Scholar] [CrossRef] [Green Version]
- Gaspari, M.; Eckert, D.; Ettori, S.; Tozzi, P.; Bassini, L.; Rasia, E.; Brighenti, F.; Sun, M.; Borgani, S.; Johnson, S.D.; et al. The X-Ray Halo Scaling Relations of Supermassive Black Holes. ApJ 2019, 884, 169. [Google Scholar] [CrossRef] [Green Version]
- Lakhchaura, K.; Truong, N.; Werner, N. Correlations between supermassive black holes, hot atmospheres, and the total masses of early-type galaxies. MNRAS 2019, 488, L134–L142. [Google Scholar] [CrossRef]
- Sijacki, D.; Springel, V.; Di Matteo, T.; Hernquist, L. A unified model for AGN feedback in cosmological simulations of structure formation. MNRAS 2007, 380, 877–900. [Google Scholar] [CrossRef] [Green Version]
- Puchwein, E.; Sijacki, D.; Springel, V. Simulations of AGN Feedback in Galaxy Clusters and Groups: Impact on Gas Fractions and the LX-T Scaling Relation. ApJ 2008, 687, L53–L56. [Google Scholar] [CrossRef] [Green Version]
- Fabjan, D.; Borgani, S.; Tornatore, L.; Saro, A.; Murante, G.; Dolag, K. Simulating the effect of active galactic nuclei feedback on the metal enrichment of galaxy clusters. MNRAS 2010, 401, 1670–1690. [Google Scholar] [CrossRef]
- Le Brun, A.M.C.; McCarthy, I.G.; Schaye, J.; Ponman, T.J. Towards a realistic population of simulated galaxy groups and clusters. MNRAS 2014, 441, 1270–1290. [Google Scholar] [CrossRef] [Green Version]
- Planelles, S.; Borgani, S.; Fabjan, D.; Killedar, M.; Murante, G.; Granato, G.L.; Ragone-Figueroa, C.; Dolag, K. On the role of AGN feedback on the thermal and chemodynamical properties of the hot intracluster medium. MNRAS 2014, 438, 195–216. [Google Scholar] [CrossRef] [Green Version]
- Gaspari, M.; Brighenti, F.; Temi, P.; Ettori, S. Can AGN Feedback Break the Self-similarity of Galaxies, Groups, and Clusters? ApJ 2014, 783, L10. [Google Scholar] [CrossRef] [Green Version]
- Truong, N.; Rasia, E.; Mazzotta, P.; Planelles, S.; Biffi, V.; Fabjan, D.; Beck, A.M.; Borgani, S.; Dolag, K.; Gaspari, M.; et al. Cosmological hydrodynamical simulations of galaxy clusters: X-ray scaling relations and their evolution. MNRAS 2018, 474, 4089–4111. [Google Scholar] [CrossRef] [Green Version]
- Markevitch, M. The LX-T Relation and Temperature Function for Nearby Clusters Revisited. ApJ 1998, 504, 27–34. [Google Scholar] [CrossRef]
- Pratt, G.W.; Croston, J.H.; Arnaud, M.; Böhringer, H. Galaxy cluster X-ray luminosity scaling relations from a representative local sample (REXCESS). Astron. Astrophys. 2009, 498, 361–378. [Google Scholar] [CrossRef]
- Mittal, R.; Hicks, A.; Reiprich, T.H.; Jaritz, V. The LX - Tvir relation in galaxy clusters: Effects of radiative cooling and AGN heating. Astron. Astrophys. 2011, 532, A133. [Google Scholar] [CrossRef] [Green Version]
- Bharadwaj, V.; Reiprich, T.H.; Lovisari, L.; Eckmiller, H.J. Extending the LX - T relation from clusters to groups. Impact of cool core nature, AGN feedback, and selection effects. Astron. Astrophys. 2015, 573, A75. [Google Scholar] [CrossRef] [Green Version]
- Mantz, A.B.; Allen, S.W.; Morris, R.G.; von der Linden, A.; Applegate, D.E.; Kelly, P.L.; Burke, D.L.; Donovan, D.; Ebeling, H. Weighing the giants- V. Galaxy cluster scaling relations. MNRAS 2016, 463, 3582–3603. [Google Scholar] [CrossRef] [Green Version]
- Lovisari, L.; Schellenberger, G.; Sereno, M.; Ettori, S.; Pratt, G.W.; Forman, W.R.; Jones, C.; Andrade-Santos, F.; Randall, S.; Kraft, R. X-Ray Scaling Relations for a Representative Sample of Planck-selected Clusters Observed with XMM-Newton. ApJ 2020, 892, 102. [Google Scholar] [CrossRef] [Green Version]
- Eckert, D.; Molendi, S.; Paltani, S. The cool-core bias in X-ray galaxy cluster samples. I. Method and application to HIFLUGCS. Astron. Astrophys. 2011, 526, A79. [Google Scholar] [CrossRef] [Green Version]
- Reiprich, T.H.; Böhringer, H. The Mass Function of an X-Ray Flux-limited Sample of Galaxy Clusters. ApJ 2002, 567, 716–740. [Google Scholar] [CrossRef] [Green Version]
- Allen, S.W.; Rapetti, D.A.; Schmidt, R.W.; Ebeling, H.; Morris, R.G.; Fabian, A.C. Improved constraints on dark energy from Chandra X-ray observations of the largest relaxed galaxy clusters. MRAS 2008, 383, 879–896. [Google Scholar] [CrossRef] [Green Version]
- Vikhlinin, A.; Kravtsov, A.V.; Burenin, R.A.; Ebeling, H.; Forman, W.R.; Hornstrup, A.; Jones, C.; Murray, S.S.; Nagai, D.; Quintana, H.; et al. Chandra Cluster Cosmology Project III: Cosmological Parameter Constraints. ApJ 2009, 692, 1060–1074. [Google Scholar] [CrossRef] [Green Version]
- Rozo, E.; Wechsler, R.H.; Rykoff, E.S.; Annis, J.T.; Becker, M.R.; Evrard, A.E.; Frieman, J.A.; Hansen, S.M.; Hao, J.; Johnston, D.E.; et al. Cosmological Constraints from the Sloan Digital Sky Survey maxBCG Cluster Catalog. ApJ 2010, 708, 645–660. [Google Scholar] [CrossRef]
- Mantz, A.B.; von der Linden, A.; Allen, S.W.; Applegate, D.E.; Kelly, P.L.; Morris, R.G.; Rapetti, D.A.; Schmidt, R.W.; Adhikari, S.; Allen, M.T.; et al. Weighing the giants—IV. Cosmology and neutrino mass. MNRAS 2015, 446, 2205–2225. [Google Scholar] [CrossRef] [Green Version]
- de Haan, T.; Benson, B.A.; Bleem, L.E.; Allen, S.W.; Applegate, D.E.; Ashby, M.L.N.; Bautz, M.; Bayliss, M.; Bocquet, S.; Brodwin, M.; et al. Cosmological Constraints from Galaxy Clusters in the 2500 Square-degree SPT-SZ Survey. ApJ 2016, 832, 95. [Google Scholar] [CrossRef]
- Planck Collaboration Planck 2015 results. XXIV. Cosmology from Sunyaev-Zeldovich cluster counts. Astron. Astrophys. 2016, 594, A24. [CrossRef] [Green Version]
- Böhringer, H.; Chon, G.; Fukugita, M. The extended ROSAT-ESO Flux-Limited X-ray Galaxy Cluster Survey (REFLEX II). VII. The mass function of galaxy clusters. Astron. Astrophys. 2017, 608, A65. [Google Scholar] [CrossRef] [Green Version]
- Schellenberger, G.; Reiprich, T.H. HICOSMO: Cosmology with a complete sample of galaxy clusters—II. Cosmological results. MNRAS 2017, 471, 1370–1389. [Google Scholar] [CrossRef]
- Pacaud, F.; Pierre, M.; Melin, J.B.; Adami, C.; Evrard, A.E.; Galli, S.; Gastaldello, F.; Maughan, B.J.; Sereno, M.; Alis, S.; et al. The XXL Survey. XXV. Cosmological analysis of the C1 cluster number counts. Astron. Astrophys. 2018, 620, A10. [Google Scholar] [CrossRef]
- Bocquet, S.; Dietrich, J.P.; Schrabback, T.; Bleem, L.E.; Klein, M.; Allen, S.W.; Applegate, D.E.; Ashby, M.L.N.; Bautz, M.; Bayliss, M.; et al. Cluster Cosmology Constraints from the 2500 deg2 SPT-SZ Survey: Inclusion of Weak Gravitational Lensing Data from Magellan and the Hubble Space Telescope. ApJ 2019, 878, 55. [Google Scholar] [CrossRef] [Green Version]
- Abbott, T.M.C.; Abdalla, F.B.; Alarcon, A.; Aleksić, J.; Allam, S.; Allen, S.; Amara, A.; Annis, J.; Asorey, J.; Avila, S.; et al. Dark Energy Survey year 1 results: Cosmological constraints from galaxy clustering and weak lensing. Phys. Rev. D 2018, 98, 043526. [Google Scholar] [CrossRef] [Green Version]
- Abbott, T.M.C.; Aguena, M.; Alarcon, A.; Allam, S.; Allen, S.; Annis, J.; Avila, S.; Bacon, D.; Bechtol, K.; Bermeo, A.; et al. Dark Energy Survey Year 1 Results: Cosmological constraints from cluster abundances and weak lensing. Phys. Rev. D 2020, 102, 023509. [Google Scholar] [CrossRef]
- McClintock, T.; Varga, T.N.; Gruen, D.; Rozo, E.; Rykoff, E.S.; Shin, T.; Melchior, P.; DeRose, J.; Seitz, S.; Dietrich, J.P.; et al. Dark Energy Survey Year 1 results: Weak lensing mass calibration of redMaPPer galaxy clusters. MNRAS 2019, 482, 1352–1378. [Google Scholar] [CrossRef] [Green Version]
- Farahi, A.; Chen, X.; Evrard, A.E.; Hollowood, D.L.; Wilkinson, R.; Bhargava, S.; Giles, P.; Romer, A.K.; Jeltema, T.; Hilton, M.; et al. Mass variance from archival X-ray properties of Dark Energy Survey Year-1 galaxy clusters. MNRAS 2019, 490, 3341–3354. [Google Scholar] [CrossRef]
- Mulchaey, J.S. X-ray Properties of Groups of Galaxies. Annu. Rev. Astron. Astrophys. 2000, 38, 289–335. [Google Scholar] [CrossRef] [Green Version]
- Sun, M. Hot gas in galaxy groups: Recent observations. New J. Phys. 2012, 14, 045004. [Google Scholar] [CrossRef]
- Kaiser, N. Evolution and clustering of rich clusters. MNRAS 1986, 222, 323–345. [Google Scholar] [CrossRef]
- Kitayama, T.; Suto, Y. Semianalytic Predictions for Statistical Properties of X-Ray Clusters of Galaxies in Cold Dark Matter Universes. ApJ 1996, 469, 480. [Google Scholar] [CrossRef]
- Bryan, G.L.; Norman, M.L. Statistical Properties of X-Ray Clusters: Analytic and Numerical Comparisons. ApJ 1998, 495, 80–99. [Google Scholar] [CrossRef]
- Voit, G.M. Tracing cosmic evolution with clusters of galaxies. Rev. Mod. Phys. 2005, 77, 207–258. [Google Scholar] [CrossRef] [Green Version]
- Maughan, B.J.; Jones, L.R.; Ebeling, H.; Scharf, C. The evolution of the cluster X-ray scaling relations in the Wide Angle ROSAT Pointed Survey sample at 0.6 < z < 1.0. MNRAS 2006, 365, 509–529. [Google Scholar] [CrossRef] [Green Version]
- Borgani, S.; Diaferio, A.; Dolag, K.; Schindler, S. Thermodynamical Properties of the ICM from Hydrodynamical Simulations. Space Sci. Rev. 2008, 134, 269–293. [Google Scholar] [CrossRef] [Green Version]
- Böhringer, H.; Dolag, K.; Chon, G. Modelling self-similar appearance of galaxy clusters in X-rays. Astron. Astrophys. 2012, 539, A120. [Google Scholar] [CrossRef] [Green Version]
- Ettori, S. The generalized scaling relations for X-ray galaxy clusters: The most powerful mass proxy. MNRAS 2013, 435, 1265–1277. [Google Scholar] [CrossRef] [Green Version]
- Giodini, S.; Lovisari, L.; Pointecouteau, E.; Ettori, S.; Reiprich, T.H.; Hoekstra, H. Scaling Relations for Galaxy Clusters: Properties and Evolution. Space Sci. Rev. 2013, 177, 247–282. [Google Scholar] [CrossRef] [Green Version]
- Maughan, B.J. PICACS: Self-consistent modelling of galaxy cluster scaling relations. MNRAS 2014, 437, 1171–1186. [Google Scholar] [CrossRef] [Green Version]
- Ettori, S. The physics inside the scaling relations for X-ray galaxy clusters: Gas clumpiness, gas mass fraction and slope of the pressure profile. MNRAS 2015, 446, 2629–2639. [Google Scholar] [CrossRef] [Green Version]
- Ettori, S.; Lovisari, L.; Sereno, M. From universal profiles to universal scaling laws in X-ray galaxy clusters. Astron. Astrophys. 2020, 644, A111. [Google Scholar] [CrossRef]
- Sarazin, C.L. X-ray emission from clusters of galaxies. Rev. Mod. Phys. 1986, 58, 1–115. [Google Scholar] [CrossRef] [Green Version]
- Peterson, J.R.; Fabian, A.C. X-ray spectroscopy of cooling clusters. Phys. Rep. 2006, 427, 1–39. [Google Scholar] [CrossRef] [Green Version]
- Kaastra, J.S.; Paerels, F.B.S.; Durret, F.; Schindler, S.; Richter, P. Thermal Radiation Processes. Space Sci. Rev. 2008, 134, 155–190. [Google Scholar] [CrossRef] [Green Version]
- Böhringer, H.; Werner, N. X-ray spectroscopy of galaxy clusters: Studying astrophysical processes in the largest celestial laboratories. Astron. Astrophys. Rev. 2010, 18, 127–196. [Google Scholar] [CrossRef] [Green Version]
- Smith, R.K.; Brickhouse, N.S.; Liedahl, D.A.; Raymond, J.C. Collisional Plasma Models with APEC/APED: Emission-Line Diagnostics of Hydrogen-like and Helium-like Ions. ApJ 2001, 556, L91–L95. [Google Scholar] [CrossRef] [Green Version]
- Arnaud, K.A. XSPEC: The First Ten Years. In Astronomical Data Analysis Software and Systems V; Astronomical Society of the Pacific Conference Series; Jacoby, G.H., Barnes, J., Eds.; NASA/GSFC: Greenbelt, MD, USA, 1996; Volume 101, p. 17. [Google Scholar]
- Asplund, M.; Grevesse, N.; Sauval, A.J.; Scott, P. The Chemical Composition of the Sun. Annu. Rev. Astron. Astrophys. 2009, 47, 481–522. [Google Scholar] [CrossRef] [Green Version]
- Vikhlinin, A.; Kravtsov, A.; Forman, W.; Jones, C.; Markevitch, M.; Murray, S.S.; Van Speybroeck, L. Chandra Sample of Nearby Relaxed Galaxy Clusters: Mass, Gas Fraction, and Mass-Temperature Relation. ApJ 2006, 640, 691–709. [Google Scholar] [CrossRef] [Green Version]
- Gonzalez, A.H.; Zaritsky, D.; Zabludoff, A.I. A Census of Baryons in Galaxy Clusters and Groups. ApJ 2007, 666, 147–155. [Google Scholar] [CrossRef] [Green Version]
- Gastaldello, F.; Buote, D.A.; Humphrey, P.J.; Zappacosta, L.; Bullock, J.S.; Brighenti, F.; Mathews, W.G. Probing the Dark Matter and Gas Fraction in Relaxed Galaxy Groups with X-Ray Observations from Chandra and XMM-Newton. ApJ 2007, 669, 158–183. [Google Scholar] [CrossRef] [Green Version]
- Dai, X.; Bregman, J.N.; Kochanek, C.S.; Rasia, E. On the Baryon Fractions in Clusters and Groups of Galaxies. ApJ 2010, 719, 119–125. [Google Scholar] [CrossRef] [Green Version]
- Gonzalez, A.H.; Sivanandam, S.; Zabludoff, A.I.; Zaritsky, D. Galaxy Cluster Baryon Fractions Revisited. ApJ 2013, 778, 14. [Google Scholar] [CrossRef] [Green Version]
- Lovisari, L.; Reiprich, T.H.; Schellenberger, G. Scaling properties of a complete X-ray selected galaxy group sample. Astron. Astrophys. 2015, 573, A118. [Google Scholar] [CrossRef]
- Eckert, D.; Ettori, S.; Coupon, J.; Gastaldello, F.; Pierre, M.; Melin, J.B.; Le Brun, A.M.C.; McCarthy, I.G.; Adami, C.; Chiappetti, L.; et al. The XXL Survey. XIII. Baryon content of the bright cluster sample. Astron. Astrophys. 2016, 592, A12. [Google Scholar] [CrossRef]
- Zou, S.; Maughan, B.J.; Giles, P.A.; Vikhlinin, A.; Pacaud, F.; Burenin, R.; Hornstrup, A. The X-ray luminosity-temperature relation of a complete sample of low-mass galaxy clusters. MNRAS 2016, 463, 820–831. [Google Scholar] [CrossRef] [Green Version]
- Rasmussen, J.; Ponman, T.J. Temperature and abundance profiles of hot gas in galaxy groups—I. Results and statistical analysis. MNRAS 2007, 380, 1554–1572. [Google Scholar] [CrossRef] [Green Version]
- Sun, M.; Voit, G.M.; Donahue, M.; Jones, C.; Forman, W.; Vikhlinin, A. Chandra Studies of the X-Ray Gas Properties of Galaxy Groups. ApJ 2009, 693, 1142–1172. [Google Scholar] [CrossRef] [Green Version]
- Mernier, F.; de Plaa, J.; Kaastra, J.S.; Zhang, Y.Y.; Akamatsu, H.; Gu, L.; Kosec, P.; Mao, J.; Pinto, C.; Reiprich, T.H.; et al. Radial metal abundance profiles in the intra-cluster medium of cool-core galaxy clusters, groups, and ellipticals. Astron. Astrophys. 2017, 603, A80. [Google Scholar] [CrossRef] [Green Version]
- Lovisari, L.; Reiprich, T.H. The non-uniformity of galaxy cluster metallicity profiles. MNRAS 2019, 483, 540–557. [Google Scholar] [CrossRef]
- Grevesse, N.; Sauval, A.J. Standard Solar Composition. Space Sci. Rev. 1998, 85, 161–174. [Google Scholar] [CrossRef]
- Lodders, K.; Palme, H.; Gail, H.P. Abundances of the Elements in the Solar System. arXiv 2009, arXiv:0901.1149. [Google Scholar]
- Anders, E.; Grevesse, N. Abundances of the elements: Meteoritic and solar. Geochim. Cosmochim. Acta 1989, 53, 197–214. [Google Scholar] [CrossRef]
- Lloyd-Davies, E.J.; Ponman, T.J.; Cannon, D.B. The entropy and energy of intergalactic gas in galaxy clusters. MNRAS 2000, 315, 689–702. [Google Scholar] [CrossRef] [Green Version]
- Ponman, T.J.; Sanderson, A.J.R.; Finoguenov, A. The Birmingham-CfA cluster scaling project—III. Entropy and similarity in galaxy systems. MNRAS 2003, 343, 331–342. [Google Scholar] [CrossRef] [Green Version]
- Finoguenov, A.; Ponman, T.J.; Osmond, J.P.F.; Zimer, M. XMM-Newton study of 0.012 < z < 0.024 groups—I. Overview of the IGM thermodynamics. MNRAS 2007, 374, 737–760. [Google Scholar] [CrossRef]
- Johnson, R.; Ponman, T.J.; Finoguenov, A. A statistical analysis of the Two-Dimensional XMM-Newton Group Survey: The impact of feedback on group properties. MNRAS 2009, 395, 1287–1308. [Google Scholar] [CrossRef] [Green Version]
- Panagoulia, E.K.; Fabian, A.C.; Sanders, J.S. A volume-limited sample of X-ray galaxy groups and clusters—I. Radial entropy and cooling time profiles. MNRAS 2014, 438, 2341–2354. [Google Scholar] [CrossRef] [Green Version]
- Helsdon, S.F.; Ponman, T.J. The intragroup medium in loose groups of galaxies. MNRAS 2000, 315, 356–370. [Google Scholar] [CrossRef] [Green Version]
- Xue, Y.J.; Wu, X.P. The LX-T, LX-σ, and σ-T Relations for Groups and Clusters of Galaxies. ApJ 2000, 538, 65–71. [Google Scholar] [CrossRef] [Green Version]
- Osmond, J.P.F.; Ponman, T.J. The GEMS project: X-ray analysis and statistical properties of the group sample. MNRAS 2004, 350, 1511–1535. [Google Scholar] [CrossRef] [Green Version]
- Shang, C.; Scharf, C. A Low-Redshift Galaxy Cluster X-Ray Temperature Function Incorporating Suzaku Data. ApJ 2009, 690, 879–890. [Google Scholar] [CrossRef] [Green Version]
- Eckmiller, H.J.; Hudson, D.S.; Reiprich, T.H. Testing the low-mass end of X-ray scaling relations with a sample of Chandra galaxy groups. Astron. Astrophys. 2011, 535, A105. [Google Scholar] [CrossRef] [Green Version]
- Ikebe, Y.; Reiprich, T.H.; Böhringer, H.; Tanaka, Y.; Kitayama, T. A new measurement of the X-ray temperature function of clusters of galaxies. Astron. Astrophys. 2002, 383, 773–790. [Google Scholar] [CrossRef] [Green Version]
- Stanek, R.; Evrard, A.E.; Böhringer, H.; Schuecker, P.; Nord, B. The X-Ray Luminosity-Mass Relation for Local Clusters of Galaxies. ApJ 2006, 648, 956–968. [Google Scholar] [CrossRef]
- Pacaud, F.; Pierre, M.; Adami, C.; Altieri, B.; Andreon, S.; Chiappetti, L.; Detal, A.; Duc, P.A.; Galaz, G.; Gueguen, A.; et al. The XMM-LSS survey: The Class 1 cluster sample over the initial 5 deg2 and its cosmological modelling. MNRAS 2007, 382, 1289–1308. [Google Scholar] [CrossRef] [Green Version]
- Schellenberger, G.; Reiprich, T.H. HICOSMO—Cosmology with a complete sample of galaxy clusters—I. Data analysis, sample selection and luminosity-mass scaling relation. MNRAS 2017, 469, 3738–3761. [Google Scholar] [CrossRef]
- Kettula, K.; Giodini, S.; van Uitert, E.; Hoekstra, H.; Finoguenov, A.; Lerchster, M.; Erben, T.; Heymans, C.; Hildebrandt, H.; Kitching, T.D.; et al. CFHTLenS: Weak lensing calibrated scaling relations for low-mass clusters of galaxies. MNRAS 2015, 451, 1460–1481. [Google Scholar] [CrossRef] [Green Version]
- Rasmussen, J.; Ponman, T.J.; Mulchaey, J.S.; Miles, T.A.; Raychaudhury, S. First results of the XI Groups Project: Studying an unbiased sample of galaxy groups. MNRAS 2006, 373, 653–665. [Google Scholar] [CrossRef] [Green Version]
- Anderson, M.E.; Gaspari, M.; White, S.D.M.; Wang, W.; Dai, X. Unifying X-ray scaling relations from galaxies to clusters. MNRAS 2015, 449, 3806–3826. [Google Scholar] [CrossRef] [Green Version]
- Andreon, S.; Serra, A.L.; Moretti, A.; Trinchieri, G. The amazing diversity in the hot gas content of an X-ray unbiased massive galaxy clusters sample. Astron. Astrophys. 2016, 585, A147. [Google Scholar] [CrossRef] [Green Version]
- Valtchanov, I.; Pierre, M.; Gastaud, R. Comparison of source detection procedures for XMM-Newton images. Astron. Astrophys. 2001, 370, 689–706. [Google Scholar] [CrossRef]
- Šuhada, R.; Song, J.; Böhringer, H.; Mohr, J.J.; Chon, G.; Finoguenov, A.; Fassbender, R.; Desai, S.; Armstrong, R.; Zenteno, A.; et al. The XMM-BCS galaxy cluster survey. I. The X-ray selected cluster catalog from the initial 6 deg2. Astron. Astrophys. 2012, 537, A39. [Google Scholar] [CrossRef] [Green Version]
- Xu, W.; Ramos-Ceja, M.E.; Pacaud, F.; Reiprich, T.H.; Erben, T. A new X-ray-selected sample of very extended galaxy groups from the ROSAT All-Sky Survey. Astron. Astrophys. 2018, 619, A162. [Google Scholar] [CrossRef] [Green Version]
- Miniati, F.; Finoguenov, A.; Silverman, J.D.; Carollo, M.; Cibinel, A.; Lilly, S.J.; Schawinski, K. The X-Ray Zurich Environmental Study (X-ZENS). II. X-Ray Observations of the Diffuse Intragroup Medium in Galaxy Groups. ApJ 2016, 819, 26. [Google Scholar] [CrossRef] [Green Version]
- Pearson, R.J.; Ponman, T.J.; Norberg, P.; Robotham, A.S.G.; Babul, A.; Bower, R.G.; McCarthy, I.G.; Brough, S.; Driver, S.P.; Pimbblet, K. Galaxy And Mass Assembly: Search for a population of high-entropy galaxy groups. MNRAS 2017, 469, 3489–3504. [Google Scholar] [CrossRef] [Green Version]
- Migkas, K.; Schellenberger, G.; Reiprich, T.H.; Pacaud, F.; Ramos-Ceja, M.E.; Lovisari, L. Probing cosmic isotropy with a new X-ray galaxy cluster sample through the LX-T scaling relation. Astron. Astrophys. 2020, 636, A15. [Google Scholar] [CrossRef] [Green Version]
- Schellenberger, G.; Reiprich, T.H.; Lovisari, L.; Nevalainen, J.; David, L. XMM-Newton and Chandra cross-calibration using HIFLUGCS galaxy clusters. Systematic temperature differences and cosmological impact. Astron. Astrophys. 2015, 575, A30. [Google Scholar] [CrossRef] [Green Version]
- Sereno, M. A Bayesian approach to linear regression in astronomy. MNRAS 2016, 455, 2149–2162. [Google Scholar] [CrossRef] [Green Version]
- Kettula, K.; Nevalainen, J.; Miller, E.D. Cross-calibration of Suzaku/XIS and XMM-Newton/EPIC using galaxy clusters. Astron. Astrophys. 2013, 552, A47. [Google Scholar] [CrossRef] [Green Version]
- Umetsu, K.; Sereno, M.; Lieu, M.; Miyatake, H.; Medezinski, E.; Nishizawa, A.J.; Giles, P.; Gastaldello, F.; McCarthy, I.G.; Kilbinger, M.; et al. Weak-lensing Analysis of X-Ray-selected XXL Galaxy Groups and Clusters with Subaru HSC Data. ApJ 2020, 890, 148. [Google Scholar] [CrossRef]
- Sereno, M.; Umetsu, K.; Ettori, S.; Eckert, D.; Gastaldello, F.; Giles, P.; Lieu, M.; Maughan, B.; Okabe, N.; Birkinshaw, M.; et al. XXL Survey groups and clusters in the Hyper Suprime-Cam Survey. Scaling relations between X-ray properties and weak lensing mass. MNRAS 2020, 492, 4528–4545. [Google Scholar] [CrossRef]
- Nevalainen, J.; David, L.; Guainazzi, M. Cross-calibrating X-ray detectors with clusters of galaxies: An IACHEC study. Astron. Astrophys. 2010, 523, A22. [Google Scholar] [CrossRef] [Green Version]
- Colafrancesco, S.; Giordano, F. Structure and evolution of magnetized clusters: Entropy profiles, S - T and LX - T relations. Astron. Astrophys. 2007, 466, 421–435. [Google Scholar] [CrossRef]
- Mahdavi, A.; Finoguenov, A.; Böhringer, H.; Geller, M.J.; Henry, J.P. XMM-Newton and Gemini Observations of Eight RASSCALS Galaxy Groups. ApJ 2005, 622, 187–204. [Google Scholar] [CrossRef]
- Pratt, G.W.; Arnaud, M.; Piffaretti, R.; Böhringer, H.; Ponman, T.J.; Croston, J.H.; Voit, G.M.; Borgani, S.; Bower, R.G. Gas entropy in a representative sample of nearby X-ray galaxy clusters (REXCESS): Relationship to gas mass fraction. Astron. Astrophys. 2010, 511, A85. [Google Scholar] [CrossRef]
- Mantz, A.B.; Allen, S.W.; Morris, R.G.; Schmidt, R.W. Cosmology and astrophysics from relaxed galaxy clusters—III. Thermodynamic profiles and scaling relations. MNRAS 2016, 456, 4020–4039. [Google Scholar] [CrossRef] [Green Version]
- Mantz, A.B.; Allen, S.W.; Morris, R.G.; von der Linden, A. Centre-excised X-ray luminosity as an efficient mass proxy for future galaxy cluster surveys. MNRAS 2018, 473, 3072–3079. [Google Scholar] [CrossRef]
- Bulbul, E.; Chiu, I.N.; Mohr, J.J.; McDonald, M.; Benson, B.; Bautz, M.W.; Bayliss, M.; Bleem, L.; Brodwin, M.; Bocquet, S.; et al. X-Ray Properties of SPT-selected Galaxy Clusters at 0.2 < z < 1.5 Observed with XMM-Newton. ApJ 2019, 871, 50. [Google Scholar] [CrossRef] [Green Version]
- Leauthaud, A.; Finoguenov, A.; Kneib, J.P.; Taylor, J.E.; Massey, R.; Rhodes, J.; Ilbert, O.; Bundy, K.; Tinker, J.; George, M.R.; et al. A Weak Lensing Study of X-ray Groups in the Cosmos Survey: Form and Evolution of the Mass-Luminosity Relation. ApJ 2010, 709, 97–114. [Google Scholar] [CrossRef] [Green Version]
- Pierre, M.; Pacaud, F.; Adami, C.; Alis, S.; Altieri, B.; Baran, N.; Benoist, C.; Birkinshaw, M.; Bongiorno, A.; Bremer, M.N.; et al. The XXL Survey. I. Scientific motivations—XMM-Newton observing plan—Follow-up observations and simulation programme. Astron. Astrophys. 2016, 592, A1. [Google Scholar] [CrossRef] [Green Version]
- Schaye, J.; Dalla Vecchia, C.; Booth, C.M.; Wiersma, R.P.C.; Theuns, T.; Haas, M.R.; Bertone, S.; Duffy, A.R.; McCarthy, I.G.; van de Voort, F. The physics driving the cosmic star formation history. MNRAS 2010, 402, 1536–1560. [Google Scholar] [CrossRef] [Green Version]
- Semboloni, E.; Hoekstra, H.; Schaye, J.; van Daalen, M.P.; McCarthy, I.G. Quantifying the effect of baryon physics on weak lensing tomography. MNRAS 2011, 417, 2020–2035. [Google Scholar] [CrossRef] [Green Version]
- Finoguenov, A.; Reiprich, T.H.; Böhringer, H. Details of the mass-temperature relation for clusters of galaxies. Astron. Astrophys. 2001, 368, 749–759. [Google Scholar] [CrossRef] [Green Version]
- Kettula, K.; Finoguenov, A.; Massey, R.; Rhodes, J.; Hoekstra, H.; Taylor, J.E.; Spinelli, P.F.; Tanaka, M.; Ilbert, O.; Capak, P.; et al. Weak Lensing Calibrated M-T Scaling Relation of Galaxy Groups in the COSMOS Fieldsstarf. ApJ 2013, 778, 74. [Google Scholar] [CrossRef] [Green Version]
- Spitzer, L. Physics of Fully Ionized Gases; Courier Corporation: North Chelmsford, MA, USA, 1962. [Google Scholar]
- Kravtsov, A.V.; Vikhlinin, A.; Nagai, D. A New Robust Low-Scatter X-Ray Mass Indicator for Clusters of Galaxies. ApJ 2006, 650, 128–136. [Google Scholar] [CrossRef]
- Jeltema, T.E.; Mulchaey, J.S.; Lubin, L.M.; Rosati, P.; Böhringer, H. X-Ray Properties of Intermediate-Redshift Groups of Galaxies. ApJ 2006, 649, 649–660. [Google Scholar] [CrossRef] [Green Version]
- Alshino, A.; Ponman, T.; Pacaud, F.; Pierre, M. Evolution of the X-ray profiles of poor clusters from the XMM-LSS survey. MNRAS 2010, 407, 2543–2556. [Google Scholar] [CrossRef] [Green Version]
- Beers, T.C.; Flynn, K.; Gebhardt, K. Measures of Location and Scale for Velocities in Clusters of Galaxies—A Robust Approach. AJ 1990, 100, 32. [Google Scholar] [CrossRef]
- Ruel, J.; Bazin, G.; Bayliss, M.; Brodwin, M.; Foley, R.J.; Stalder, B.; Aird, K.A.; Armstrong, R.; Ashby, M.L.N.; Bautz, M.; et al. Optical Spectroscopy and Velocity Dispersions of Galaxy Clusters from the SPT-SZ Survey. ApJ 2014, 792, 45. [Google Scholar] [CrossRef] [Green Version]
- Quintana, H.; Melnick, J. The correlation between X-ray luminosity and velicity dispersion in clusters of galaxies. AJ 1982, 87, 972–979. [Google Scholar] [CrossRef]
- Mulchaey, J.S.; Zabludoff, A.I. The Properties of Poor Groups of Galaxies. II. X-Ray and Optical Comparisons. ApJ 1998, 496, 73–92. [Google Scholar] [CrossRef]
- Mahdavi, A.; Geller, M.J. The LX-σ Relation for Galaxies and Clusters of Galaxies. ApJ 2001, 554, L129–L132. [Google Scholar] [CrossRef]
- Ortiz-Gil, A.; Guzzo, L.; Schuecker, P.; Böhringer, H.; Collins, C.A. The X-ray luminosity-velocity dispersion relation in the REFLEX cluster survey. MNRAS 2004, 348, 325–332. [Google Scholar] [CrossRef] [Green Version]
- Zhang, Y.Y.; Andernach, H.; Caretta, C.A.; Reiprich, T.H.; Böhringer, H.; Puchwein, E.; Sijacki, D.; Girardi, M. HIFLUGCS: Galaxy cluster scaling relations between X-ray luminosity, gas mass, cluster radius, and velocity dispersion. Astron. Astrophys. 2011, 526, A105. [Google Scholar] [CrossRef] [Green Version]
- Nastasi, A.; Böhringer, H.; Fassbender, R.; de Hoon, A.; Lamer, G.; Mohr, J.J.; Padilla, N.; Pratt, G.W.; Quintana, H.; Rosati, P.; et al. Kinematic analysis of a sample of X-ray luminous distant galaxy clusters. The LX-σv relation in the z > 0.6 universe. Astron. Astrophys. 2014, 564, A17. [Google Scholar] [CrossRef] [Green Version]
- Kirkpatrick, C.C.; Clerc, N.; Finoguenov, A.; Damsted, S.; Ider Chitham, J.; Kukkola, A.E.; Gueguen, A.; Furnell, K.; Rykoff, E.; Comparat, J.; et al. SPIDERS: An overview of the largest catalogue of spectroscopically confirmed x-ray galaxy clusters. MNRAS 2021, 503, 5763–5777. [Google Scholar] [CrossRef]
- Ponman, T.J.; Bourner, P.D.J.; Ebeling, H.; Böhringer, H. A ROSAT survey of Hickson’s compact galaxy groups. MNRAS 1996, 283, 690–708. [Google Scholar] [CrossRef] [Green Version]
- Sohn, J.; Geller, M.J.; Zahid, H.J. A Spectroscopic Census of X-Ray Systems in the COSMOS Field. ApJ 2019, 880, 142. [Google Scholar] [CrossRef] [Green Version]
- Connelly, J.L.; Wilman, D.J.; Finoguenov, A.; Hou, A.; Mulchaey, J.S.; McGee, S.L.; Balogh, M.L.; Parker, L.C.; Saglia, R.; Henderson, R.D.E.; et al. Exploring the Diversity of Groups at 0.1 < z < 0.8 with X-Ray and Optically Selected Samples. ApJ 2012, 756, 139. [Google Scholar] [CrossRef] [Green Version]
- Carlberg, R.G.; Yee, H.K.C.; Morris, S.L.; Lin, H.; Sawicki, M.; Wirth, G.; Patton, D.; Shepherd, C.W.; Ellingson, E.; Schade, D. The CNOC2 field galaxy redshift survey. Philos. Trans. R. Soc. Lond. Ser. A 1999, 357, 167. [Google Scholar] [CrossRef] [Green Version]
- Finoguenov, A.; Guzzo, L.; Hasinger, G.; Scoville, N.Z.; Aussel, H.; Böhringer, H.; Brusa, M.; Capak, P.; Cappelluti, N.; Comastri, A.; et al. The XMM-Newton Wide-Field Survey in the COSMOS Field: Statistical Properties of Clusters of Galaxies. ApJS 2007, 172, 182–195. [Google Scholar] [CrossRef] [Green Version]
- Scoville, N.; Aussel, H.; Brusa, M.; Capak, P.; Carollo, C.M.; Elvis, M.; Giavalisco, M.; Guzzo, L.; Hasinger, G.; Impey, C.; et al. The Cosmic Evolution Survey (COSMOS): Overview. ApJS 2007, 172, 1–8. [Google Scholar] [CrossRef]
- George, M.R.; Leauthaud, A.; Bundy, K.; Finoguenov, A.; Tinker, J.; Lin, Y.T.; Mei, S.; Kneib, J.P.; Aussel, H.; Behroozi, P.S.; et al. Galaxies in X-Ray Groups. I. Robust Membership Assignment and the Impact of Group Environments on Quenching. ApJ 2011, 742, 125. [Google Scholar] [CrossRef]
- Vajgel, B.; Jones, C.; Lopes, P.A.A.; Forman, W.R.; Murray, S.S.; Goulding, A.; Andrade-Santos, F. X-Ray-selected Galaxy Groups in Boötes. ApJ 2014, 794, 88. [Google Scholar] [CrossRef] [Green Version]
- Murray, S.S.; Kenter, A.; Forman, W.R.; Jones, C.; Green, P.J.; Kochanek, C.S.; Vikhlinin, A.; Fabricant, D.; Fazio, G.; Brand, K.; et al. XBootes: An X-Ray Survey of the NDWFS Bootes Field. I. Overview and Initial Results. ApJS 2005, 161, 1–8. [Google Scholar] [CrossRef]
- Wilson, S.; Hilton, M.; Rooney, P.J.; Caldwell, C.; Kay, S.T.; Collins, C.A.; McCarthy, I.G.; Romer, A.K.; Bermeo, A.; Bernstein, R.; et al. The XMM Cluster Survey: Evolution of the velocity dispersion-temperature relation over half a Hubble time. MNRAS 2016, 463, 413–428. [Google Scholar] [CrossRef] [Green Version]
- Romer, A.K.; Viana, P.T.P.; Liddle, A.R.; Mann, R.G. A Serendipitous Galaxy Cluster Survey with XMM: Expected Catalogue Properties and Scientific Applications. Astrophys. J. 1999. [Google Scholar]
- Farahi, A.; Guglielmo, V.; Evrard, A.E.; Poggianti, B.M.; Adami, C.; Ettori, S.; Gastaldello, F.; Giles, P.A.; Maughan, B.J.; Rapetti, D.; et al. The XXL Survey: XXIII. The Mass Scale of XXL Clusters from Ensemble Spectroscopy. Astron. Astrophys. 2018, 620, A8. [Google Scholar] [CrossRef] [Green Version]
- Adami, C.; Giles, P.; Koulouridis, E.; Pacaud, F.; Caretta, C.A.; Pierre, M.; Eckert, D.; Ramos-Ceja, M.E.; Gastaldello, F.; Fotopoulou, S.; et al. The XXL Survey. XX. The 365 cluster catalogue. Astron. Astrophys. 2018, 620, A5. [Google Scholar] [CrossRef]
- Mamon, G. Dynamical Theory of groups and Clusters of Galaxies. arXiv 1993, arXiv:astro-ph/9308032. [Google Scholar]
- Mamon, G.A.; Biviano, A.; Boué, G. MAMPOSSt: Modelling Anisotropy and Mass Profiles of Observed Spherical Systems—I. Gaussian 3D velocities. MNRAS 2013, 429, 3079–3098. [Google Scholar] [CrossRef] [Green Version]
- Goulding, A.D.; Greene, J.E.; Ma, C.P.; Veale, M.; Bogdan, A.; Nyland, K.; Blakeslee, J.P.; McConnell, N.J.; Thomas, J. The MASSIVE Survey. IV. The X-ray Halos of the Most Massive Early-type Galaxies in the Nearby Universe. ApJ 2016, 826, 167. [Google Scholar] [CrossRef] [Green Version]
- Ma, C.P.; Greene, J.E.; McConnell, N.; Janish, R.; Blakeslee, J.P.; Thomas, J.; Murphy, J.D. The MASSIVE Survey. I. A Volume-limited Integral-field Spectroscopic Study of the Most Massive Early-type Galaxies within 108 Mpc. ApJ 2014, 795, 158. [Google Scholar] [CrossRef] [Green Version]
- Le Brun, A.M.C.; McCarthy, I.G.; Schaye, J.; Ponman, T.J. The scatter and evolution of the global hot gas properties of simulated galaxy cluster populations. MNRAS 2017, 466, 4442–4469. [Google Scholar] [CrossRef]
- Farahi, A.; Evrard, A.E.; McCarthy, I.; Barnes, D.J.; Kay, S.T. Localized massive halo properties in BAHAMAS and MACSIS simulations: Scalings, lognormality, and covariance. MNRAS 2018, 478, 2618–2632. [Google Scholar] [CrossRef] [Green Version]
- Kar Chowdhury, R.; Chatterjee, S.; Lonappan, A.I.; Khandai, N.; Di Matteo, T. Cosmological Simulation of Galaxy Groups and Clusters. I. Global Effect of Feedback from Active Galactic Nuclei. ApJ 2020, 889, 60. [Google Scholar] [CrossRef]
- Helsdon, S.F.; Ponman, T.J.; Mulchaey, J.S. Chandra Observations of Low Velocity Dispersion Groups. ApJ 2005, 618, 679–691. [Google Scholar] [CrossRef]
- Mantz, A.; Allen, S.W.; Ebeling, H.; Rapetti, D.; Drlica-Wagner, A. The observed growth of massive galaxy clusters—II. X-ray scaling relations. MNRAS 2010, 406, 1773–1795. [Google Scholar] [CrossRef] [Green Version]
- Giles, P.A.; Maughan, B.J.; Dahle, H.; Bonamente, M.; Landry, D.; Jones, C.; Joy, M.; Murray, S.S.; van der Pyl, N. Chandra measurements of a complete sample of X-ray luminous galaxy clusters: The luminosity-mass relation. MNRAS 2017, 465, 858–884. [Google Scholar] [CrossRef] [Green Version]
- Ettori, S.; Morandi, A.; Tozzi, P.; Balestra, I.; Borgani, S.; Rosati, P.; Lovisari, L.; Terenziani, F. The cluster gas mass fraction as a cosmological probe: A revised study. Astron. Astrophys. 2009, 501, 61–73. [Google Scholar] [CrossRef]
- Mantz, A.B.; Allen, S.W.; Morris, R.G.; Rapetti, D.A.; Applegate, D.E.; Kelly, P.L.; von der Linden, A.; Schmidt, R.W. Cosmology and astrophysics from relaxed galaxy clusters—II. Cosmological constraints. MNRAS 2014, 440, 2077–2098. [Google Scholar] [CrossRef] [Green Version]
- Lin, Y.T.; Mohr, J.J.; Stanford, S.A. Near-Infrared Properties of Galaxy Clusters: Luminosity as a Binding Mass Predictor and the State of Cluster Baryons. ApJ 2003, 591, 749–763. [Google Scholar] [CrossRef]
- Behroozi, P.S.; Conroy, C.; Wechsler, R.H. A Comprehensive Analysis of Uncertainties Affecting the Stellar Mass-Halo Mass Relation for 0 < z < 4. ApJ 2010, 717, 379–403. [Google Scholar] [CrossRef] [Green Version]
- Zhang, Y.Y.; Laganá, T.F.; Pierini, D.; Puchwein, E.; Schneider, P.; Reiprich, T.H. Star-formation efficiency and metal enrichment of the intracluster medium in local massive clusters of galaxies. Astron. Astrophys. 2011, 535, A78. [Google Scholar] [CrossRef] [Green Version]
- Leauthaud, A.; George, M.R.; Behroozi, P.S.; Bundy, K.; Tinker, J.; Wechsler, R.H.; Conroy, C.; Finoguenov, A.; Tanaka, M. The Integrated Stellar Content of Dark Matter Halos. ApJ 2012, 746, 95. [Google Scholar] [CrossRef]
- Laganá, T.F.; Martinet, N.; Durret, F.; Lima Neto, G.B.; Maughan, B.; Zhang, Y.Y. A comprehensive picture of baryons in groups and clusters of galaxies. Astron. Astrophys. 2013, 555, A66. [Google Scholar] [CrossRef]
- Chiu, I.; Mohr, J.J.; McDonald, M.; Bocquet, S.; Desai, S.; Klein, M.; Israel, H.; Ashby, M.L.N.; Stanford, A.; Benson, B.A.; et al. Baryon content in a sample of 91 galaxy clusters selected by the South Pole Telescope at 0.2 < z < 1.25. MNRAS 2018, 478, 3072–3099. [Google Scholar] [CrossRef] [Green Version]
- Decker, B.; Brodwin, M.; Abdulla, Z.; Gonzalez, A.H.; Marrone, D.P.; O’Donnell, C.; Stanford, S.A.; Wylezalek, D.; Carlstrom, J.E.; Eisenhardt, P.R.M.; et al. The Massive and Distant Clusters of WISE Survey. VI. Stellar Mass Fractions of a Sample of High-redshift Infrared-selected Clusters. ApJ 2019, 878, 72. [Google Scholar] [CrossRef]
- Vikhlinin, A.; McNamara, B.R.; Forman, W.; Jones, C.; Quintana, H.; Hornstrup, A. A Catalog of 200 Galaxy Clusters Serendipitously Detected in the ROSAT PSPC Pointed Observations. ApJ 1998, 502, 558–581. [Google Scholar] [CrossRef]
- Lilly, S.J.; Le Fèvre, O.; Renzini, A.; Zamorani, G.; Scodeggio, M.; Contini, T.; Carollo, C.M.; Hasinger, G.; Kneib, J.P.; Iovino, A.; et al. zCOSMOS: A Large VLT/VIMOS Redshift Survey Covering 0 < z < 3 in the COSMOS Field. ApJS 2007, 172, 70–85. [Google Scholar] [CrossRef] [Green Version]
- Navarro, J.F.; Frenk, C.S.; White, S.D.M. The Structure of Cold Dark Matter Halos. ApJ 1996, 462, 563. [Google Scholar] [CrossRef] [Green Version]
- Navarro, J.F.; Frenk, C.S.; White, S.D.M. A Universal Density Profile from Hierarchical Clustering. ApJ 1997, 490, 493–508. [Google Scholar] [CrossRef]
- Chiu, I.; Saro, A.; Mohr, J.; Desai, S.; Bocquet, S.; Capasso, R.; Gangkofner, C.; Gupta, N.; Liu, J. Stellar mass to halo mass scaling relation for X-ray-selected low-mass galaxy clusters and groups out to redshift z ≈ 1. MNRAS 2016, 458, 379–393. [Google Scholar] [CrossRef] [Green Version]
- Liu, J.; Mohr, J.; Saro, A.; Aird, K.A.; Ashby, M.L.N.; Bautz, M.; Bayliss, M.; Benson, B.A.; Bleem, L.E.; Bocquet, S.; et al. Analysis of Sunyaev-Zel’dovich effect mass-observable relations using South Pole Telescope observations of an X-ray selected sample of low-mass galaxy clusters and groups. MNRAS 2015, 448, 2085–2099. [Google Scholar] [CrossRef]
- Kravtsov, A.V.; Vikhlinin, A.A.; Meshcheryakov, A.V. Stellar Mass—Halo Mass Relation and Star Formation Efficiency in High-Mass Halos. Astron. Lett. 2018, 44, 8–34. [Google Scholar] [CrossRef] [Green Version]
- Pillepich, A.; Nelson, D.; Hernquist, L.; Springel, V.; Pakmor, R.; Torrey, P.; Weinberger, R.; Genel, S.; Naiman, J.P.; Marinacci, F.; et al. First results from the IllustrisTNG simulations: The stellar mass content of groups and clusters of galaxies. MNRAS 2018, 475, 648–675. [Google Scholar] [CrossRef]
- Ziparo, F.; Smith, G.P.; Mulroy, S.L.; Lieu, M.; Willis, J.P.; Hudelot, P.; McGee, S.L.; Fotopoulou, S.; Lidman, C.; Lavoie, S.; et al. The XXL Survey. X. K-band luminosity—Weak-lensing mass relation for groups and clusters of galaxies. Astron. Astrophys. 2016, 592, A9. [Google Scholar] [CrossRef] [Green Version]
- Muzzin, A.; Yee, H.K.C.; Hall, P.B.; Lin, H. Near-Infrared Properties of Moderate-Redshift Galaxy Clusters. II. Halo Occupation Number, Mass-to-Light Ratios, and Ωm. ApJ 2007, 663, 150–163. [Google Scholar] [CrossRef] [Green Version]
- Gaspari, M.; Ruszkowski, M.; Oh, S.P. Chaotic cold accretion on to black holes. MNRAS 2013, 432, 3401–3422. [Google Scholar] [CrossRef] [Green Version]
- Prasad, D.; Sharma, P.; Babul, A. Cool Core Cycles: Cold Gas and AGN Jet Feedback in Cluster Cores. ApJ 2015, 811, 108. [Google Scholar] [CrossRef]
- Voit, G.M.; Meece, G.; Li, Y.; O’Shea, B.W.; Bryan, G.L.; Donahue, M. A Global Model for Circumgalactic and Cluster-core Precipitation. ApJ 2017, 845, 80. [Google Scholar] [CrossRef] [Green Version]
- Temi, P.; Amblard, A.; Gitti, M.; Brighenti, F.; Gaspari, M.; Mathews, W.G.; David, L. ALMA Observations of Molecular Clouds in Three Group-centered Elliptical Galaxies: NGC 5846, NGC 4636, and NGC 5044. ApJ 2018, 858, 17. [Google Scholar] [CrossRef]
- Tremblay, G.R.; Combes, F.; Oonk, J.B.R.; Russell, H.R.; McDonald, M.A.; Gaspari, M.; Husemann, B.; Nulsen, P.E.J.; McNamara, B.R.; Hamer, S.L.; et al. A Galaxy-scale Fountain of Cold Molecular Gas Pumped by a Black Hole. ApJ 2018, 865, 13. [Google Scholar] [CrossRef] [Green Version]
- Gaspari, M.; McDonald, M.; Hamer, S.L.; Brighenti, F.; Temi, P.; Gendron-Marsolais, M.; Hlavacek-Larrondo, J.; Edge, A.C.; Werner, N.; Tozzi, P.; et al. Shaken Snow Globes: Kinematic Tracers of the Multiphase Condensation Cascade in Massive Galaxies, Groups, and Clusters. ApJ 2018, 854, 167. [Google Scholar] [CrossRef]
- Rose, T.; Edge, A.C.; Combes, F.; Gaspari, M.; Hamer, S.; Nesvadba, N.; Peck, A.B.; Sarazin, C.; Tremblay, G.R.; Baum, S.A.; et al. Constraining cold accretion on to supermassive black holes: Molecular gas in the cores of eight brightest cluster galaxies revealed by joint CO and CN absorption. MNRAS 2019, 489, 349–365. [Google Scholar] [CrossRef] [Green Version]
- Storchi-Bergmann, T.; Schnorr-Müller, A. Observational constraints on the feeding of supermassive black holes. Nat. Astron. 2019, 3, 48–61. [Google Scholar] [CrossRef] [Green Version]
- Tombesi, F.; Cappi, M.; Reeves, J.N.; Nemmen, R.S.; Braito, V.; Gaspari, M.; Reynolds, C.S. Unification of X-ray winds in Seyfert galaxies: From ultra-fast outflows to warm absorbers. MNRAS 2013, 430, 1102–1117. [Google Scholar] [CrossRef]
- Sa̧dowski, A.; Gaspari, M. Kinetic and radiative power from optically thin accretion flows. MNRAS 2017, 468, 1398–1404. [Google Scholar] [CrossRef] [Green Version]
- Fiore, F.; Feruglio, C.; Shankar, F.; Bischetti, M.; Bongiorno, A.; Brusa, M.; Carniani, S.; Cicone, C.; Duras, F.; Lamastra, A.; et al. AGN wind scaling relations and the co-evolution of black holes and galaxies. Astron. Astrophys. 2017, 601, A143. [Google Scholar] [CrossRef]
- McNamara, B.R.; Nulsen, P.E.J. Mechanical feedback from active galactic nuclei in galaxies, groups and clusters. New J. Phys. 2012, 14, 055023. [Google Scholar] [CrossRef] [Green Version]
- Fabian, A.C. Observational Evidence of Active Galactic Nuclei Feedback. Annu. Rev. Astron. Astrophys. 2012, 50, 455–489. [Google Scholar] [CrossRef] [Green Version]
- Gitti, M.; Brighenti, F.; McNamara, B.R. Evidence for AGN Feedback in Galaxy Clusters and Groups. Adv. Astronomy 2012, 2012, 1–24. [Google Scholar] [CrossRef] [Green Version]
- Brighenti, F.; Mathews, W.G.; Temi, P. Hot Gaseous Atmospheres in Galaxy Groups and Clusters Are Both Heated and Cooled by X-Ray Cavities. ApJ 2015, 802, 118. [Google Scholar] [CrossRef] [Green Version]
- Gaspari, M. Shaping the X-ray spectrum of galaxy clusters with AGN feedback and turbulence. MNRAS 2015, 451, L60–L64. [Google Scholar] [CrossRef] [Green Version]
- Liu, W.; Sun, M.; Nulsen, P.; Clarke, T.; Sarazin, C.; Forman, W.; Gaspari, M.; Giacintucci, S.; Lal, D.V.; Edge, T. AGN feedback in galaxy group 3C 88: Cavities, shock, and jet reorientation. MNRAS 2019, 484, 3376–3392. [Google Scholar] [CrossRef] [Green Version]
- Yang, H.Y.K.; Gaspari, M.; Marlow, C. The Impact of Radio AGN Bubble Composition on the Dynamics and Thermal Balance of the Intracluster Medium. ApJ 2019, 871, 6. [Google Scholar] [CrossRef] [Green Version]
- Wittor, D.; Gaspari, M. Dissecting the turbulent weather driven by mechanical AGN feedback. MNRAS 2020, 498, 4983–5002. [Google Scholar] [CrossRef]
- Voit, G.M.; Bryan, G.L.; Prasad, D.; Frisbie, R.; Li, Y.; Donahue, M.; O’Shea, B.W.; Sun, M.; Werner, N. A Black Hole Feedback Valve in Massive Galaxies. ApJ 2020, 899, 70. [Google Scholar] [CrossRef]
- Kormendy, J.; Ho, L.C. Coevolution (Or Not) of Supermassive Black Holes and Host Galaxies. Annu. Rev. Astron. Astrophys. 2013, 51, 511–653. [Google Scholar] [CrossRef] [Green Version]
- Saglia, R.P.; Opitsch, M.; Erwin, P.; Thomas, J.; Beifiori, A.; Fabricius, M.; Mazzalay, X.; Nowak, N.; Rusli, S.P.; Bender, R. The SINFONI Black Hole Survey: The Black Hole Fundamental Plane Revisited and the Paths of (Co)evolution of Supermassive Black Holes and Bulges. ApJ 2016, 818, 47. [Google Scholar] [CrossRef] [Green Version]
- Bondi, H. On spherically symmetrical accretion. MNRAS 1952, 112, 195. [Google Scholar] [CrossRef]
- Narayan, R.; Fabian, A.C. Bondi flow from a slowly rotating hot atmosphere. MNRAS 2011, 415, 3721–3730. [Google Scholar] [CrossRef] [Green Version]
- Voit, G.M. A Role for Turbulence in Circumgalactic Precipitation. ApJ 2018, 868, 102. [Google Scholar] [CrossRef] [Green Version]
- Olivares, V.; Salome, P.; Combes, F.; Hamer, S.; Guillard, P.; Lehnert, M.D.; Polles, F.L.; Beckmann, R.S.; Dubois, Y.; Donahue, M.; et al. Ubiquitous cold and massive filaments in cool core clusters. Astron. Astrophys. 2019, 631, A22. [Google Scholar] [CrossRef] [Green Version]
- Bassini, L.; Rasia, E.; Borgani, S.; Ragone-Figueroa, C.; Biffi, V.; Dolag, K.; Gaspari, M.; Granato, G.L.; Murante, G.; Taffoni, G.; et al. Black hole mass of central galaxies and cluster mass correlation in cosmological hydro-dynamical simulations. Astron. Astrophys. 2019, 630, A144. [Google Scholar] [CrossRef] [Green Version]
- Truong, N.; Pillepich, A.; Werner, N. Correlations between supermassive black holes and hot gas atmospheres in IllustrisTNG and X-ray observations. MNRAS 2021, 501, 2210–2230. [Google Scholar] [CrossRef]
- Gaspari, M.; Tombesi, F.; Cappi, M. Linking macro-, meso- and microscales in multiphase AGN feeding and feedback. Nature Astronomy 2020, 4, 10–13. [Google Scholar] [CrossRef] [Green Version]
- Kravtsov, A.V.; Borgani, S. Formation of Galaxy Clusters. Annu. Rev. Astron. Astrophys. 2012, 50, 353–409. [Google Scholar] [CrossRef] [Green Version]
- Tremmel, M.; Karcher, M.; Governato, F.; Volonteri, M.; Quinn, T.R.; Pontzen, A.; Anderson, L.; Bellovary, J. The Romulus cosmological simulations: A physical approach to the formation, dynamics and accretion models of SMBHs. MNRAS 2017, 470, 1121–1139. [Google Scholar] [CrossRef] [Green Version]
- Babyk, I.V.; McNamara, B.R.; Nulsen, P.E.J.; Russell, H.R.; Vantyghem, A.N.; Hogan, M.T.; Pulido, F.A. A Universal Entropy Profile for the Hot Atmospheres of Galaxies and Clusters within R 2500. ApJ 2018, 862, 39. [Google Scholar] [CrossRef] [Green Version]
- Planelles, S.; Fabjan, D.; Borgani, S.; Murante, G.; Rasia, E.; Biffi, V.; Truong, N.; Ragone-Figueroa, C.; Granato, G.L.; Dolag, K.; et al. Pressure of the hot gas in simulations of galaxy clusters. MNRAS 2017, 467, 3827–3847. [Google Scholar] [CrossRef]
- Weinberger, R.; Springel, V.; Pakmor, R.; Nelson, D.; Genel, S.; Pillepich, A.; Vogelsberger, M.; Marinacci, F.; Naiman, J.; Torrey, P.; et al. Supermassive black holes and their feedback effects in the IllustrisTNG simulation. MNRAS 2018, 479, 4056–4072. [Google Scholar] [CrossRef] [Green Version]
- Mulchaey, J.S.; Davis, D.S.; Mushotzky, R.F.; Burstein, D. An X-Ray Atlas of Groups of Galaxies. ApJS 2003, 145, 39–64. [Google Scholar] [CrossRef] [Green Version]
- Maughan, B.J.; Giles, P.A.; Randall, S.W.; Jones, C.; Forman, W.R. Self-similar scaling and evolution in the galaxy cluster X-ray luminosity-temperature relation. MNRAS 2012, 421, 1583–1602. [Google Scholar] [CrossRef] [Green Version]
- Predehl, P.; Andritschke, R.; Arefiev, V.; Babyshkin, V.; Batanov, O.; Becker, W.; Böhringer, H.; Bogomolov, A.; Boller, T.; Borm, K.; et al. The eROSITA X-ray telescope on SRG. arXiv 2020, arXiv:2010.03477. [Google Scholar] [CrossRef]
- Clerc, N.; Ramos-Ceja, M.E.; Ridl, J.; Lamer, G.; Brunner, H.; Hofmann, F.; Comparat, J.; Pacaud, F.; Käfer, F.; Reiprich, T.H.; et al. Synthetic simulations of the extragalactic sky seen by eROSITA. I. Pre-launch selection functions from Monte-Carlo simulations. Astron. Astrophys. 2018, 617, A92. [Google Scholar] [CrossRef]
- Käfer, F.; Finoguenov, A.; Eckert, D.; Clerc, N.; Ramos-Ceja, M.E.; Sanders, J.S.; Ghirardini, V. Toward the low-scatter selection of X-ray clusters. Galaxy cluster detection with eROSITA through cluster outskirts. Astron. Astrophys. 2020, 634, A8. [Google Scholar] [CrossRef]
- Merloni, A.; Predehl, P.; Becker, W.; Böhringer, H.; Boller, T.; Brunner, H.; Brusa, M.; Dennerl, K.; Freyberg, M.; Friedrich, P.; et al. eROSITA Science Book: Mapping the Structure of the Energetic Universe. arXiv 2012, arXiv:1209.3114. [Google Scholar]
- Pillepich, A.; Porciani, C.; Reiprich, T.H. The X-ray cluster survey with eRosita: Forecasts for cosmology, cluster physics and primordial non-Gaussianity. MNRAS 2012, 422, 44–69. [Google Scholar] [CrossRef] [Green Version]
- Borm, K.; Reiprich, T.H.; Mohammed, I.; Lovisari, L. Constraining galaxy cluster temperatures and redshifts with eROSITA survey data. Astron. Astrophys. 2014, 567, A65. [Google Scholar] [CrossRef] [Green Version]
- Zandanel, F.; Fornasa, M.; Prada, F.; Reiprich, T.H.; Pacaud, F.; Klypin, A. MultiDark clusters: Galaxy cluster mock light-cones, eROSITA, and the cluster power spectrum. MNRAS 2018, 480, 987–1005. [Google Scholar] [CrossRef]
- Pillepich, A.; Reiprich, T.H.; Porciani, C.; Borm, K.; Merloni, A. Forecasts on dark energy from the X-ray cluster survey with eROSITA: Constraints from counts and clustering. MNRAS 2018, 481, 613–626. [Google Scholar] [CrossRef] [Green Version]
- Pointecouteau, E.; Reiprich, T.H.; Adami, C.; Arnaud, M.; Biffi, V.; Borgani, S.; Borm, K.; Bourdin, H.; Brueggen, M.; Bulbul, E.; et al. The Hot and Energetic Universe: The evolution of galaxy groups and clusters. arXiv 2013, arXiv:1306.2319. [Google Scholar]
- Ettori, S.; Pratt, G.W.; de Plaa, J.; Eckert, D.; Nevalainen, J.; Battistelli, E.S.; Borgani, S.; Croston, J.H.; Finoguenov, A.; Kaastra, J.; et al. The Hot and Energetic Universe: The astrophysics of galaxy groups and clusters. arXiv 2013, arXiv:1306.2322. [Google Scholar]
- Croston, J.H.; Sanders, J.S.; Heinz, S.; Hardcastle, M.J.; Zhuravleva, I.; Bîrzan, L.; Bower, R.G.; Brüggen, M.; Churazov, E.; Edge, A.C.; et al. The Hot and Energetic Universe: AGN feedback in galaxy clusters and groups. arXiv 2013, arXiv:1306.2323. [Google Scholar]
- Cucchetti, E.; Pointecouteau, E.; Peille, P.; Clerc, N.; Rasia, E.; Biffi, V.; Borgani, S.; Tornatore, L.; Dolag, K.; Roncarelli, M.; et al. Athena X-IFU synthetic observations of galaxy clusters to probe the chemical enrichment of the Universe. Astron. Astrophys. 2018, 620, A173. [Google Scholar] [CrossRef] [Green Version]
- Roncarelli, M.; Gaspari, M.; Ettori, S.; Biffi, V.; Brighenti, F.; Bulbul, E.; Clerc, N.; Cucchetti, E.; Pointecouteau, E.; Rasia, E. Measuring turbulence and gas motions in galaxy clusters via synthetic Athena X-IFU observations. Astron. Astrophys. 2018, 618, A39. [Google Scholar] [CrossRef] [Green Version]
- Mernier, F.; Cucchetti, E.; Tornatore, L.; Biffi, V.; Pointecouteau, E.; Clerc, N.; Peille, P.; Rasia, E.; Barret, D.; Borgani, S.; et al. Constraining the origin and models of chemical enrichment in galaxy clusters using the Athena X-IFU. Astron. Astrophys. 2020, 642, A90. [Google Scholar] [CrossRef]
- Marchesi, S.; Gilli, R.; Lanzuisi, G.; Dauser, T.; Ettori, S.; Vito, F.; Cappelluti, N.; Comastri, A.; Mushotzky, R.; Ptak, A.; et al. Mock catalogs for the extragalactic X-ray sky: Simulating AGN surveys with ATHENA and with the AXIS probe. Astron. Astrophys. 2020, 642, A184. [Google Scholar] [CrossRef]
- Benson, B.A.; Ade, P.A.R.; Ahmed, Z.; Allen, S.W.; Arnold, K.; Austermann, J.E.; Bender, A.N.; Bleem, L.E.; Carlstrom, J.E.; Chang, C.L.; et al. SPT-3G: A next-generation cosmic microwave background polarization experiment on the South Pole telescope. In Millimeter, Submillimeter, and Far-Infrared Detectors and Instrumentation for Astronomy VII; Society of Photo-Optical Instrumentation Engineers (SPIE) Conference Series; Holland, W.S., Zmuidzinas, J., Eds.; International Society for Optics and Photonics: London, UK, 2014; Volume 9153. [Google Scholar] [CrossRef] [Green Version]
- Sartoris, B.; Biviano, A.; Fedeli, C.; Bartlett, J.G.; Borgani, S.; Costanzi, M.; Giocoli, C.; Moscardini, L.; Weller, J.; Ascaso, B.; et al. Next generation cosmology: Constraints from the Euclid galaxy cluster survey. MNRAS 2016, 459, 1764–1780. [Google Scholar] [CrossRef] [Green Version]
- Finoguenov, A.; Merloni, A.; Comparat, J.; Nandra, K.; Salvato, M.; Tempel, E.; Raichoor, A.; Richard, J.; Kneib, J.P.; Pillepich, A.; et al. 4MOST Consortium Survey 5: eROSITA Galaxy Cluster Redshift Survey. Messenger 2019, 175, 39–41. [Google Scholar] [CrossRef]
- Driver, S.P.; Liske, J.; Davies, L.J.M.; Robotham, A.S.G.; Baldry, I.K.; Brown, M.J.I.; Cluver, M.; Kuijken, K.; Loveday, J.; McMahon, R.; et al. 4MOST Consortium Survey 7: Wide-Area VISTA Extragalactic Survey (WAVES). Messenger 2019, 175, 46–49. [Google Scholar] [CrossRef]
- Zheng, Y.L.; Shen, S.Y. Compact Groups of Galaxies in Sloan Digital Sky Survey and LAMOST Spectral Survey. II. Dynamical Properties of Isolated and Embedded Groups. ApJ 2021, 911, 105. [Google Scholar] [CrossRef]
- Balestra, I.; Tozzi, P.; Ettori, S.; Rosati, P.; Borgani, S.; Mainieri, V.; Norman, C.; Viola, M. Tracing the evolution in the iron content of the intra-cluster medium. Astron. Astrophys. 2007, 462, 429–442. [Google Scholar] [CrossRef] [Green Version]
| 1 | Three main processes contribute to the X-ray emission: thermal bremsstrahlung (due to the deflection of a free electron by the electric field of a ion), recombination (due to the capture of an electron by an ion), and two-photon decay (due to the changing of the quantum level of an electron in an ion). See details in the reviews from, e.g., Sarazin [65], Peterson and Fabian [66], Kaastra et al. [67], and Böhringer and Werner [68]. |
| 2 | http://www.mpe.mpg.de/erosita/, accessed on 3 May 2021. |
| 3 | https://www.the-athena-x-ray-observatory.eu/, accessed on 3 May 2021. |
| 4 | https://www.lynxobservatory.com/, accessed on 3 May 2021. |
| 5 | http://axis.astro.umd.edu, accessed on 3 May 2021. |
| 6 | https://pole.uchicago.edu/, accessed on 3 May 2021. |
| 7 | https://www.euclid-ec.org/, accessed on 3 May 2021. |
| 8 | https://roman.gsfc.nasa.gov/, accessed on 3 May 2021. |
| 9 | https://www.lsst.org, accessed on 3 May 2021. |
| 10 | https://www.4most.eu/cms/, accessed on 3 May 2021. |
| 11 | https://www.darkenergysurvey.org/, accessed on 3 May 2021. |
| 12 | https://www.darkenergysurvey.org/, accessed on 3 May 2021. |
Figure 1.
(left panel): total X-ray emissivity as function of the plasma temperature in different energy bands (bolometric in blue, 0.1–2.4 keV in magenta, and 0.5–2 keV in green). The curves are calculated using an APEC (Smith et al. [69]) model (v3.0.9) in XSPEC (Arnaud [70]) for two different values of metallicity: 1.0 (solid lines) and 0.3 times the solar abundance as in Asplund et al. [71]. All curves are normalized to the bolometric emissivity at kT = 20 keV with Z = 1 Z. (middle panel): the emissivity slope as a function of temperature showing the impact of the different and T in the low-temperature regime. (right panel): bremsstrahlung emission fraction (L/L) as a function of the temperature, illustrating the increasing contribution of line emission to the total luminosity for low-temperature plasmas.

Figure 2.
Ratio between the rest-frame L (left panels: bolometric, middle panels: 0.1–2.4 keV band, right panels: 0.5–2 keV band) derived using the abundances as in Asplund et al. [71] and L obtained with the abundances of (Grevesse and Sauval [84], pink), (Lodders et al. [85], turquoise), and (Anders and Grevesse [86], orange), respectively. In the top panels we show the results for systems at z = 0.02 with a metallicity of 1.0 (solid lines) or 0.3 times the solar abundance. The dashdot line in the middle panels refers to the simulations with a modified table of ANGR in which the Fe abundance was set equal to the value of ASPL, showing that indeed most of the differences arise from the significant discrepancy in Fe between ANGR and the other tables. The 0.5–2 keV band (i.e., the band used to rescale the APEC normalization) provide the best agreement between the different tables. In the bottom panels, we show the impact on L of changing abundance table for systems at different redshifts: z = 0.02 (solid line), z = 0.3 (dashed), and z = 1 (dotted, dashdotted). The simulations were performed with Z = 1Z. The plot shows how the differences increases with z, although the effect is generally smaller than ∼5% unless very high z are considered. The residual difference between ASPL and the modified ANGR table for high z objects is due to the differences in elements other than Fe (e.g., C, N, O, Ne, Mg, Si, S).

Figure 3.
XMM–Newton (circles) and Chandra (squares) measurements of the L–T (left panel) and L–T (right panel) relations for different samples of groups: (Eckmiller et al. [96], E11), (Lovisari et al. [77], L15), (Sun et al. [81], S09), (Johnson et al. [90], J09), (Bharadwaj et al. [32], B15), (Zou et al. [79], Z16), (Pearson et al. [109], P17). The groups measurements are compared with the ones from X-ray-selected (Migkas et al. [110], M20) and SZ-selected (Lovisari et al. [34], L20) cluster samples. We note that different studies used different atomic models (including APEC v1.3.1 which provide a significantly different modeling of the Fe-L line with respect to newer versions). The luminosities are all within R while temperatures are obtained in different regions (see Table 2). The Chandra measurements are converted to XMM–Newton-like temperatures using the relations given in Schellenberger et al. [111]. Empty symbols are from optically selected samples. The lines represent the fitted relation for T 3 keV systems (dotted), T 3 keV systems (dashed-dotted), all systems (solid), and are compared with the case predicted by the self-similar scenario (dashed). The fits have been performed with LIRA (Sereno [112]) assuming self-similar time evolution and, conservatively, without the scatter on the X variable, and are meant for visualization purposes only. In brown we provide the expected values for the slope using the dependence of the emissivity tabulated in Table 1 for different ranges of temperatures (showed as brown vertical lines).

Figure 4.
XMM–Newton (circles) and Chandra (squares) measurements of the L–M (left panel) and M–T (right panel) relations for different samples of groups: (Eckmiller et al. [96], E11), (Lovisari et al. [77], L15), (Sun et al. [81], S09), (Kettula et al. [113], K13). The groups measurements are compared with the ones from an X-ray-selected (Schellenberger and Reiprich [100], S17) and an SZ-selected (Lovisari et al. [34], L20) cluster sample. Luminosities and masses are all within R while temperatures are obtained in different regions (see Table 2). Please note that different studies used different methods to estimate the total masses. The lines represent the fitted relation for M < 10M systems (dotted), M > 10M systems (dashed-dotted), all systems (solid), and are compared with the case predicted by the self-similar scenario (dashed). Because of the strong covariance between M and T we did not convert the Chandra temperatures to XMM–Newton-like temperatures.

Figure 5.
Compilation of the measured slopes of the luminosity-velocity dispersion (L–, left panel) and velocity dispersion-temperature (–T, right panel) relation in the literature. In each case, the dashed vertical line highlights the usual self-similar expectation on the slope for each relation (Equation (8), left panel, and Equation (9), right panel). The horizontal lines represent a dividing line between the mass scales used for the comparison in each relation. As shown in Section 3.1 when the L– scaling can be given as L (with dependent on the energy band and emissivity). The blue shaded region represents the self-similar expectation when considering bolometric luminosities for clusters (assuming T = 3.0–10.0 keV, L) and groups (assuming T = 0.7–3.0 keV, L). The grey shaded region represents the self-similar expectation when considering 0.1–2.4 keV luminosities for clusters (assuming T = 3.0–10.0 keV, L) and groups (assuming T = 0.7–3.0 keV, L). Unless otherwise stated, references consider (bolometric) luminosities and temperatures derived within an estimate of R. Please note that the [143] relation is based upon an analysis using 7 bins of using the full sample of 74 systems. * refers to references using 0.1–2.4 keV band luminosities.

Figure 6.
The M–M relation of various studies in the literature. Two lines of stellar mass fraction are highlighted by the dashed lines. Please note that the [182] relation is derived from the conversion of L to M assuming a constant mass-to-light ratio of 0.73 (as used in [182]).

Figure 7.
Scaling relations between the central (dynamical/direct) SMBH mass and key macro X-ray halo properties—adapted from Gaspari et al. [20]. Top-left to bottom-right panels: gas X-ray luminosity (in the 0.3–7.0 keV band), gas mass, total mass (dominated by the dark matter component), gas electron density, Compton parameter, and gas fraction. The extraction radius is within the macro-scale . The 85 circles include the observed direct/dynamical SMBH mass with the X-ray halo detected in the host galaxy groups (and a handful of clusters). The circle colors depict the morphological type of the central galaxy: elliptical/blue, lenticular/green, spiral/cyan. The employed Bayesian analysis accounts for the observed errors, providing a statistically robust estimate of the intercept and slope of the linear fitting (top-left inset). The solid red line with dark band shows the 16–84 percentile interval of the fit, while the 1- intrinsic scatter is shown via the wider light red band (dotted lines are the 3- levels).

Figure 8.
Effects of different baryonic models in shaping the evolution of the hot halos, in particular the X-ray luminosity–temperature relation (top panels) and cool-coreness via the central cooling time (bottom panels); adapted from Anderson et al. [103] and Gaspari et al. [27]. The colored individual objects in the top panels are from a wide range of observational works (Helsdon and Ponman [92], Osmond and Ponman [94], Mulchaey et al. [218], Pratt et al. [30], Sun et al. [81], Maughan et al. [219]; luminosities are extracted mostly in the 0.5–2 keV band). The empty circles and solid line show the raw Anderson et al. [103] stacking analysis and the unbiased fit, respectively. The filled black points show evolutionary tracks in large-scale HD simulations (Gaspari et al. [27]) implementing self-regulated AGN jets (left) or strong thermal blast feedback (right), preserving or evacuating the surrounding diffuse gaseous halo, respectively. The initial state is marked with magenta contour. Evacuation and overheating becomes particularly dramatic in low-mass, less-bound groups.


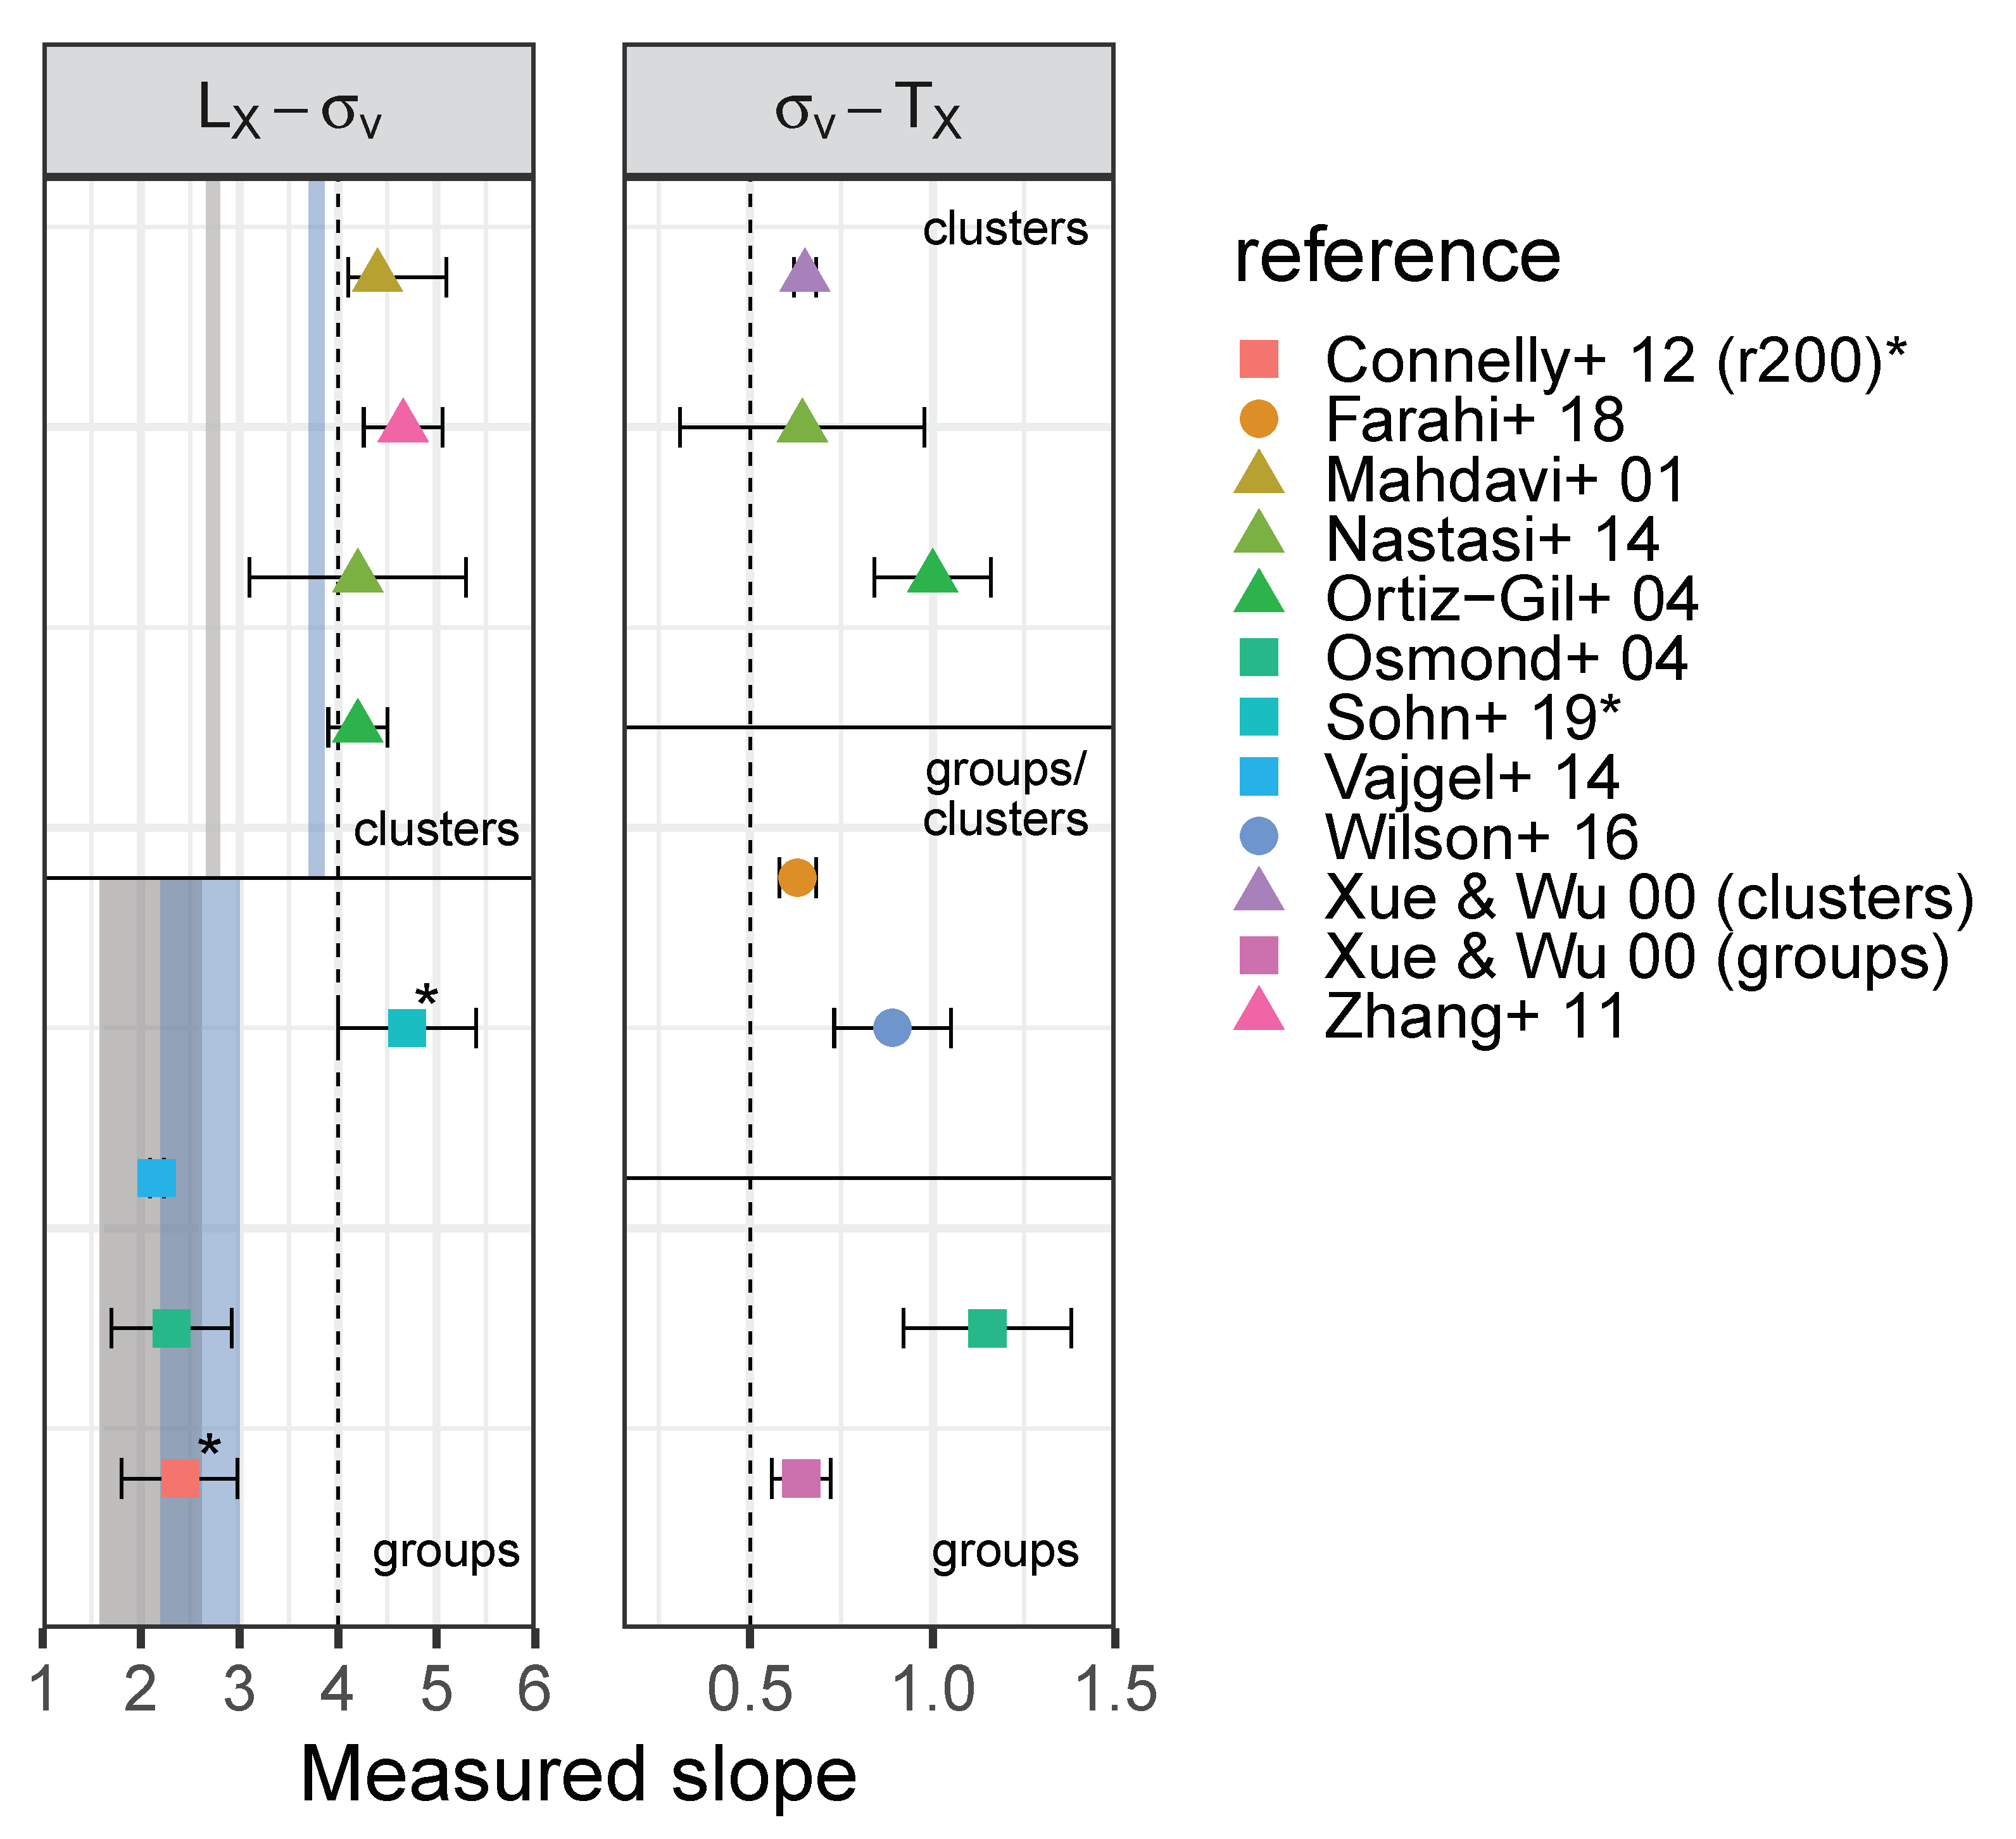
Table 1.
Emissivity dependence on T and Z for different temperature regimes and energy bands.
| E Band | T Range | Slope (Z = 0.3Z) | Slope (Z = 0.5Z) | Slope (Z = 1.0Z) |
|---|---|---|---|---|
| bol | 0.4−0.7 | +0.20 | +0.16 | +0.11 |
| 0.4–2.0 | −0.00 | −0.14 | −0.34 | |
| 0.4–3.0 | +0.06 | −0.07 | −0.26 | |
| 0.4–10.0 | +0.20 | +0.11 | −0.03 | |
| 0.7–2.0 | −0.11 | −0.30 | −0.58 | |
| 0.7–3.0 | +0.01 | −0.15 | −0.40 | |
| 0.7–10.0 | +0.20 | +0.10 | −0.06 | |
| 2.0–10.0 | +0.40 | +0.36 | +0.28 | |
| 3.0–10.0 | +0.43 | +0.41 | +0.35 | |
| 0.1–2.4 | 0.4−0.7 | +0.44 | +0.42 | +0.39 |
| 0.4–2.0 | −0.04 | −0.19 | −0.42 | |
| 0.4–3.0 | −0.04 | −0.18 | −0.39 | |
| 0.4–10.0 | −0.06 | −0.16 | −0.31 | |
| 0.7–2.0 | −0.29 | −0.52 | −0.84 | |
| 0.7–3.0 | −0.22 | −0.40 | −0.68 | |
| 0.7–10.0 | −0.16 | −0.27 | −0.45 | |
| 2.0–10.0 | −0.08 | −0.12 | −0.20 | |
| 3.0–10.0 | −0.10 | −0.12 | −0.17 | |
| 0.5–2 | 0.4−0.7 | +0.63 | +0.56 | +0.50 |
| 0.4–2.0 | −0.03 | −0.23 | −0.48 | |
| 0.4–3.0 | −0.02 | −0.21 | −0.45 | |
| 0.4–10.0 | −0.04 | −0.17 | −0.35 | |
| 0.7–2.0 | −0.38 | −0.65 | –1.00 | |
| 0.7–3.0 | −0.27 | −0.50 | −0.81 | |
| 0.7–10.0 | −0.18 | −0.32 | −0.52 | |
| 2.0–10.0 | −0.06 | −0.11 | −0.22 | |
| 3.0–10.0 | −0.07 | −0.11 | −0.18 |
Table 2.
Overview of the most recent published scaling relations for galaxy groups based on XMM–Newton and Chandra data.
Table 2.
Overview of the most recent published scaling relations for galaxy groups based on XMM–Newton and Chandra data.
| Relation | N | kT (keV) | z Range | slope | slope | slope | Reference | Note |
|---|---|---|---|---|---|---|---|---|
| L–T | 26 | 0.6–3.0 | 0.012–0.049 | [0.9:1.1] | 2.25 ± 0.21 | 3.27 ± 0.26 | E11 | a†☐⇈ |
| L–T BC | 20 | 0.9–2.8 | 0.012–0.034 | [0.7:1.2] | 2.86 ± 0.29 | - | L15 | a†☐⇊ |
| L–T | 20 | 0.9–2.8 | 0.012–0.034 | [0.7:1.2] | 2.05 ± 0.32 | 2.90 ± 0.36 | L15 | a†☐⇊ |
| L–T BC | 12 | 1.7–8.2 | 0.1–0.47 | [1.3:1.5] | 2.52 ± 0.17 | - | K15 | a‡∆⇊ |
| L–T | 12 | 1.7–8.2 | 0.1–0.47 | [1.3:1.5] | 2.65 ± 0.17 | 2.47 ± 1.23 | K15 | a‡∆⇊ |
| L–T BC | 26 | 0.6–3.6 | 0.012–0.049 | [1.2:1.6] | 3.20 ± 0.26 | - | B15 | c†☐⇈ |
| L–T | 26 | 0.6–3.6 | 0.012–0.049 | [1.2:1.6] | 2.17 ± 0.26 | 3.11 ± 0.54 | B15 | c†☐⇈ |
| L–T BC | 23 | 1.0–3.9 | 0.03–0.147 | [0.8:1.3] | 2.79 ± 0.33 | - | Z16 | b‡◇⇈ |
| L–T BC | 23 | 1.0–3.9 | 0.03–0.147 | [1.2:1.6] | 3.29 ± 0.33 | - | Z16 | c‡◇⇈ |
| L–T | 23 | 1.0–3.9 | 0.03–0.147 | [1.2:1.6] | 3.28 ± 0.33 | 2.92 ± 0.25 | Z16 | c‡⇈ |
| L–T | 23 | 1.0–3.9 | 0.03–0.147 | [1.2:1.6] | 3.81 ± 0.46 | 3.46 ± 0.45 | Z16 | c‡◇⇈ |
| L–M | 26 | 0.6–3.0 | 0.012–0.049 | [0.4:0.8] | 1.34 ± 0.18 | 1.47 ± 0.43 | E11 | a†⇈ |
| L–M BC | 20 | 0.9–2.8 | 0.012–0.034 | [0.2:0.7] | 1.66 ± 0.22 | - | L15 | a†⇊ |
| L–M | 20 | 0.9–2.8 | 0.012–0.034 | [0.2:0.7] | 1.32 ± 0.24 | 1.68 ± 0.32 | L15 | a†⇊ |
| L–M | 12 | 1.7–8.2 | 0.1–0.47 | [0.8:0.9] | 1.43 ± 0.16 | 1.52 ± 0.73 | K15 | a‡⇊ |
| L–M BC | 105 | 0.6–6.0 | 0.054–1.033 | [0.4:0.8] | 1.07 ± 0.37 | - | S20 | b‡⇊ |
| M–T | 43 | 0.7–2.7 | 0.012–0.122 | 1.5 | 1.67 ± 0.15 | 1.75 ± 0.14 | S09 | ◇⇈ |
| M–T | 26 | 0.6–3.0 | 0.012–0.049 | 1.5 | 1.68 ± 0.20 | 1.87 ± 0.37 | E11 | ☐⇈ |
| M–T | 10 | 1.2–4.6 | 0.124–0.834 | 1.5 | 1.71 ± 0.49 | 1.46 ± 0.58 | K13 | ⊚⇊ |
| M–T | 20 | 0.9–2.8 | 0.012–0.034 | 1.5 | 1.65 ± 0.07 | 1.61 ± 0.10 | L15 | ☐⇊ |
| M–T BC | 12 | 1.7–8.2 | 0.1–0.47 | 1.5 | 1.52 ± 0.17 | - | K15 | ∆⇊ |
| M–T | 12 | 1.7–8.2 | 0.1–0.47 | 1.5 | 1.68 ± 0.17 | 1.22 ± 0.82 | K15 | ∆⇊ |
| M–T | 76 | 0.6–6.0 | 0.044–1.002 | 1.5 | 1.33 ± 0.75 | 1.14 ± 0.32 | U20 | ⊠⇊ |
| M–Y | 43 | 0.7–2.7 | 0.012–0.122 | 0.6 | 0.56 ± 0.03 | 0.71 ± 0.24 | S09 | ⇈ |
| M–Y | 26 | 0.6–3.0 | 0.012–0.049 | 0.6 | 0.53 ± 0.06 | 0.58 ± 0.19 | E11 | ⇈ |
| M–Y | 20 | 0.9–2.8 | 0.012–0.034 | 0.6 | 0.60 ± 0.03 | 0.58 ± 0.04 | L15 | ⇊ |
| M–M | 43 | 0.7–2.7 | 0.012–0.122 | 1 | 1.14 ± 0.03 | 0.97 ± 0.21 | S09 | ⇈ |
| M–M | 26 | 0.6–3.0 | 0.012–0.049 | 1 | 1.38 ± 0.18 | 1.22 ± 0.44 | E11 | ⇈ |
| M–M | 20 | 0.9–2.8 | 0.012–0.034 | 1 | 1.09 ± 0.08 | 1.11 ± 0.10 | L15 | ⇊ |
| M–M | 118 | 0.6–6.0 | 0.054–1.033 | 1 | 1.35 ± 0.30 | - | S20 | ⇊ |
| K–T | 43 | 0.7–2.7 | 0.012–0.122 | 1 | 0.83 ± 0.20 | - | S09 | ◇⇈ |
The subscripts exc, 300, HE, and WL indicate properties derived excluding the core, within R < 300 kpc, under the assumption of hydrostatic equilibrium, and with weak-lensing analysis, respectively. BC indicates the relations corrected for selection effects. The slope of the L–T relation predicted by the self-similar scenario have been obtained as L∝T where is the slope of the X-ray emissivity in the considered energy band (e.g., soft or bolometric) and temperature range covered by the systems analyzed in each work (see Table 1). Since the X-ray emissivity strongly depends on the metallicity we provide the extreme values obtained with Z = 0.3 and Z = 1.0. The slope of the L–M relation is obtained similarly as L M. The values for slope have been obtained by fitting each dataset with LIRA (Sereno [112]) assuming self-similar time evolution with scatter on both variables and with the following pivot values: 3 keV, 10 erg/sec, 2 × 10 M, 10 M, 10 M for T, L, M, M, and Y respectively. Before fitting the L–T relation, Chandra temperatures have been converted into XMM–Newton-like temperatures. Note: a, b, and c refer to L obtained in the 0.1–2.4 keV, 0.5–2 keV, and bolometric band; † and ‡ indicate L obtained with ROSAT or XMM data, while ⇈ and ⇊ indicate if Chandra or XMM data have been used for the analysis. ☐, ∆, and ◇, indicate that the core-excised region was not a fixed fraction of , or fixed to 0.1 or 0.15, while ⊚ and ⊠ indicate the region 0.1–0.5R and R < 300 kpc, respectively. Relation derived fitting together the groups with a sample of clusters. References: (Sun et al. [81], S09), (Eckmiller et al. [96], E11), (Kettula et al. [113], K13), (Lovisari et al. [77], L15), (Bharadwaj et al. [32], B15), (Kettula et al. [101], K15), (Zou et al. [79], Z16), (Umetsu et al. [114], U20), (Sereno et al. [115], S20).
Publisher’s Note: MDPI stays neutral with regard to jurisdictional claims in published maps and institutional affiliations. |
© 2021 by the authors. Licensee MDPI, Basel, Switzerland. This article is an open access article distributed under the terms and conditions of the Creative Commons Attribution (CC BY) license (https://creativecommons.org/licenses/by/4.0/).
Share and Cite
MDPI and ACS Style
Lovisari, L.; Ettori, S.; Gaspari, M.; Giles, P.A. Scaling Properties of Galaxy Groups. Universe 2021, 7, 139. https://0-doi-org.brum.beds.ac.uk/10.3390/universe7050139
AMA Style
Lovisari L, Ettori S, Gaspari M, Giles PA. Scaling Properties of Galaxy Groups. Universe. 2021; 7(5):139. https://0-doi-org.brum.beds.ac.uk/10.3390/universe7050139
Chicago/Turabian StyleLovisari, Lorenzo, Stefano Ettori, Massimo Gaspari, and Paul A. Giles. 2021. "Scaling Properties of Galaxy Groups" Universe 7, no. 5: 139. https://0-doi-org.brum.beds.ac.uk/10.3390/universe7050139
Note that from the first issue of 2016, this journal uses article numbers instead of page numbers. See further details here.