
Axial Anomaly in Galaxies and the Dark Universe


Institut für Theoretische Physik, Universität Heidelberg, Philosophenweg 16, D-69120 Heidelberg, Germany
*
Authors to whom correspondence should be addressed.
Universe 2021, 7(6), 198; https://0-doi-org.brum.beds.ac.uk/10.3390/universe7060198
Submission received: 10 May 2021
/
Revised: 30 May 2021
/
Accepted: 3 June 2021
/
Published: 13 June 2021
(This article belongs to the Special Issue Modern Approaches to Non-Perturbative QCD and other Confining Gauge Theories)
Abstract
:Motivated by the SU(2) modification of the cosmological model CDM, we consider isolated fuzzy-dark-matter lumps, made of ultralight axion particles whose masses arise due to distinct SU(2) Yang–Mills scales and the Planck mass . In contrast to SU(2), these Yang–Mills theories are in confining phases (zero temperature) throughout most of the Universe’s history and associate with the three lepton flavours of the Standard Model of particle physics. As the Universe expands, axionic fuzzy dark matter comprises a three-component fluid which undergoes certain depercolation transitions when dark energy (a global axion condensate) is converted into dark matter. We extract the lightest axion mass eV from well motivated model fits to observed rotation curves in low-surface-brightness galaxies (SPARC catalogue). Since the virial mass of an isolated lump solely depends on and the associated Yang–Mills scale the properties of an e-lump predict those of - and -lumps. As a result, a typical e-lump virial mass ∼ suggests that massive compact objects in galactic centers such as Sagittarius A* in the Milky Way are (merged) - and -lumps. In addition, -lumps may constitute globular clusters. SU(2) is always thermalised, and its axion condensate never has depercolated. If the axial anomaly indeed would link leptons with dark matter and the CMB with dark energy then this would demystify the dark Universe through a firmly established feature of particle physics.
1. Introduction
Dark matter was introduced as an explanation for the anomalous, kinematic behavior of luminous test matter in comparison with the gravity exerted by its luminous surroundings, e.g., virialised stars within a galaxy [1] or a virialised galaxy within a cluster of galaxies [2]. That luminous matter can be segregated from dark matter is evidenced by the bullet cluster in observing hot intergalactic plasma (X-ray) in between localised dark-mass distributions (gravitational lensing) [3,4].
The present Standard Model of Cosmology (SMC) CDM posits a spatially flat Universe [5] with about 70% dark energy, inducing late-time acceleration [6,7]. This model requires a substantial contribution of about 26% cold dark matter to the critical density and allows for a contribution of baryons of roughly 4%.
To determine all parameters of CDM at a high accuracy, cosmological distance scales can be calibrated by high-redshift data (inverse distance ladder, global cosmology), coming from precision observations of the Cosmic Microwave Background (CMB) or from large-scale structure surveys probing Baryon Acoustic Oscillations (BAO). Alternatively, low-redshift data (direct distance ladder, local cosmology) can be used by appeal to standard or standardisable candles such as cepheids, TRGB stars, supernovae Ia, and supernovae II. Recently, a comparison between global and local cosmology has revealed tensions [8] in some of the cosmological parameter values (e.g., [9,10,11,12] and [13,14,15], see also [16] for the context of a high-redshift modification of CDM).
These interesting discrepancies motivate modifications of CDM [17]. A cosmological model aiming to resolve these tensions should target high-redshift radiation and the dark sector. In particular, models which are in principle falsifiable by terrestrial experiments and which pass such tests could lead to a demystification of the dark Universe. However, searches for weakly interacting, massive and stable particles (WIMPS) [18], whose potential existence is suggested by certain extensions of the Standard Model of Particle Physics (SMPP), so far have not produced any detection [19,20].
An attractive possibility to explain the feebleness of a potential interaction between the dark sector of the SMC and SMPP matter in terms of the large hierarchy between particle-physics scales and the Planck mass is the theoretically [21,22,23] and experimentally [24] solidly anchored occurrence of an axial anomaly, which is induced by topological charge densities [25] in the ground states of pure Yang–Mills theories [26]. The axial anomaly acts on top of a dynamical chiral symmetry breaking mediated by a force of hierarchically large mass scale compared to the scales of the Yang–Mills theories. To enable the axial anomaly throughout the Universe’s entire history chiral fermions, which acquire mass through gravitational torsion and which can be integrated out in a Planck-scale de Sitter background [27], need to be fundamentally charged under certain gauge groups. In such a scenario gravity itself—a strong force at the Planck scale—would induce the dynamical chiral symmetry breaking [28,29,30]. The anomaly then generates an axion mass [25] for particles that a priori are chiral Nambu–Goldstone bosons. Working in natural units , one has
where denotes a Yang–Mills scale and eV the Planck mass [28,30]. The cold-dark-matter (CDM) paradigm is successful in explaining large-scale structure in the CDM context but exhibits problems at small scales, e.g., galactic and lower [31]: While N-body simulations within CDM reveal matter-density profiles of the galactic DM halos that are characterised by a central cusp of the Navarro-Frenk-White (NFW) type [32], [33] (r the radial distance to the center of the galaxy), observations suggest a core or soliton profile subject to a constant central matter density , see, e.g., [34,35,36,37,38,39,40]. A model of fuzzy dark matter (FDM) [34,36,41,42,43,44,45,46,47,48], according to the ground-state solution of the Schrödinger–Poisson system embedded into cosmological simulations [47], posits a condensate of free axion particles within the galactic core. For the radial range
the associated central matter densities gives way to a selfgravitating cloud of effective, nonrelativistic particles of mass . Here denotes the virial radius defined such that
where is the Hubble constant, and indicates the de-Broglie wavelength of an axionic particle for where the NFW model applies. Note that within the core region the correlation length in the condensate is given by the reduced Compton wave length . In what follows, we will refer to such a system—condensate core plus NFW-tail—as a lump. In [49], FDM fits to the rotations curves of low-surface-brightness galaxies, which are plausibly assumed to be dominated by dark matter, have produced an axion mass of eV. Note also that the cosmological simulation of [47] associates the axionic scalar field with dark-matter perturbations only but not with the background dark-matter density which is assumed to be conventional CDM.
Another potential difficulty with CDM, which FDM is capable of addressing, is the prediction of too many satellite galaxies around large hosts like the Milky Way or Andromeda [50], see, however [51] for a cosmological simulation within CDM. A recent match of observed satellite abundances with cosmological simulations within the FDM context yields a stringent bound on the axionic particle mass [51]: eV. This bound is consistent with eV derived from an analysis of the Milky Way rotation curve in [39].
There is yet another indication that CDM may face a problem in delaying the formation of large galaxies of mass due to their hierarchical formation out of less massive ones. This seems to contradict the high-redshift observation of such galaxies [52] and suggests that a component of active structure formation is at work.
Assuming axions to be a classical ideal gas of non-relativistic particles the mass can be extracted from CMB simulations of the full Planck data subject to scalar adiabatic, isocurvature, and tensor-mode initial conditions [53] ( eV eV with a 10% contribution to DM and a 1% contribution of isocurvature and tensor modes) and from a modelling of Lyman- data [54] with conservative assumptions on the thermal history of the intergalactic medium. For the XQ-100 and HIRES/MIKE quasar spectra samples one obtains, respectively, eV and eV.
In our discussion of Section 5 we conclude that three axion species of hierarchically different masses could determine the dark-matter physics of our Universe. When comparing the results of axion-mass extractions with FDM based axion-mass constraints obtained in the literature it is important to observe that a single axion species always is assumed. For example, this is true of the combined axion-mass bound eV, derived from modelling the Lyman- flux power spectrum by hydrodynamical simulations [54], and it applies to the cosmological evolution of scalar-field based dark-matter perturbations yielding an axion mass of eV in [47].
In the present article we are interested in pursuing the consequences of FDM for the physics of dark matter on super-galactic and sub-galactic scales within a cosmological model which deviates from CDM in three essential points: (i) FDM is subject to three instead of one nonthermal axionic particle species, whose present cosmological mass densities are nearly equal, (ii) axion lumps (condensate core plus halo of fluctuating density granules) cosmologically originate from depercolation transitions at distinct redshifts out of homogeneous condensates [16], and (iii) the usual, nearly scale invariant spectrum of adiabatic curvature fluctuations imprinted as an initial condition for cosmological cold-dark-matter evolution, presumably created by inflation, does not apply.
Point (i) derives from the match of axion species with the three lepton families of the Standard Model of particle physics. These leptons emerge in the confining phases of SU(2) Yang–Mills theories [55]. According to Equation (1) axion masses are then determined by the universal Peccei-Quinn scale and the distinct Yang–Mills scales , , and .
Point (ii) is suggested by a cosmological model [16] which is induced by the postulate that the CMB itself is described by an SU(2) gauge theory [26] and which fits the CMB power spectra TT, TE, and EE remarkably well except for low l. The according overshoot in TT at large angular scales may be due to the neglect of the nontrivial, SU(2)-induced photon dispersion at low frequencies.
Point (iii) relates to the fact that a condensate does not maintain density perturbations on cosmological scales and that . As a consequence, constraints on axion masses from cosmological simulations by confrontation with the observed small-scale structure should be repeated based on the model of [16]. This, however, is beyond the scope of the present work.
To discuss point (ii) further, we refer to [16], where a dark sector was introduced as a deformation of CDM. This modification models a sudden transition from dark energy to dark matter at a redshift . Such a transition is required phenomenologically to reconcile high-z cosmology (well below the Planckian regime but prior to and including recombination), where the dark-matter density is reduced compared to CDM, with well-tested low-z cosmology. That a reduced dark-matter density is required at high z is as a result of an SU(2)-induced temperature-z relation [56]. Depercolation of a formely spatially homogeneous axion condensate, which introduces a change of the equation of state from to , is a result of the Hubble radius —the spatial scale of causal connectedness in a Friedmann–Lemaitre–Robertson–Walker (FLRW) Universe—exceeding by far the gravitational Bohr radius of an isolated, spherically symmetric system of selfgravitating axion particles. The value of the ratio at depercolation so far is subject to phenomenological extraction, but should intrinsically be computable in the future by analysis of the Schrödinger–Poisson system in a thus linearly perturbed background cosmology whose dark sector is governed by axion fields subject to their potentials.
Roughly speaking, at depercolation from an equation of state the quantum correlations in the axionic system become insufficient to maintain the homogeneity of the formerly homogeneously Bose-condensed state. The latter therefore decays or depercolates into selfgravitating islands of axionic matter whose central regions continue to be spatially confined Bose condensates but whose peripheries are virialised, quantum correlated particle clouds of an energy density that decays rapidly in the distance r to the gravitational center to approach the cosmological dark-sector density. On cosmological scales, each of these islands (lumps) can be considered a massive (nonrelativistic) particle by itself such that the equation of state of the associated ensemble becomes : The density of lumps then dilutes as where a denotes the cosmological scale factor.
For the entire dark sector we have
Fits of this model to the TT, TE, and EE CMB power spectra reveal that . Here denotes a primordial contribution to the present dark-matter density parameter while refers to the emergence of dark matter due to the depercolation of a formerly homogeneous Bose–Einstein condensate into isolated lumps once their typical Bohr radius is well covered by the horizon radius . One may question that depercolation occurs suddenly at , the only justification so far being the economy of the model. If a first-principle simulation of the Schrödinger–Poisson system plus background cosmology reveals that the transition from dark energy to dark matter during depercolation involves a finite z-range then this has to be included in the model of Equation (4).
After depercolation has occurred, a small dark-energy residual persists to become the dominant cosmological constant today. As we will argue in Section 5, the primordial dark-matter density could originate from the stepwise depercolation of former dark energy in the form of super-horizon sized - and -lumps. Therefore, dark energy dominates the dark sector at sufficiently high z. However, due to radiation dominance dark energy then was a marginal contribution to the expansion rate. The model of [16] was shown to fit the CMB anisotropies with a low baryon density, the local value for the redshift of re-ionisation [57], and the local value of from supernovae Ia distance-redshift extractions [10,11].
The purpose of the present work is to propose a scenario which accommodates , , and . At the same time, we aim at explaining the parameters and in terms of axial anomalies subject to a Planck-mass Peccei-Quinn scale and three SU(2) Yang–Mills theories associated with the three lepton families. In addition, an explanation of parameter is proposed which invokes the SU(2) Yang–Mills theory underlying the CMB. Hence, the explicit gauge-theory content of our model is: SU(2) SU(2) SU(2) SU(2).
We start with the observation in [36] that ultralight bosons necessarily need to occur in the form of selfgravitating condensates in the cores of galaxies. Because these cores were separated in the course of nonthermal depercolation halos of axion particles, correlated due to gravitational virialisation on the scale of their de Broglie wavelength, were formed around the condensates. Such a halo reaches out to a radius, say, of where its mass density starts to fall below 200 times the critical cosmological energy density of the spatially flat FLRW Universe. A key concept in describing such a system—a lump—is the gravitational Bohr radius defined as
where M is the mass of the lump which should coincide with the viral mass, say . We use two FDM models of the galactic mass density to describe low-surface-brightness galaxies and to extract the axion mass : The Soliton-NFW model, see [44] and references therein, and the Burkert model [58,59].
Rather model independently, we extract a typical value of eV which confirms the value obtained in [49]. With Equation (1) this value of implies a Yang–Mills scale of eV. This is smaller than keV found in [55] where a link to an SU(2) Yang–Mills theory governing the first lepton family is made: SU(2). Note that the larger value of was extracted in the deconfining phase [55] while the smaller value, obtained from the axion mass , relates to the confining phase. The suppression of Yang–Mills scale is plausible because topological charges, which invoke the axial anomaly, are less resolved in the confining as compared to the deconfining phase. The gravitational Bohr radius associated with a typical e-lump mass of turns out to be kpc.
Having fixed the scales of SU(2), SU(2) and linked their lumps to dark energy and the dark-matter halos of low-surface-brightness galaxies, respectively, we associate the lumps of SU(2)- and SU(2) with of the dark-sector cosmological model in Equation (4). Within a galaxy, each individual - and -lump provides a mass fraction of and , respectively, of the mass of an e-lump, see Equation (11).
This paper is organised as follows. In Section 2 we discuss features of lumps in terms of a universal ratio between reduced Compton wavelength and gravitational Bohr radius. As a result, a typical lump mass can be expressed solely in terms of Yang–Mills scale and Planck mass. The rotation curves of galaxies with low surface brightness (SPARC library) are analysed in Section 3 using two models with spherically symmetric mass densities: the Soliton–Navarro–Frenk–White (SNFW) and the Burkert model. Assuming that only one Planck-scale axion species dominates the dark halo of a low-surface-brightness galaxy in terms of an isolated, unmerged e-lump, we extract the typical axion mass in Section 3.2. In Section 3.3 we demonstrate the consistency of axion-mass extraction between the two models: The gravitational Bohr radius, determined in SNFW, together with the lump mass, obtained from the Burkert-model-fit, predicts an axion mass which is compatible with the axion mass extracted from the soliton-core density of the SNFW model. The typical value of the axion mass suggests an association with SU(2) Yang–Mills dynamics responsible for the emergence of the first lepton family. In Section 4, this information is used to discuss the cosmological origin and role of lumps played in the dark Universe in association with the two other lepton families and the SU(2) gauge theory propounded to describe the CMB [16,56]. As a result, on subgalactic scales the -lumps could explain the presence of massive compact objects in galactic centers such as Sagittarius A* in the Milky Way [60,61] while -lumps may relate to globular clusters [62]. On super-galactic scales and for , however, lumps from all axion species act like CDM. On the other hand, the CMB-lump’s extent always exceeds the Hubble radius by many orders of magnitude and therefore should associate with dark energy. Finally, in Section 5 we discuss in more detail how certain dark structures of the Milky Way may have originated in terms of - and -lumps. We also provide a summary and an outlook on future work. We work in natural units .
2. Gravitational Bohr Radius and Reduced Compton Wave Length of a Planck–Scale Axion
We start by conveying some features of basic axion lumps, cosmologically originated by depercolation transitions, that we wish to study. Let
denote the reduced Compton wavelength and
the mean distance between axion particles within the spherically symmetric core of the lump of mean dark-matter mass density . One has
The energy densities of each of the three dark-energy like homogeneous condensates of axionic particles prior to lump depercolation are assumed to arise due to Planckian physics [30]. Therefore, each may only depend on and (). Finite-extent, isolated, unmerged lumps self-consistently are characterised by a fixed ratio between the reduced Compton wavelength —the correlation length in the condensate of free axion particles at zero temperature—and the Bohr radius .
Let us explain this. Causal lump segregation due to cosmological expansion (depercolation), which sets in when the Hubble radius becomes sufficiently larger than , is adiabatically slow and generates a sharply peaked distribution of lump masses (and Bohr radii) in producing typically sized condensate cores. These cores are surrounded by halos of axion particles that represent regions of the dissolved condensate and nonthermally are released by the mutual pull of cores during depercolation. In principle, we can state that for an isolated, unmerged lump
where is a smooth dimensionless function of its dimensionless argument with the property that . This is because the typical mass of an isolated, unmerged lump, which enters via Equation (5), is, due to adiabatically slow depercolation, by itself only a function of the two mass scales and mediating the interplay between quantum and gravitational correlations that give rise to the formation of the lump. Since is much smaller than unity, we can treat the right-hand side of Equation (9) as a universal constant. In practice, we will in Section 3 derive the values of and by matching dark-matter halos of low surface-brightness galaxies with well motivated models of a lump’s mass density. As a result, we state a value of in Equation (25) of Section 4.
Equation (9) together with Equations (1), (5) and (6) imply for the mass of the isolated, unmerged lump
Equation (10) is important because it predicts that the ratios of lump masses solely are determined by the squares of the ratios of the respective Yang–Mills scales or, what is the same [55], by the ratios of charged lepton masses , , and . One has
Since we have , and therefore a large number of axion particles are covered by one reduced Compton wave length. This assures that the assumption of a condensate core is selfconsistent. A thermodynamical argument for the necessity of axion condensates throughout the Universe’s expansion history is given in Section 4. In [36], the non-local and non-linear (integro-differential) Schrödinger equation, obtained from a linear Schrödinger equation and a Poisson equation for the gravitational potential, see, e.g., [63], governing the lump, was analysed. An excitation of such a lump in terms of its wave-function containing radial zeros was envisaged in [36,49]. Here instead, we assume the isolated, unmerged lump to be in its ground state, parameterised by a phenomenological mass density which represents the lump well [47].
3. Analysis of Rotation Curves
In this section, we extract the axion mass from observed RCs of low-surface-brightness galaxies which fix the lump mass and a characterising length scale—the gravitational Bohr radius . This, in turn, determines the (primary, see Section 4) Yang–Mills scale associated with the lump. We analyse RCs from the SPARC library [64].
3.1. Fuzzy Dark Matter: Soliton–Navarro–Frenk–White vs. Burkert Model
To investigate, for a given galaxy and RC, the underlying spherically symmetric mass density it is useful to introduce the orbit-enclosed mass
Assuming virialisation, spherical symmetry, and Newtonian gravity the orbital velocity of a test mass (a star) is given as
where is defined in Equation (14), and denotes Newton’s constant. The lump mass M is defined to be where is given by Equation (3).
For an extraction of and therefore the associated Yang–Mills scale governing the mass of a lump according to Equation (10), we use the Soliton–Navarro—Frenk–White (SNFW) and the Burkert model. The mass-density profile of the NFW-part of the SNFW-model is given as [33]
where associates with the central mass density, and is a scale radius which represents the onset of the asymptotic cubic decay in distance r to the galactic center. Note that profile exhibits an infinite cusp as and that the orbit-enclosed mass diverges logarithmically with the cutoff radius r for the integral in Equation (14). In order to avoid the cuspy behavior for , an axionic Bose–Einstein condensate (soliton density profile) is assumed to describe the soliton region . From the ground-state solution of the Schrödinger–Poisson system for a single axion species one obtains a good analytic description of the soliton density profile as [49]
where is the core density [47]. On the whole, the fuzzy dark matter profile can than be approximated as
3.2. Analysis of RCs in the SNFW Model
Using Equations (14), (15) and (18), we obtain the orbital velocity of the SNFW model [65] [Equation (17)] which is fitted to observed RCs. This determines the parameters , , and . The density relates to these fit parameters by demanding continuity of the SNFW mass density at [49]. As a result, one has
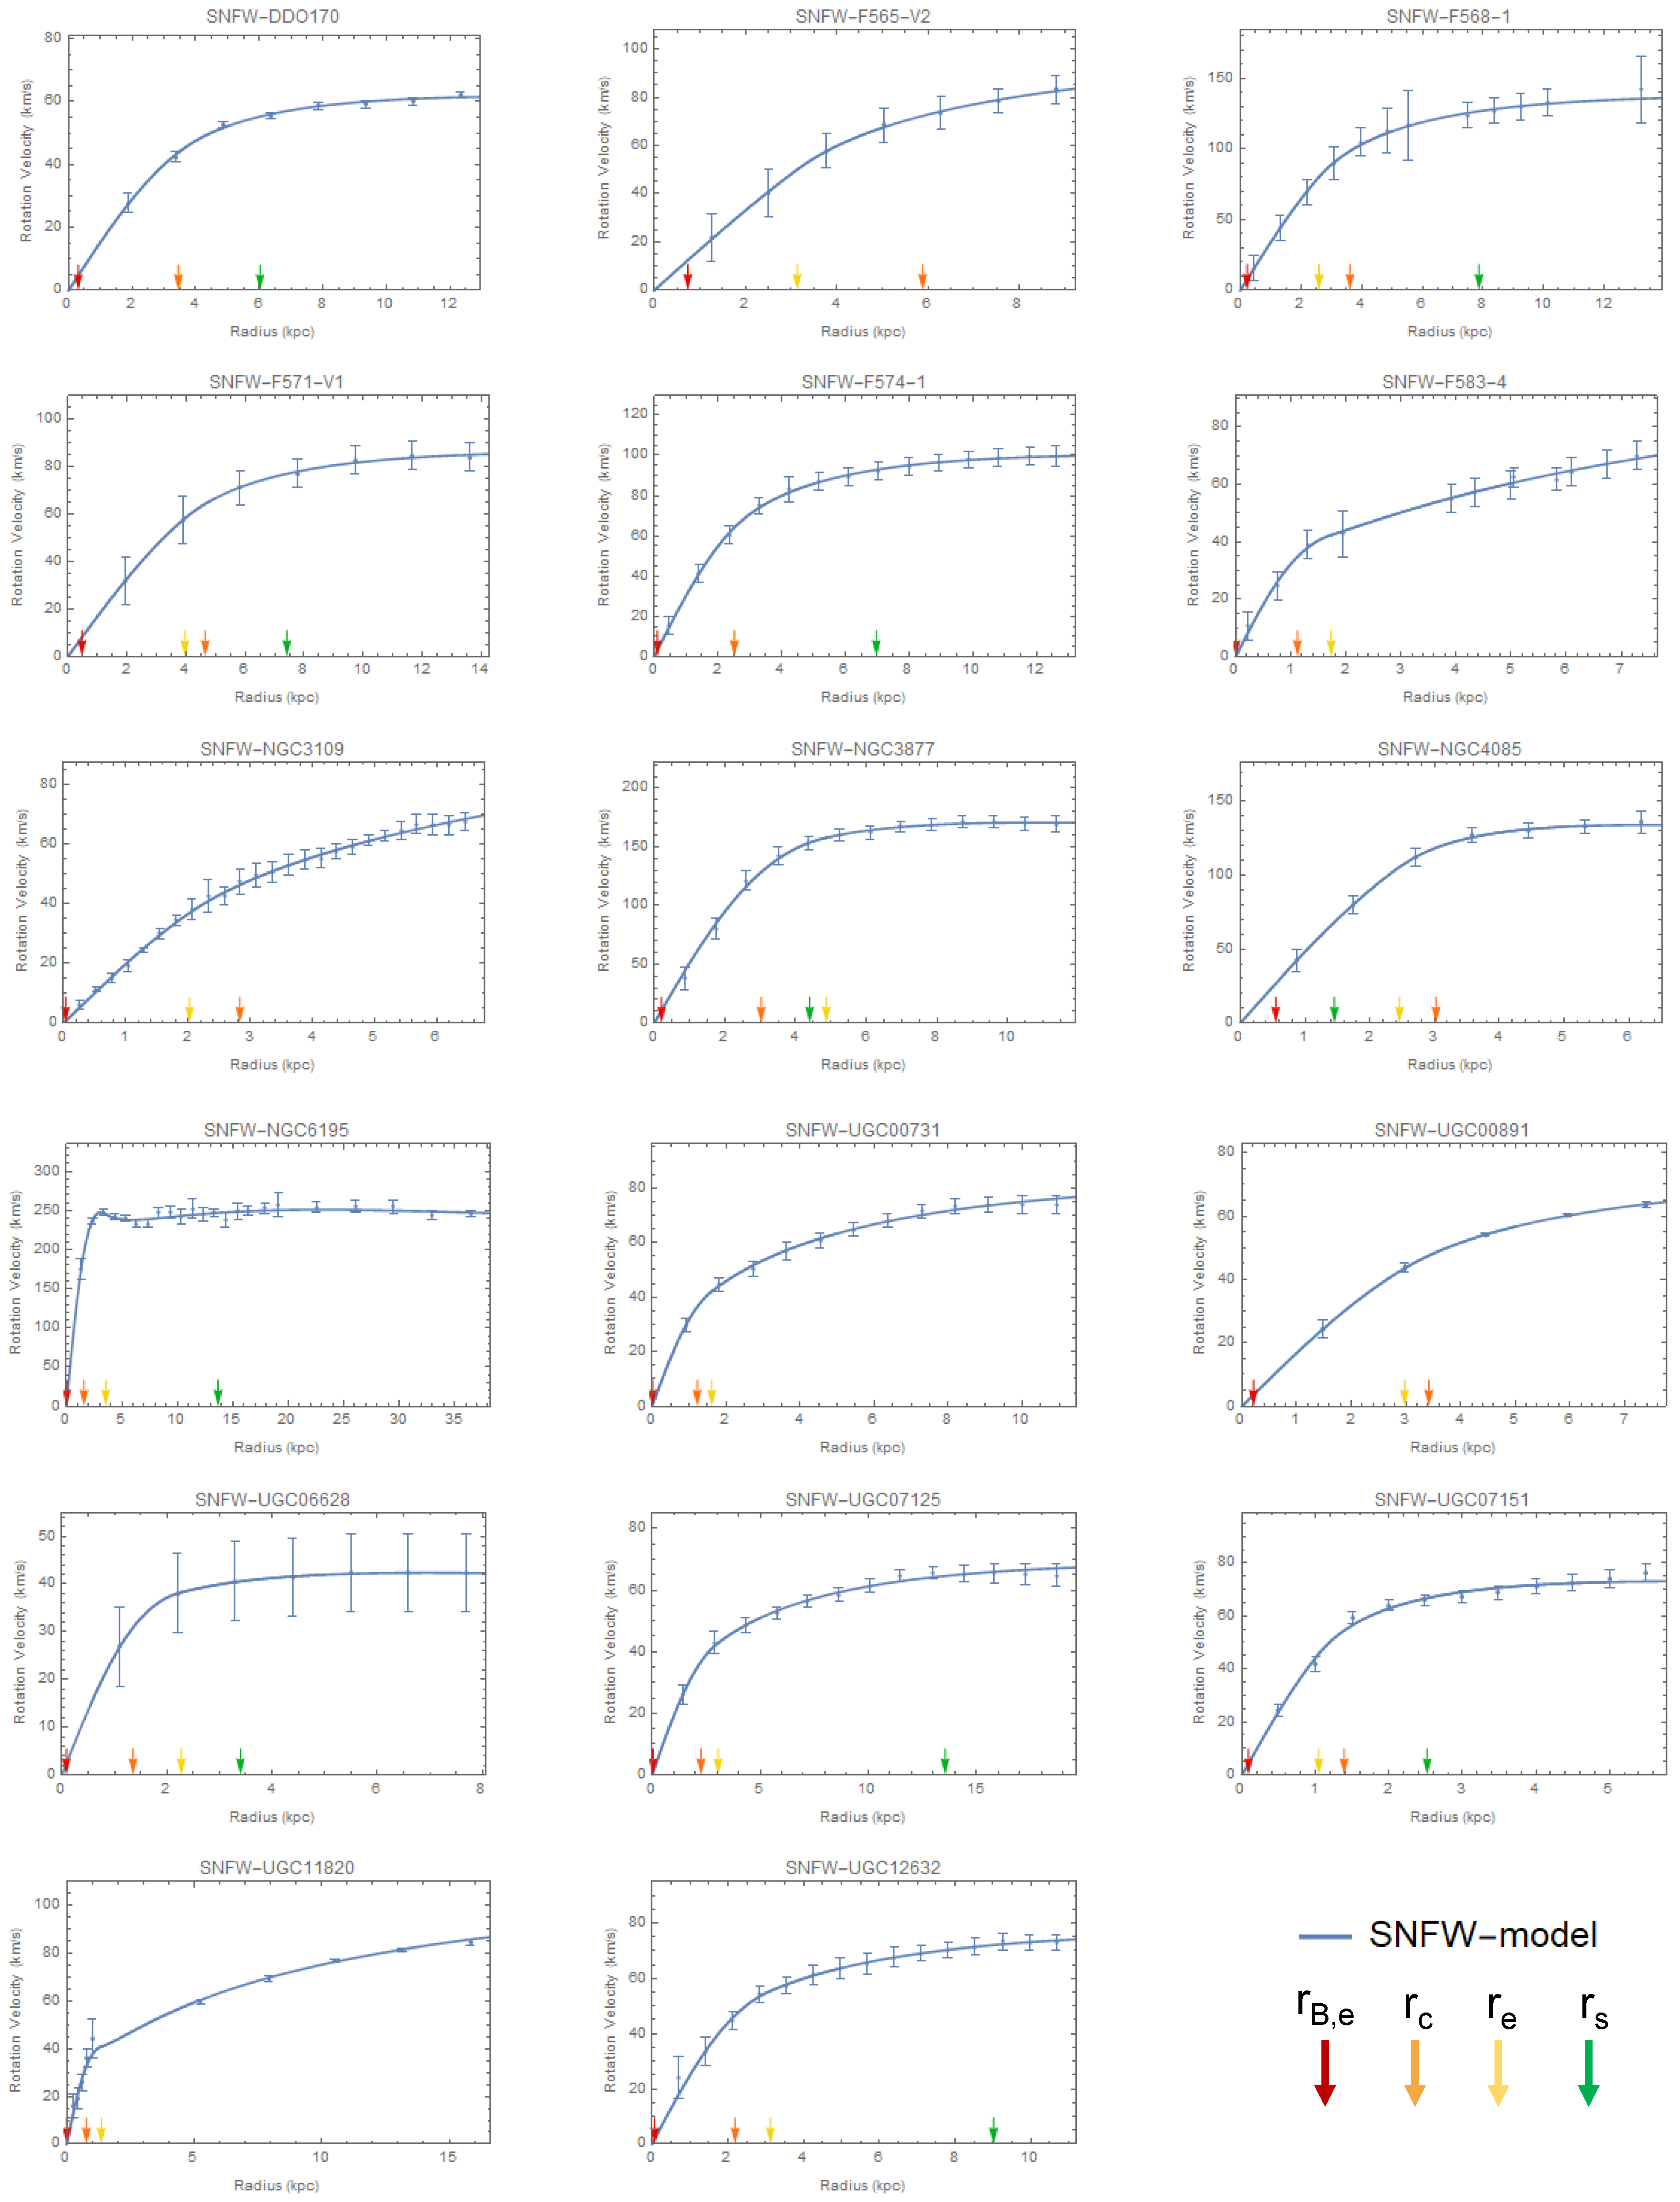
Examples of good fits with are shown in Figure 1, see Table 1 and Table 2 for the corresponding fit parameters. The derived quantity is extracted from the following equation [47]
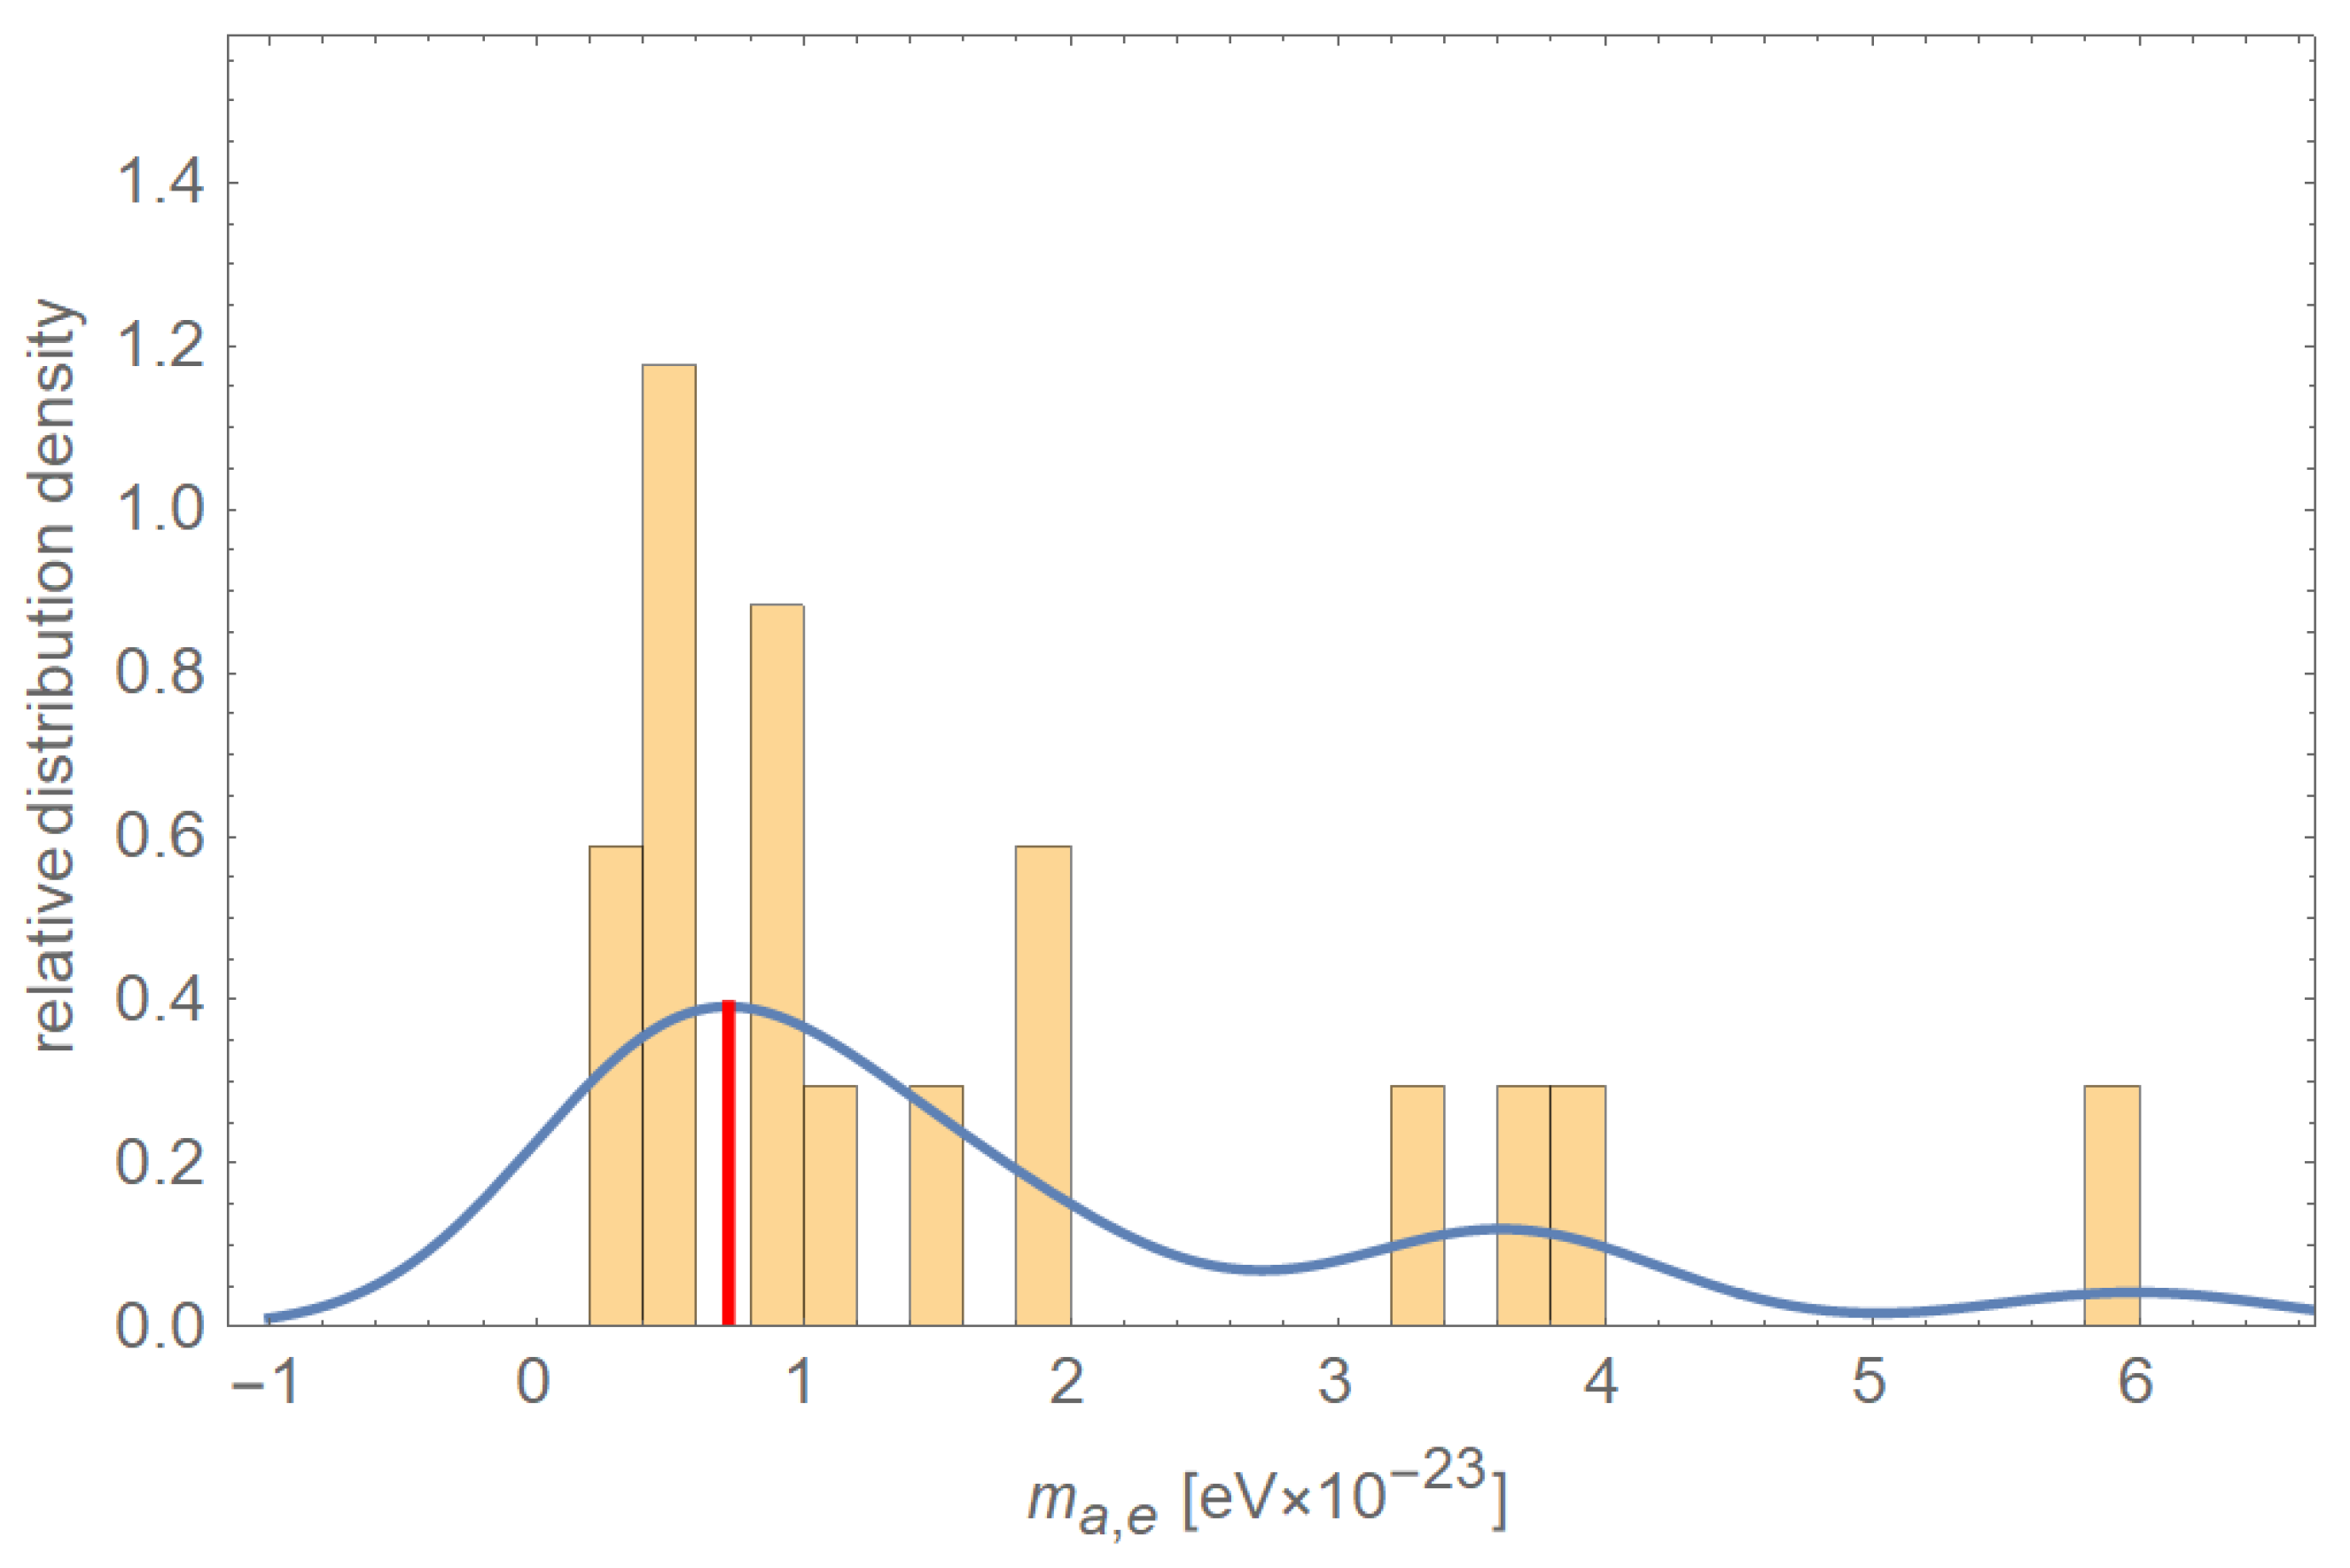
The other derived quantities and are obtained by employing Equations (3) and (14) with , respectively. In Figure 2, a frequency distribution of is shown, based on a sample of 17 best fitting galaxies, see Figure 1 for the fits to the RCs. The maximum of the smooth-kernel-distribution (solid line) is at
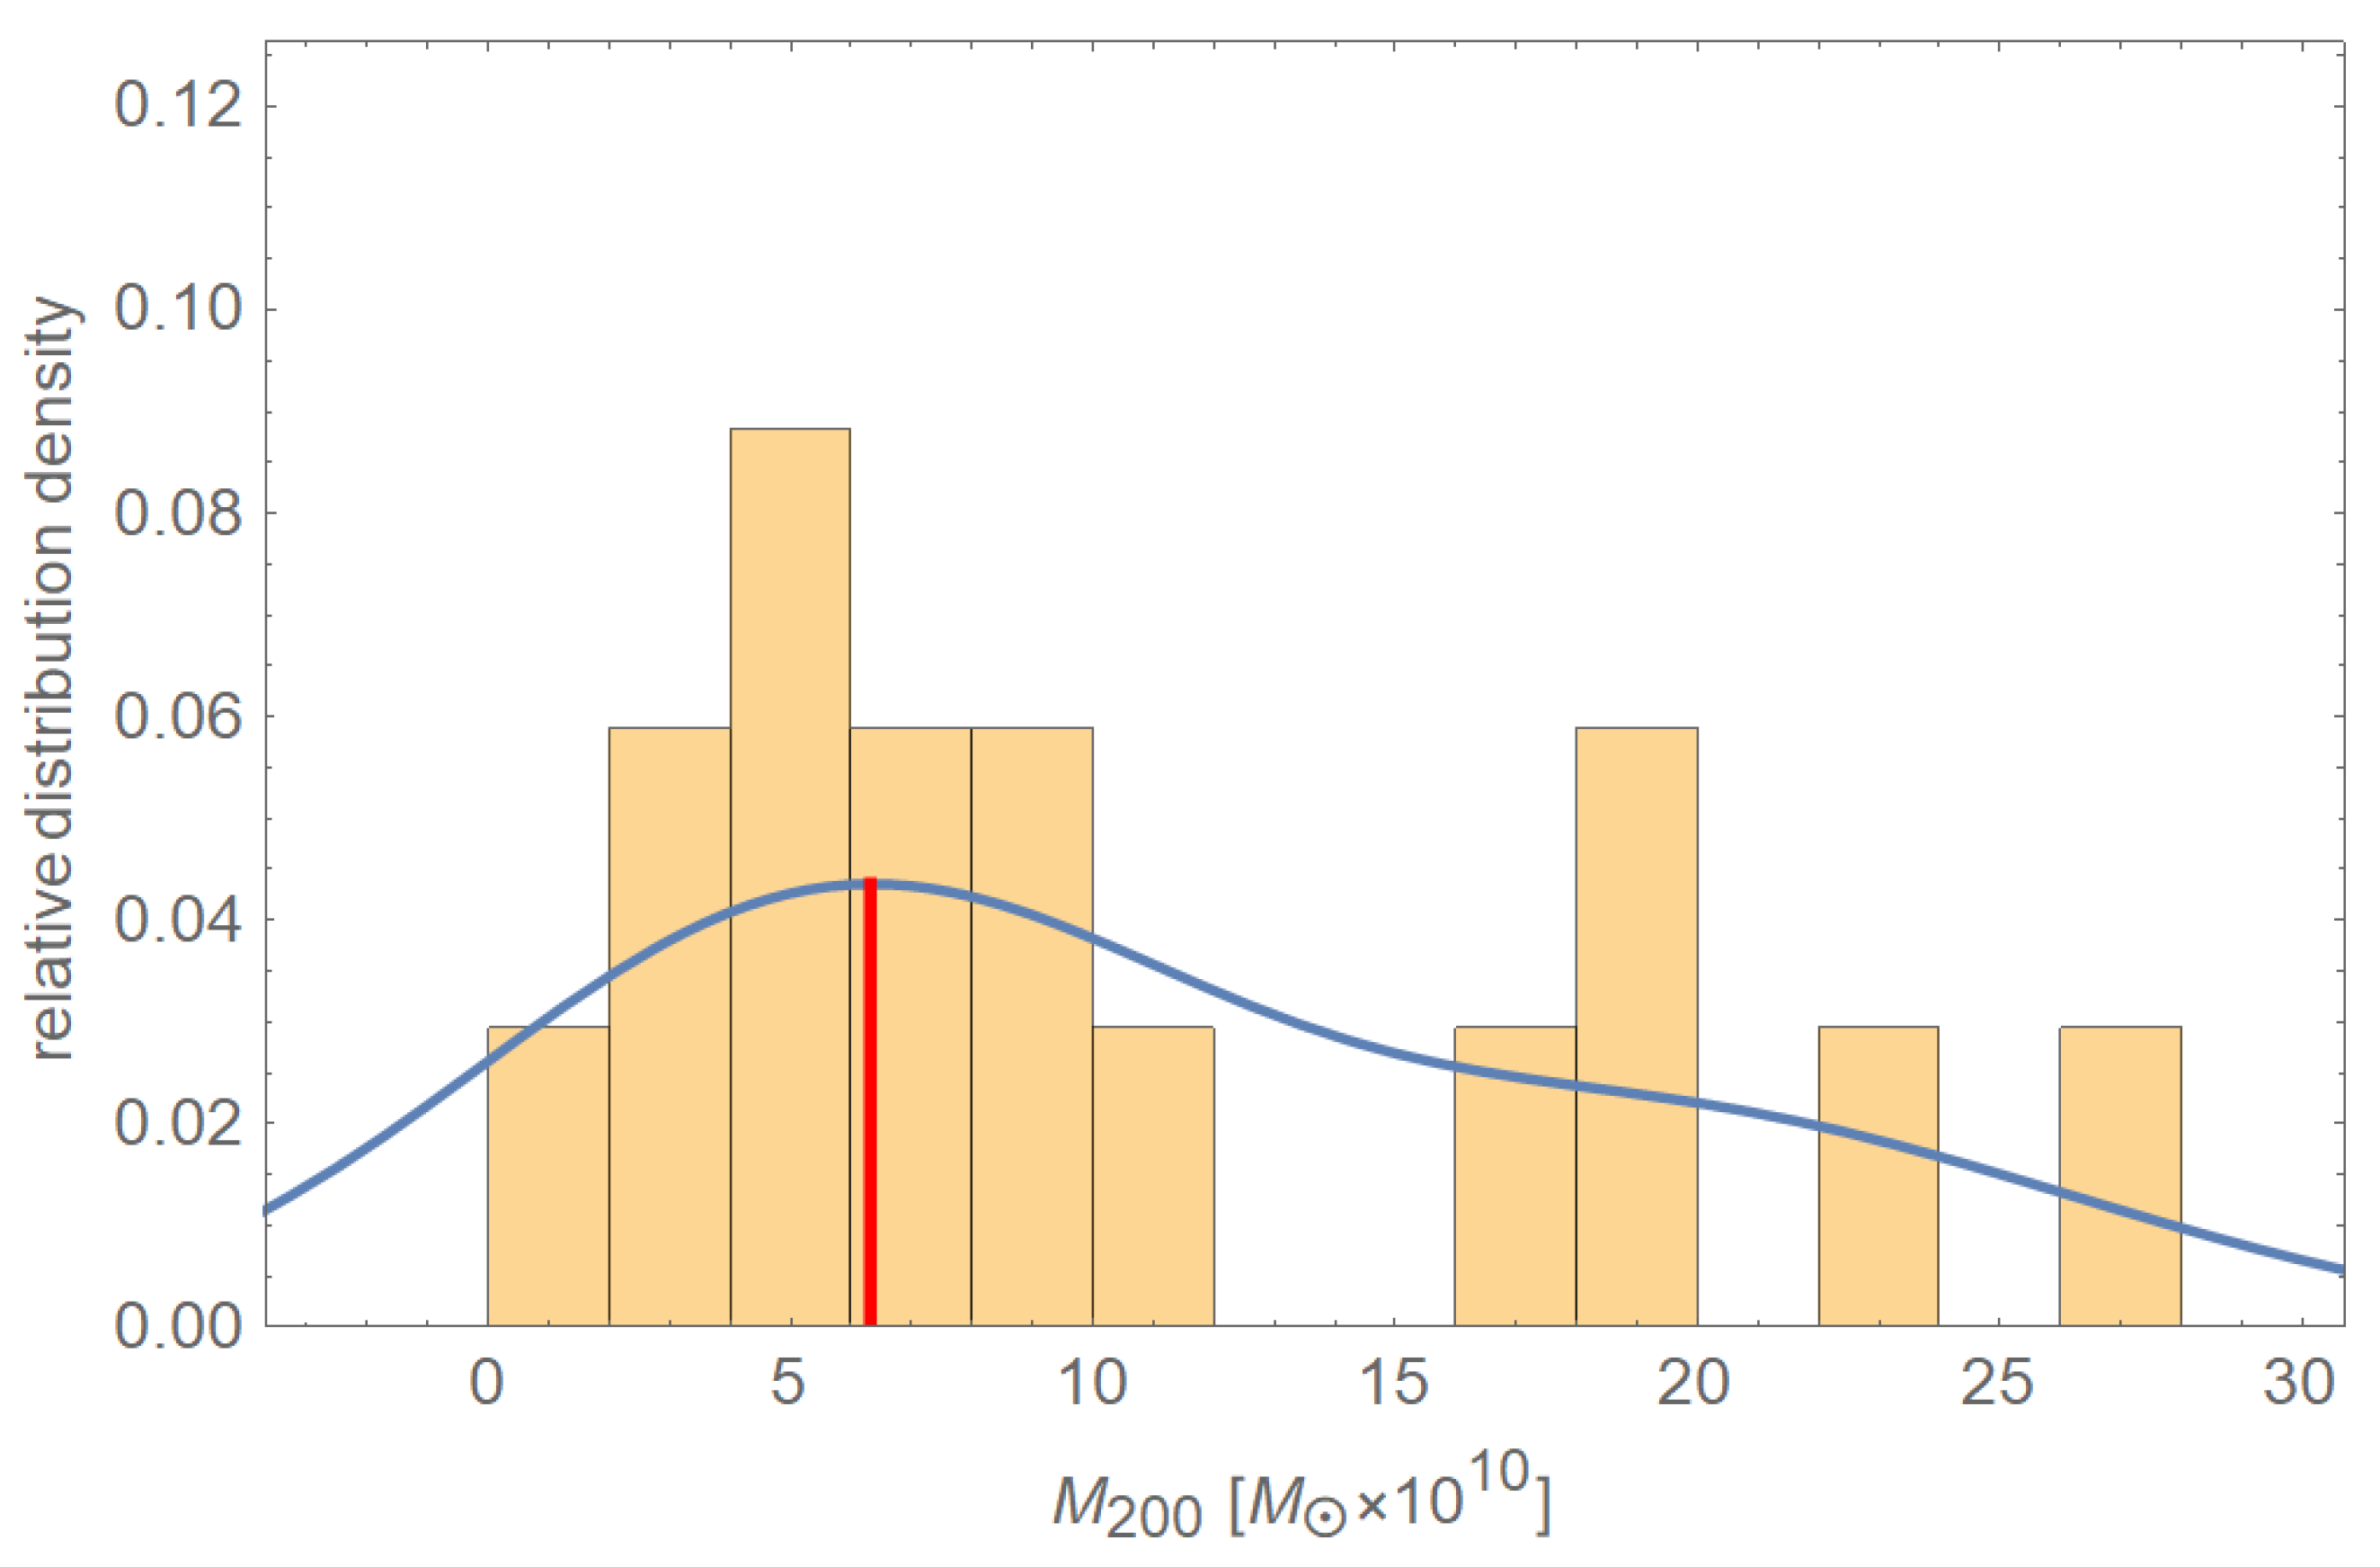
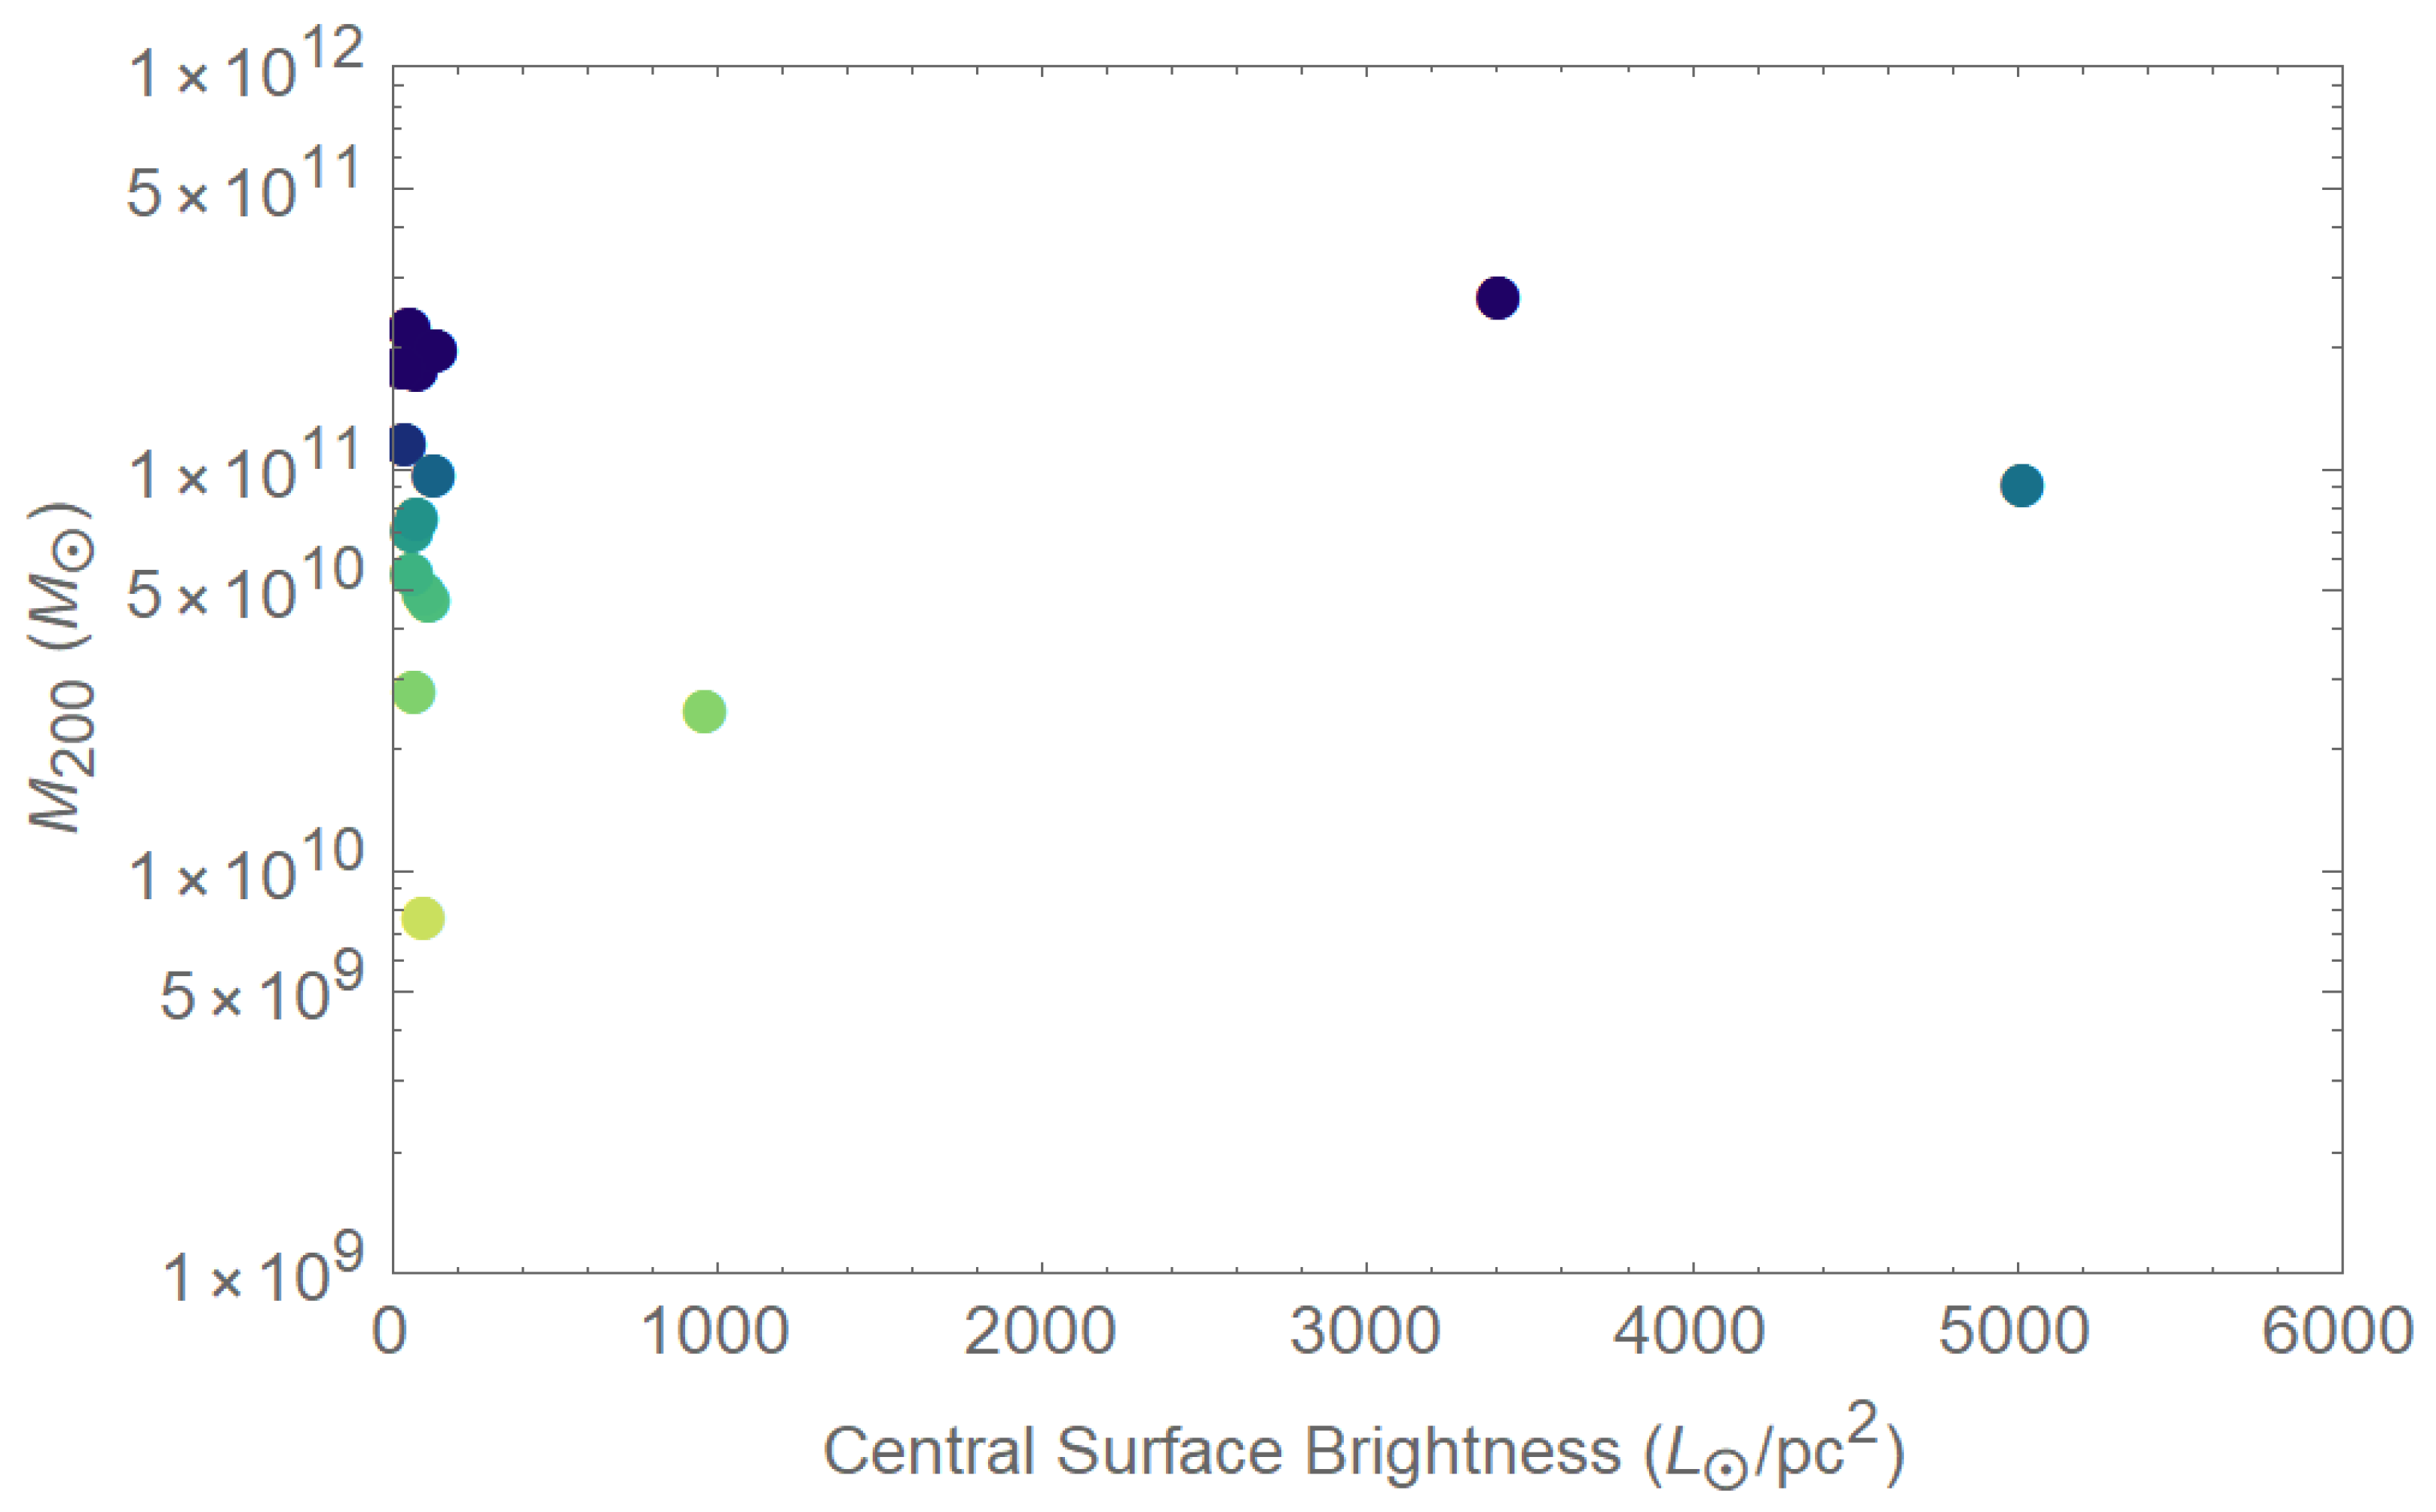
In Figure 3 a frequency distribution of is shown for the 17 best-fitting galaxies. Figure 4 depicts the distribution of these galaxies in the —surface-brightness plane. The maximum of the smooth-kernel-distribution is at . With Equation (5) this implies a mean Bohr radius of
This value of is used in the Burkert-model analysis of Section 3.3 to extract the frequency distribution of via the frequency distribution of .
3.3. Analysis of RCs in the Burkert Model
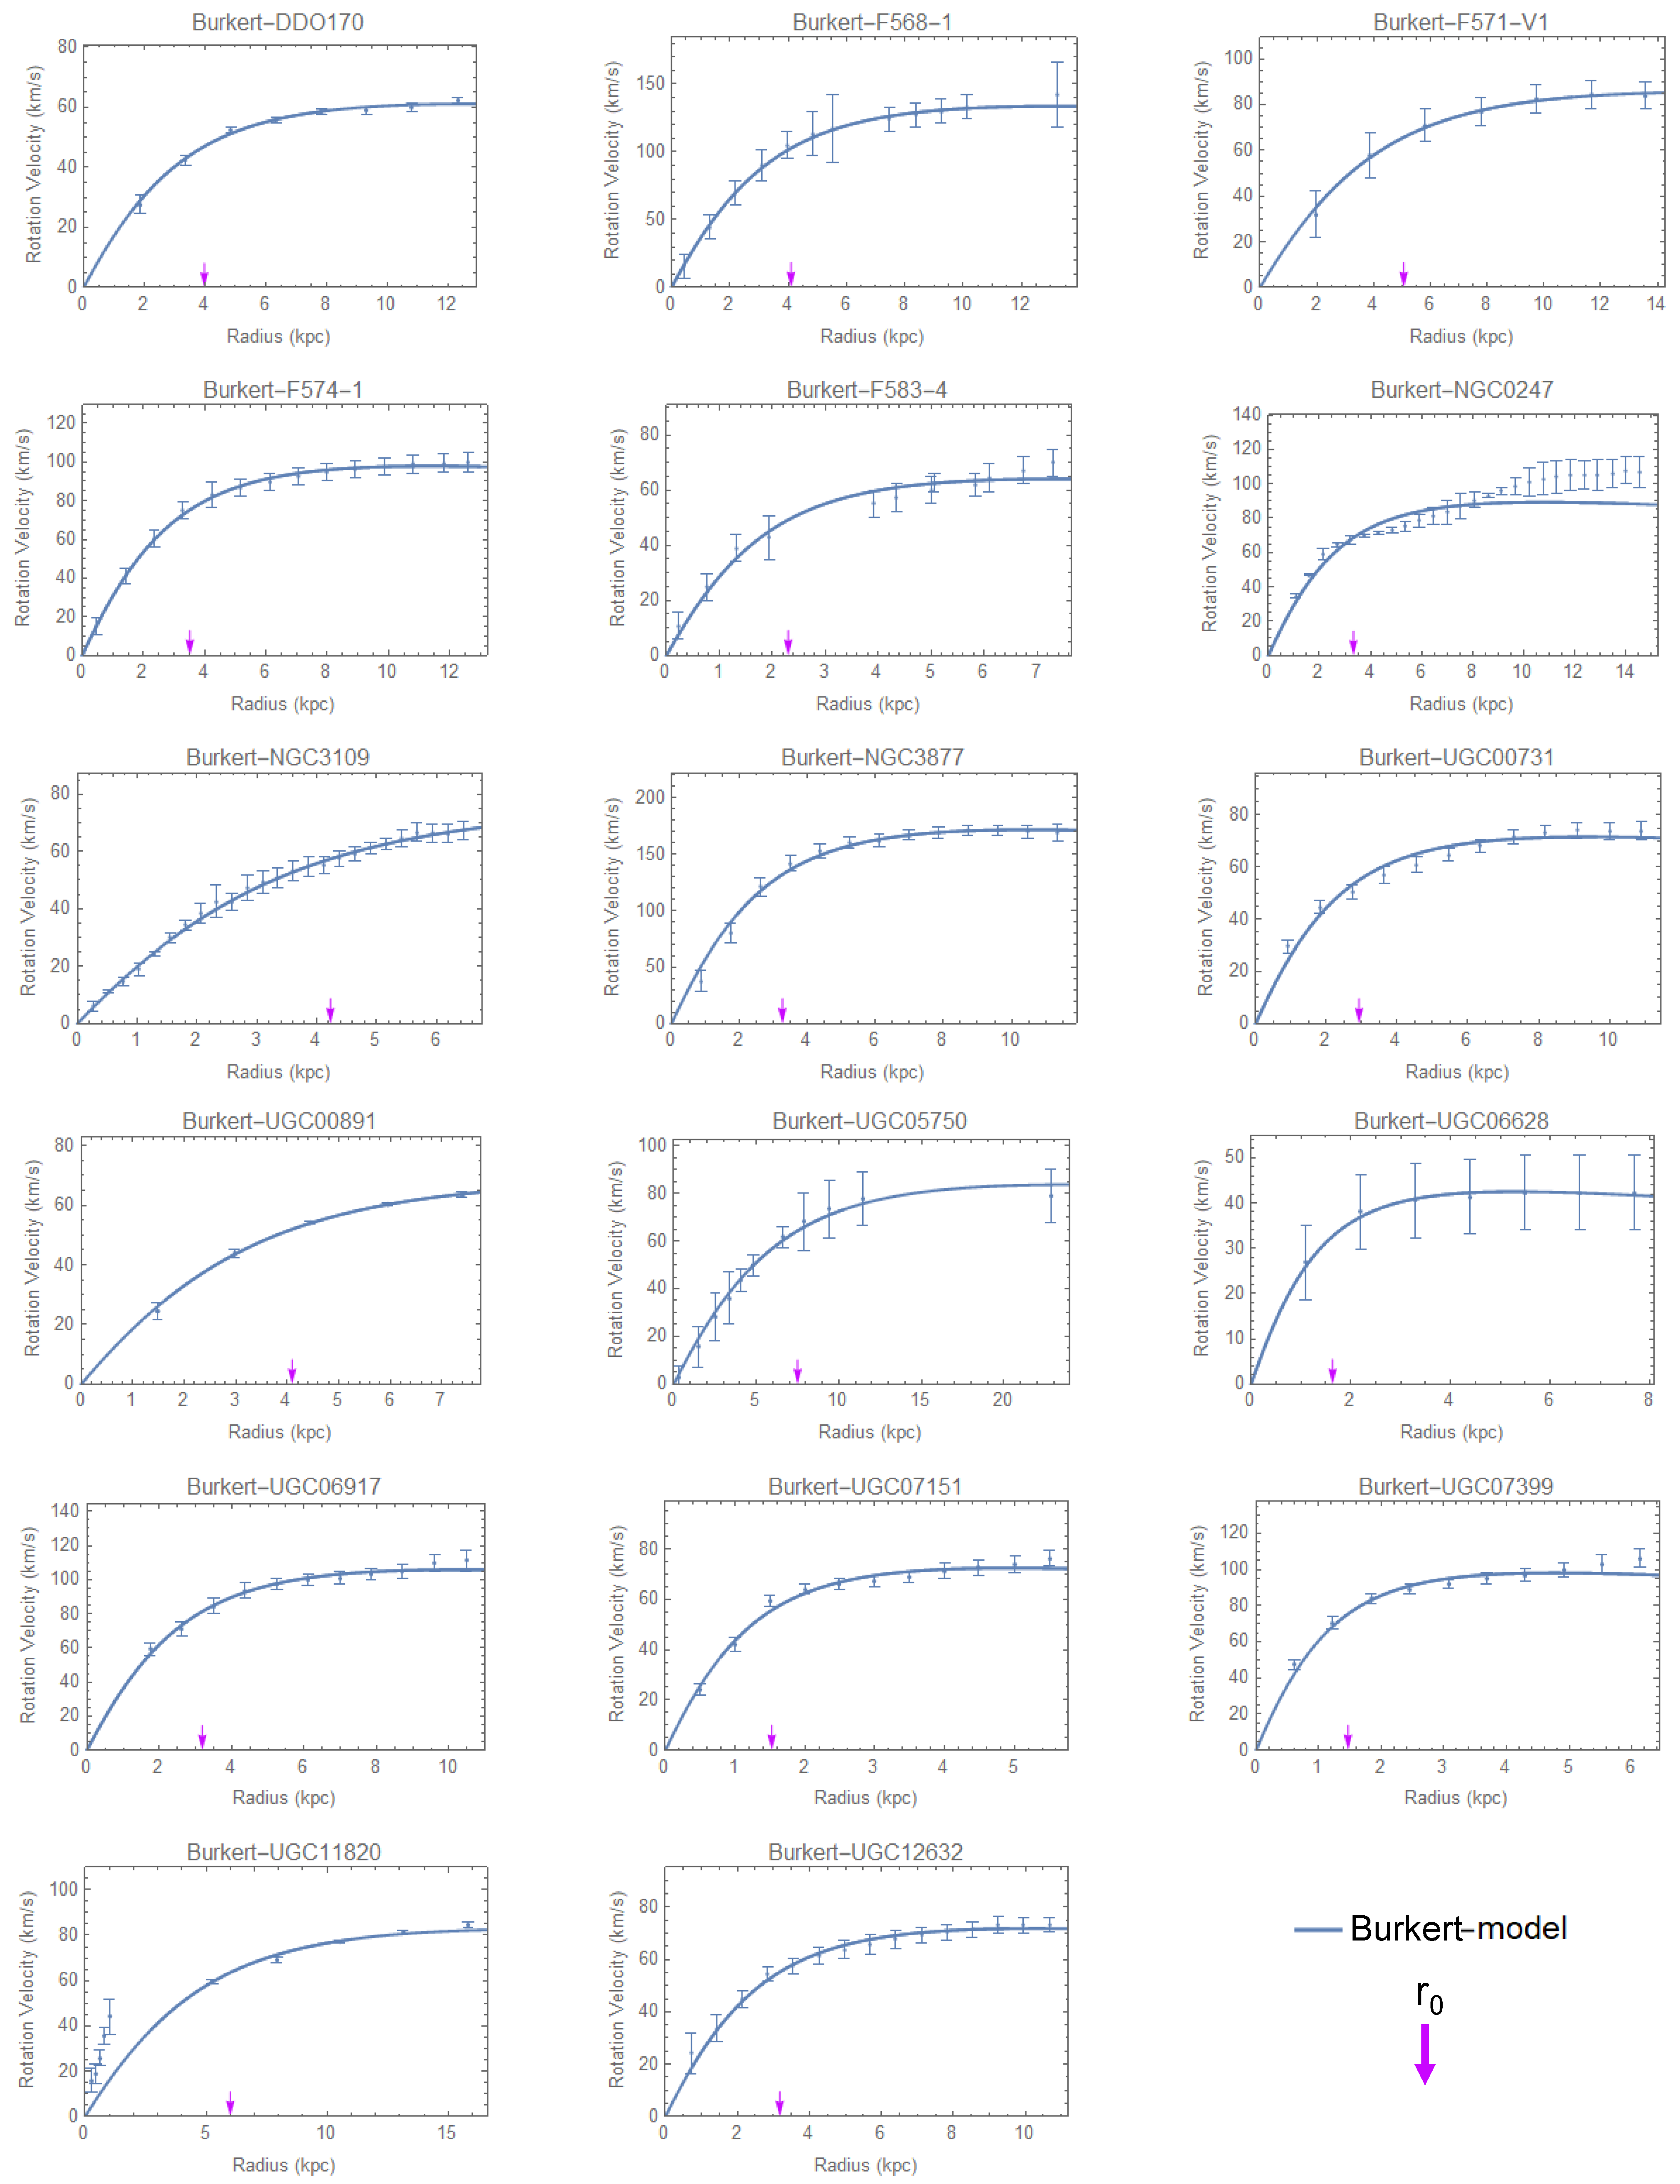
Figure 5 depict the fits of the Burkert model to the 17 RCs used in the SNFW fits. Table 3 and Table 4 indicate that three out of these 17 RCs are fitted with a . Therefore, we resort to a sample of 80 galaxies which fit with .
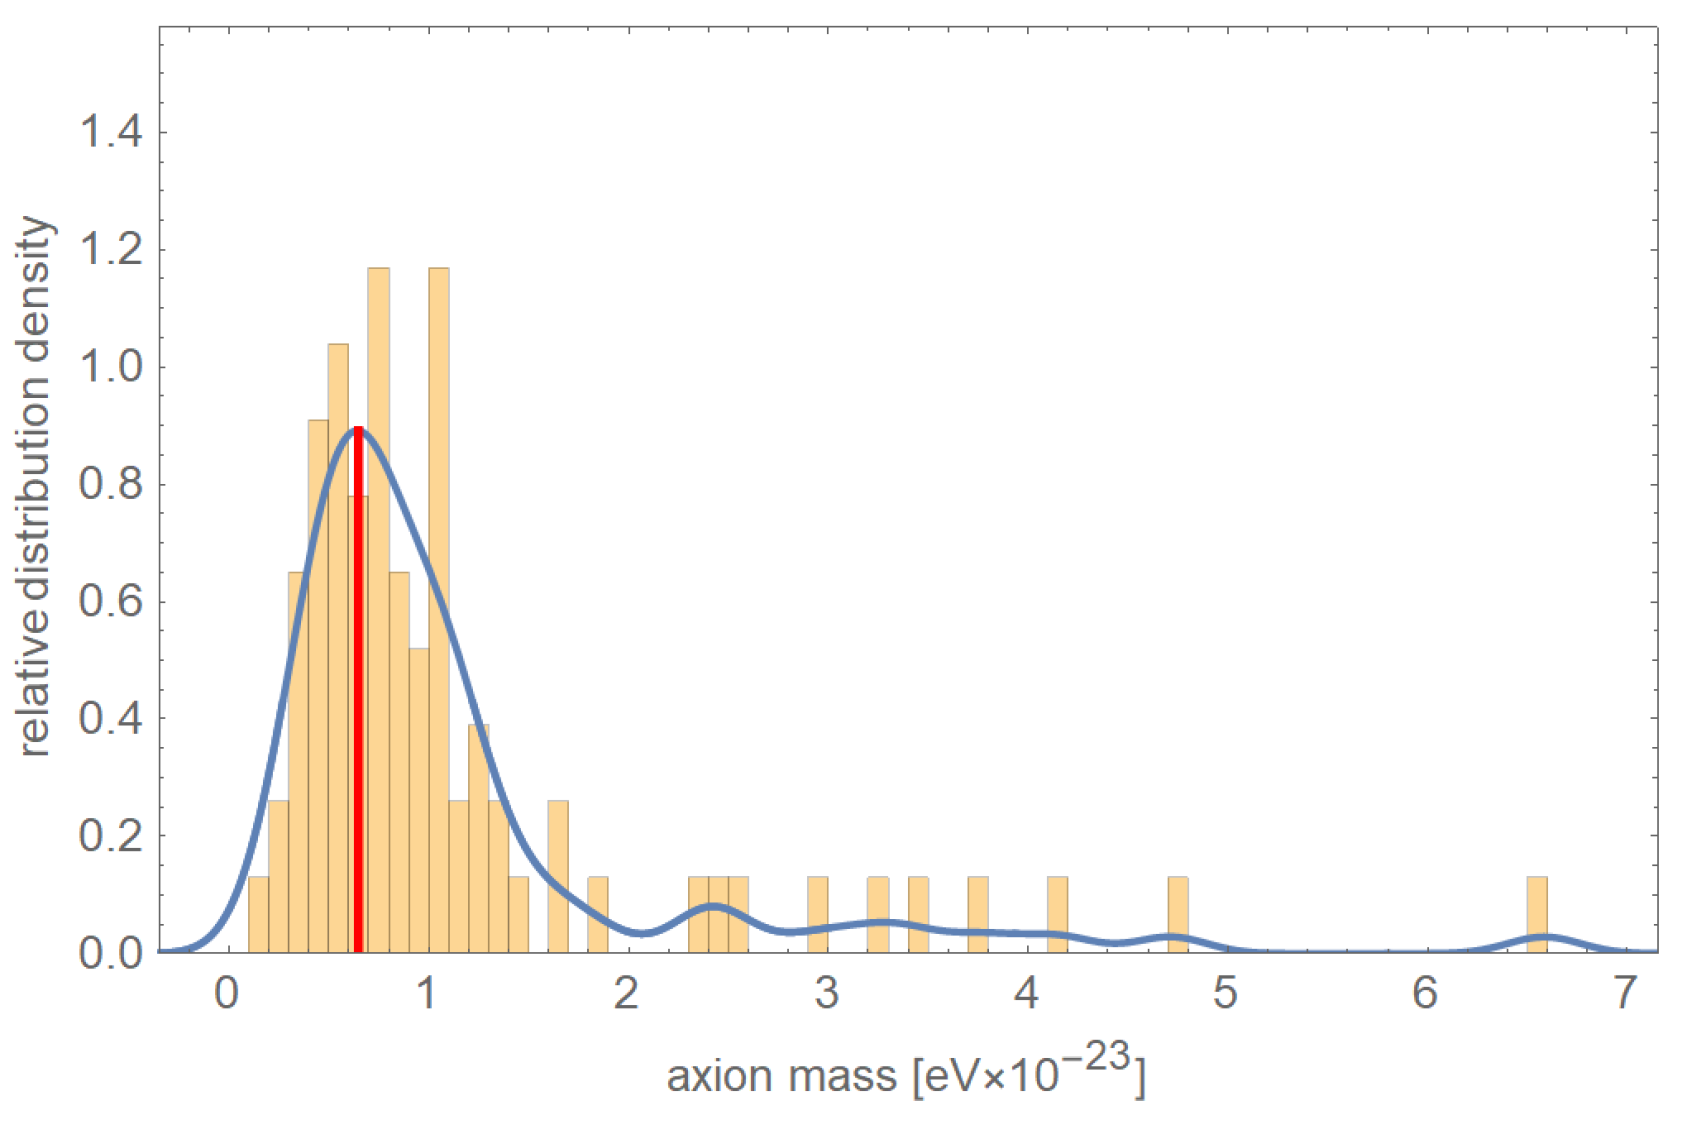
Our strategy to demonstrate independence of the mean value of on the details of the two realistic models SNFW and Burkert is to also determine it from Equation (5). To do this, we use the value of the gravitational Bohr radius in Equation (23) and the values of extracted from RC fits within an ensemble of 80 SPARC galaxies to the Burkert model. The results are shown in Table 3 and Table 4, Figure 6 and Figure 7. This yields a frequency distribution of shown in Figure 8. Obviously, the maximum of the smooth-kernel distribution, eV, is compatible with that in the SNFW model . Notice how clusters around the value .
In our treatment of cosmological and astrophysical implications, we appeal to the mean value of -extractions in the SNFW and the Burkert model as
4. Galactic Central Regions and the Dark Sector of the Universe
Interpreting the dark-matter structure of a typical low-surface-brightness galaxy as an e-lump, we have kpc from the SNFW model, see Section 3.2. Therefore, the value of in Equation (9) is
With eV Equation (1) yields
This is by only a factor 15 smaller than the scale (keV the mass of the electron) of an SU(2) Yang–Mills theory proposed in [55] to originate the electron’s mass in terms of a fuzzy ball of deconfining phase. There the deconfining region is immersed into the confining phase and formed by the selfintersection of a center-vortex loop. Considering an undistorted Yang–Mills theory for simplicity1, the factor of 15 could be explained by a stronger screening of topological charge density—the origin of the axial anomaly—in the confining ground state, composed of round, pointlike center-vortex loops, versus the deconfining thermal ground state, made of densely packed, spatially extended (anti)caloron centers subject to overlapping peripheries [26]. The factor of 15 so far is a purely phenomenological result (it could be expected to be O(100) or higher) which is plausible qualitatively because of the reduced topological charge density in the confining phase where overlapping magnetic monopoles and antimonopoles, aligned within hardly resolved center vortices, are the topological charge carriers. The complex interplay between the would-be Goldstone nature of the axion, as prescribed by fermion interaction at the Planck scale, and the topological charge density of an SU(2) Yang–Mills theory deeply in its confining phase is anything but understood quantitatively so far. One may hope that simulations of the axion potential in a center-vortex model of the confining phase, such a proposed in [66], will yield more quantitative insights in the future.
The link between the masses of the three species of ultralight axions, whose fuzzy condensates form lumps of typical masses , , and , with the three lepton families via the Planck-scale originated axial anomaly within confining phases of SU(2) Yang–Mills theories is compelling. In particular, can be determined by mild modelling of direct observation, as done in Section 3, while and are predicted by an appeal to Equations (11). Such a scenario allows to address two questions: (i) the implication of a given lump’s selfgravity for its stability and (ii) the cosmological origin of a given species of isolated lumps.
Before we discuss question (i) we would like to provide a thermodynamical argument, based on our knowledge gained about axion and lump masses in terms of Yang–Mills scales and the Planck mass, why Planck-scale axions associated with the lepton families always occur in the form of fuzzy or homogeneous condensates. Namely, the Yang–Mills scales , , and together with Equations (1) and (26), yield axion masses as
The critical temperature for the Bose–Einstein condensation of a quantum gas of free bosons of mass and (mean) number density is given as
All three critical temperatures are comfortably larger than the Planck mass GeV such that throughout the Universe’s expansion history and modulo depercolation, which generates a nonthermal halo of particles correlated on the de Broglie wave length around a condensate core, the Bose-condensed state of e-, -, and -axions is guaranteed and consistent with , compare with Equation (12).
We now turn back to question (i). Explicit lump masses can be obtained from Equation (11) based on the typical mass of an e-lump. One has
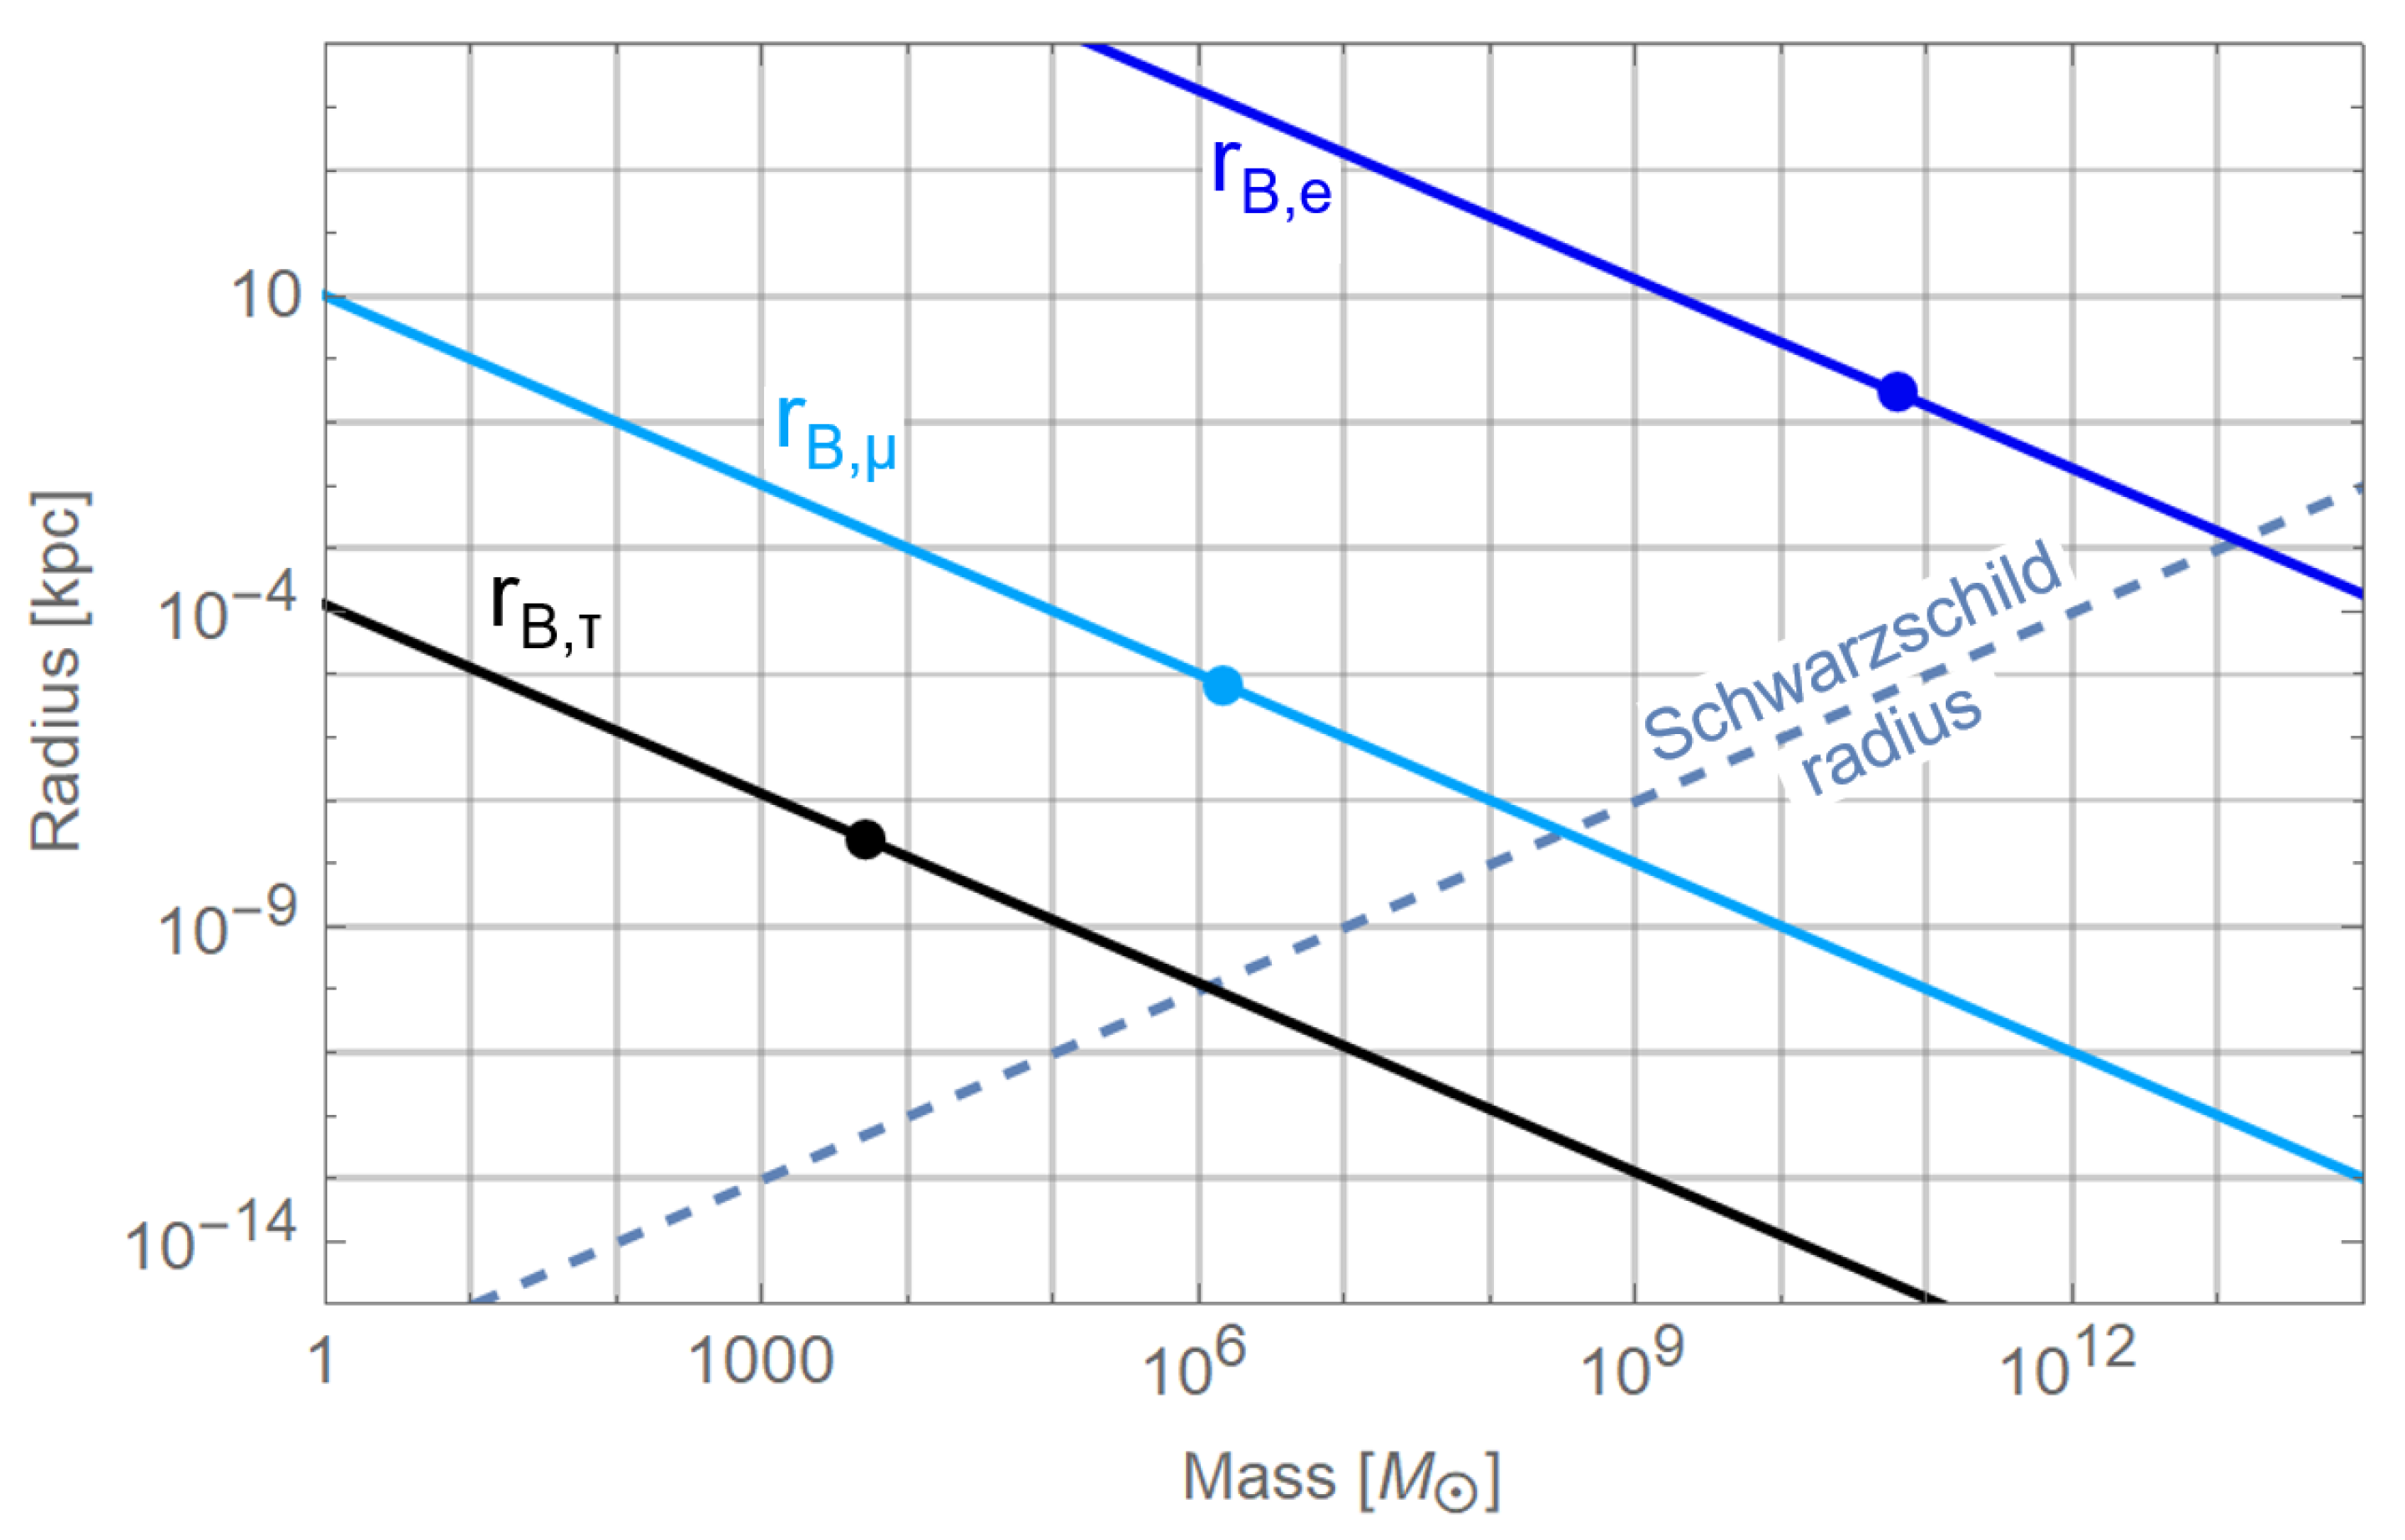
For the computation of the respective gravitational Bohr radii according to Equation (5) both quantities, axion mass and lump mass , are required. To judge the gravitational stability of a given isolated and unmerged lump throughout its evolution a comparison between the typical Bohr radius and the typical Schwarzschild radius , defined as
is in order. Using , Figure 9 indicates the implied values of the Bohr radii , , and by dots on the curves of all possible Bohr radii as functions of their lump masses when keeping the axion mass fixed. Notice that for all three cases, e-lumps, -lumps, and -lumps, typical Bohr radii are considerably larger than their Schwarzschild radii. Indeed, from Equations (1), (10), and (31) it follows that
With we have . An adiabatic pursuit of the solid lines in Figure 9 down to their intersections with the dashed line reveals that an increase of lump mass by a factor is required to reach the critical mass for black-hole formation. While this is unlikely to occur through mergers of e-lumps within their peers it is conceivable for merging - and -lumps, see below.
The mean mass density of a lump scales with the fourth power of the Yang–Mills scale, see Eqsuation (8), (10) and (13). With the hierarchies in Yang–Mills scales or it is conceivable that sufficiently large number of lumps of a higher Yang–Mills scale, embedded into a lump of a lower scale, catalyse the latter’s gravitational compaction to the point of collapse, see, however, discussion in Section 5.1.
With Equation (11) we have such that a dark mass of the selfgravitating dark-matter disk of the Milky Way, exhibiting a radial scale of kpc and a mass of [62], would contain a few previously isolated but now merged e-lumps. This implies with Equation (11) a -lump mass of
In [62], the mass of the dark halo of the Milky Way, which is virialised up to kpc, is determined as . In addition to the halo and the disk, there is a ringlike dark-matter structure within (13⋯18.5) kpc of mass . Since these structures probably are, judged within the here-discussed framework, due to contaminations of a seeding e-lump by the accretion of - and -lumps we ignore them in what follows. In any case, a virialised dark-matter halo of 350 kpc radial extent easily accomodates the dark mass ratio ∼ between the selfgravitating dark-matter disk and the dark halo in terms of accreted - and -lumps.
Interestingly, the lower mass bound of Equation (33) is contained in the mass range [61] or [60] of the central compact object extracted from orbit analysis of S-stars.
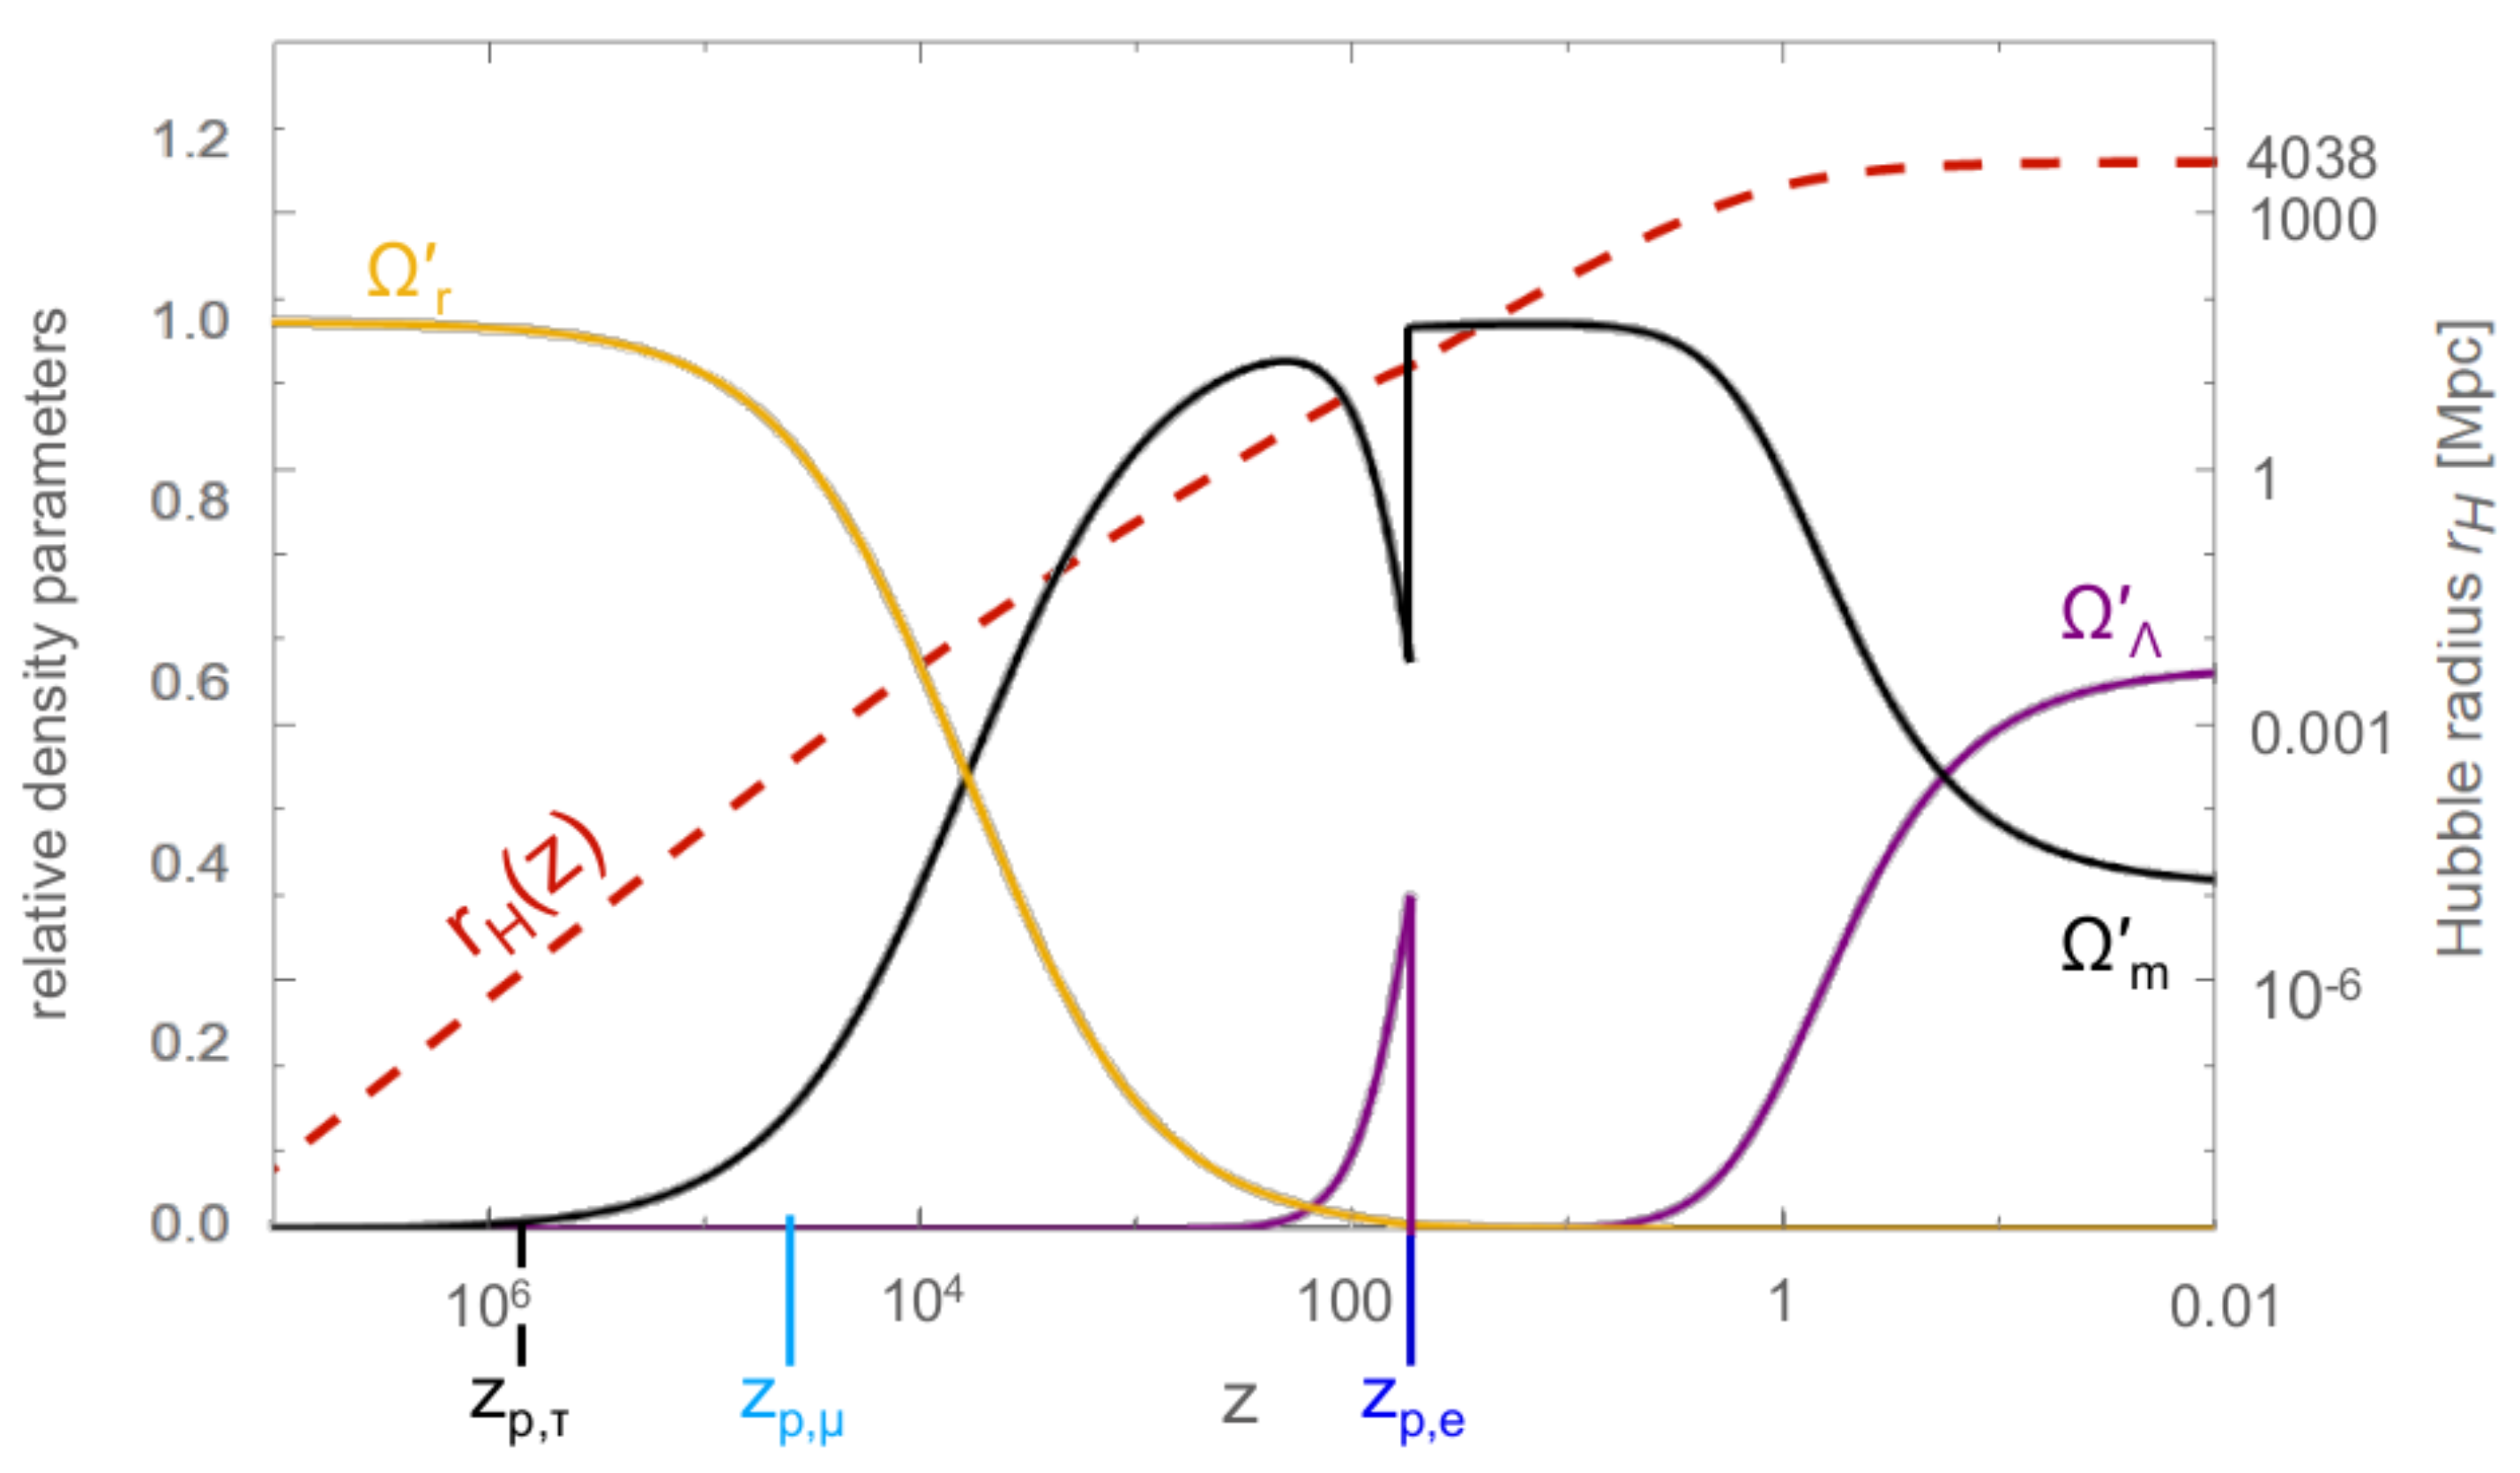
Next, we discuss question (ii). Consider a situation where the gravitational Bohr radius exceeds the Hubble radius at some redshift z. Here defines the Hubble parameter subject to a given cosmological model. In such a situation, the lump acts like a homogeneous energy density (dark energy) within the causally connected region of the Universe roughly spanned by . If falls sizably below then formerly homogeneous energy density may decay into isolated lumps. In order to predict at which redshift such a depercolation epoch has taken place we rely on the extraction of the epoch in [16] for the depercolation of e-lumps. To extract the depercolation redshifts and we use the cosmological model SU(2) proposed in [16] with parameters values given in column 2 of Table 1 of that paper. In Figure 10 the relative density parameters of the cosmological model SU(2) are depicted as functions of z, and the point of e-lump depercolation is marked by the cusps in dark energy and matter.
The strategy to extract and out of information collected at is to determine the ratio of Mpc at and kpc for a typical, isolated, and unmerged e-lump as
It is plausible that can be promoted to a universal (that is, independent of the Yang–Mills scale and temperature) constant , again, because of the large hierarchy between all Yang–Mills scales to the Planck mass . Moreover, the ratio of radiation temperature to the Planck mass remains very small within the regime of redshifts considered in typical CMB simulations. Using the cosmological model SU(2), Equation (13), and demanding to set the condition for - and -lump depercolation (), one obtains
In Figure 10 the relative density parameters (dark energy), for total matter (baryonic and dark), (total radiation), and the Hubble radius are depicted as functions of z. Moreover, the redshifts of e-lump, -lump, and -lump depercolations—, , and —are indicated by vertical lines intersecting the z-axis. The depercolation epochs for - and -lumps at redshifts 40,000, and 685,000 are not modelled within SU(2) because the Universe then is radiation dominated.
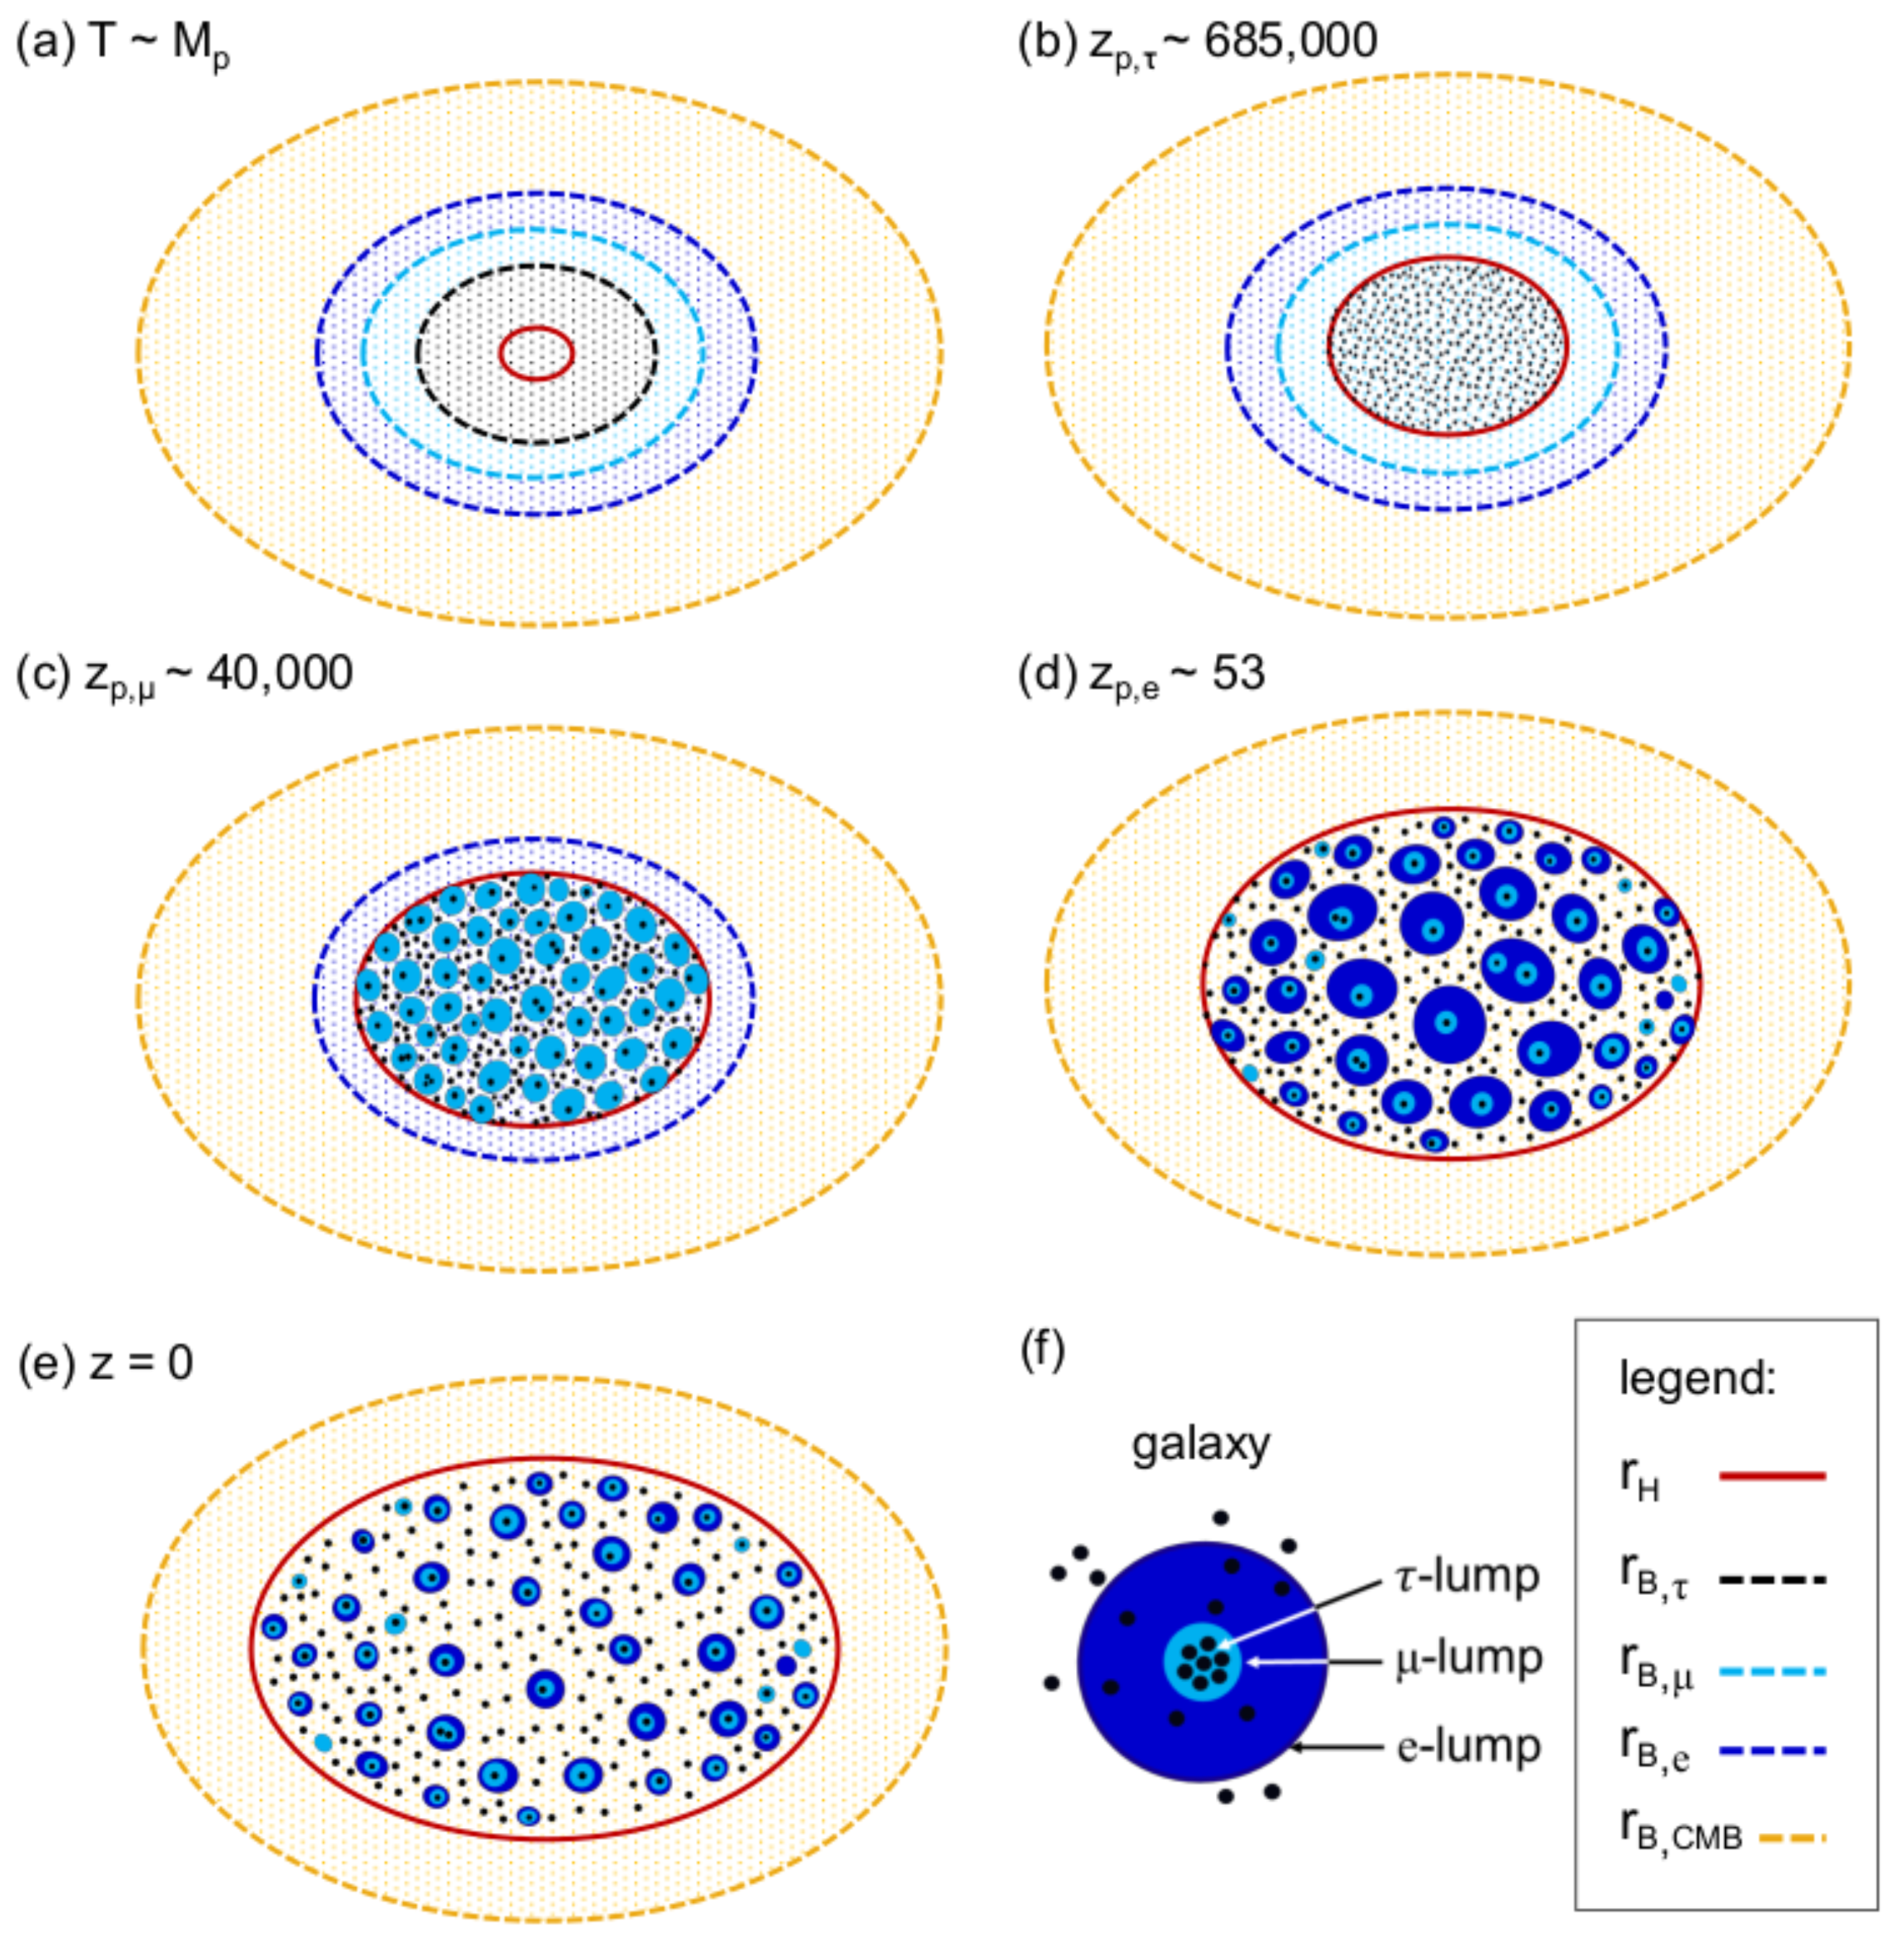
In Figure 11 a schematic evolution of the Universe’s dark sector, subject to the SU(2) Yang–Mills theories SU(2), SU(2), SU(2), and SU(2) invoking Planck-scale induced axial anomalies, is depicted.
After a possible epoch of Planck-scale inflation and reheating the temperature of the radiation dominated Universe is close to the Planck mass , and . In this situation, the Bohr radii of the various hypothetical lump species (Peccei-Quinn scale , SU(2), SU(2), SU(2), and SU(2) Yang–Mills dynamics) are much larger than , and the (marginal) dark sector of the model then solely contains dark energy.
Around 685,000 (radiation domination) the depercolation of -lumps occurs for 55,500. Once released, they evolve like pressureless, non-relativistic particles and, cosmologically seen, represent dark matter.
As the Universe expands further, the ratio 55,500 is reached such that -lumps start to depercolate at 40,000. Since they contribute to the cosmological dark-matter density roughly the same amount like -lumps, see [16] for a fit of so-called primordial and emergent dark-matter densities to TT, TE, and EE power spectra of the 2015 Planck data, one concludes from Equation (11) that their number density is by a factor smaller than that of -lumps. For a first estimate this assumes a neglect of local gravitational interactions. That is, at -lump depercolation there are roughly 300 -lumps inside one -lump. Each of these -lumps possesses a mass of . The implied accretion process involving additional -lumps may catalyse the gravitational compaction of the thus contaminated -lump, see discussion in Section 5.1.
At e-lumps depercolate [16]. Again, disregarding local gravitational binding, we conclude from Equation (11) and a nearly equal contribution of each lump species to the cosmological dark-matter density [16] that the number densities of - and -lumps are by factors of 42,750 and 283 × 42,750, respectively, larger than the number density of e-lumps. At e-lump depercolation we thus have 42,750 -lumps and 42,750 × 283 -lumps within one e-lump.
Again, ignoring local gravitational binding effects, the dilution of - and -lump densities by cosmological expansion predicts that today we have -lumps and -lumps within one e-lump. Local gravitational binding should correct these numbers to higher values but the orders of magnitude—O(1) for -lumps and O(100) for -lumps—should remain unaffected. It is conspicuous that the number of globular clusters within the Milky Way is in the hundreds [67], with typical masses between ten to several hundred thousand solar masses [61]. With it is plausible that the dark-mass portion of these clusters is constituted by a single or a small number of merged -lumps. In addition, in the Milky Way there is one central massive and dark object with about [61] or solar masses [60]. If, indeed, there is roughly one isolated -lump per isolated e-lump today then the mass range of the Milky Way’s dark-matter disk, interpreted as a merger of few isolated e-lumps, implies the mass range of Equation (33) for the associated -lump merger. This range contains the mass of the central massive and dark object determined in [60,61].
5. Discussion, Summary, and Outlook
5.1. Speculations on Origins of Milky Way’s Structure
The results of Section 5 on mass ranges of -lumps, -lumps, and e-lumps being compatible with typical masses of globular clusters, the mass of the central compact Galactic object [60,61], and the mass of the selfgravitating dark-matter disk of the Milky Way, respectively, is compelling. We expect that similar assignments can be made to according structures in other spiral galaxies.
Could the origin of the central compact object in Milky Way be the result of - and -lump mergers? As Figure 9 suggests, a merger of isolated - or -lumps is required for black hole formation. Since we know that the mass of the central compact object is a merger of -lumps is excluded for Milky Way. Thus, only a merger of -lumps, possibly catalysed by the consumption of a few -lumps, is a viable candidate for black-hole formation in our Galaxy. Such a process—merging of several hundred -lumps within the gravitational field of a few merging -lumps down to the point of gravitational collapse—would be consistent with the results of [60,61] who fit stellar orbits around the central massive object of Milky Way extremely well to a single-point-mass potential. Indeed, the gravitational Bohr radius of a -lump is kpc while the closest approach of an S2 star to the gravitational center of the central massive object of Milky Way is kpc [60]. Therefore, -lumps need to collapse in order to be consistent with a point-mass potential.
The Milky Way’s contamination with baryons, its comparably large dark-disk mass vs. the mass of the low-surface-brightness galaxies analysed in Section 3, and possibly tidal shear from the dark ring and the dark halo during its evolution introduce deviations from the simple structure of a typical low-surface-brightness galaxy. Simulations, which take all the here-discussed components into account, could indicate how typical such structures are, rather independently of primordial density perturbations.
Isolated -, -, and e-lumps, which did not accrete sufficiently many baryons to be directly visible, comprise dark-matter galaxies that are interspersed in between visible galaxies. The discovery of such dark galaxies, pinning down their merger-physics, and determinations of their substructure by gravitational microlensing and gravitational-wave astronomy could support the here-proposed scenario of active structure formation on sub-galactic scales.
5.2. Summary and Outlook
In this paper, we propose that the dark Universe can be understood in terms of axial anomalies [21,22,23] which are invoked by screened Yang–Mills scales in association with the leptonic mass spectrum. This produces three ultra-light axion species. Such pseudo Nambu-Goldstone bosons are assumed to owe their very existence to a gravitationally induced chiral symmetry breaking with a universal Peccei–Quinn scale [25] of order the Planck mass GeV [30]. We therefore refer to each of these particle species as Planck-scale axions. Because of the relation the screened Yang–Mills scale derives from knowledge of the axion mass . Empirically, the here-extracted screened scale eV points to the first lepton family, compare with [55]. This enables predictions of typical lump and axion masses in association with two additional SU(2) Yang–Mills theories associating with and leptons.
Even though the emergence of axion mass [25] and the existence of lepton families [55] are governed by the same SU(2) gauge principle, the interactions between these ultra-light pseudo scalars and visible leptonic matter is extremely feeble. Thus, the here-proposed relation between visible and dark matter could demystify the dark Universe. An important aspect of Planck-scale axions is their Bose–Einstein, yet non-thermal, condensed state. A selfgravitating, isolated fuzzy condensate (lump) of a given axion species is chiefly characterised by the gravitational Bohr radius [36] given in terms of the axion mass and the lump mass (virial mass), see Equation (5). As it turns out, for the information about the latter two parameters is contained in observable rotation curves of low-surface-brightness galaxies with similar extents. Realistic models for the dark-matter density profiles derive from ground-state solutions of the spherically symmetric Poisson–Schrödinger system at zero temperature and for a single axion species. These solutions describe selfgravitating fuzzy axion condensates, compare with [47]. Two such models, the Soliton-NFW and the Burkert model, were employed in our present extractions of and under the assumption that the dark-matter density in a typical low-surface brightness galaxy is dominated by a single axion species. Our result eV is consistent with the result of [49]: eV. Interestingly, such an axion mass is close to the result eV eV [53] obtained by treating axions as a classical ideal gas of non-relativistic particles—in stark contrast to the Bose condensed state suggested by Equation (28) or the gas surrounding it with intrinsic correlations governed by large de-Broglie wavelengths. This value of the axion mass is considerably lower then typical lower bounds obtained in the literature: eV [51], eV [39], eV [54], and eV in [47]. We propose that this discrepancy could be due to the omission of the other two axion species with a mass spectrum given by Equation (27). For example, the dark-matter and thus baryonic density variations along the line of sight probed by a Lyman- forest do not refer to gravitationally bound systems and therefore should be influenced by all three axion species.
Once axions and their lumps are categorised, questions about (i) the cosmological origin of lumps and (ii) their role in the evolution of galactic structure can be asked. Point (i) is addressed by consulting a cosmological model (SU(2) [16]) which requires the emergence of dark matter by lump depercolation at defined redshifts, see also [68]. Depercolation of e-lumps at redshift anchors the depercolations of the two other lump species. One obtains 40,000 and 685,000.
The critical temperature of SU(2) for the deconfining-preconfining phase transition (roughly equal to the temperature of the Hagedorn transition to the confining phase [26]) is keV [55]. A question arises whether this transition could affect observable small-scale angular features of the CMB. In the SU(2) based cosmological model of [16] keV corresponds to a redshift of . (Typically, CMB simulation are initialised at [69]). Traversing the preconfining-deconfining phase transition at an already strongly radiation dominated Universe receives additional radiation density and entropy. However, we expect that the horizon crossing of curvature perturbation at , which may influence small-scale matter perturbations, will affect CMB anisotropies on angular scales only. Therefore, Silk damping would reduce the magnitudes of these multipoles to below the observational errors.
Up to the present, lump depercolation does not occur for the Planck-scale axion species associated with SU(2): here, the gravitational Bohr radius of the axion condensate always exceeds the Hubble radius by many orders of magnitude. As for point (ii), the masses and Bohr radii of - and -lumps seem to be related with the central massive compact object of the Milky Way [60,61] and globular clusters [62], respectively. Within a given galaxy such active components of structure formation possibly originate compact stellar streams through tidal forces acting on -lumps. Whether this is supported by observation could be decided by a confrontation of N-body simulations (stars) in the selfgravitating background of the externally deformed lump.
Apart from cosmological and astrophysical observation, which should increasingly be able to judge the viability of the here-proposed scenario, there are alternative terrestrial experiments which can check the predictions of the underlying SU(2) gauge-theory pattern. Let us quote two examples: First, there is a predicted low-frequency spectral black-body anomaly at low temperatures (K) [70] which could be searched for with a relatively low instrumental effort. Second, an experimental link to SU(2) would be the detection of the Hagedorn transition in a plasma at electron temperature keV and the stabilisation of a macroscopically large plasma ball at a temperature of keV [55]. Such electron temperatures should be attainable by state-of-the-art nuclear-fusion experiments such as ITER or by fusion experiments with inertial plasma confinement.
Author Contributions
Conceptualization, J.M. and R.H.; methodology, J.M. and R.H.; software, J.M. and R.H.; validation, J.M. and R.H.; formal analysis, J.M. and R.H.; investigation, J.M. and R.H.; resources, J.M. and R.H.; data curation, J.M. and R.H.; writing—original draft preparation, J.M. and R.H.; writing—review and editing, J.M. and R.H.; visualization, J.M. and R.H.; supervision, J.M. and R.H.; project administration, J.M. and R.H.; funding acquisition, J.M. and R.H. All authors have read and agreed to the published version of the manuscript.
Funding
This research received no external funding.
Institutional Review Board Statement
Not applicable.
Informed Consent Statement
Not applicable.
Data Availability Statement
The SPARC library was analysed in support of this research [64]. The processed data and program underlying this article will be shared on request to the corresponding author.
Conflicts of Interest
The authors declare no conflict of interest.
| 1 | The chiral dynamics at the Planck scale, which produces the axion field, to some extent resolves the ground states of Yang–Mills theories: axions become massive by virtue of the anomaly because of this very resolution of topological charge density. |
References
- Rubin, V.C.; Ford, W.K., Jr. Rotation of the Andromeda Nebula from a Spectroscopic Survey of Emission Regions. Astrophys. J. 1970, 159, 379–403. [Google Scholar] [CrossRef]
- Zwicky, F. On the Masses of Nebulae and of Clusters of Nebulae. Astrophys. J. 1937, 86, 217. [Google Scholar] [CrossRef]
- Tucker, W.; Blanco, P.; Rappoport, S.; David, L.; Fabricant, D.; Falco, E.E.; Forman, W.; Dressler, A.; Ramella, M. 1e0657-56: A contender for the hottest known cluster of galaxies. Astrophys. J. 1998, 496, L5. [Google Scholar] [CrossRef] [Green Version]
- Clowe, D.; Bradač, M.; Gonzalez, A.H.; Markevitch, M.; Randall, S.W.; Jones, C.; Zaritsky, D. A Direct Empirical Proof of the Existence of Dark Matter. Astrophys. J. 2006, 648, L109. [Google Scholar] [CrossRef]
- de Bernardis, P.; Ade, P.A.R.; Bock, J.J.; Bond, J.R.; Borrill, J.; Boscaleri, A.; Coble, K.; Crill, B.P.; De Gasperis, G.; Farese, P.C.; et al. A flat Universe from high-resolution maps of the cosmic microwave background radiation. Nature 2000, 404, 955. [Google Scholar] [CrossRef]
- Riess, A.G.; Filippenko, A.V.; Challis, P.; Clocchiatti, A.; Diercks, A.; Garnavich, P.M.; Gilliland, R.L.; Hogan, C.J.; Jha, S.; Kirshner, R.P.; et al. Observational Evidence from Supernovae for an Accelerating Universe and a Cosmological Constant. Astron. J. 1998, 116, 1009. [Google Scholar] [CrossRef] [Green Version]
- Perlmutter, S.; Aldering, G.; Goldhaber, G.; Knop, R.A.; Nugent, P.; Castro, P.G.; Deustua, S.; Fabbro, S.; Goobar, A.; Groom, D.E.; et al. Measurements of Ω and Λ from 42 high redshift supernovae. Astrophys. J. 1999, 517, 565–586. [Google Scholar] [CrossRef]
- Verde, L.; Treu, T.; Riess, A.G. Tensions between the early and late Universe. Nat. Astron. 2019, 3, 891. [Google Scholar] [CrossRef]
- Aghanim, N.; Akrami, Y.; Ashdown, M.; Aumont, J.; Baccigalupi, C.; Ballardini, M.; Banday, A.J.; Barreiro, R.B.; Bartolo, N.; Basak, S.; et al. Planck 2018 results. VI. Cosmological parameters. Astron. Astrophys. 2020, 641, A6. [Google Scholar] [CrossRef] [Green Version]
- Reid, M.J.; Pesce, D.W.; Riess, A.G. An Improved Distance to NGC 4258 and Its Implications for the Hubble Constant. Astrophys. J. 2019, 886, L27. [Google Scholar] [CrossRef] [Green Version]
- Riess, A.G.; Casertano, S.; Yuan, W.; Macri, L.; Anderson, J.; MacKenty, J.W.; Bowers, J.B.; Clubb, K.I.; Filippenko, A.V.; Jones, D.O.; et al. New Parallaxes of Galactic Cepheids from Spatially Scanning the Hubble Space Telescope: Implications for the Hubble Constant. Astrophys. J. 2018, 855, 136. [Google Scholar] [CrossRef] [Green Version]
- Wong, K.C.; Suyu, S.H.; Auger, M.W.; Bonvin, V.; Courbin, F.; Fassnacht, C.D.; Halkola, A.; Rusu, C.E.; Sluse, D.; Sonnenfeld, A.; et al. H0LiCOW IV. Lens mass model of HE 0435-1223 and blind measurement of its time-delay distance for cosmology. Mon. Not. R. Astron. Soc. 2017, 465, 4895–4913. [Google Scholar] [CrossRef] [Green Version]
- Abbott, T.; Abdalla, F.; Alarcon, A.; Aleksić, J.; Allam, S.; Allen, S.; Amara, A.; Annis, J.; Asorey, J.; Avila, S.; et al. Dark Energy Survey year 1 results: Cosmological constraints from galaxy clustering and weak lensing. Phys. Rev. D 2018, 98. [Google Scholar] [CrossRef] [Green Version]
- Troxel, M.; MacCrann, N.; Zuntz, J.; Eifler, T.; Krause, E.; Dodelson, S.; Gruen, D.; Blazek, J.; Friedrich, O.; Samuroff, S.; et al. Dark Energy Survey Year 1 results: Cosmological constraints from cosmic shear. Phys. Rev. D 2018, 98. [Google Scholar] [CrossRef] [Green Version]
- Tröster, T.; Sánchez, A.G.; Asgari, M.; Blake, C.; Crocce, M.; Heymans, C.; Hildebrandt, H.; Joachimi, B.; Joudaki, S.; Kannawadi, A.; et al. Cosmology from large-scale structure. Astron. Astrophys. 2020, 633, L10. [Google Scholar] [CrossRef] [Green Version]
- Hahn, S.; Hofmann, R.; Kramer, D. SU(2)CMB and the cosmological model: Angular power spectra. Mon. Not. R. Astron. Soc. 2019, 482, 4290. [Google Scholar] [CrossRef]
- Krishnan, C.; Mohayaee, R.; Colgáin, E.Ó.; Sheikh-Jabbari, M.M.; Yin, L. Does Hubble Tension Signal a Breakdown in FLRW Cosmology? arXiv 2021, arXiv:2105.09790. [Google Scholar]
- Kolb, E.W.; Turner, M.S. The Early Universe, Taylor and Francis; Westview Press: Boulder, CO, USA, 1990. [Google Scholar]
- Akerib, D.; Araújo, H.M.; Bai, X.; Bailey, A.J.; Balajthy, J.; Bedikian, S.; Bernard, E.; Bernstein, A.; Bolozdynya, A.; Bradley, A.; et al. First results from the LUX dark matter experiment at the Sanford Underground Research Facility. Phys. Rev. Lett. 2014, 112, 091303. [Google Scholar] [CrossRef] [PubMed] [Green Version]
- Akerib, D.S.; Akerlof, C.W.; Alsum, S.K.; Araújo, H.M.; Arthurs, M.; Bai, X.; Bailey, A.J.; Balajthy, J.; Balashov, S.; Bauer, D.; et al. Projected WIMP sensitivity of the LUX-ZEPLIN dark matter experiment. Phys. Rev. D 2020, 101, 052002. [Google Scholar] [CrossRef] [Green Version]
- Adler, S.L.; Bardeen, W.A. Absence of higher order corrections in the anomalous axial vector divergence equation. Phys. Rev. 1969, 182, 1517–1536. [Google Scholar] [CrossRef]
- Bell, J.; Jackiw, R. A PCAC puzzle: π0→γγ in the σ model. Nuovo Cim. A 1969, 60, 47–61. [Google Scholar] [CrossRef] [Green Version]
- Fujikawa, K. Path Integral Measure for Gauge Invariant Fermion Theories. Phys. Rev. Lett. 1979, 42, 1195–1198. [Google Scholar] [CrossRef]
- Atherton, H.W.; Bovet, C.; Coet, P.; Desalvo, R.; Doble, N.; Maleyran, R.; Anderson, E.W.; Von Dardel, G.; Kulka, K.; Boratav, M.; et al. Direct measurement of the lifetime of the neutral pion. Phys. Lett. B 1985, 158, 81–84. [Google Scholar] [CrossRef]
- Peccei, R.; Quinn, H.R. Constraints Imposed by CP Conservation in the Presence of Instantons. Phys. Rev. D 1977, 16, 1791–1797. [Google Scholar] [CrossRef]
- Hofmann, R. The Thermodynamics of Quantum Yang–Mills Theory: Theory And Applications, 2nd ed.; World Scientific: Singapore, 2016; p. 1. [Google Scholar]
- Candelas, P.; Raine, D.J. General-relativistic quantum field theory: An exactly soluble model. Phys. Rev. D 1975, 12, 965. [Google Scholar] [CrossRef]
- Frieman, J.A.; Hill, C.T.; Stebbins, A.; Waga, I. Cosmology with ultralight pseudo Nambu-Goldstone bosons. Phys. Rev. Lett. 1995, 75, 2077–2080. [Google Scholar] [CrossRef] [PubMed] [Green Version]
- Gross, D.J.; Wilczek, F. Ultraviolet Behavior of Nonabelian Gauge Theories. Phys. Rev. Lett. 1973, 30, 1343–1346. [Google Scholar] [CrossRef] [Green Version]
- Giacosa, F.; Hofmann, R.; Neubert, M. A model for the very early Universe. J. High Energy Phys. 2008, 2, 077. [Google Scholar] [CrossRef]
- Weinberg, D.H.; Bullock, J.S.; Governato, F.; Kuzio de Naray, R.; Peter, A.H.G. Cold dark matter: Controversies on small scales. Proc. Natl. Acad. Sci. USA 2015, 112, 12249–12255. [Google Scholar] [CrossRef] [Green Version]
- Bullock, J.S.; Kolatt, T.S.; Sigad, Y.; Somerville, R.S.; Kravtsov, A.V.; Klypin, A.A.; Primack, J.R.; Dekel, A. Profiles of dark haloes. Evolution, scatter, and environment. Mon. Not. R. Astron. Soc. 2001, 321, 559–575. [Google Scholar] [CrossRef] [Green Version]
- Navarro, J.F.; Frenk, C.S.; White, S.D. A Universal density profile from hierarchical clustering. Astrophys. J. 1997, 490, 493–508. [Google Scholar] [CrossRef]
- Baldeschi, M.R.; Ruffini, R.; Gelmini, G.B. On massive fermions and bosons in galactic halos. Phys. Lett. B 1983, 122, 221–224. [Google Scholar] [CrossRef]
- Membrado, M.; Pacheco, A.; Sañudo, J. Hartree solutions for the self-Yukawian boson sphere. Phys. Rev. A 1989, 39, 4207. [Google Scholar] [CrossRef] [PubMed]
- Ji, S.; Sin, S.J. Late-time Phase transition and the Galactic halo as a Bose Liquid: (II) the Effect of Visible Matter. Phys. Rev. D 1994, 50. [Google Scholar] [CrossRef] [PubMed] [Green Version]
- de Blok, W.J.G.; McGaugh, S.S.; Rubin, V.C. High-Resolution Rotation Curves of Low Surface Brightness Galaxies. II. Mass Models. Astron. J. 2001, 122, 2396–2427. [Google Scholar] [CrossRef] [Green Version]
- Kuzio de Naray, R.; McGaugh, S.S.; de Blok, W.J.G. Mass Models for Low Surface Brightness Galaxies with High Resolution Optical Velocity Fields. Astrophys. J. 2008, 676, 920–943. [Google Scholar] [CrossRef] [Green Version]
- Maleki, A.; Baghram, S.; Rahvar, S. Constraint on the mass of fuzzy dark matter from the rotation curve of the Milky Way. Phys. Rev. D 2020, 101, 103504. [Google Scholar] [CrossRef]
- Pawlowski, M.S.; Kroupa, P. The Vast Polar Structure of the Milky Way Attains New Members. Astrophys. J. 2014, 790, 74. [Google Scholar] [CrossRef] [Green Version]
- Martinez-Medina, L.A.; Robles, V.H.; Matos, T. Dwarf galaxies in multistate scalar field dark matter halos. Phys. Rev. D 2015, 91, 023519. [Google Scholar] [CrossRef] [Green Version]
- Magana, J.; Matos, T. A brief Review of the Scalar Field Dark Matter model. J. Phys. Conf. Ser. 2012, 378, 012012. [Google Scholar] [CrossRef] [Green Version]
- Suárez, A.; Robles, V.H.; Matos, T. A Review on the Scalar Field/Bose–Einstein Condensate Dark Matter Model. Astrophys. Space Sci. Proc. 2014, 38, 107–142. [Google Scholar] [CrossRef] [Green Version]
- Matos, T.; Robles, V.H. Scalar Field (Wave) Dark Matter. 2016. Available online: arXiv:astro-ph.GA/1601.01350 (accessed on 10 September 2020).
- Marsh, D.J.E. Axion Cosmology. Phys. Rep. 2016, 643, 1–79. [Google Scholar] [CrossRef] [Green Version]
- Hui, L.; Ostriker, J.P.; Tremaine, S.; Witten, E. Ultralight scalars as cosmological dark matter. Phys. Rev. D 2017, 95, 043541. [Google Scholar] [CrossRef] [Green Version]
- Schive, H.Y.; Chiueh, T.; Broadhurst, T. Cosmic Structure as the Quantum Interference of a Coherent Dark Wave. Nat. Phys. 2014, 10, 496–499. [Google Scholar] [CrossRef]
- Amorisco, N.C.; Loeb, A. First Constraints on Fuzzy Dark Matter from the Dynamics of Stellar Streams in the Milky Way. 2018. Available online: arXiv:astro-ph.GA/1808.00464 (accessed on 30 October 2020).
- Bernal, T.; Fernández-Hernández, L.M.; Matos, T.; Rodríguez-Meza, M.A. Rotation curves of high-resolution LSB and SPARC galaxies with fuzzy and multistate (ultralight boson) scalar field dark matter. Mon. Not. R. Astron. Soc. 2018, 475, 1447–1468. [Google Scholar] [CrossRef]
- Pawlowski, M.S. The Vast Polar Structure of the Milky Way and Filamentary Accretion of Sub-Halos. In Proceedings of the 13th Marcel Grossmann Meeting on Recent Developments in Theoretical and Experimental General Relativity, Astrophysics, and Relativistic Field Theories, Stockholm, Sweden, 1–7 July 2015; pp. 1724–1726. [Google Scholar] [CrossRef] [Green Version]
- Nadler, E.O.; Wechsler, R.H.; Bechtol, K.; Mao, Y.Y.; Green, G.; Drlica-Wagner, A.; McNanna, M.; Mau, S.; Pace, A.B.; Simon, J.D.; et al. Milky Way Satellite Census—II. Galaxy-Halo Connection Constraints Including the Impact of the Large Magellanic Cloud. Astrophys. J. 2020, 893, 48. [Google Scholar] [CrossRef] [Green Version]
- Caputi, K.I.; Ilbert, O.; Laigle, C.; McCracken, H.J.; Le Fèvre, O.; Fynbo, J.; Milvang-Jensen, B.; Capak, P.; Salvato, M.; Taniguchi, Y. Spitzer bright, UltraVISTA faint sources in COSMOS: The contribution to the overall population of massive galaxies at z = 3–7. Astrophys. J. 2015, 810, 73. [Google Scholar] [CrossRef]
- Hložek, R.; Marsh, D.J.E.; Grin, D. Using the full power of the cosmic microwave background to probe axion dark matter. Mon. Not. R. Astron. Soc. 2018, 476, 3063–3085. [Google Scholar] [CrossRef]
- Iršič, V.; Viel, M.; Haehnelt, M.G.; Bolton, J.S.; Becker, G.D. First constraints on fuzzy dark matter from Lyman-α forest data and hydrodynamical simulations. Phys. Rev. Lett. 2017, 119, 031302. [Google Scholar] [CrossRef] [Green Version]
- Hofmann, R. The isolated electron: De Broglie’s “hidden” thermodynamics, SU(2) Quantum Yang–Mills theory, and a strongly perturbed BPS monopole. Entropy 2017, 19, 575. [Google Scholar] [CrossRef] [Green Version]
- Hofmann, R. Relic photon temperature versus redshift and the cosmic neutrino background. Ann. Phys. 2015, 527, 254. [Google Scholar] [CrossRef] [Green Version]
- Becker, R.H.; Fan, X.; White, R.L.; Strauss, M.A.; Narayanan, V.K.; Lupton, R.H.; Gunn, J.E.; Annis, J.; Bahcall, N.A.; Brinkmann, J.; et al. Evidence for Reionization at z ∼ 6: Detection of a Gunn-Peterson Trough in a z = 6.28 Quasar. Astron. J. 2001, 122, 2850–2857. [Google Scholar] [CrossRef]
- Salucci, P.; Burkert, A. Dark matter scaling relations. Astrophys. J. Lett. 2000, 537, L9–L12. [Google Scholar] [CrossRef] [Green Version]
- Burkert, A. The Structure of Dark Matter Halos in Dwarf Galaxies. Astrophys. J. 1995, 447. [Google Scholar] [CrossRef] [Green Version]
- Gillessen, S.; Eisenhauer, F.; Trippe, S.; Alexander, T.; Genzel, R.; Martins, F.; Ott, T. Monitoring stellar orbits around the Massive Black Hole in the Galactic Center. Astrophys. J. 2009, 692, 1075. [Google Scholar] [CrossRef] [Green Version]
- Ghez, A.M.; Salim, S.; Weinberg, N.N.; Lu, J.R.; Do, T.; Dunn, J.K.; Matthews, K.; Morris, M.R.; Yelda, S.; Becklin, E.E.; et al. Measuring Distance and Properties of the Milky Way’s Central Supermassive Black Hole with Stellar Orbits. Astrophys. J. 2008, 689, 1044–1062. [Google Scholar] [CrossRef] [Green Version]
- Kalberla, P.; Dedes, L.; Kerp, J.; Haud, U. Dark matter in the Milky Way, II. the HI gas distribution as a tracer of the gravitational potential. Astron. Astrophys. 2007, 469, 511. [Google Scholar] [CrossRef] [Green Version]
- Bar, N.; Blas, D.; Blum, K.; Sibiryakov, S. Galactic rotation curves versus ultralight dark matter: Implications of the soliton-host halo relation. Phys. Rev. D 2018, 98. [Google Scholar] [CrossRef] [Green Version]
- Lelli, F.; McGaugh, S.S.; Schombert, J.M. SPARC: Mass Models for 175 Disk Galaxies with Spitzer Photometry and Accurate Rotation Curves. Astron. J. 2016, 152, 157. [Google Scholar] [CrossRef] [Green Version]
- Robles, V.H.; Matos, T. Flat Central Density Profile and Constant DM Surface Density in Galaxies from Scalar Field Dark Matter. Mon. Not. R. Astron. Soc. 2012, 422, 282–289. [Google Scholar] [CrossRef]
- Engelhardt, M. Center vortex model for the infrared sector of Yang–Mills theory: Topological susceptibility. Nucl. Phys. B 2000, 585, 614. [Google Scholar] [CrossRef] [Green Version]
- Harris, W.E. A New Catalog of Globular Clusters in the Milky Way. 2010. Available online: arXiv:astro-ph.GA/1012.3224 (accessed on 15 December 2020).
- Hofmann, R. An SU(2) Gauge Principle for the Cosmic Microwave Background: Perspectives on the Dark Sector of the Cosmological Model. Universe 2020, 6, 135. [Google Scholar] [CrossRef]
- Ma, C.P.; Bertschinger, E. Cosmological Perturbation Theory in the Synchronous and Conformal Newtonian Gauges. Astrophys. J. 1995, 455, 7. [Google Scholar] [CrossRef] [Green Version]
- Hofmann, R. Low-frequency line temperatures of the CMB. Ann. Phys. 2009, 18, 634. [Google Scholar] [CrossRef] [Green Version]
Figure 1.
Best fits of SNFW to RCs of 17 SPARC galaxies. The arrows indicate the Bohr radius of the e-lump, (red), the core radius of the soliton (orange), the transition radius from the soliton model to the NFW model (yellow), and the scale radius of the NFW model (green).
Figure 1.
Best fits of SNFW to RCs of 17 SPARC galaxies. The arrows indicate the Bohr radius of the e-lump, (red), the core radius of the soliton (orange), the transition radius from the soliton model to the NFW model (yellow), and the scale radius of the NFW model (green).

Figure 2.
Frequency distribution of axion mass as extracted from the SNFW model for 17 best fitting galaxies. The maximum of the smooth-kernel-distribution (solid, blue line) is at eV (red, vertical line).
Figure 2.
Frequency distribution of axion mass as extracted from the SNFW model for 17 best fitting galaxies. The maximum of the smooth-kernel-distribution (solid, blue line) is at eV (red, vertical line).

Figure 3.
Frequency distribution of the virial mass in units of solar masses from the 17 best-fitting galaxies in the SNFW model. The maximum of the smooth-kernel-distribution (solid line) is at .
Figure 3.
Frequency distribution of the virial mass in units of solar masses from the 17 best-fitting galaxies in the SNFW model. The maximum of the smooth-kernel-distribution (solid line) is at .

Figure 4.
Extracted virial masses in units of solar masses from sample of the 17 best-fitting galaxies in the SNFW model.
Figure 4.
Extracted virial masses in units of solar masses from sample of the 17 best-fitting galaxies in the SNFW model.

Figure 5.
Burkert-model fits to the 17 best fitting SNFW-model galaxies. The purple arrow indicates the value of .
Figure 5.
Burkert-model fits to the 17 best fitting SNFW-model galaxies. The purple arrow indicates the value of .

Figure 6.
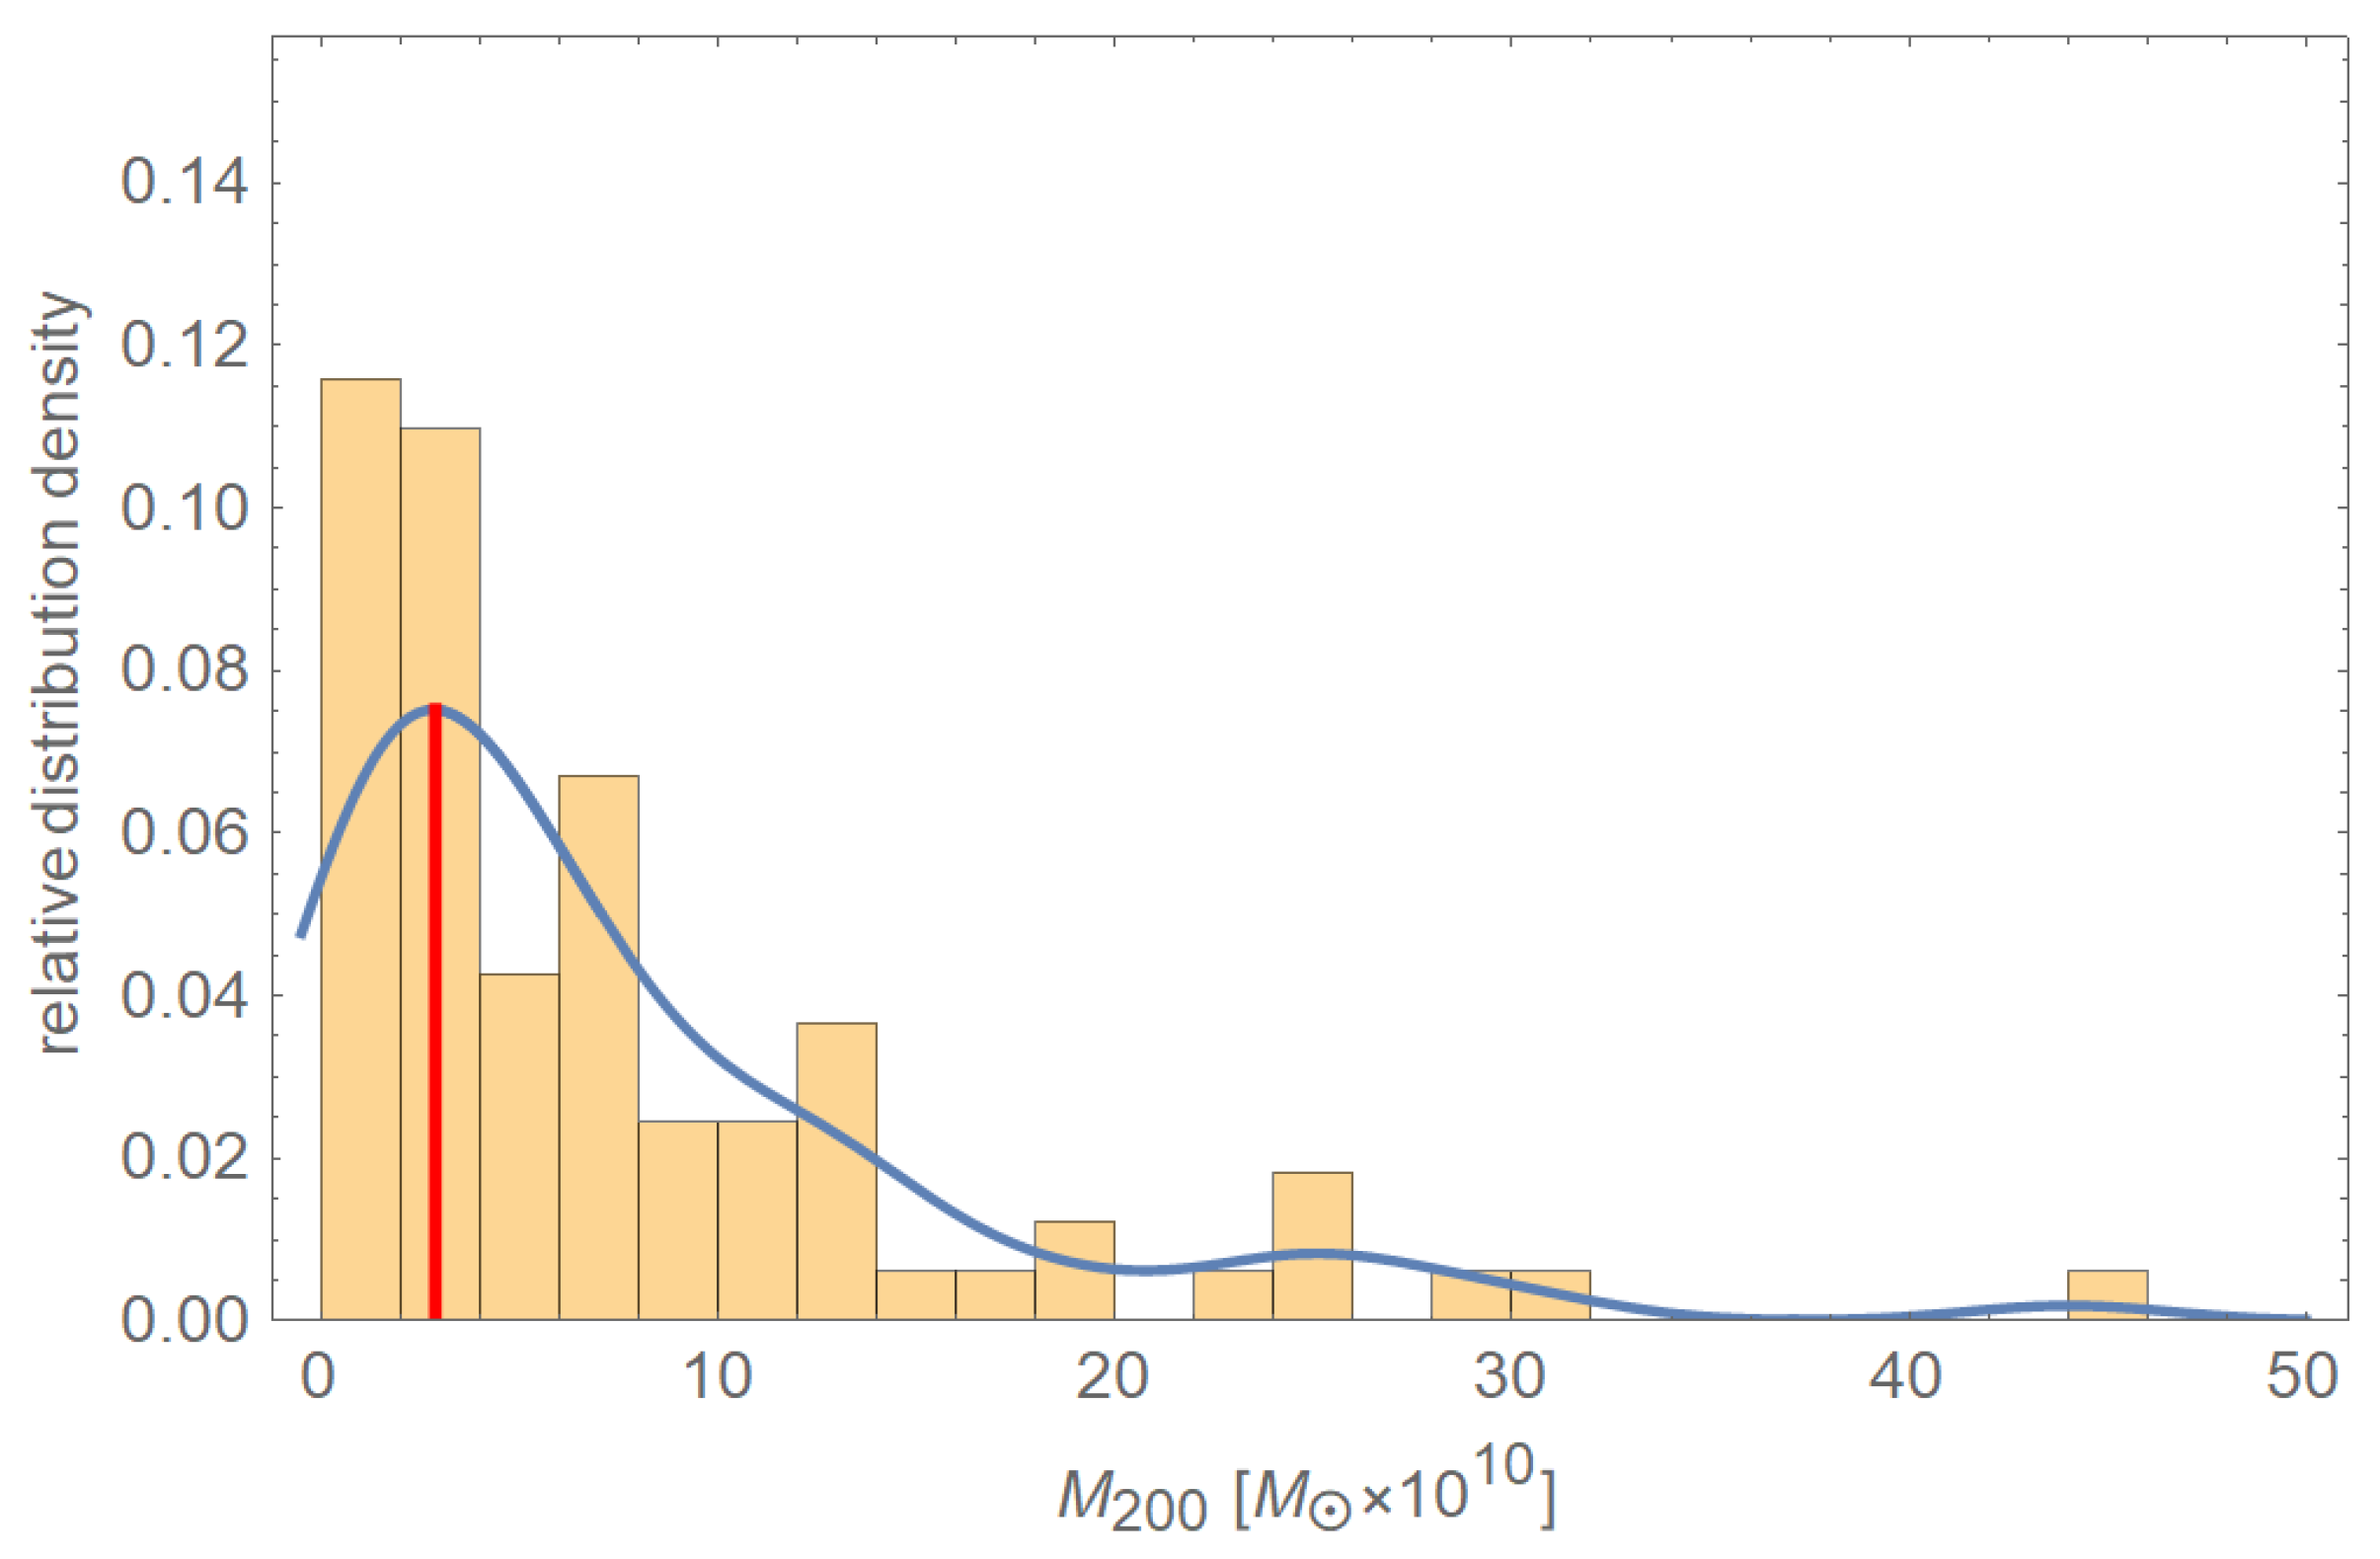
Frequency distribution of the virial mass in units of solar masses from the 80 best-fitting galaxies in the Burkert model. The maximum of the smooth-kernel-distribution (solid line) is at .
Figure 6.
Frequency distribution of the virial mass in units of solar masses from the 80 best-fitting galaxies in the Burkert model. The maximum of the smooth-kernel-distribution (solid line) is at .

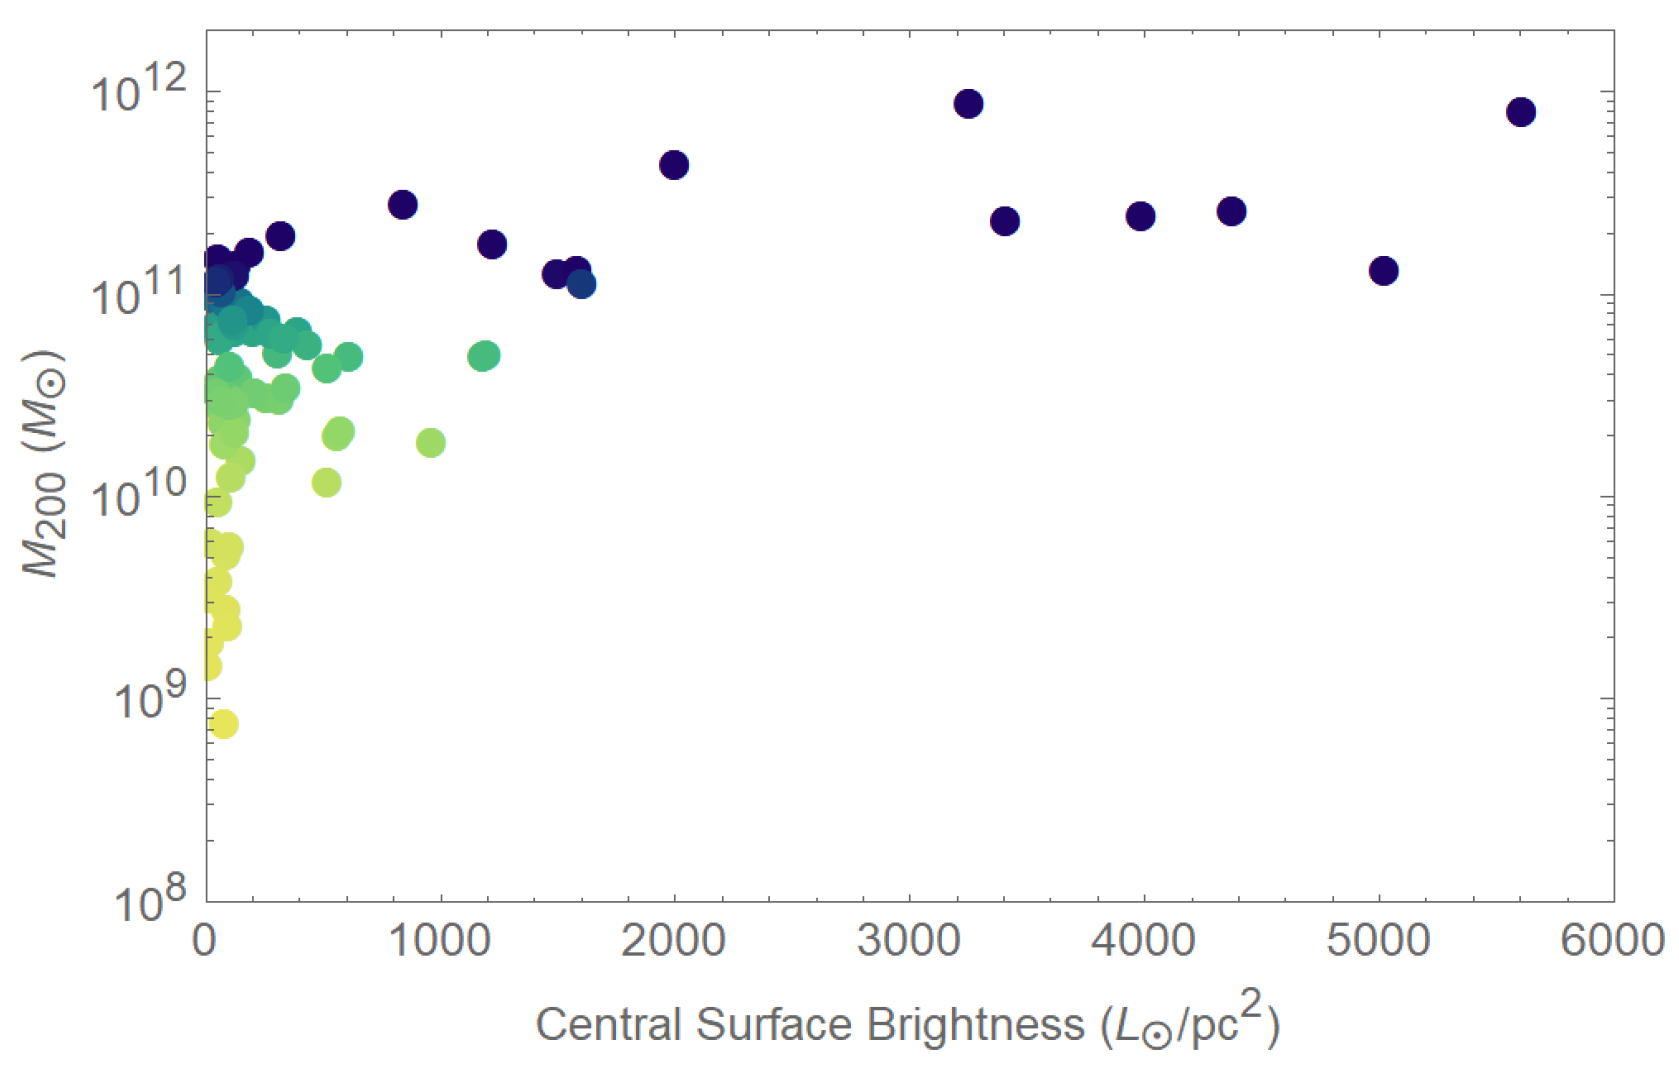
Figure 7.
Extracted virial masses in units of solar masses from Burkert-model fits to 80 RCs with vs. the respective galaxy’s central surface brightness in units of .
Figure 7.
Extracted virial masses in units of solar masses from Burkert-model fits to 80 RCs with vs. the respective galaxy’s central surface brightness in units of .

Figure 8.
Frequency distribution of 80 axion masses , extracted from the Burkert-model fits of to the RCs of galaxies with a . The maximum of the smooth-kernel distribution (solid, blue line) is eV (red, vertical line).
Figure 8.
Frequency distribution of 80 axion masses , extracted from the Burkert-model fits of to the RCs of galaxies with a . The maximum of the smooth-kernel distribution (solid, blue line) is eV (red, vertical line).

Figure 9.
Schwarzschild radius (dashed line) and gravitational Bohr radii (solid lines; dark blue: e-lump, turquoise: -lump, and black: -lump) as functions of lump mass in units of solar mass . The dots indicate lump masses which derive from the typical mass of an isolated e-lump suggested by the analysis of the RCs of low-surface-brightness galaxies performed in Section 3.

Figure 10.
Cosmological model SU(2) of [16] (with parameter values fitted to the TT, TE, and EE CMB Planck power spectra and taken from column 2 of Table 1 of that paper) in terms of relative density parameters as functions of redshift z. Normalised density parameters refer to dark energy (), to total matter (baryonic and dark, ), and to radiation (three flavours of massless neutrinos and eight relativistic polarisations in a CMB subject to SU(2), ). The dotted red line represents the Hubble radius of this model. The redshifts of e-lump, -lump, and -lump depercolations are indicated by vertical lines intersecting the z-axis. Only e-lump depercolation is taken into account explicitly within the cosmological model SU(2) since at 40,000 and 685,000 the Universe is radiation dominated.

Figure 11.
The evolution of the Universe’s dark sector according to SU(2) Yang–Mills theories of scales , , (confining phases, screened), and eV (deconfining phase, unscreened) invoking Planck-scale induced axial anomalies. The horizon size, set by the Hubble radius at various epochs (a–e), is shown by a red circumference. At epoch (a) gravity induced chiral symmetry breaking at the Planck scale creates a would-be-Goldstone boson which, due to the axial anomaly, gives rise to four ultralight axionic particle species. Their gravitational Bohr radii , , , and are much larger than . Therefore, the associated energy densities should be interpreted as dark energy. (b) As the radiation dominated Universe expands the smallest Bohr radius falls below . Once the ratio is sufficiently large ( 55,500) -lumps depercolate ( 685,000). (c) As the Universe expands further the Bohr radius falls below . When the ratio of and again equals about 55,500 -lumps derpercolate ( 40,000). The cosmological matter densities of and -lumps are comparable [16]. Since the mass of an isolated, unmerged -lump is by a factor of about smaller than the mass of an isolated, unmerged -lump it then follows that the number density of -lumps is by this factor larger compared to the number density of -lumps. (d) Upon continued expansion down to redshift e-lumps depercolate. Their number density is by a factor of 42,750 smaller than the number density of -lumps. (e) The value of is vastly larger than : Mpc vs. Mpc. Therefore, a depercolation of CMB-lumps up to the present is excluded. As a consequence, the condensate of CMB-axions is dark energy. (f) Possible dark-matter configuration of a galaxy including -lumps and a single -lump inside an e-lump.


Table 1.
Fits of RCs to SNFW model: Galaxy name, Hubble Type, , luminosity, axion mass , , virial mass , central density , scale radius , transition radius , core radius , and . The fitting constraints are heuristic and motivated by the results of [49], kpc, 6 kpc, and > 0.1.
Table 1.
Fits of RCs to SNFW model: Galaxy name, Hubble Type, , luminosity, axion mass , , virial mass , central density , scale radius , transition radius , core radius , and . The fitting constraints are heuristic and motivated by the results of [49], kpc, 6 kpc, and > 0.1.
| Galaxy | Hub. Type | Lum.
| 2 /d.o.f. | [kpc] | ||
|---|---|---|---|---|---|---|
| DDO170 | Im | 73.93 | 0.73 | 1.00 ± 0.82 | 36.90 ± 8.16 | 2.81 ± 1.95 |
| F565-V2 | Im | 40.26 | 0.02 | 0.31 ± 0.47 | 60.71 ± 11.52 | 11.65 ± 5.05 |
| F568-1 | Sc | 57.13 | 0.02 | 0.41 ± 0.24 | 70.06 ± 7.82 | 22.59 ± 6.67 |
| F571-V1 | Sd | 64.39 | 0.03 | 0.50 ± 0.30 | 49.71 ± 6.70 | 7.12 ± 2.83 |
| F574-1 | Sd | 128.48 | 0.02 | 0.93 ± 0.15 | 53.96 ± 3.09 | 9.79 ± 1.44 |
| F583-4 | Sc | 83.34 | 0.13 | 3.87 ± 1.37 | 75.08 ± 32.44 | 17.88 ± 13.83 |
| NGC3109 | Sm | 140.87 | 0.18 | 1.14 ± 0.39 | 77.09 ± 18.07 | 19.85 ± 5.45 |
| NGC3877 | Sc | 3410.59 | 0.17 | 0.39 ± 0.04 | 69.37 ± 12.49 | 26.91 ± 6.58 |
| NGC4085 | Sc | 5021.46 | 0.07 | 0.41 ± 0.18 | 46.07 ± 7.09 | 9.26 ± 2.78 |
| NGC6195 | Sb | 174.11 | 0.47 | 0.48 ± 0.03 | 121.72 ± 9.61 | 122.40 ± 24.56 |
| UGC00731 | Im | 82.57 | 0.19 | 3.39 ± 0.87 | 53.27 ± 8.51 | 7.62 ± 2.90 |
| UGC00891 | Sm | 113.98 | 0.01 | 0.93 ± 0.10 | 44.92 ± 1.42 | 4.78 ± 0.36 |
| UGC06628 | Sm | 103.00 | 0.00 | 3.61 ± 0.10 | 23.35 ± 0.87 | 0.77 ± 0.05 |
| UGC07125 | Sm | 103.00 | 0.25 | 1.81 ± 0.65 | 47.55 ± 10.38 | 4.97 ± 2.68 |
| UGC07151 | Scd | 965.67 | 0.72 | 1.94 ± 2.32 | 32.32 ± 5.65 | 2.53 ± 1.58 |
| UGC11820 | Sm | 34.11 | 0.82 | 5.99 ± 4.75 | 75.83 ± 49.15 | 18.10 ± 34.72 |
| UGC12632 | Sm | 66.81 | 0.09 | 1.47 ± 0.23 | 46.91 ± 6.10 | 5.56 ± 1.48 |
Table 2.
Fits of RCs to SNFW model: Galaxy name, central density , soliton density , scale radius , transition radius , core radius , and . The fitting constraints are heuristic and motivated by the results of [49], kpc, 6 kpc, and > 0.1.
Table 2.
Fits of RCs to SNFW model: Galaxy name, central density , soliton density , scale radius , transition radius , core radius , and . The fitting constraints are heuristic and motivated by the results of [49], kpc, 6 kpc, and > 0.1.
| Galaxy | [kpc] | [kpc] | [kpc] | |||
|---|---|---|---|---|---|---|
| DDO170 | 1.34 ± 0.38 | 0.95 ± 0.78 | 6.02 ± 1.51 | 3.48 ± 2.99 | 3.45 ± 1.39 | 1.01 |
| F565-V2 | 1.6 ± 0.21 | 0.51 ± 0.33 | 12.46 ± 4.33 | 3.14 ± 0.8 | 5.89 ± 4.38 | 0.53 |
| F568-1 | 6.61 ± 0.56 | 2.67 ± 1.04 | 7.87 ± 1.36 | 2.59 ± 0.6 | 3.62 ± 1.06 | 0.72 |
| F571-V1 | 1.61 ± 0.24 | 1.22 ± 0.68 | 7.42 ± 1.71 | 3.96 ± 1.21 | 4.65 ± 1.4 | 0.85 |
| F574-1 | 5.41 ± 0.26 | 1.81 ± 0.32 | 6.98 ± 0.46 | 2.52 ± 1.04 | 2.52 ± 0.21 | 1.00 |
| F583-4 | 8.05 ± 1.34 | 0.12 ± 0.13 | 27.1 ± 19.49 | 1.73 ± 0.41 | 1.12 ± 0.19 | 1.55 |
| NGC3109 | 2.28 ± 0.09 | 0.14 ± 0.08 | 25.88 ± 11.92 | 2.03 ± 0.56 | 2.83 ± 0.48 | 0.71 |
| NGC3877 | 15. ± 0.91 | 13.56 ± 15.7 | 4.4 ± 2.43 | 4.87 ± 0.91 | 3.03 ± 0.15 | 1.61 |
| NGC4085 | 13.49 ± 1.04 | 103.33 ± 134.83 | 1.46 ± 0.82 | 2.46 ± 0.41 | 3.02 ± 0.65 | 0.81 |
| NGC6195 | 128.1 ± 7.47 | 2.67 ± 0.6 | 13.68 ± 0.96 | 3.55 ± 0.12 | 1.59 ± 0.05 | 2.23 |
| UGC00731 | 7.41 ± 0.87 | 0.39 ± 0.16 | 12.17 ± 1.85 | 1.62 ± 0.34 | 1.22 ± 0.15 | 1.32 |
| UGC00891 | 1.63 ± 0.05 | 0.57 ± 0.06 | 8.85 ± 0.39 | 2.97 ± 0.19 | 3.42 ± 0.19 | 0.87 |
| UGC06628 | 4.34 ± 0.08 | 1.3 ± 0.21 | 3.4 ± 0.28 | 2.27 ± 0.07 | 1.35 ± 0.02 | 1.68 |
| UGC07125 | 2.2 ± 0.39 | 0.22 ± 0.12 | 13.55 ± 2.2 | 3.06 ± 0.94 | 2.27 ± 0.39 | 1.35 |
| UGC07151 | 13.48 ± 2.86 | 7.49 ± 5.62 | 2.52 ± 0.66 | 1.05 ± 0.46 | 1.39 ± 0.83 | 0.75 |
| UGC11820 | 15.04 ± 4.43 | 0.11 ± 0.2 | 28.64 ± 6.01 | 1.35 ± 0.66 | 0.77 ± 0.3 | 1.76 |
| UGC12632 | 3.77 ± 0.3 | 0.61 ± 0.24 | 9.01 ± 1.82 | 3.12 ± 0.49 | 2.2 ± 0.16 | 1.42 |
Table 3.
Burkert model: Galaxy name, Hubble Type, , luminosity, axion mass , , virial mass , core density , and core radius . In the red frame the 17 galaxies used for the SNFW fit are highlighted.
Table 3.
Burkert model: Galaxy name, Hubble Type, , luminosity, axion mass , , virial mass , core density , and core radius . In the red frame the 17 galaxies used for the SNFW fit are highlighted.

Table 4.
Burkert model with : Galaxy name, Hubble Type, , luminosity, axion mass , , virial mass , core density , and core radius (ordered as in the SPARC library).
Table 4.
Burkert model with : Galaxy name, Hubble Type, , luminosity, axion mass , , virial mass , core density , and core radius (ordered as in the SPARC library).
| Galaxy | Hub. Type | Lum. | 2/d.o.f. | [kpc] | [kpc] | |||
|---|---|---|---|---|---|---|---|---|
| UGC01281 | Sdm | 135.78 | 0.17 | 1.16 ± 0.24 | 32.78 ± 1.89 | 2.45 ± 0.35 | 3.56 ± 0.2 | 3.23 ± 0.17 |
| UGC02023 | Im | 121.57 | 0.03 | 0.36 ± 0.16 | 73.23 ± 24.56 | 24.82 ± 19.87 | 1.92 ± 0.21 | 8.95 ± 2.97 |
| UGC04305 | Im | 88.07 | 0.76 | 3.42 ± 0.9 | 15.39 ± 2.06 | 0.28 ± 0.1 | 7.2 ± 1.55 | 1.19 ± 0.14 |
| UGC04325 | Sm | 213.22 | 0.26 | 1. ± 0.2 | 32.71 ± 1.31 | 3.29 ± 0.34 | 31.75 ± 1.83 | 1.53 ± 0.05 |
| UGC04483 | Im | 82.57 | 0.26 | 6.58 ± 1.48 | 9.51 ± 0.84 | 0.08 ± 0.02 | 19.32 ± 2.23 | 0.52 ± 0.04 |
| UGC04499 | Sdm | 127.30 | 0.09 | 1.05 ± 0.21 | 34. ± 1.01 | 2.96 ± 0.21 | 5.97 ± 0.24 | 2.8 ± 0.07 |
| UGC05005 | Im | 65.59 | 0.06 | 0.52 ± 0.1 | 59.27 ± 2.86 | 12.09 ± 1.21 | 1.1 ± 0.06 | 8.85 ± 0.32 |
| UGC05414 | Im | 127.30 | 0.11 | 1.25 ± 0.25 | 30.31 ± 1.42 | 2.09 ± 0.24 | 5.9 ± 0.3 | 2.51 ± 0.11 |
| UGC05750 | Sdm | 124.98 | 0.08 | 0.68 ± 0.14 | 49.77 ± 3.23 | 7.13 ± 0.97 | 1.07 ± 0.06 | 7.5 ± 0.4 |
| UGC05829 | Im | 63.22 | 0.33 | 0.93 ± 0.23 | 38.9 ± 4.8 | 3.81 ± 1.16 | 2.21 ± 0.28 | 4.52 ± 0.52 |
| UGC05918 | Im | 24.94 | 0.06 | 2.35 ± 0.48 | 19.9 ± 1.15 | 0.59 ± 0.09 | 6.01 ± 0.47 | 1.64 ± 0.08 |
| UGC05999 | Im | 51.62 | 0.35 | 0.53 ± 0.12 | 57.19 ± 5.87 | 11.71 ± 2.81 | 1.72 ± 0.22 | 7.29 ± 0.63 |
| UGC06399 | Sm | 311.05 | 0.03 | 0.8 ± 0.16 | 40.82 ± 1.2 | 5.16 ± 0.36 | 6.2 ± 0.22 | 3.32 ± 0.08 |
| UGC06446 | Sd | 86.46 | 0.78 | 1.05 ± 0.23 | 32.95 ± 2.75 | 3.01 ± 0.66 | 13.01 ± 1.64 | 2.08 ± 0.15 |
| UGC06667 | Scd | 614.94 | 0.11 | 0.81 ± 0.16 | 40.55 ± 1.3 | 5.03 ± 0.39 | 5.97 ± 0.23 | 3.34 ± 0.09 |
| UGC06917 | Sm | 261.11 | 0.35 | 0.66 ± 0.13 | 45.28 ± 2.24 | 7.48 ± 0.92 | 9.48 ± 0.64 | 3.19 ± 0.13 |
| UGC06923 | Im | 347.40 | 0.4 | 0.97 ± 0.26 | 34.69 ± 4.92 | 3.46 ± 1.28 | 11.64 ± 2.17 | 2.28 ± 0.29 |
| UGC06930 | Sd | 189.16 | 0.21 | 0.62 ± 0.13 | 47.7 ± 3.06 | 8.45 ± 1.38 | 7.41 ± 0.72 | 3.65 ± 0.19 |
| UGC06983 | Scd | 121.57 | 0.68 | 0.66 ± 0.14 | 45.05 ± 3.3 | 7.54 ± 1.42 | 11.27 ± 1.24 | 2.99 ± 0.18 |
| UGC07089 | Sdm | 520.99 | 0.22 | 0.86 ± 0.18 | 40.29 ± 2.82 | 4.41 ± 0.75 | 2.82 ± 0.23 | 4.31 ± 0.27 |
| UGC07261 | Sdm | 566.02 | 0.33 | 1.28 ± 0.31 | 28.32 ± 3.03 | 2. ± 0.57 | 18.97 ± 3.11 | 1.57 ± 0.14 |
| UGC07323 | Sdm | 283.68 | 0.8 | 0.71 ± 0.17 | 44.67 ± 5.34 | 6.55 ± 1.98 | 5.06 ± 0.62 | 3.9 ± 0.43 |
| UGC07524 | Sm | 106.86 | 0.57 | 0.86 ± 0.17 | 39.92 ± 1.58 | 4.45 ± 0.44 | 3.66 ± 0.19 | 3.89 ± 0.13 |
| UGC07559 | Im | 55.06 | 0.03 | 2.93 ± 0.6 | 17.5 ± 0.93 | 0.38 ± 0.05 | 4.15 ± 0.23 | 1.63 ± 0.08 |
| UGC07577 | Im | 54.55 | 0.04 | 3.14 ± 1.07 | 18.08 ± 4.38 | 0.33 ± 0.19 | 1.02 ± 0.12 | 2.76 ± 0.66 |
| UGC07603 | Sd | 520.99 | 0.22 | 1.66 ± 0.33 | 23.7 ± 1. | 1.19 ± 0.13 | 21.7 ± 1.3 | 1.26 ± 0.05 |
| UGC07608 | Im | 46.65 | 0.07 | 1. ± 0.22 | 35.39 ± 2.78 | 3.27 ± 0.65 | 5.23 ± 0.44 | 3.05 ± 0.22 |
| UGC07866 | Im | 97.46 | 0.1 | 3.78 ± 0.92 | 14.34 ± 1.63 | 0.23 ± 0.07 | 7.72 ± 1.11 | 1.08 ± 0.11 |
| UGC08490 | Sm | 576.54 | 0.95 | 1.24 ± 0.25 | 28.16 ± 1.51 | 2.14 ± 0.31 | 38.07 ± 3.44 | 1.23 ± 0.05 |
| UGC08837 | Im | 77.42 | 0.29 | 0.54 ± 0.18 | 57.39 ± 13.51 | 11.12 ± 6.14 | 1.26 ± 0.11 | 8.13 ± 1.89 |
| UGC09037 | Scd | 841.07 | 0.61 | 0.34 ± 0.07 | 72.32 ± 3.54 | 28.35 ± 2.75 | 5.11 ± 0.28 | 6.33 ± 0.21 |
| UGC09992 | Im | 73.25 | 0.24 | 3.68 ± 1.34 | 14.37 ± 3.31 | 0.24 ± 0.15 | 10.76 ± 3.86 | 0.97 ± 0.19 |
| UGC11557 | Sdm | 337.93 | 0.28 | 0.73 ± 0.17 | 44.75 ± 4.74 | 6.16 ± 1.6 | 3.16 ± 0.4 | 4.6 ± 0.43 |
| UGC12506 | Scd | 5608.28 | 0.69 | 0.2 ± 0.04 | 96.54 ± 6.95 | 80.52 ± 12.65 | 17.8 ± 1.77 | 5.53 ± 0.26 |
| UGCA281 | BCD | 12.05 | 0.34 | 4.71 ± 1.08 | 11.71 ± 1.1 | 0.15 ± 0.04 | 27.12 ± 2.79 | 0.58 ± 0.05 |
Publisher’s Note: MDPI stays neutral with regard to jurisdictional claims in published maps and institutional affiliations. |
© 2021 by the authors. Licensee MDPI, Basel, Switzerland. This article is an open access article distributed under the terms and conditions of the Creative Commons Attribution (CC BY) license (https://creativecommons.org/licenses/by/4.0/).
Share and Cite
MDPI and ACS Style
Meinert, J.; Hofmann, R. Axial Anomaly in Galaxies and the Dark Universe. Universe 2021, 7, 198. https://0-doi-org.brum.beds.ac.uk/10.3390/universe7060198
AMA Style
Meinert J, Hofmann R. Axial Anomaly in Galaxies and the Dark Universe. Universe. 2021; 7(6):198. https://0-doi-org.brum.beds.ac.uk/10.3390/universe7060198
Chicago/Turabian StyleMeinert, Janning, and Ralf Hofmann. 2021. "Axial Anomaly in Galaxies and the Dark Universe" Universe 7, no. 6: 198. https://0-doi-org.brum.beds.ac.uk/10.3390/universe7060198
Note that from the first issue of 2016, this journal uses article numbers instead of page numbers. See further details here.