
The Apparent Behavior of Electron Density during an Alternating O/X-Mode Heating Experiment


1
College of Meteorology and Oceanography, National University of Defense Technology, Changsha 410073, China
2
State Key Laboratory of Space Weather, Chinese Academy of Sciences, Beijing 100190, China
*
Author to whom correspondence should be addressed.
Universe 2021, 7(8), 274; https://0-doi-org.brum.beds.ac.uk/10.3390/universe7080274
Submission received: 14 June 2021
/
Revised: 14 July 2021
/
Accepted: 28 July 2021
/
Published: 28 July 2021
(This article belongs to the Section Space Science)
Abstract
:We present the observations of the artificial ionospheric modification experiment of EISCAT on 18 October 2012 in Tromsø, Norway. When the pump of alternating O mode and X mode is switched on, the UHF radar observation shows some strong enhancements in electron density, ion lines and plasma lines. Based on some existing theories, we find the following: First, during the experiment, the frequency of plasma line (), ion line () and pump () matches = − 3 and = − 5 occasionally demonstrated that the cascade process occurred. Second, through quantitative calculation, we found that the O-mode component mixed in X-mode wave satisfies the thresholds of the parametric decay instability and the oscillation two-stream instability, from which we infer that the HF-induced plasma lines (HFPLs) and HF-enhanced ion lines (HFILs) observed in X-mode pulse could have been caused by the O-mode component mixed in X-mode wave. Third, the UHF radar observation shows some apparent enhancements over a wide altitude range (from approximately the reflection altitude to ~670 km) in electron density during X-mode pulse, which also does not, in fact, correspond to a true increase in electron density, but due to the enhancement in ion line or the enhancement in radar backscatter induced by some unknown mechanism.
1. Introduction
When high-power (HF) radio waves are incident on the ionosphere, a series of complex wave–particle and wave–wave interactions will occur. The theory for wave–wave and wave–particle interactions was basically developed in the 1960s. This was a prerequisite for further understanding of nonlinear phenomena in space plasmas [1]. A series of physical phenomena occur when powerful radio waves (usually termed as a pump) are injected into the ionosphere, such as Artificial Airglow [2], Anomalous Absorption [3], Stimulated Electromagnetic Emission [4] and small-scale field-aligned irregularity [5]. These phenomena, which are all caused by the O-mode pump, are closely related to parametric instability. According to the different excitation heights, parametric instability mainly includes Langmuir parametric instability and upper hybrid parametric instability. Additionally, Langmuir parametric instability can be divided into parametric decay instability (PDI) and oscillating two-stream instability (OTSI). During the ionospheric heating experiment, the most direct evidence of the excitation of Langmuir parametric instability is the HF-induced plasma lines (HFPLs), and HF-enhanced ion lines (HFILs) observed in incoherent scattering radar. When the wave vectors of plasma wave and ion-acoustic wave satisfy the Bragg condition of the incoherent scattering radar, then they can be observed. The frequency of the plasma line, ion line and pump does not simply satisfy the frequency matching relationship of PDI. In historical observations, HFILs and HFPLs caused by ionospheric modification have abundant spectral structures, e.g., (1) Westman et al. [6] observed up to five cascade lines in addition to the decay line in the Tromsø HF-induced plasma line (HFPL) and well-developed cascade type plasma lines for the first time; (2) Wu Jun et al. [7] and Borisova et al. [8] observed the plasma lines (HFPLs) excited at a frequency higher (150–250 kHz) than the pump during artificial ionospheric modification near the fifth electron gyrofrequency in EISCAT; (3) Robert et al. [9] observed the frequency of HFPLs were lower than pump frequency, about 3 in the Arecibo artificial ionospheric modification experiment.
Stocker et al. [10] found that electron density depletion and increases were both about 10% in EISCAT artificial ionospheric modification experiment; these changes in electron density are thermally driven. Pedersen et al. [11,12] observed large increases in electron density in ionograms when using the High-Frequency Active Auroral Research Program (HAARP) facility. These increases were associated with strong thermospheric optical emissions and were attributed to ionization by electrons accelerated by plasma turbulence. In all these experiments, the pump wave was polarized in the O-mode. Blagoveshchenskaya et al. [13,14] presented EISCAT UHF radar observations of large (up to 30%) electron density enhancements during X-mode pumping. The enhancements were detectable over a wide altitude region of ~125 km. Senior et al. [15] showed that the apparent large electron density enhancements over a wide altitude range (only observed in X-mode pumping) do not, in fact, correspond to the true increase in electron density and may be due to some unknown mechanism enhanced the ion line spectrum. The same feature in electron density enhancements was reported by Wu Jun et al. [7] and Borisova et al. [8] during an artificial ionospheric modification experiment near the fifth electron gyrofrequency in EISCAT by O-mode pumping.
In this article, we present some further research deduced from EISCAT UHF observations during artificial ionospheric modification experiments using the EISCAT heater operated both in O-mode and X-mode on 18 October 2012. First, we quantitatively explain the HFILs and HFPLs whose frequency does not satisfy the PDI. Second, the inversion of ion spectra provides direct evidence that electron density enhancements near the reflection altitude are caused by PDI and do not correspond to the true increase in electron density. Third, we verify by quantitative calculation that several existing theories cannot explain the phenomenon of the enhancement in electron density over a wide altitude range and should be researched further.
2. Experimental Setup
Experiments on the modification of the high-latitude ionosphere were carried out on 18 October 2012, using the EISCAT/Heating facility located in Tromsø, Norway (69.6° N, 19.2° E). The facility can radiate a high-frequency (HF) radio wave in the frequency range 4–8 MHz with an effective radiated power (ERP) of up to ~1 GW. The beam may be steered up to about 30° away from the zenith in the north–south plane. Arbitrary elliptical polarization is possible, including the circular ionospheric O- and X-modes. From 13:10 to 14:50 UT on 18 October 2012, the HF facility was operated on 7.953 MHz with the beam directed field-aligned (actually 12° south of the zenith). The pump wave was pulsed 5 min on, 5 min off, making an overall cycle of 10 min, and the pump wave polarization changed between O- and X-mode on successive pulses. Thus, the first and third pulse is O-mode pumping, and the second and fourth pulse is X-mode pumping. During each pump pulse, the UHF radar beam was pointed field-aligned for the first 2 min, then sequentially 1° higher and lower in elevation than field-aligned for 1 min each and finally returning to field-aligned for 1 min before the end of the pulse. The beam then remained field-aligned while the pump was off. During the whole experiment, the background ionosphere was quiet. The critical frequency for O-mode was about 8.75 MHz which was measured by the ionosonde in Tromsø. The reflection altitude of the O-mode wave is higher than that of the X-mode; hence the critical frequency for X-mode is higher than 8.75 MHz. Therefore, the whole artificial ionospheric modification experiment is over-dense heating.
The behavior of electron density, ion lines and plasma lines was mainly studied based on the incoherent scatter radar operating at 930 MHz [16]. During the experiments, the radar measurements were performed in a distance range of 90 to 600 km with a minimum distance resolution of 1.5 km and a minimum time resolution of 5 s. The radar beam and the direction of radiation of a high-power HF radio wave were aligned with the Earth’s magnetic field line. Then the radar measurement results are presented as functions of the altitude above the Earth’s surface converted from distances along the Earth’s magnetic field: [17]. The ionospheric plasma parameters were measured, such as the electron density Ne and the electron temperature Te, as well as spectral powers SPL of the HF-induced plasma lines (HFPLs) in the high-frequency channel of radar measurement and the spectral powers SIL of HF-enhanced ion lines (HFILs) in the low-frequency channel. The primary data of these measurements were processed using a constant altitude step of 3 km and an integration time of 30 s by version 9.0 of GUISDAP (Grand United Incoherent Scatter Design and Analysis Package) software [18] and RTG (Real Time Graphs) software. The reliability of the data used in the analysis was confirmed by the value of the Residual <2 parameter [18].
3. Observations
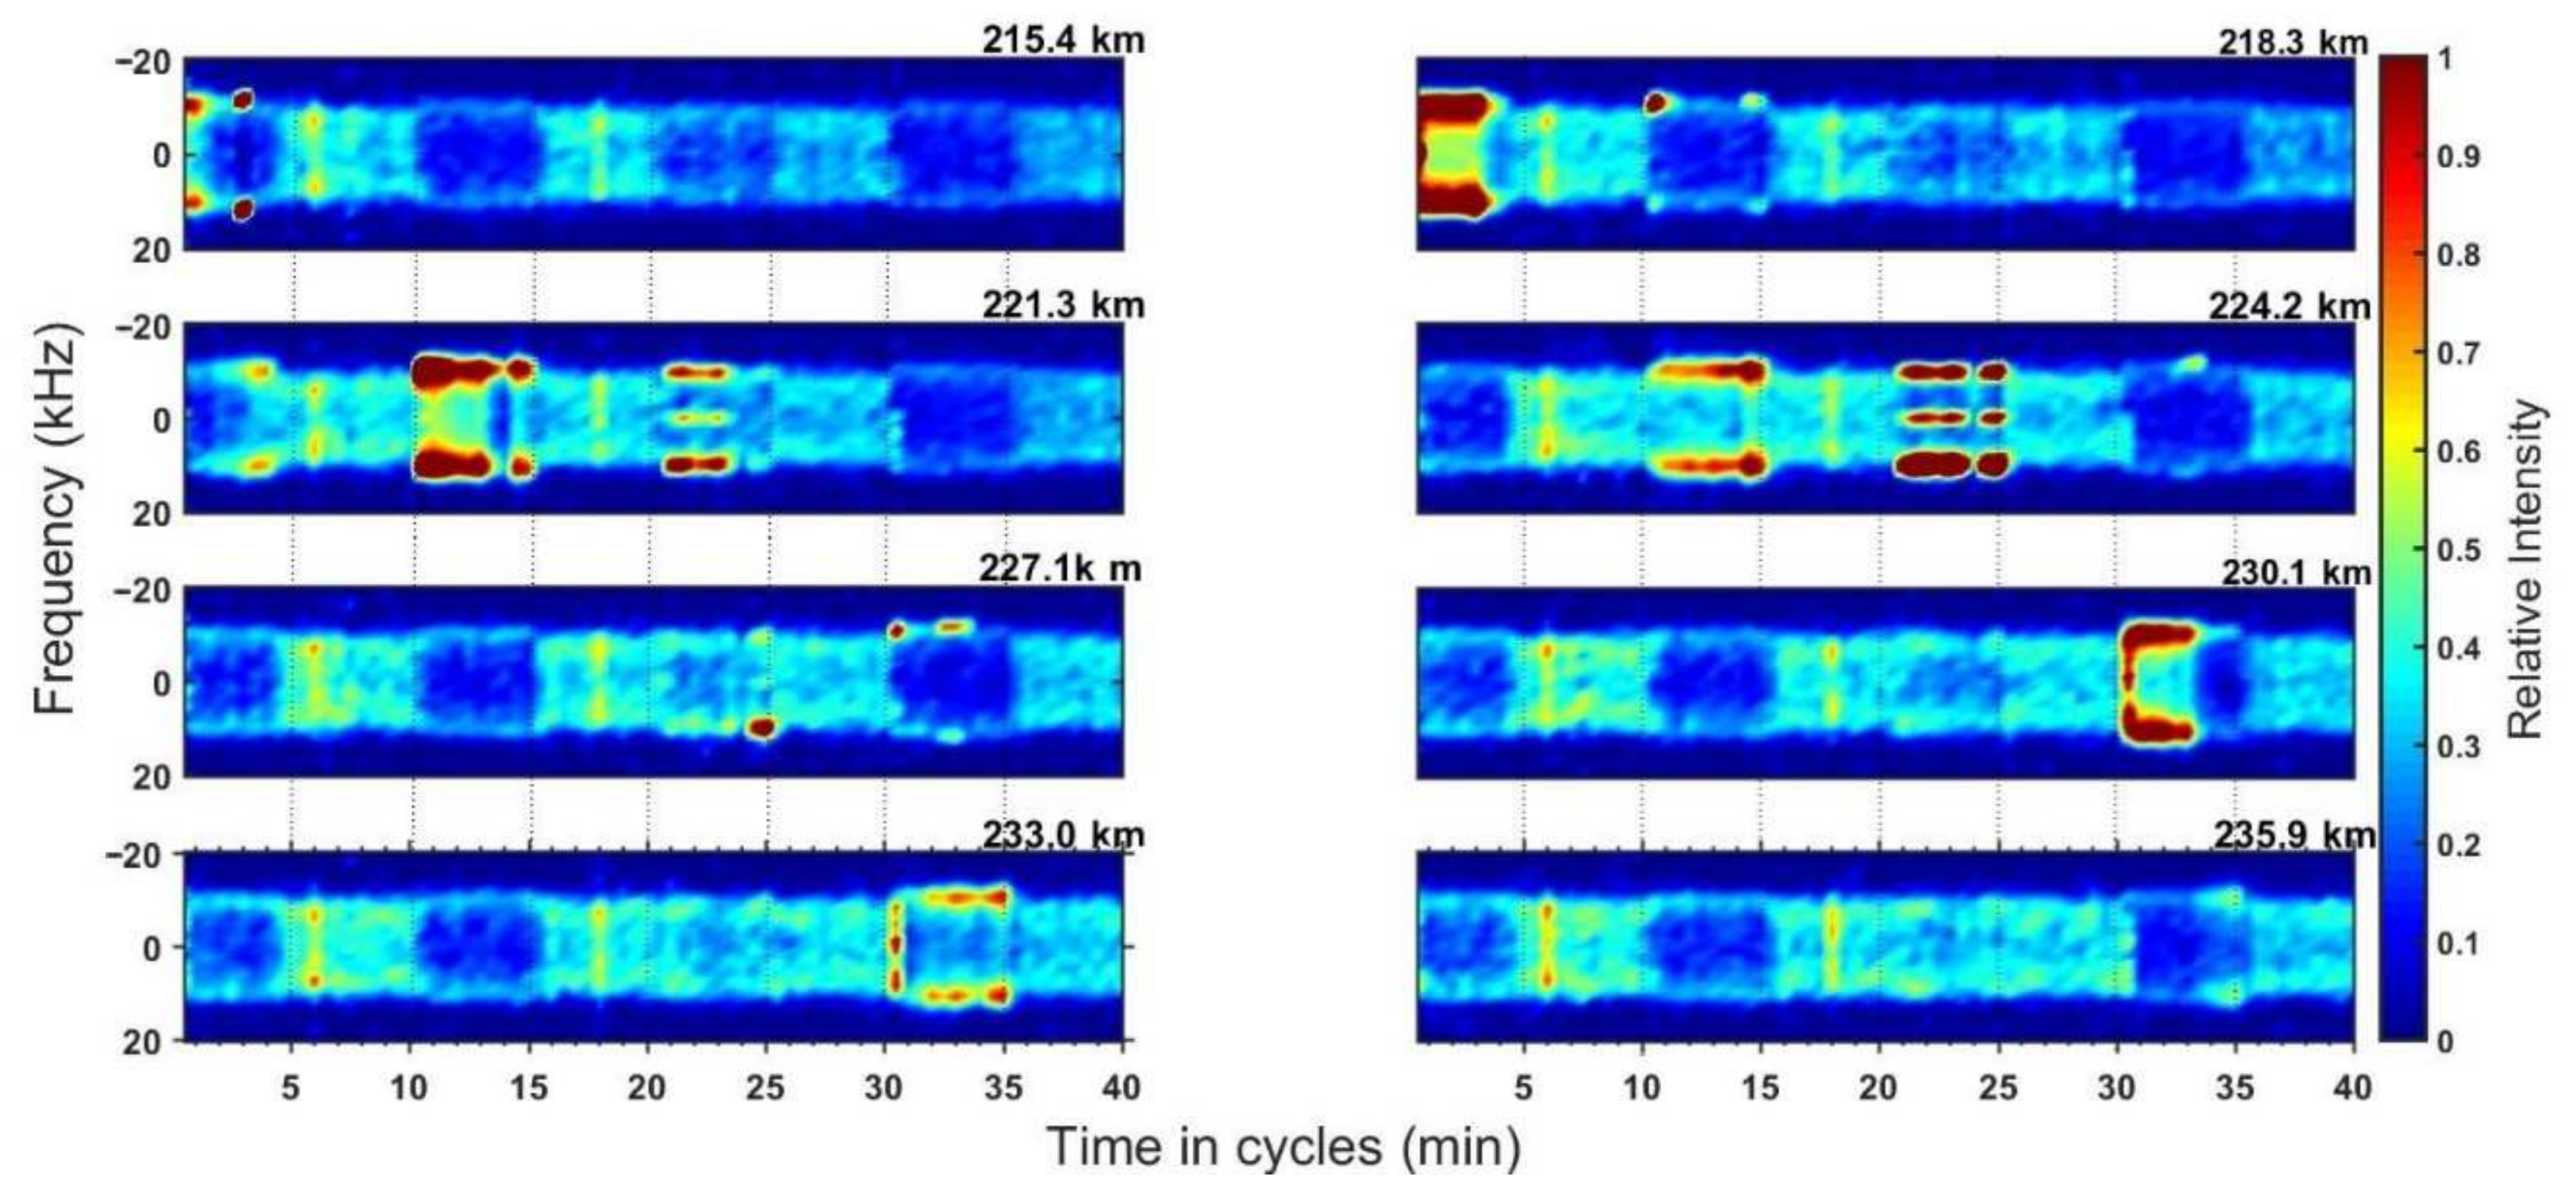
As some examples, the ion lines within the interval of −20 kHz to 20 kHz at altitudes of 215.4 km, 218.3 km, 221.3 km, 224.2 km, 227.1 km, 230.1 km, 233.0 km and 235.9 km are given in Figure 1, respectively (the altitudes are given by the data processed by GUISDAP software, and the altitude resolution is ~2.9 km). The most prominent features in Figure 1 are the significant ‘spikes’ in the center of the ion line spectrum occurring at altitudes of 221.3 km and 224.2 km, which are the manifestation of the OTSI or the purely growing instability, and the significant ‘shoulders’ at ~10.7 kHz occurring at altitudes of 215.4 km, 218.3 km, 221.3 km, 224.2 km, 230.1 km and 230.0 km, which are the confirmation of PDI [19,20].
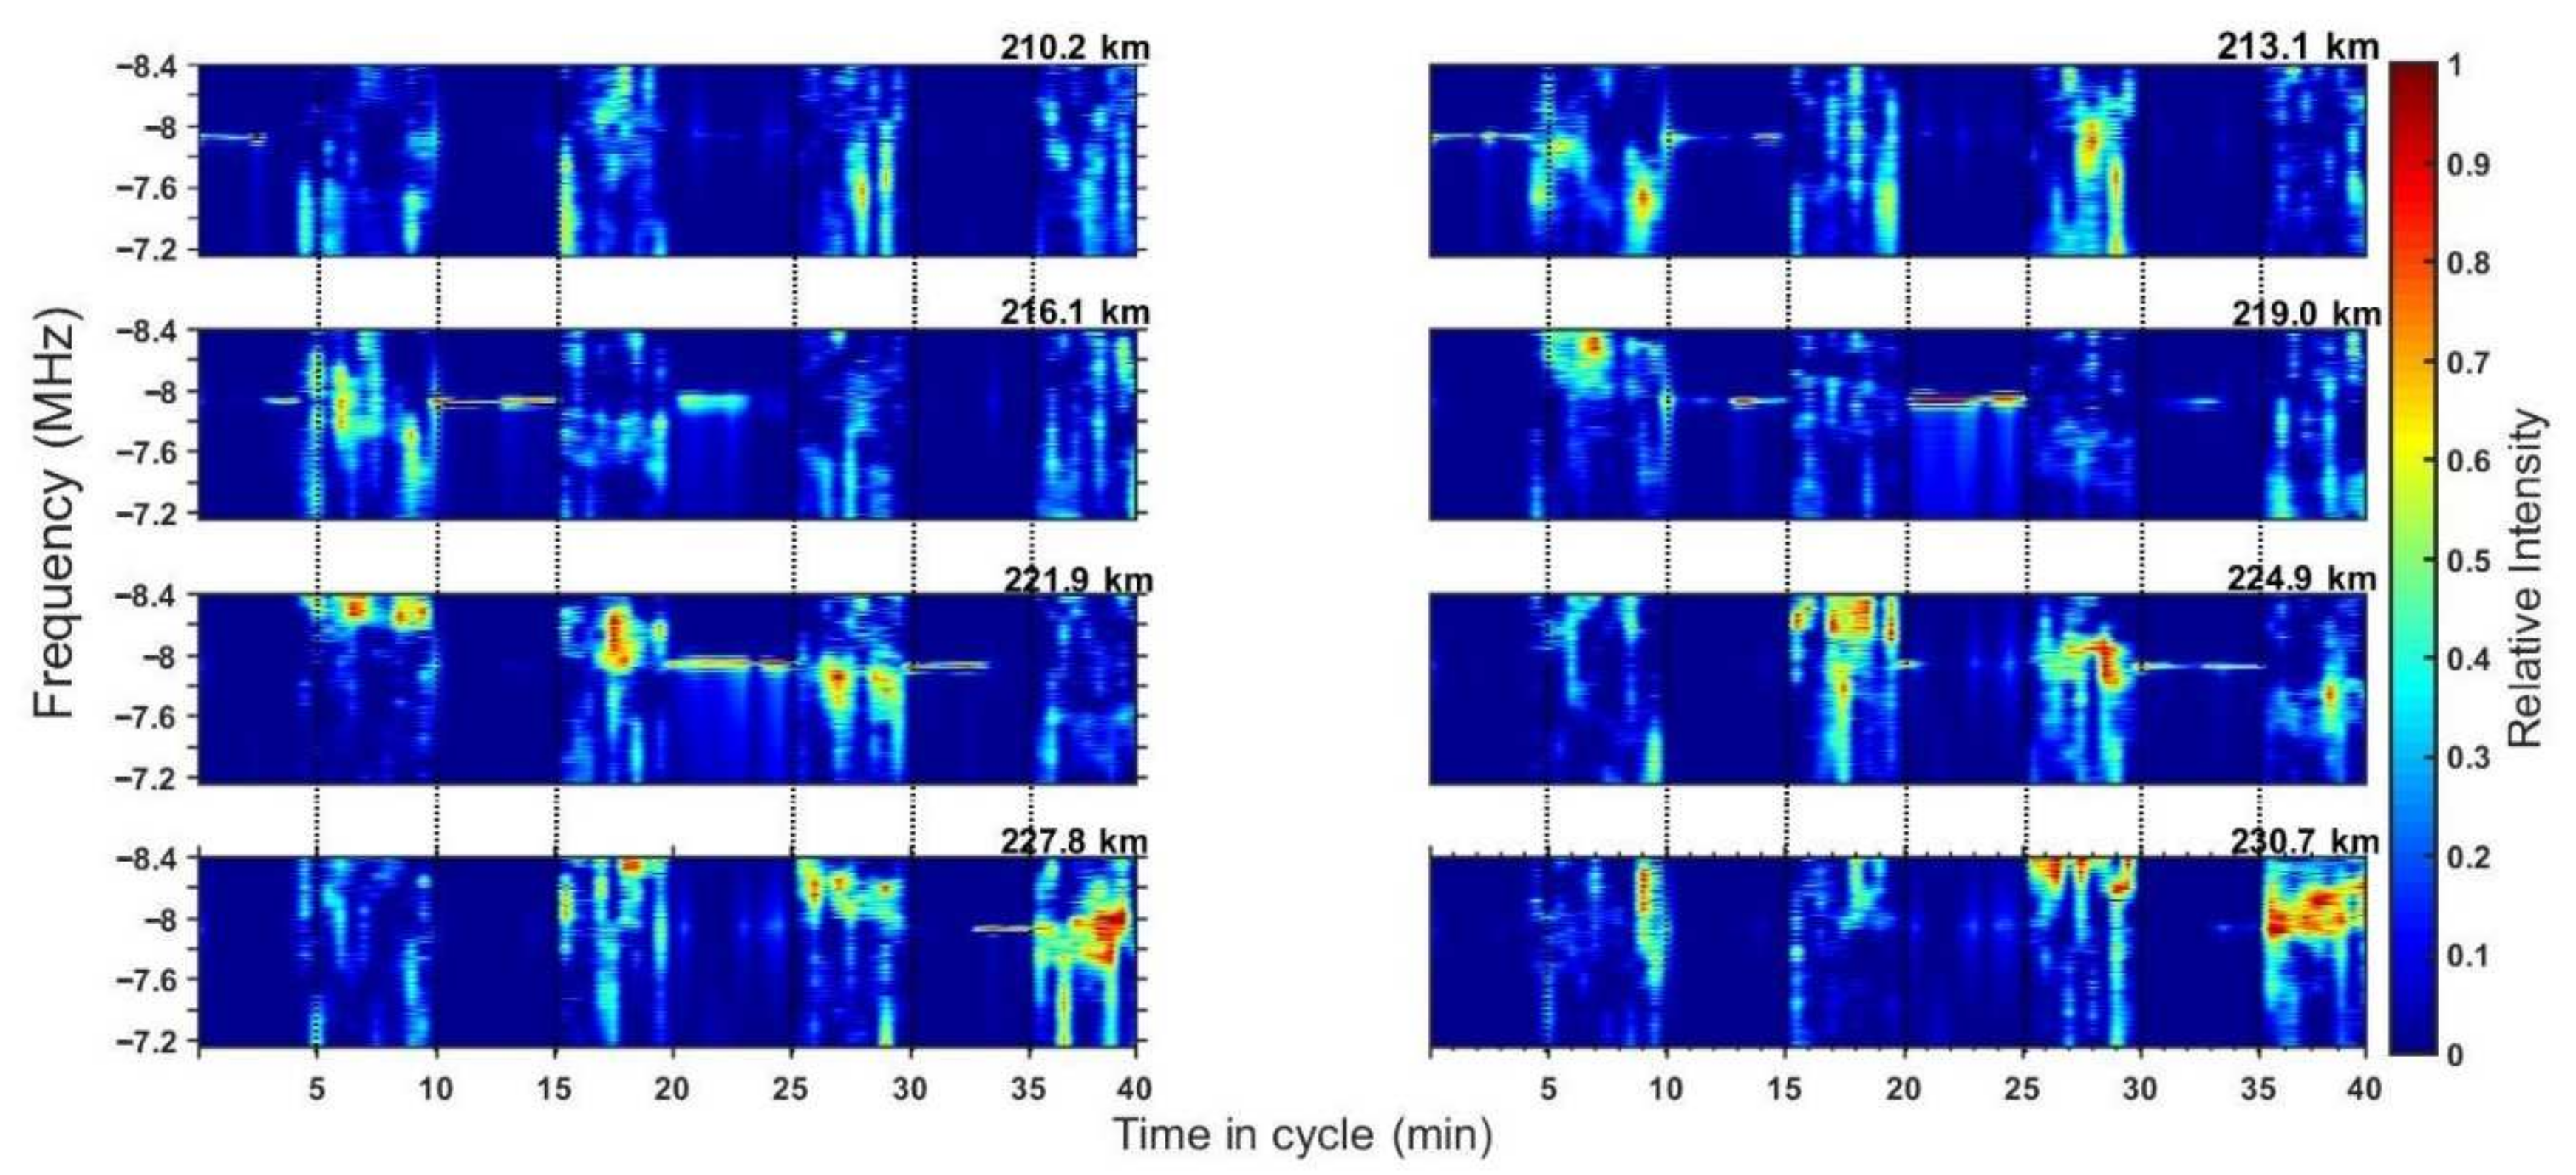
The previous observations at EISCAT showed that the altitude of the ion line was about 3–5 km higher than the altitude of the plasma line [19,20]. Therefore, considering the above altitude difference, the downshifted plasma lines within the frequency range from −7.2 MHz to −8.4 MHz at the altitude of 210.2 km, 213.1 km, 216.1 km, 219.0 km, 221.9 km, 224.9 km, 227.8 km and 230.7 km, respectively, are shown in Figure 2. When the heater is switched on, plasma lines show some gaps or weakening intervals at those heights. They are caused by the normalization to the strongest value of the plasma line at any particular time and do not imply a real decrease in the plasma line or any unusual response. When the heater is on, the plasma spectra show that HFPLs are excited in a wide range of pump-wave frequency variations , as is expected from the parametric decay instability.
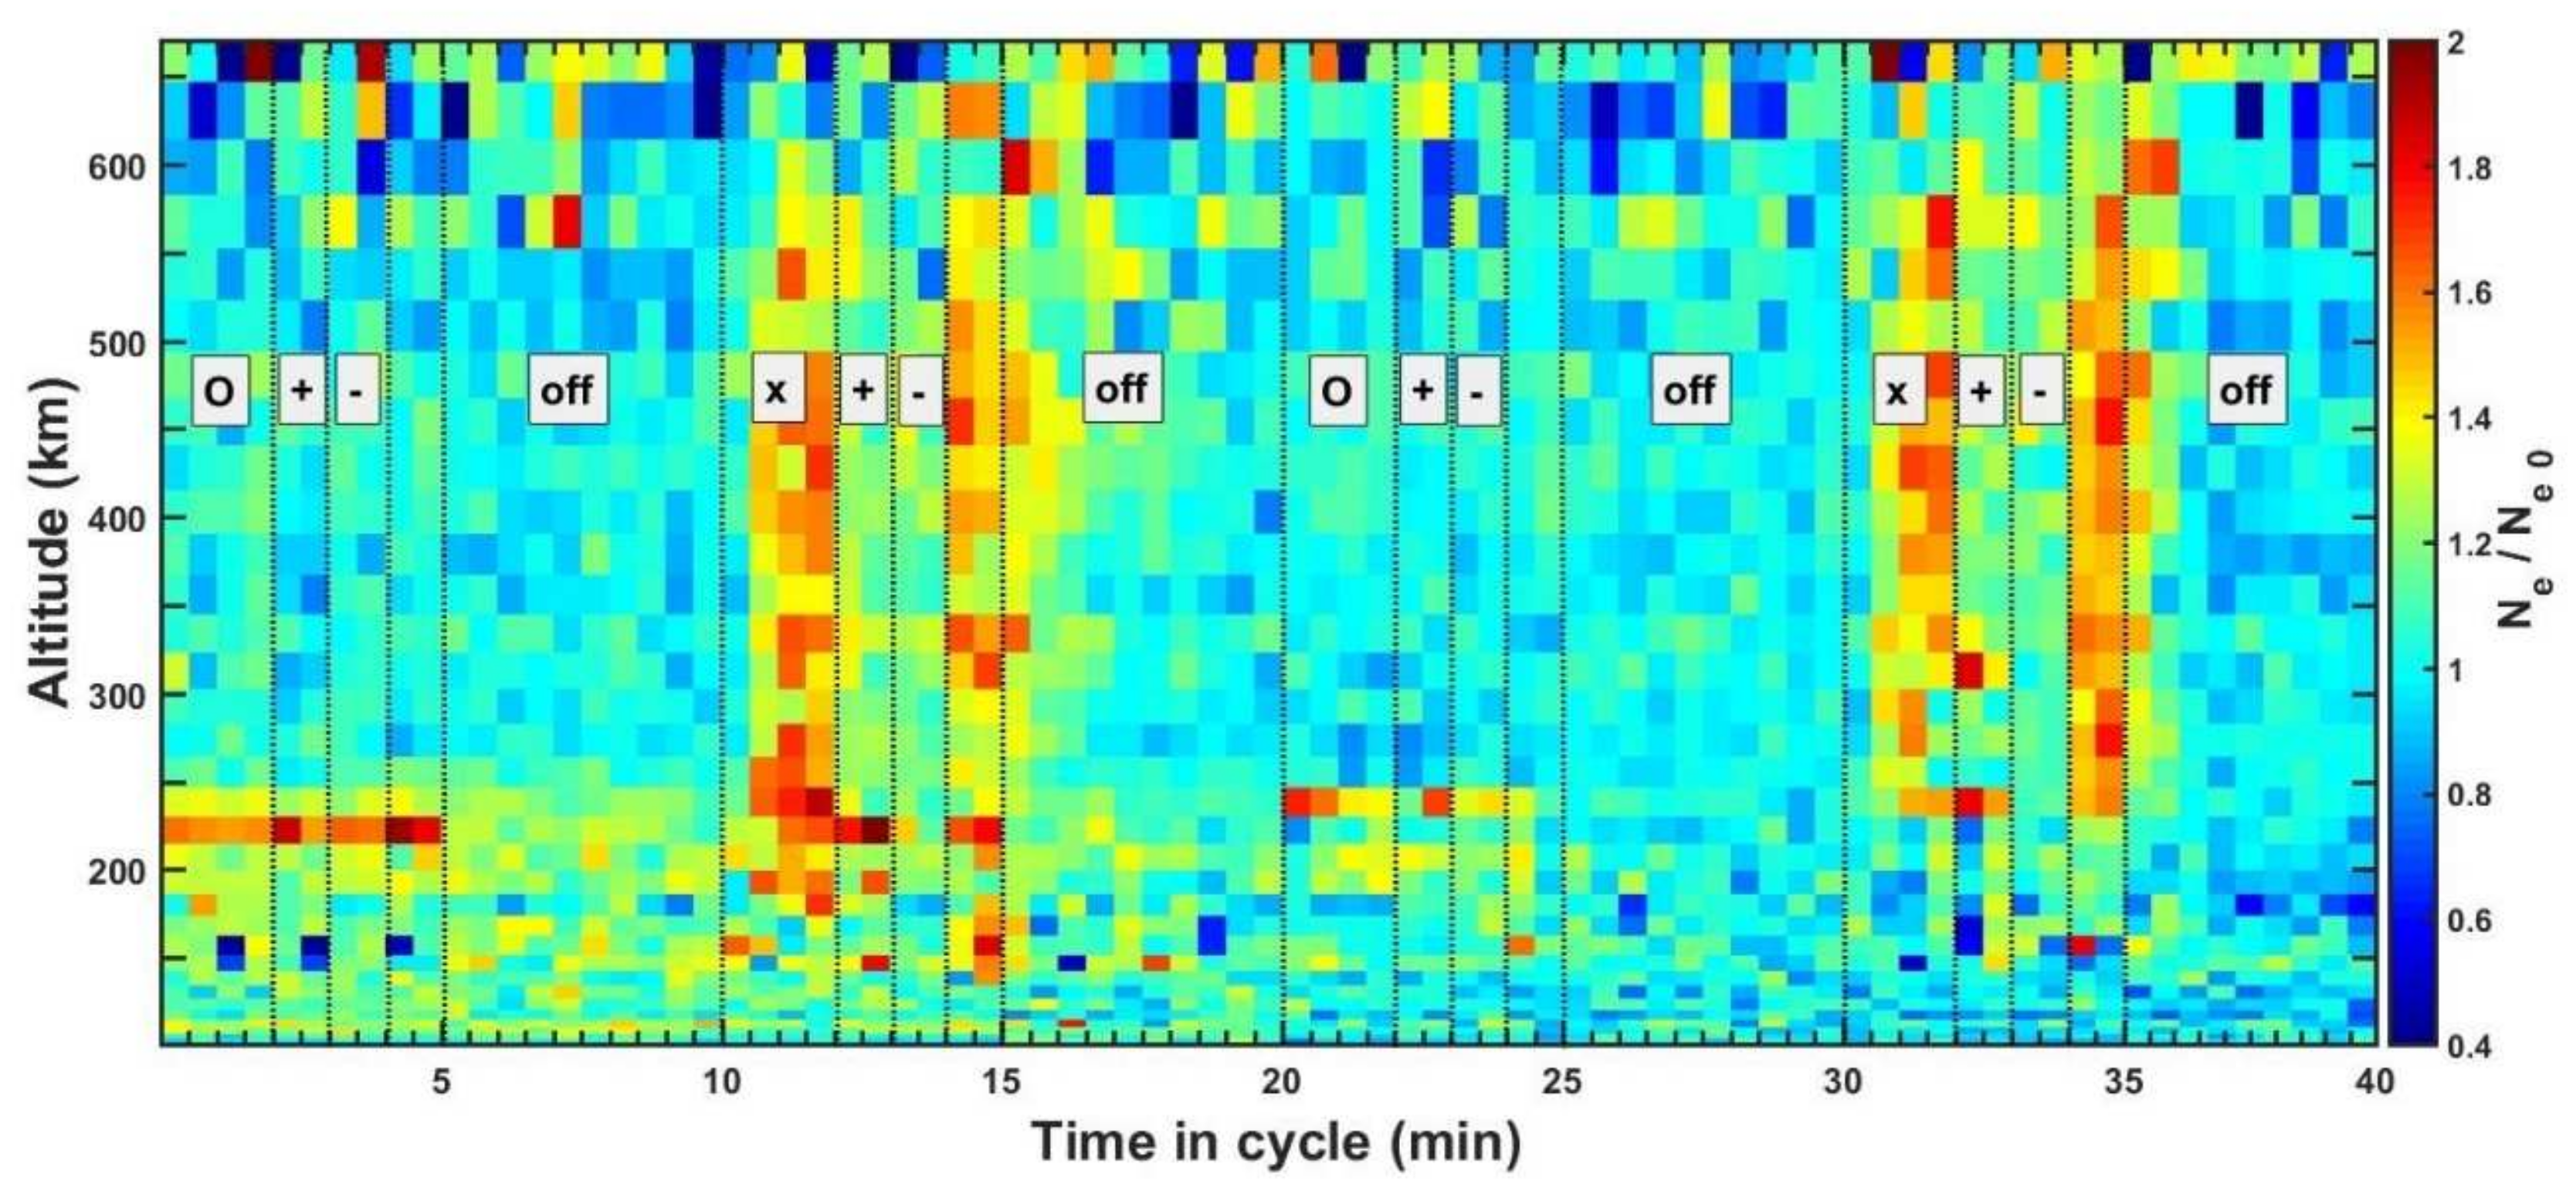
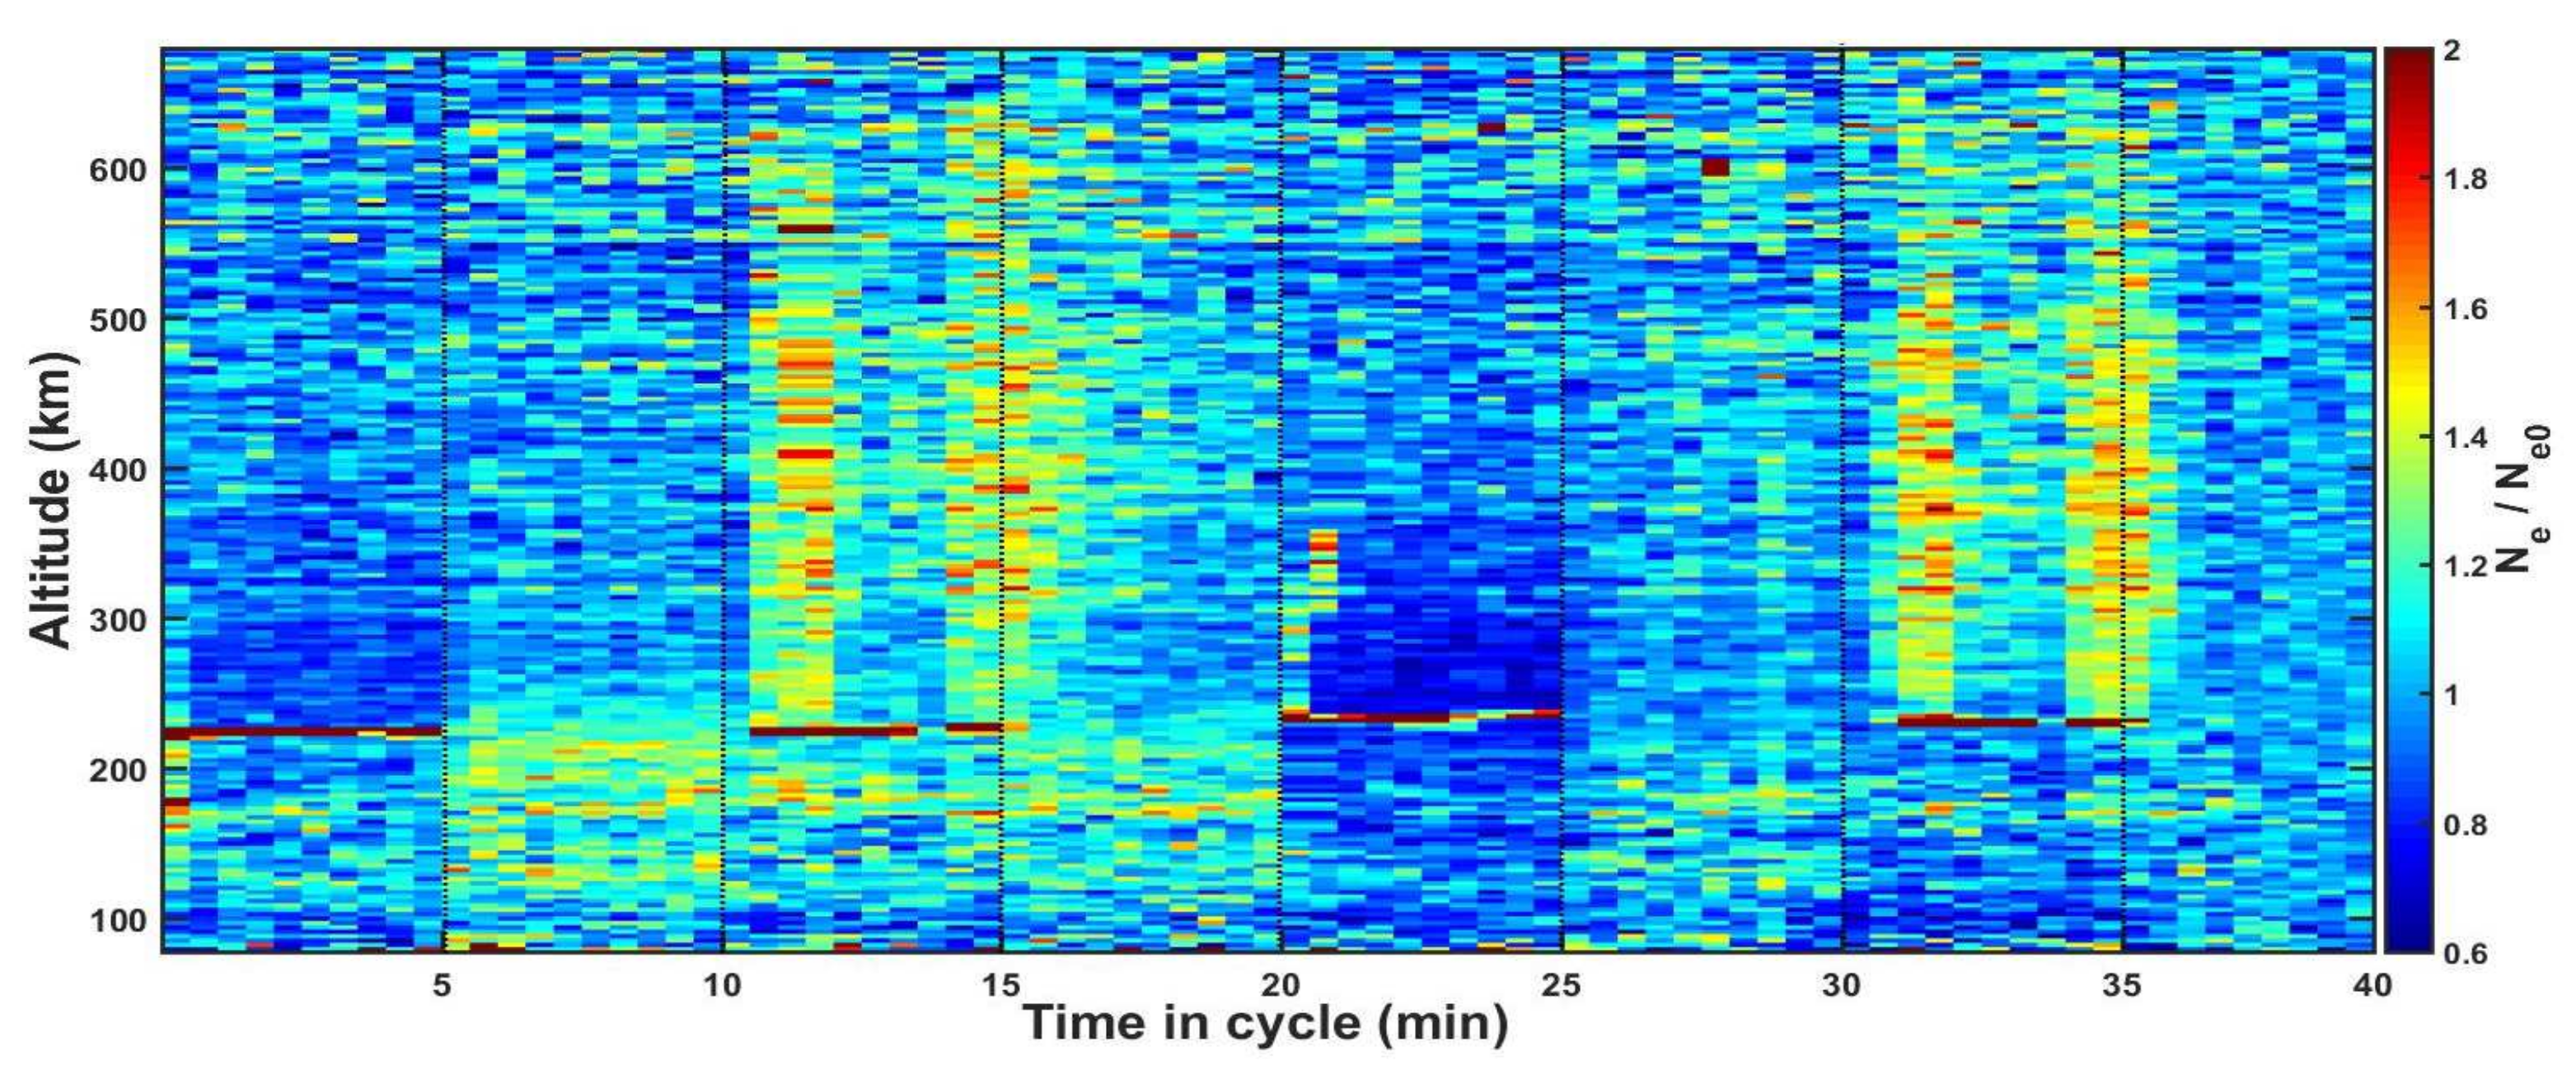
Figure 3 is the altitude profile of the ratios of electron density Ne to the undisturbed background value of Ne0 as a function of time, where Ne0 is taken from the median of the profile of electron density taken from the final 3 min of the pump-off period before the X-mode pulse. In a narrow region around 214 km, it can be seen that those enhancements in Ne/Ne0 in all of the cycles are up to ~1.5. During the X-mode pulses, there is a strong enhancement of Ne, which extends from approximately the reflection altitude of the pump to the limit of the radar’s measurement above 600 km. The enhancement does not occur immediately but has a delay of ~30 s and reaches a level of Ne/Ne0 ≈ 1.6, which appears to be approximately independent of altitude. After the pump is switched off, the enhancement decays to the undisturbed level within about 90 s. It is also apparent that the enhancement is greatly reduced when the radar beam is pointed 1° in elevation away from field-aligned, falling to a level of Ne/Ne0 ≈ 1.2.
4. Discussion
4.1. Ion Line and Plasma Line
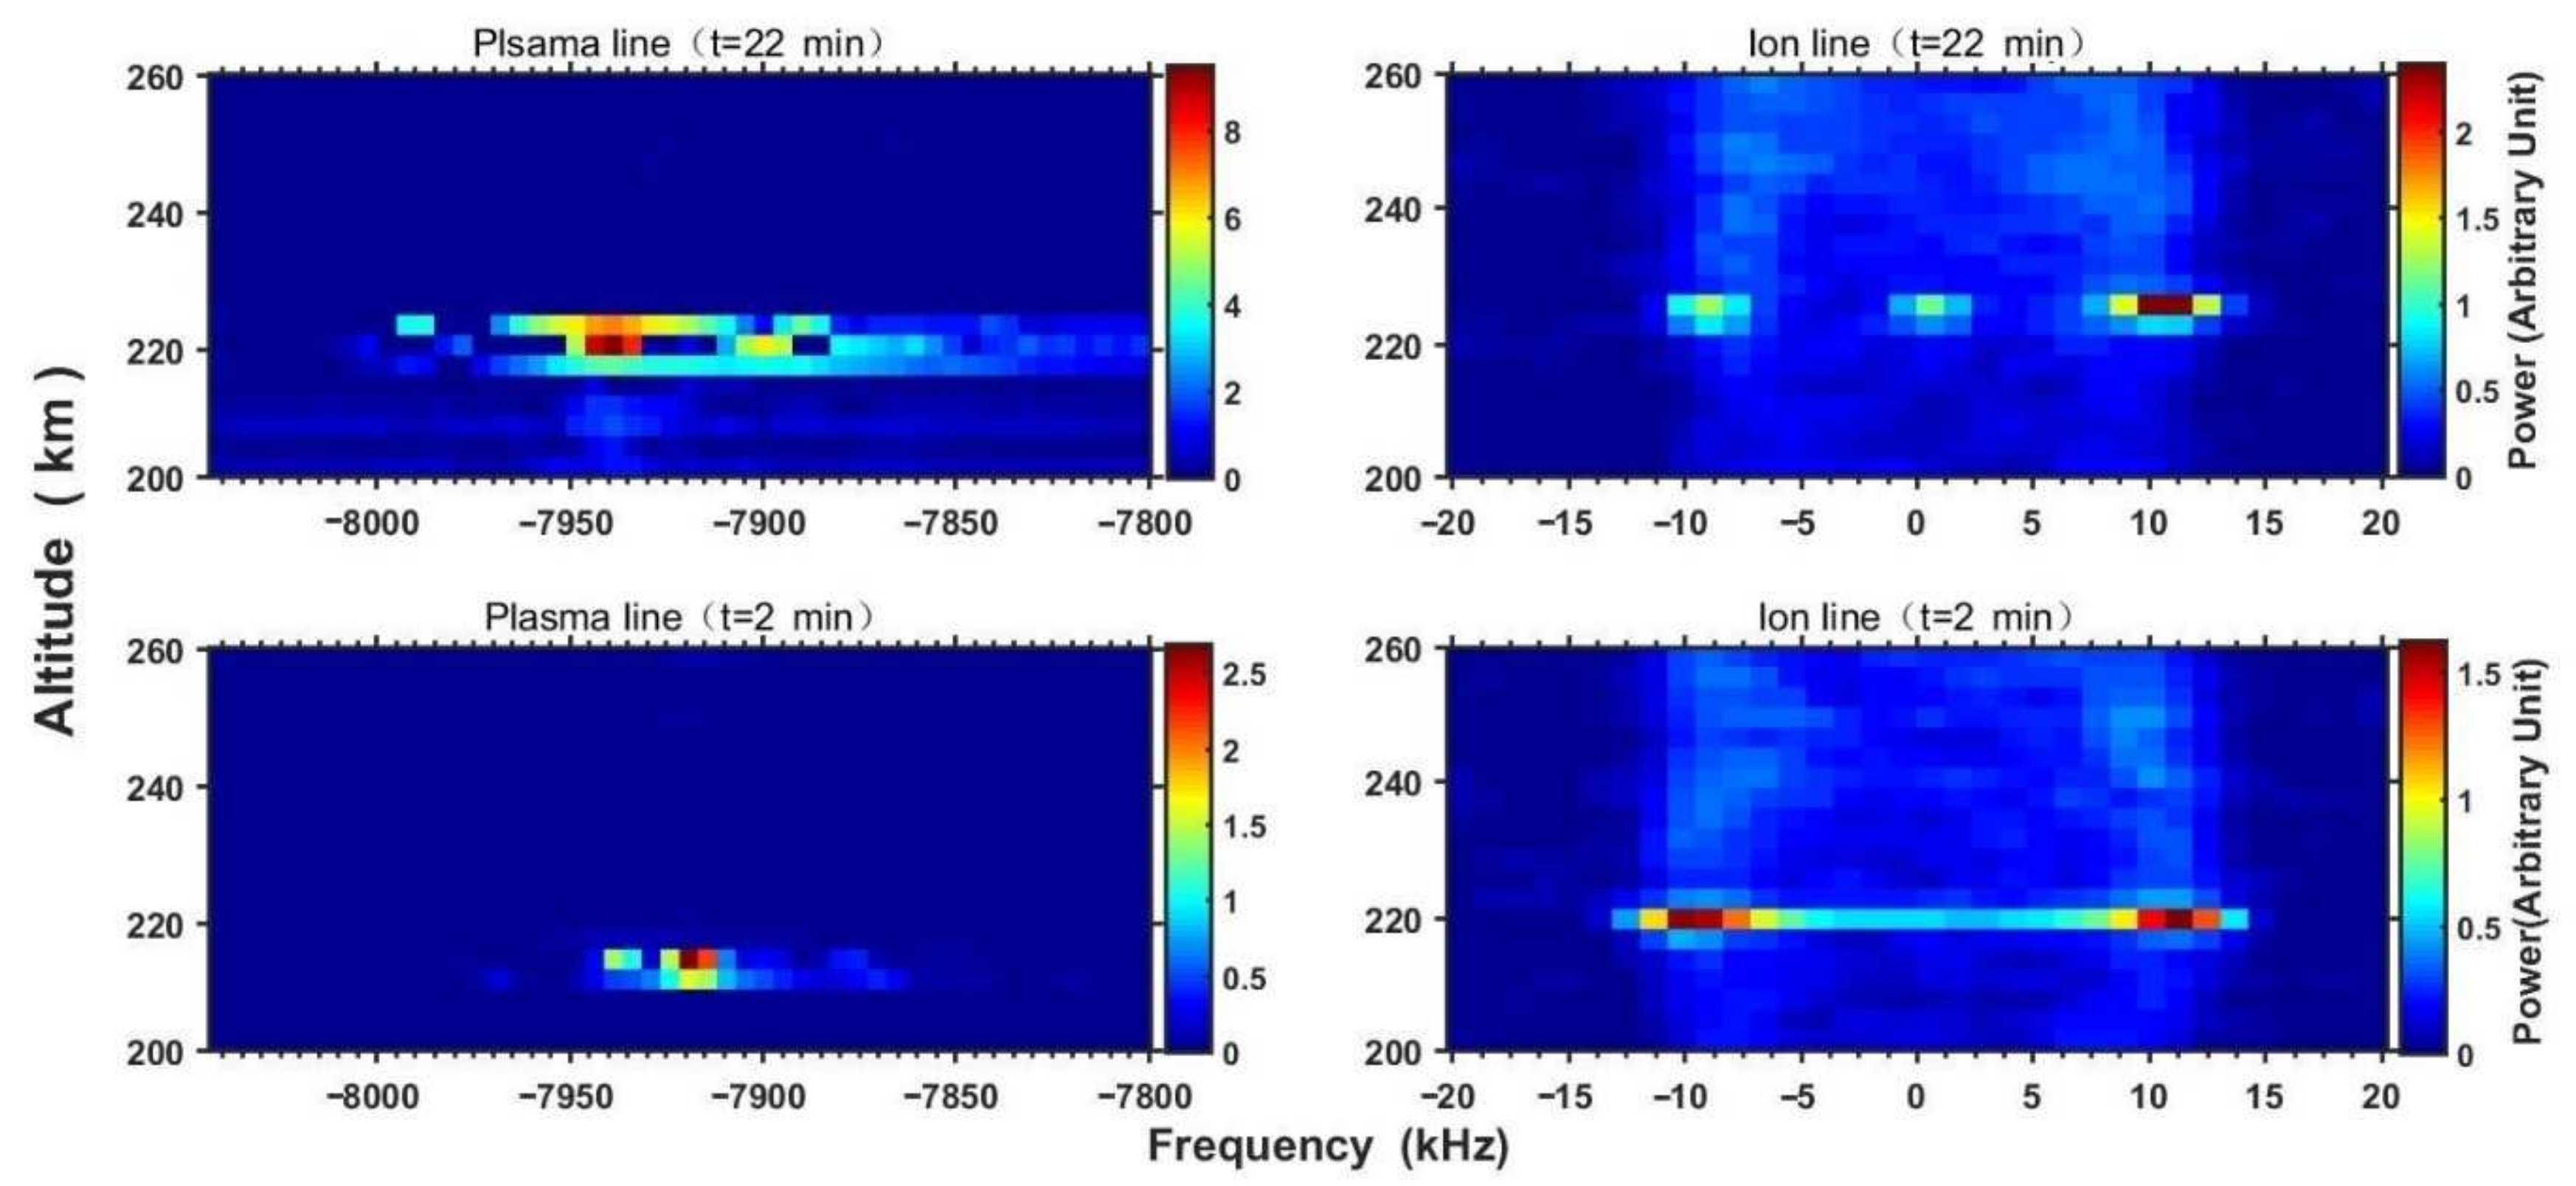
During the artificial ionospheric modification experiment, the enhancements in plasma line and ion line are regularly observable by UHF radar and attributed to the parametric decay instability and the oscillation two-stream instability excited by the pump. With regard to the parametric decay instability, the pump wave decay into a Langmuir wave and an ion acoustic wave , where the wave parameters satisfy the matching conditions: , . Since the pump wavelength is much longer (order of hundred meters) than the other waves considered (<1 m), , can be assumed to be ~0, therefore, , where is the radar vector. In order to verify whether the ion line and plasma line frequencies in Figure 1 and Figure 2 satisfy the PDI, Figure 4 shows the plasma line and ion line in the 2nd and 22nd min for O-mode, which show more details in frequency. When t = 22 min, the plasma line was enhanced at the frequency of about ≈ −7.941 MHz and ≈ −7.902 MHz, when t = 2 min, the plasma line was enhanced at the frequency of about ≈ −7.921 MHz. However, ion lines at these two moments were enhanced at the frequency ≈ −10.7 kHz. Due to the Doppler frequency resolutions of plasma and ion spectra are 1.6 kHz and 1.19 kHz, respectively, so within the resolution range, only , and satisfy the matching condition of PDI. Actually, the Langmuir wave , excited by PDI, will grow continuously, and when it reaches a certain level, it will decay into a new Langmuir wave and an ion acoustic wave , since the Langmuir wave can be observed by the radar, so = = −, and = = 2, further, = = 2, and thus = . With the same principle, the Langmuir wave can act as pump and decay into Langmuir wave and an ion acoustic wave , where = . This is also called cascade phenomenon, so and are the result of the second and third cascade processes. Westman et al. [6] observed up to five cascade lines in addition to the decay line in the Tromsø HF-induced plasma line and well-developed cascade type plasma lines for the first time, and Perkins et al. [21] also found the HFPLs lies at the frequency 3 lower than pump frequency in Arecibo.
In Figure 1 and Figure 2, HFILs and HFPLs are also observed in the second and fourth cycles, which is the X-mode pumping. In fact, the EISCAT Heating facility cannot isolate the O-mode wave and the X-mode wave completely; the leakage of X-mode power to O-mode is feasible. Existing observations and theories show that X-mode also can excite PDI and OTSI processes [13,14,22]. Although we cannot separate the HFILs and HFPLs excited by the O- or X-mode in the spectrum due to the power leakage problem, we can still distinguish the parametric instability excited by O-/X-mode waves according to the different excitation heights [13,14,22]. The reflection altitude of the pump wave where are for the O-mode wave and for X-mode wave [23], where is the local electron plasma frequency, is the electron gyrofrequency and is the complement of the local dip angle. Hence, the reflection altitude for O-mode in the second and fourth cycle is 225.2 km and 233.3 km, respectively, and 219.5 km and 225.5 km for the X-mode. The height of HFILs is higher than the X-mode reflection altitude both in the second and fourth cycle and approximately equal to the O-mode reflection altitude indicate that the HFILs and HFPLs observed in the second and fourth cycle are excited by O-mode pumping. However, the intensity of the pump for O-mode has to exceed the thresholds of the parametric decay instability and the oscillation two-stream instability, respectively [24,25]:
to overcome such damping processes as collision, where , , and are the ion temperature, electron collision frequency and the Boltzmann constant, is a function of / and with a value of ~0.56 for / = 2 [4]. Here, , / and are ~2000 K, ~2.2, and ~10 Hz, respectively, which are the mean measurements of the UHF radar within the time interval of 13:10 UT, 13:30 UT. Then, ≈ 0.15 V/m and ≈ 0.19 V/m can be obtained. During the daytime, D-region absorption is usually nonzero. For the pump in free space, the electric field E(V/m) at a range R(km) from a transmitter with ERP(kW), which was reduced due to D region absorption, is given by: , where ERP is the effective radiated power and R is the distance [26]. According to the effective radiated power (ERP) model of EISCAT, in addition to the wanted X-mode wave, a weaker O-mode component with an ERP of ~ kW was present [15]. The ERP quoted here was estimated using a model based on the NEC2 code, assuming a perfectly conducting ground. Hence, the electric field E should be ~0.286 V/m at the altitude of R ≈ 214 km. It is obvious that the O-mode component satisfies the thresholds of the parametric decay instability and the oscillation two-stream instability; that is to say, HFPLs and HFILs observed in the X-mode pulse could have been caused by the O-mode component mixed in X-mode wave.
4.2. Electron Density
The change in electron density induced by a powerful pump is difficult to measure for the following reasons. The density is much more variable both in time and space, and the artificial density change is relatively small [27]. Thus, are those apparent enhancements in Ne/Ne0 shown in Figure 3 the true increases in electron density? The principle of inversion of electron density is based on the Incoherent Scattering Radar, i.e., the integral of the ion spectrum is proportional to the electron density; Figure 5 shows the inversion of electron density using ion spectra calculated by RTG software. As shown in Figure 3, the strong enhancement in electron density also appears at the height of 214 km to 230 km in Figure 5, and it is consistent with the behavior of the ion line shown in Figure 1. Thus, the apparent enhancements in Ne/Ne0 around reflection altitude should be the result of an enhancement of ion line excited by oscillating two-stream instability and parametric decay instability around the reflection altitude [19].
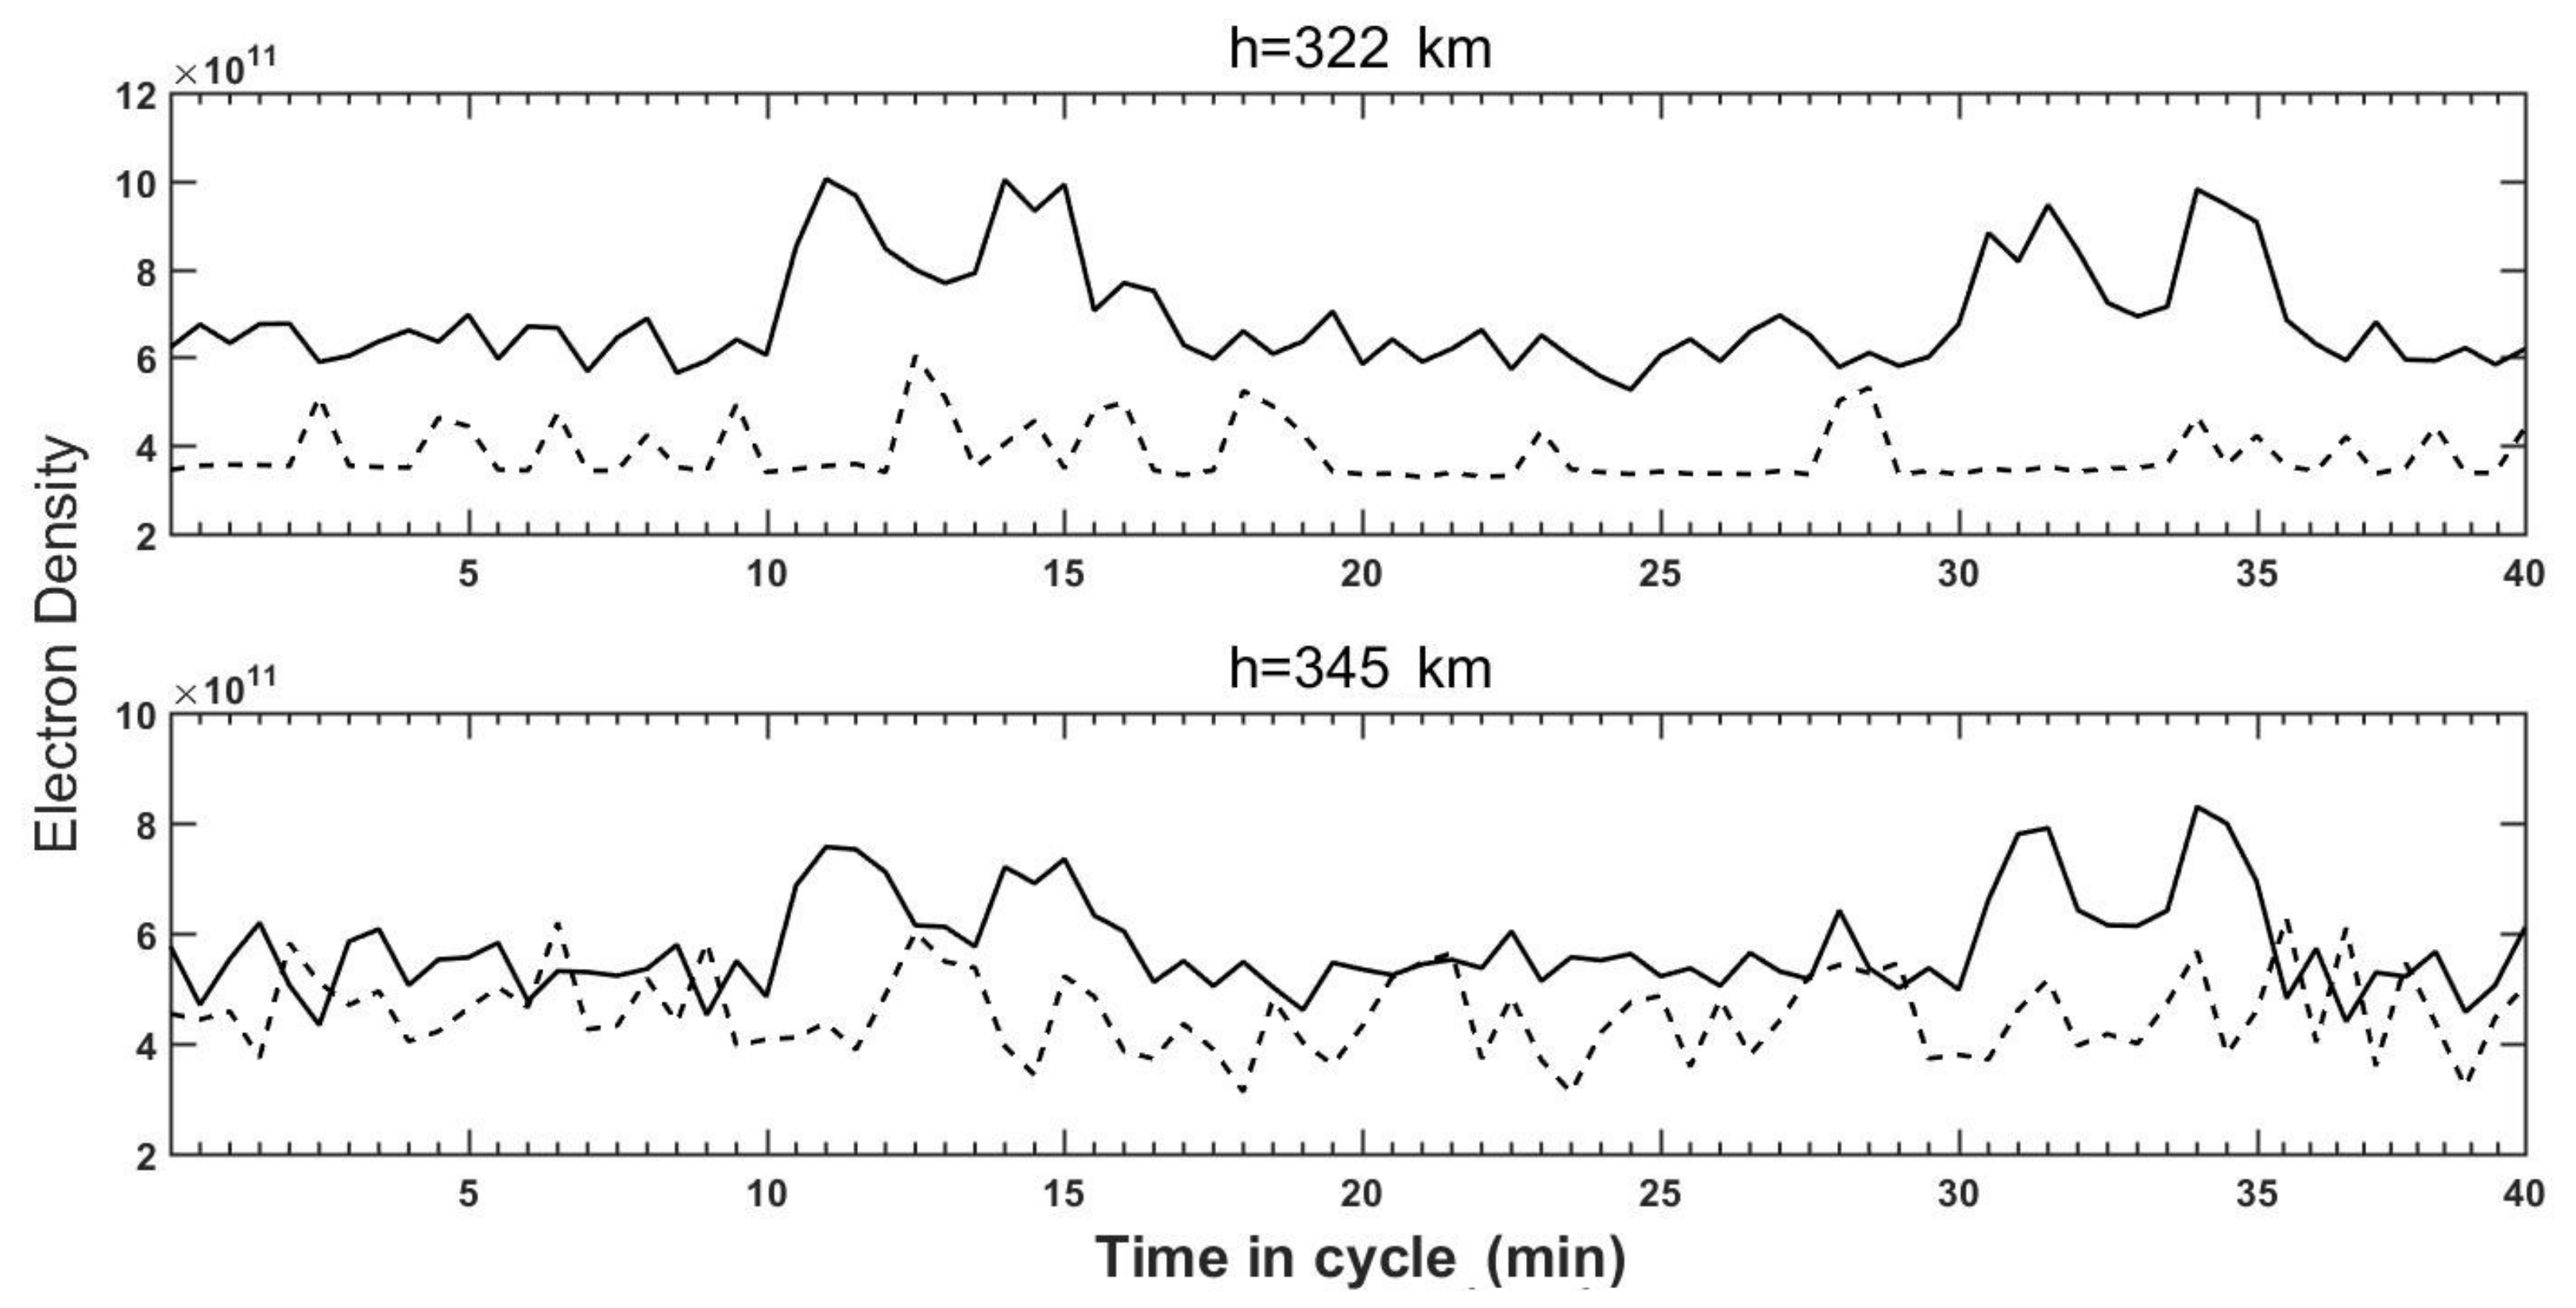
In addition, Figure 5 also shows that the strong enhancement in electron density extending over a wide altitude (from approximately the reflection altitude to ~670 km) is consistent with Figure 3. In order to verify whether this kind of enhancement in Ne/Ne0 represents a real increase in electron density, we compared the calculated results of electron density from GUISDAP with the inversion results of plasma line spectrum at 322 km and 345 km altitudes, respectively, which are shown in Figure 6. As can be seen from Figure 6, electron density calculated by GUISDAP shows some enhancement during X-mode pumping, but the inversion results of the plasma spectrum show no apparent increase in electron density. Therefore, it is safe to conclude that this kind of enhancement in electron density is also caused by the enhancement of the ion line and does not correspond to the true increase in electron density. Senior et al. [15] also came to this conclusion that according to the full dispersion relation by assuming electrostatic waves and parallel propagation, changes in the plasma frequency would be expected to produce corresponding changes in the plasma line frequency unless they were compensated by changes in the shape of the electron distribution function through the integral term, but there is no evidence to support this claim. However, which mechanism should be responsible for the enhancement of the ion line with wide altitude extents above the reflection altitude?
Actually, the apparent electron density enhancements in the magnetic field-aligned direction in a wide altitude range up to the upper limit of UHF radar measurements (600 km) were also recorded by Blagoveshchenskaya et al. [28]. The EISCAT heater was operated in X mode at frequencies of 6.2 and 7.1 MHz in the experiment of Blagoveshchenskaya et al. They also found that the X-mode radio-induced optical emissions coexisted with HFILs and HFPLs and strong artificial field-aligned irregularities and Ne enhancement throughout the whole heater pulse. Additionally, they suggested that the Langmuir turbulence excited by an X-mode HF pump wave could produce fluxes of accelerated electrons that, in turn, lead to the enhanced production of ionization. The inconsistency between this theory and the above analysis is that if the apparent electron density enhancements in the magnetic field-aligned direction in a wide altitude range are caused by ionization, then both ion line and plasma line frequency should be enhanced; however, we did not observe the enhancement of plasma line at these altitudes. Hence, this hypothesis should be ruled out.
Rietveld and Senior [29] suggested a hypothesis where the medium- to large-scale HF-induced field-aligned irregularities, which are much larger than the radar wavelength and perhaps with the scale size of tens to hundreds of meters, cause radar waves near grazing incidence to be reflected. If the irregularities are extended long enough along the field line, multiple reflections can occur so that the region of irregularities acts as a duct where the overall decrease in the radar’s field strength with distance falls off more slowly than r2, where r is the propagating distance. It is this slighter decrease in the radar wave with distance than the free space falloff as r2 assumed in the normal incoherent scatter analysis that causes apparent stronger backscatter from all ranges above the ducting region of irregularities. Thus, an apparent enhancement in electron density can be obtained by the standard analysis of the incoherent scattering spectrum. They proposed that the irregularities are excited by both O- and, preferentially, X-mode pump waves. Then irregularities can also be excited by O-mode pump waves during alternating O/X-mode heating experiments. However, this kind of increase in electron density was not observed during the first and third cycles of O-mode pumping in our experiment, and it is only observed in X-mode pumping. Rietveld and Senior’s hypothesis is wrong. How can density irregularities duct UHF radar pulses under the condition fp2/fradar2 < 10−4? Moreover, the duct will not affect the incoherent backscattering spectral intensity much. If the radar pulse is focused on increasing the intensity, the cross-section area of the incoherent scatter is reduced proportionally; thus, the two effects cancel each other. In radar theory with a fixed target (i.e., a fixed scattering cross area), the return intensity is proportional to the 1/r4. However, in the incoherent backscattering, the cross-section area is proportional to r2, so the backscattering spectral intensity is proportional to 1/r2. The difference is because the incoherent backscatter cross-section area is proportional to the cross-section area of the radar pulse.
The enhancements in Ne/Ne0 presented above were just observed in the X-mode pumping. Actually, O-mode pumping can also cause similar changes in Ne/Ne0 presented by Wu Jun et al. [7] and Borisova et al. [8] during an artificial ionospheric modification experiment near the fifth electron gyrofrequency in EISCAT, and they only observed this feature in a high-frequency band (a little higher than the fifth electron gyrofrequency). Additionally, we note that there are many similarities between electron density enhancement in a wide altitude range caused by X-mode wave and O-mode HF heater wave. In the first place, they extend from the reflection altitude to the limit of the radar’s measurement. Second, they appear to be approximately independent of altitude. Third, after the pump is switched on, they do not occur immediately but have a delay of ~30 s. Fourth, after the pump is switched off, the enhancement decays to the undisturbed level within tens of seconds. Fifth, they are not correlated with the incoherent scatter plasma line but only involve the enhancement in the ion line. Thus far, we are unable to offer a physical explanation of this phenomenon.
5. Conclusions
This paper reports experimental observations from an artificial ionospheric modification experiment by alternating O-/X-mode waves on 18 October 2012 at the EISCAT Tromsø site in northern Norway.
During both O-mode and X-mode HF heater waves, HFILs were observed in the vicinity of O-mode reflection altitude and above X-mode reflection altitude, which indicates that the HFILs caused by PDI and OTSI are also the result of O-mode HF heater wave mixed in X-mode wave. During X-mode pulse, a weaker O-mode component with an effective radiated power (ERP) of ~4 MW exceeds the thresholds of the parametric decay instability and the oscillation two-stream instability. The frequency of plasma line (), ion line () and pump () matches = − 3 and = − 5, we note that this is caused by the cascade process of PDI.
Through quantitative calculation, we find that the O-mode component mixed in X-mode wave satisfies the thresholds of the parametric decay instability and the oscillation two-stream instability, from which we first proposed that the HFPLs and HFILs observed in X-mode pulse could have been caused by the O-mode component mixed in X-mode wave.
We can draw a conclusion from Figure 5 and Figure 6 that those enhancements in Ne/Ne0 over a wide altitude range are not confirmed by the incoherent scatter plasma line but are only associated with the enhancement in the ion line. We provide the evidence that the theory, where the Langmuir turbulence excited by an X-mode HF pump wave could produce fluxes of accelerated electrons that, in turn, lead to the enhanced production of ionization proposed by Blagoveshchenskaya et al. [28], cannot explain this phenomenon. The theory reported by Rietveld and Senior [29] is incorrect because (1) it contradicts the basic radar theory, and (2) fp2/fradar2 < 10−4.
Author Contributions
Investigation, Z.L.; writing—original draft preparation, Z.L. and Q.L.; writing—review and editing, Z.L. and H.F.; supervision, H.G. and H.F. All authors have read and agreed to the published version of the manuscript.
Funding
This research was funded by the National Natural Science Foundation of China (grant number 41804149) and China Scholarship Council.
Institutional Review Board Statement
Not applicable.
Informed Consent Statement
Not applicable.
Data Availability Statement
Publicly available datasets were analyzed in this study. This data can be found here: [https://www.eiscat.se/schedule/schedule.cgi, accessed on 13 June 2021 and http://flux.phys.uit.no/geomag.html, accessed on 13 June 2021].
Acknowledgments
EISCAT is an international scientific association supported by research organizations in China (CRIRP), Finland (SA), Japan (NIPR and STEL), Norway (NFR), Sweden (VR) and the United Kingdom (NERC). The experiments reported in this paper were carried out by Senior et al.
Conflicts of Interest
The authors declare no conflict of interest.
References
- Stenflo, L. Comments on Stimulated Electromagnetic Emissions in the Ionospheric Plasma. Phys. Scr. 2004, 107, 262–263. [Google Scholar] [CrossRef]
- Pedersen, T.; Carlson, H. First observations of HF heater-produced airglow at the High Frequency Active Auroral Research Program facility: Thermal excitation and spatial structuring. Radio Sci. 2001, 36, 1013–1026. [Google Scholar] [CrossRef]
- Graham, K.N.; Fejer, J.A. Anomalous radio wave absorption due to ionospheric heating effects. Radio Sci. 1976, 11, 1057–1063. [Google Scholar] [CrossRef]
- Stubbe, P.; Kopka, H.; Thidé, B.; Derblom, H. Stimulated electromagnetic emission: A new technique to study the parametric decay instability in the ionosphere. J. Geophys. Res. 1984, 89, 7523–7536. [Google Scholar] [CrossRef]
- Meltz, G.; Perkins, F.W. Ionospheric modification theory: Past, present, and future. Radio Sci. 1974, 9, 885–888. [Google Scholar] [CrossRef]
- Westman, A.; Leyser, T.B.; Wannberg, G.; Rietveld, M.T. Tristatic EISCAT-UHF measurements of the HF modified ionosphere for low background electron temperatures. J. Geophys. Res. 1995, 100, 9717–9728. [Google Scholar] [CrossRef]
- Wu, J.; Wu, J.; Rietveld, M.T.; Haggstrom, I.; Zhao, H.; Xu, Z. The behavior of electron density and temperature during ionospheric heating near the fifth electron gyrofrequency. J. Geophys. Res. 2017, 122, 1277–1295. [Google Scholar] [CrossRef] [Green Version]
- Borisova, T.D.; Blagoveshchenskaya, N.F.; Kalishin, A.S. Modification of the high-latitude ionospheric F region by high-power HF radio waves at frequencies near the fifth and sixth electron gyroharmonics. Radio Phys. Quantum Electron 2016, 58, 561–585. [Google Scholar] [CrossRef] [Green Version]
- Robert, L.S.; Kim, D.M. Time variations of HF-induced plasma waves. J. Geophys. Res. 1978, 83, 623. [Google Scholar]
- Stocker, A.J.; Honary, F.; Robinson, T.R.; Jones, T.B.; Stubbe, P.; Kopka, H. EISCAT observations of large-scale electron temperature and electron density perturbations caused by high power HF radio waves. J. Atmos. Terr. Phys. 1992, 54, 1555–1572. [Google Scholar] [CrossRef]
- Pedersen, T.; Gustavsson, B.; Mishin, E.; Kendall, E.; Mills, T.; Carlson, H.C.; Snyder, A.L. Creation of artificial ionospheric layers using high-power HF waves. Geophys. Res. Lett. 2010, 37. [Google Scholar] [CrossRef] [Green Version]
- Pedersen, T.; McCarrick, M.; Reinisch, B.; Watkins, B.; Hamel, R.; Paznukhov, V. Production of artificial ionospheric layers by frequency sweeping near the 2nd gyroharmonic. Ann. Geophys. 2011, 29, 47–51. [Google Scholar] [CrossRef] [Green Version]
- Blagoveshchenskaya, N.F.; Borisova, T.D.; Yeoman, T.K.; Rietveld, M.T.; Ivanova, I.M.; Baddeley, L.J. Artificial small-scale fieldaligned irregularities in the high latitude F region of the ionosphere induced by an X-mode HF heater wave. Geophys. Res. Lett. 2011, 38, L08802. [Google Scholar] [CrossRef]
- Blagoveshchenskaya, N.F.; Borisova, T.D.; Rietveld, M.T.; Yeoman, T.K.; Wright, D.M.; Rother, M.; Lühr, H.; Mishin, E.V.; Roth, C. Results of Russian experiments dealing with the impact of powerful HF radio waves on the high-latitude ionosphere using the EISCAT facilites. Geomagn. Aeron. 2011, 51, 1109–1120. [Google Scholar] [CrossRef]
- Senior, A.; Rietveld, M.T.; Häggström, I.; Kosch, M.J. Radio-induced incoherent scatter ion line enhancements with wide altitude extents in the high-latitude ionosphere. Geophys. Res. Lett. 2013, 40, 1669–1674. [Google Scholar] [CrossRef] [Green Version]
- Rishbeth, H.; Eyken, A.V. EISCAT: Early history and the first ten years of operation. J. Atmos. Terr. Phys. 1993, 55, 525–542. [Google Scholar] [CrossRef]
- Borisova, T.D.; Blagoveshchenskaya, N.F.; Rietveld, M.T.; Häggström, I. Outshifted Plasma Lines Observed in Heating Experiments in the High-Latitude Ionosphere at Pump Frequencies Near Electron Gyroharmonics. Radio Phys. Quantum Electron. 2019, 61, 722–740. [Google Scholar] [CrossRef]
- Lehtinen, M.; Huuskonen, A. General incoherent scatter analysis and GUISDAP. J. Atmos. Terr. Phys. 1996, 58, 435–452. [Google Scholar] [CrossRef]
- Stubbe, P.; Kohl, H.; Rietveld, M.T. Langmuir turbulence and ionospheric modification. J. Geophys. Res. 1992, 97, 6285–6297. [Google Scholar] [CrossRef]
- Kohl, H.; Kopka, H.; Stubbe, P.; Rietveld, M.T. Introduction to ionospheric heating experiments at Tromsø-II. Scientific problems. J. Atmos. Terr. Phys. 1993, 55, 601–613. [Google Scholar] [CrossRef]
- Perkins, F.W.; Oberman, C. Parametric instabilities and ionospheric modification. J. Geophys. Res. 1974, 79, 1479–1496. [Google Scholar] [CrossRef]
- Wang, X.; Zhou, C.; Liu, M.R.; Honary, F.; Ni, B.; Zhao, Z. Parametric instability induced by X-mode wave heating at EISCAT. J. Geophys. Res. Space Phys. 2016, 121, 10536–10548. [Google Scholar] [CrossRef] [Green Version]
- Ginzburg, V.L. The Propagation of Electromagnetic Waves in Plasmas; Elsevier: New York, NY, USA, 1970. [Google Scholar]
- Robinson, T.R. The heating of the high latitude ionosphere by high power radio waves. Phys. Rep. 1989, 179, 79–209. [Google Scholar] [CrossRef]
- Bryers, C.J.; Kosch, M.J.; Senior, A.; Rietveld, M.T.; Yeoman, T.K. The thresholds of ionospheric plasma instabilities pumped by high frequency radio waves at EISCAT. J. Geophys. Res. Space Physics. 2013, 118, 7472–7481. [Google Scholar] [CrossRef] [Green Version]
- Rietveld, M.T.; Kohl, H.; Kopka, H.; Stubbe, P. Introduction to ionospheric heating at Tromsø-I. Experimental overview. J. Atmos. Terr. Phys. 1993, 55, 577–599. [Google Scholar] [CrossRef]
- Rietveld, M.T. Ionospheric electron heating, optical emissions, and striations induced by powerful HF radio waves at high latitudes: Aspect angle dependence. J Geophys Res. 2003, 108, 1141–1156. [Google Scholar] [CrossRef] [Green Version]
- Blagoveshchenskaya, N.F.; Borisova, T.D.; Kosch, M.; Sergienko, T.; Brändström, U.; Yeoman, T.K.; Häggström, I. Optical and ionospheric phenomena at EISCAT under continuous X.-mode HF pumping. J. Geophys. Res. Space Physics. 2014, 119, 10483–10498. [Google Scholar] [CrossRef]
- Rietveld, M.T.; Senior, A. Ducting of incoherent scatter radar waves by field-aligned irregularities. Ann. Geophys. 2020, 38, 1101–1113. [Google Scholar] [CrossRef]
Figure 1.
The ion lines from −20 kHz to 20 kHz at the altitude of 215.4 km, 218.3 km, 221.3 km, 224.2 km, 227.1 km, 230.1 km, 233.0 km, 235.9 km, respectively. The time is from 13:10 to 13:50 UT, in which 0~5 min, 20~25 min are O-mode pumping, 10~15 min, 30~35 min are X-mode pumping, and the rest of the time is off.

Figure 2.
The plasma lines from −7.2 MHz to −8.4 MHz at the altitude of 210.2 km, 213.1 km, 216.1 km, 219.0 km, 221.9 km, 224.9 km, 227.8 km, 230.7 km, respectively. The time is from 13:10 to 13:50 UT, in which 0~5 min, 20~25 min are O-mode pumping, 10~15 min, 30~35 min are X-mode pumping, and the rest of the time is off.

Figure 3.
The ratio of the electron density to its undisturbed varies with time and altitude based on the data processed by GUISDAP software. The pump wave polarization is indicated by ‘O’ and ‘X’ as appropriate. The periods where the radar beam was pointed 1° higher and lower in elevation than the magnetic field-aligned direction is denoted by ‘+’ and ‘−’, respectively.

Figure 4.
Plasma line and ion line in the 2nd and 22nd min for O-mode pumping during modification.

Figure 5.
Electron density inversion based on ion spectrums.

Figure 6.
Electron density varies with time at the altitude of 322 km (top) and 345 km (bottom), the black curve is calculated by GUISDAP, the dashed black curve is derived from the inversion of the plasma line spectrums.
Figure 6.
Electron density varies with time at the altitude of 322 km (top) and 345 km (bottom), the black curve is calculated by GUISDAP, the dashed black curve is derived from the inversion of the plasma line spectrums.

Publisher’s Note: MDPI stays neutral with regard to jurisdictional claims in published maps and institutional affiliations. |
© 2021 by the authors. Licensee MDPI, Basel, Switzerland. This article is an open access article distributed under the terms and conditions of the Creative Commons Attribution (CC BY) license (https://creativecommons.org/licenses/by/4.0/).
Share and Cite
MDPI and ACS Style
Li, Z.; Li, Q.; Fang, H.; Gong, H. The Apparent Behavior of Electron Density during an Alternating O/X-Mode Heating Experiment. Universe 2021, 7, 274. https://0-doi-org.brum.beds.ac.uk/10.3390/universe7080274
AMA Style
Li Z, Li Q, Fang H, Gong H. The Apparent Behavior of Electron Density during an Alternating O/X-Mode Heating Experiment. Universe. 2021; 7(8):274. https://0-doi-org.brum.beds.ac.uk/10.3390/universe7080274
Chicago/Turabian StyleLi, Zeyun, Qingfeng Li, Hanxian Fang, and Hongwei Gong. 2021. "The Apparent Behavior of Electron Density during an Alternating O/X-Mode Heating Experiment" Universe 7, no. 8: 274. https://0-doi-org.brum.beds.ac.uk/10.3390/universe7080274
Note that from the first issue of 2016, this journal uses article numbers instead of page numbers. See further details here.