
Short-Term Consequences of Asteroid Impacts into the Ocean: A Portuguese Case Study


1
LAETA-AEROG, Universidade da Beira Interior, 6200-358 Covilhã, Portugal
2
ISEC Lisboa, 1750-142 Lisbon, Portugal
3
LAETA-IDMEC, Instituto Superior Técnico, Universidade de Lisboa, 1049-001 Lisbon, Portugal
4
ICT, Escola de Ciências e Tecnologia, Universidade de Évora, 7002-554 Évora, Portugal
*
Author to whom correspondence should be addressed.
Universe 2022, 8(5), 279; https://0-doi-org.brum.beds.ac.uk/10.3390/universe8050279
Submission received: 5 April 2022
/
Revised: 2 May 2022
/
Accepted: 3 May 2022
/
Published: 10 May 2022
(This article belongs to the Special Issue Small Bodies in the Solar System)
Abstract
:Asteroid impacts are a proven global threat, meaning that any location on Earth might be a subject to their consequences. Such collisions are not likely in any person’s lifetime, but their aftermath could be catastrophic. As Earth’s surface is mostly water, a water impact is more probable than a ground impact, and tsunami waves could pose a significant threat. This study expands the knowledge about asteroid impacts in the ocean and their regional environmental consequences. Three asteroids were assumed to impact the Earth: (1) the Apophis asteroid, a 370 m wide asteroid, (2) a 204 m in diameter asteroid representative of the average impactor on the near-Earth objects, and (3) a 5 km in diameter asteroid. We evaluated the consequences of all impacts for a specific case study, where the chosen impact location was the midpoint between Portugal’s mainland, Azores, and Madeira Islands. The cratering process, generated seismic shaking, overpressure, ejected material, induced thermal radiation, and tsunami waves were assessed, along with the global effects. The overpressure mainly causes structural damage. The thermal radiation can be devastating but has a short reach. The tsunami is undoubtedly the most far-reaching and threatening effect of an asteroid impact in the ocean.
1. Introduction
Earth has been the target of asteroid impacts since its creation. Collisions with hazardous asteroids are not frequent, but studying them is still relevant, as they can pose a threat to populations.
The Apophis asteroid was first discovered in 2004 and has an estimated 370 m diameter [1,2]. It is one of the best-known asteroids because the initial observation predicted a high probability of impact in 2029, reaching an unprecedented value of four on the Torino scale [3]. This possibility of impact in 2029 was disregarded with updated observations [4]. However, a future impact in 2036 remained a possibility [5]. Newer observations denied this possibility [6], and the value of 0 was reassigned to Apophis. Based on its orbit and spectral type, Apophis is an Aten and Sq-type asteroid [7]. Aten asteroids have Earth-crossing orbits with a semi-major axis of less than 1.0 AU (astronomical unit) and an aphelion greater than 0.983 AU. Sq asteroids have siliceous mineralogical compositions with the presence of metal. According to observations made, Apophis resembles an LL ordinary chondrite, i.e., a group of stony meteorites, which allowed the estimation of its bulk density as g·cm [8]. A previous study already modelled the impact of Apophis into the ocean and studied its consequences in detail [9].
NASA keeps track of all near-Earth objects (NEOs), asteroids, and comets with perihelion distances of less than 1.3 AU [10]. All these objects were used in assessing the average asteroid diameter that could threaten Earth and its populations. Between 10 March 2020 and 26 November 2200, there are several thousand celestial objects with a close approach nominal distance of less than AU. The average impact velocity and diameter of these objects are km·s and 204 m, respectively. A density value of 3100 kg·m was assigned in [11] as a representative value for an asteroid population.
An asteroid of 5 km in diameter was also predicted to impact the Earth. Collisions of this magnitude only happen approximately once every twenty million years [12]. The asteroid’s density was 2500 kg·m, considering the average value for sedimentary rock [13]. The impact velocity was 15 km·s because this is the threshold for vaporisation to occur that induces thermal radiation, as stated in [14].
Several authors have studied and modelled the impacts of external bodies on Earth. Algorithms to determine the principal impact effects that might affect people, infrastructures, and landscapes in the surroundings of an impact event were already published [14]. These algorithms estimate the asteroid’s atmospheric entry, the thermal radiation emitted, the seismic shock intensity, the impact crater dimensions, the ejecta deposits, and the severity of air blast from airbursts or ground impacts.
The virtual impacts of 315 asteroids included on NASA’s NEO risk list were assessed in [15]. This assessment included the impact location probability distribution. Later, the impact corridors for 261 observed asteroids that could impact the Earth before 2100 were reassessed [16]. Afterwards, the corridors were projected onto the Earth’s map, considering the impact probability distributions. The cumulative impact probability distribution was paired with Earth’s population to produce a risk map to recognise which nations are more prone to danger by an asteroid impact [17,18,19].
A tool to assess the impact risks of hazardous asteroids was developed and published [13]. The software expresses the risk in terms of expected casualties and allows comparisons with other natural phenomena. The authors also derived and presented vulnerability models that associate the severity of impact effects with the human population.
The probability of a water impact on Earth is higher than that of a land impact because the surface of the Earth is 71% water. Thus, most of the past asteroid impacts on Earth must have occurred in marine environments. Water impacts generate two distinct tsunami waves, rim waves and collapse waves, which have little in common with the traditional earthquake-induced tsunami waves. In addition, a water depth of 6–8 times the diameter of a stony asteroid is enough to completely suppress the cratering process in the benthic layer [20].
The main contributions are: (i) development of an analytical method, tested numerically by software, to assess the consequences of an impact event in the ocean; (ii) comparison of the impact consequences of three different sized asteroids; (iii) Portuguese vulnerability case study of independent municipalities.
2. Modelling
We followed a symbolic-numerical calculation to obtain the data for each point of interest while considering several premises to get more direct results. The impact was assumed to happen between mainland Portugal, Madeira, and the Azores, so no additional orbital mechanics calculations were required. The population was not warned about the threat, since it would be impossible to obtain the population vulnerability otherwise. Only direct effects were taken into account, so atmospheric, terrain, and wave reflections were not considered.
The haversine formula was used to obtain the midpoint between Portugal’s mainland, Azores, and Madeira Islands, which determines the great-circle distance between two points on a sphere’s surface. The distance from the impact site to the point of interest was found by (1):
where D is the distance to the impact site, is the radius of the Earth, and are the latitude and longitude, and the coefficients i and k represent the impact location and the point of interest, respectively.
The asteroid’s destructive capabilities are directly related to the impact energy, which is a function of the impact angle and speed. In this analysis, there were two moments of interest. The first was the impact on the water surface, at sea level; the second was the impact with the ocean floor. In [14], we found a simple relation that allowed the estimation of the effect of a water layer on the asteroid’s velocity. The equation computes the impactor’s velocity at the sea floor, , as a function of the impactor’s velocity at the surface, , as:
where and are the water and impactor densities, is the depth of the ocean floor, L is the diameter of the impactor, is the impact angle, and is the drag coefficient for a rigid sphere in the supersonic regime, which was set to 0.887 by the authors.
Using both impact velocities, and , the impact energy at the surface , and consequently at the sea floor , were obtained. The air blast and thermal radiation models assumed that the impact energy responsible for these effects was released at the surface (). On the other hand, the seismic shaking and ejecta deposition originated from solid target impacts. Thus, the impact energy was assumed to be the kinetic energy from the impactor reaching the ocean floor (). These assumptions implied that, for the air blast and thermal radiation models, a ground and water impact of the same impact energy were equivalent. Nevertheless, the presence of a water column could attenuate the seismic shaking intensity and the ejecta released compared to a ground impact scenario.
2.1. Cratering
The crater formation was an intricate process to model because it involves various stages, such as shock wave propagation, excavation of the impact surface, and depression formation, among others [14,21]. To simplify, the process was divided into two stages. First was the formation of a transient crater, i.e., an unstable structure that cannot support itself, and its subsequent gravity-induced collapse; and second was the formation of the final crater. In [14], through the usage of scaling laws and empirical data, analytical relations were developed to express the crater’s dimensions. The same relations were also later presented in [13]. The transient crater diameter is given by:
where and are the densities of the target and the impactor, respectively; L is the impactor’s diameter, is the impact velocity, is the angle of impact, and is the Earth’s standard gravitational acceleration.
For impacts on liquid surfaces, the scalar 1.161 had to be changed to 1.365 (3). In terms of final crater diameter, the threshold between simple and complex craters was at 3.2 km. For simple craters, the final crater diameter, from rim to rim, was given by:
For complex craters, when the transient crater was greater than 2.56 km, the following expression [14] was used to obtain the final crater diameter instead:
where was the threshold diameter between a simple and a complex crater. The depth for the transient crater in relation the original ground plane was given by:
The depth of the complex final crater, defined in [22], was expressed as:
For the simple crater, the depth was simply:
where and were, respectively, the rim height and the thickness of the breccia lens obtained by:
Finally, the volume of the transient crater was:
2.2. Seismic Shock
An asteroid impact event can create a seismic shock associated with the impactor’s kinetic energy [23,24]. The Gutenberg–Richter magnitude energy relation, referenced in [14] and later in [13], provides the seismic magnitude of an impactor as a function of its kinetic energy:
where E is the kinetic energy in Joules, and M is the seismic magnitude on the Richter scale. The seismic intensity decayes over the travelled distance. The effective magnitude of the seismic shock in a specific location, at a distance D from the epicentre, was expressed in [14] and later in [13] as:
2.3. Air Blast
Like explosions, a widely studied field, asteroid impacts create shock waves that increase the atmospheric pressure at the vanguard [14,25]. The yield scaling distance that experiences the same peak overpressure as results from the explosion of 1 kt of TNT (trinitrotoluene, J) can be found. The yield scaled distance is expressed as:
where D is the distance from the impact site and is the yield energy in kilotons TNT. The decay of the peak overpressure in as a function of the yield scaled distance can be obtained by:
for which the values and were 75,000 Pa and 290 m, respectively, [14].
2.4. Thermal Radiation
In the surroundings of an impact site, a collision event drastically raises the temperature and pressure [14,26,27]. A method that evaluates and computes the thermal energy emanating from an impact event was presented in [13,14]. For impact velocities higher than 12 km/s, the shock pressure could melt the impactor and some target material; vaporisation occurs for velocities higher than 15 km/s. The vapour generated, named a fireball, has very high pressure and temperatures, and it expands rapidly. This thermal radiation model neglects the effects of atmospheric conditions and the variation in atmospheric absorption with altitude above the horizon. The empirical relation between the radius of the fireball in meters and the impact energy E in Joules is given by:
Thermal radiation is only a fraction of the kinetic energy released during an impact. This fraction, the luminous efficiency , for asteroid impacts with Earth is in the range of , a range found through limited experimental and numerical results in [14]. The thermal energy per area unit was given by:
where f was the fraction of a fireball visible over the horizon at distance D, obtained by:
In (18), h was the maximum height of the fireball below the horizon at a distance D, and it was defined by:
where was the angle defined by:
2.5. Ejecta Material
The ejection of material from the impact site is one of the consequences of a solid ground collision. This ejected material, named ejecta, could endanger populations if landing directly in civilised areas: when a blanket of dense particles that covers the surroundings is formed; or when infrastructure is damaged, such as buildings or bridges, to the point of collapse by deposition; or by direct collision. In [14], analytical equations were deduced to estimate the mean ejecta fragment diameter and the ejecta blanket thickness that were later exposed in [13]. The mean ejecta fragment diameter , in meters, could be given, as a function of the final crater diameter and distance D, by:
The ejecta blanket thickness as a function of the transient crater diameter and the distance D is then:
2.6. Tsunami
An asteroid impacting water generates a circular wave pattern, like a droplet impacting a liquid film. The event causes the formation of two waves: rim waves and collapse waves. These waves could reach tremendous heights, hit inhabited coastal regions, and wreak havoc. The assessment was divided into two stages: the deep-water wave amplitude propagation and the wave run-up in shallow waters. The wave amplitude attenuation models estimated the evolution of the maximum wave amplitude in waters deeper than 800 m, where the benthic floor depth was assumed to remain constant and equal to the impact location. In shallow waters, given the wave amplitude at the threshold point, the model estimated the run-up evolution until the coast, where a positive constant slope for the ocean floor was assumed.
2.6.1. Rim Wave
The initial asteroid impact on the ocean surface would radially displace the water to create the transient surface crater. This displacement originated the wave perturbation that eventually developed into the first tsunami wave in the model, the rim wave. In [22], a propagation model was developed for the rim-wave amplitude. The models presented a wave decay with radial distance, which agreed with oceanic impact simulations [20]. The maximum rim-wave amplitude was:
The rim-wave amplitude at a distance D from the impact location was:
2.6.2. Collapse Waves
The second type of wave is a product of the surface transient crater collapse. The impact-induced surface transient crater is filled by the adjacent ocean through centripetal inflow. The radial inflow creates a water peak at the centre of the then-collapsing crater that would continue to oscillate radially in and out until all energy is dissipated. Each oscillation generates a collapse wave. In the present model, the formation of the collapse wave is assumed to be unique and unrepeatable. In [22], a model to predict the collapse wave amplitude decay over the distance was defined. The maximum collapse wave amplitude was given by:
The collapse wave amplitude decay as a function of the distance D was defined as:
where q was the attenuation factor, defined as:
2.6.3. Run-Up
The wave run-up U is the maximum height the wave can reach, i.e., the maximum vertical extent of a wave, given the slope s of the coastal region. In [13], a simple analytical model was developed to assess the run-up estimation U, which uses the following expression for its computation:
where is the wave’s amplitude when it reaches shallow water, defined as being depths less than 800 m. The shore slope s is simply defined by the commonly known rise over run formula:
where is the distance from the 800 m depth point to the location, is per definition −800 m, and is the location’s altitude.
For every location, the maximum and minimum slopes were obtained by inserting the maximum and minimum altitude in (29). With these two new variables, the maximum run-up and the minimum run-up were computed. However, even if the slope considers the elevation of the location, the run-up is in relation to the sea level. Thus, a local run-up was assessed in which the minimum altitude of the location was:
This local run-up could be defined as the run-up resulting in the maximum local run-up, or on the other hand, in the minimum run-up.
2.7. Global Effects
In [14], a simple way to assess the global effect was presented: computing the linear and angular momentum ratios between the Earth and the impactor, and the volume ratio of the transient crater diameter and the Earth’s volume.
The linear momentum of the impactor could be obtained by relating its mass and its impact velocity :
Earth’s linear momentum was obtained in a similar way while assuming its mass as kg and its mean orbital velocity as = 29,780 m·s. The angular momentum of the impactor was obtained by:
The Earth’s angular momentum was assumed to be = 5.86 × 10 kg·m·s. The volume of the Earth was obtained assuming a 6371 km radius sphere. Depending on the three ratios mentioned, the qualitative global implications of the impact could be observed in Table 1.
The variation in the Earth’s rotation period can be obtained using the asteroid’s mass , velocity , and impact angle ; and Earth’s radius , mass , and rotation period [22]:
2.8. Vulnerability
The vulnerability models we used estimate the ratio of the population lethally harmed by an asteroid impact. Vulnerability is intrinsically related to the severity of the impact effects, which is a function of the distance. Our models did not consider the time of day in which the impact event occurs. They did not consider the terrain orography, the meteorological conditions, or the wind’s direction. The populations were also assumed to have no previous warning about the threat. They were also independent of one another; i.e., the total vulnerability of a given location was not the sum of every individual effect’s vulnerabilities.
2.8.1. Seismic Shaking
To properly relate the seismic shaking intensity with the mortality rate in [28], a literature review was conducted to collect relevant data and deduce a seismic shaking vulnerability model. The variability in the vulnerability dataset was ample, allowing the establishment of best, worst, and expected scenarios. The equation relates the seismic magnitude on the Richter scale, of a given place, with the population’s vulnerability to that event. The equation representing the three cases is:
where a and b are coefficients defined in Table 2 for each one of the three cases: best, expected, and worst-case scenarios. All vulnerability models are represented graphically in Figure 1a.
2.8.2. Overpressure
High internal–external body pressure differentials endanger people. To extrapolate the vulnerability models, data that provided information about non-lethal, half-lethal, and entirely lethal pressure differentials were utilised [28]. With the bounding pressure values for each measure, best, worst, and expected pressure vulnerability models were developed. However, these did not consider the damage done to infrastructure and its potential effect on the population. In Figure 1b, the vulnerability cases and the data are presented. The vulnerability models as logistic functions were as follows:
2.8.3. Thermal Radiation
Thermal radiation could burn or ignite a surface that it encounters. This can include the skin, and therefore, thermal radiation could be fatal. In [28], different kinds of relevant data were assembled to develop a thermal radiation vulnerability model. These data included the skin burn probability, the burn degree distribution as a function of the radiation exposure, and the mortality rates of treated and untreated burn victims as functions of burnt total body surface area. To obtain the mortality rate as a function of radiant exposure, the authors also considered that clothes offer some protection and that only one side of a person was exposed to radiation. Finally, to develop the different cases’ vulnerability models, the authors considered the global unsheltered population at any given moment. For the best-case scenario, all the population was sheltered, but 25% were affected via windows. For the expected case, the authors assumed an unsheltered population of 47%. In the worst-case scenario, all the population was assumed to be exposed. The vulnerability model was given by:
Table 4 presents the respective coefficients.
Figure 1c shows all three thermal exposure vulnerability models, the best, expected, and worst-case scenarios.
2.8.4. Ejecta Blanket Deposition
The ejected material from the cratering process threatens the populations because its deposition could lead to the collapse of buildings because of the ejecta blanket weight load. The ejecta could also bludgeon individuals and cause fatalities. Nonetheless, the vulnerability model only included the former peril. A model that related the ejecta blanket thickness and its vulnerability was developed in [28]. The authors assumed a mean ejecta material density of 1600 kg·m to assess the load of the ejecta blanket, given by:
The authors also assumed that 78% of the affected population was indoors. Furthermore, 20% of occupants of a given house would be trapped inside, given a collapse, and 50% of those trapped would be killed. In a roof collapse event, the maximum population vulnerability was . The likelihood of this event was modelled considering the ejecta load and the building’s strength. Therefore, the best, expected, and worst-case scenarios derive from different building strengths. The sigmoid obtained through the preceding approaches is:
where the ejecta load is in . In turn, the coefficients a, b, and c varied depending on the scenario presented in Table 5. Figure 1d represents all three vulnerability cases.
2.8.5. Tsunami
A large body of water in a waveform could be devastating when hitting an inhabited coastal region. The aftermath of a tsunami is no easy task to assess because its high complexity and dependence on various external factors. In [28], a simple analytical approach was developed to analyse a tsunami wave and its subsequent fatalities. The tsunami vulnerability was obtained as a function of the local run-up , which varied according to the scenario, Table 6. The relation was:
3. Results and Discussion
Using three sets of coordinates to represent mainland Portugal, Azores, and Madeira, the midpoint or impact location had latitude and longitude of N and W, respectively. The impact effects depend heavily on the distance travelled by the impact effect. Thus, utilising single points to represent mainland Portugal, the Azores, and Madeira Islands is highly inaccurate. Therefore, the impact effects assessment was performed for all 308 Portuguese municipalities, considering each distance to the impact site. However, to not over-complicate the exposition, the intensity of the impact effects is only shown for the closest point to the impact site on each of mainland Portugal, Azores, and Madeira. The casualties represent the individual municipality casualties’ sums; e.g., the pressure casualties attributed to Portugal represent the pressure casualties of all Portuguese municipalities on the continent. The points that represent groups in the three territories correspond to the Portuguese municipalities of Peniche for mainland Portugal, Nordeste for Azores island, and Porto Santo for Madeira island. Table 7 displays the physical data of the asteroids.
3.1. Cratering
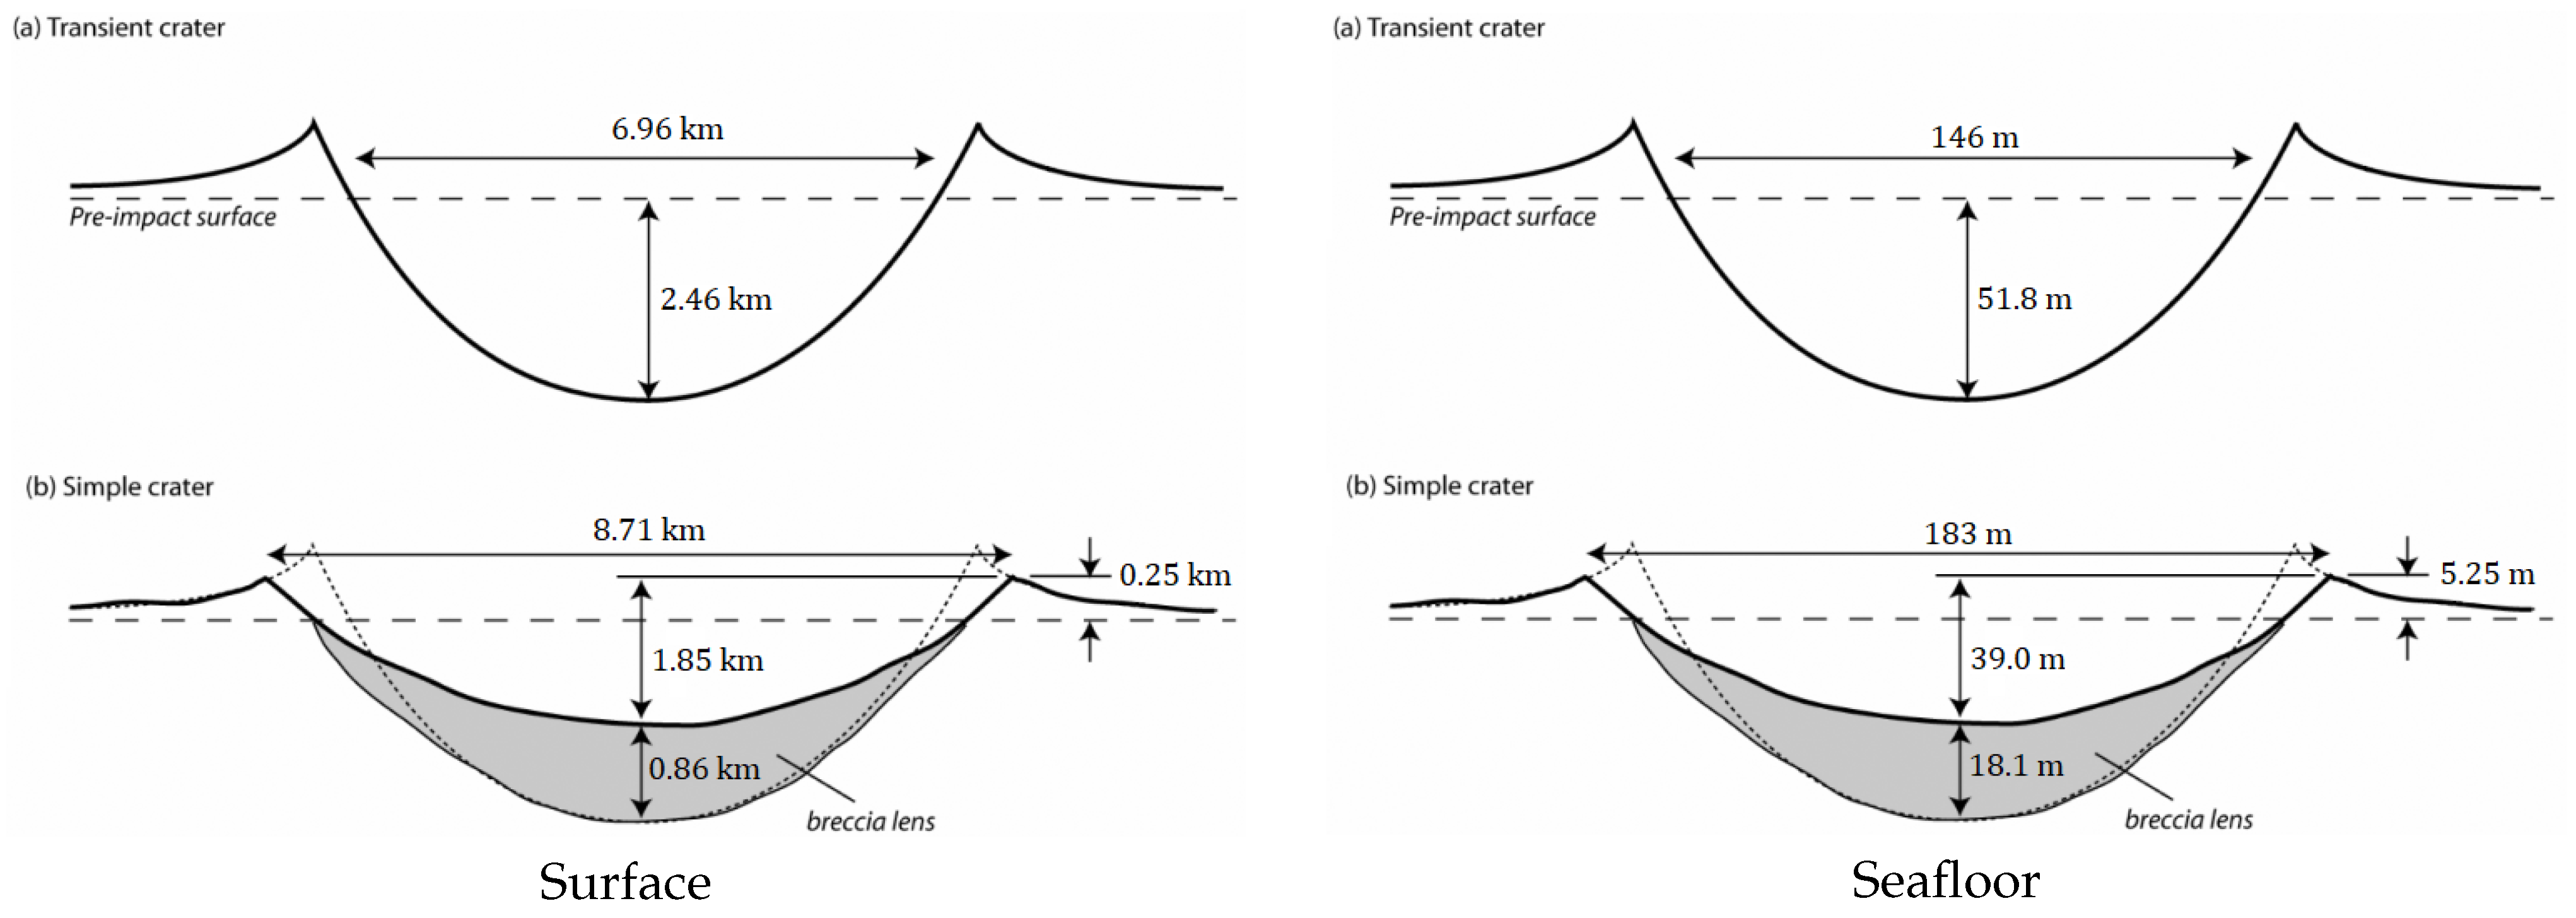
The crater dimensions of all impacts with the ocean surface and ocean seafloor were obtained via Equations (3)–(11) for the three asteroids, rather than modelling. Both surface and sea floor final craters created by Apophis are simple. The respective theoretical visual representations can be seen in Figure 2, Figure 3 and Figure 4.
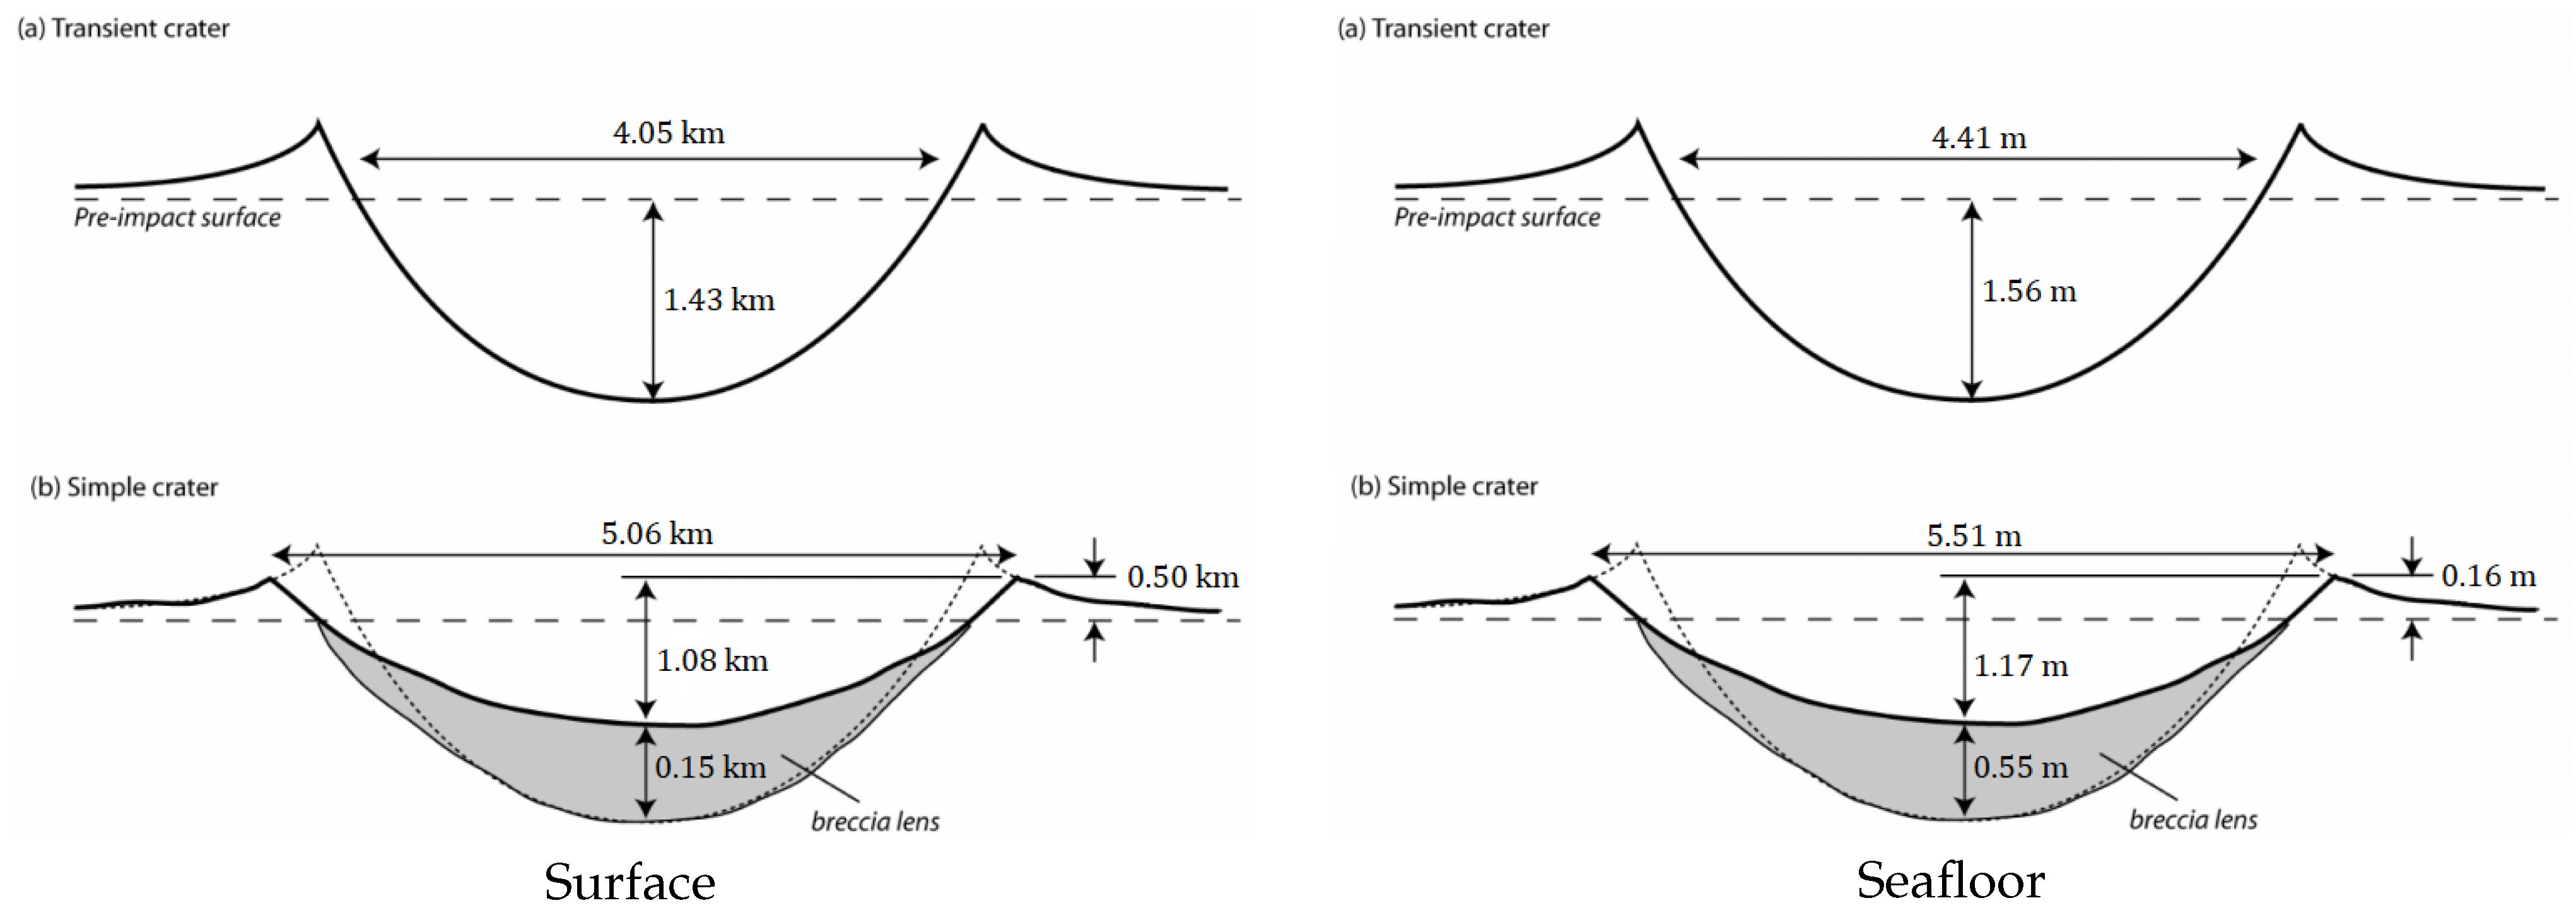
The impact velocity on the sea floor is attenuated about eight orders of magnitude because of the presence of the water layer, rendering the final impact velocity on the benthic layer negligible. Despite this, the dimensions of both surface and sea floor medium-asteroid-generated craters can be seen visually in Figure 3.
The 5 km asteroid’s transient crater penetrates the ocean km deep. The almost one-to-one relationship between the diameter and ocean depth suggests that the water layer is not a significant factor in attenuating the impact. With a ratio of between the depth and diameter, the impact corresponds to a shallow water impact [20]. In shallow waters, some authors consider the formation of a single crater on the sea floor because of the minor difference between the water depth and the asteroid’s diameter [20]. However, in this paper, the formation of both theoretical craters is considered. In Figure 4, said craters’ dimensions can be seen.
The 5 km impactor’s transient crater spans a massive km from rim to rim, alluding to the potential damage to the landscape and population if such an impact occurs in a densely populated area. The crater’s depth is three times the ocean’s depth, which is impossible without benthic strata excavation, which refers to its theoretical nature.
3.2. Seismic Shaking
The absolute magnitude M in (12), the Richter magnitude value at the epicentre, is a direct function of the impact energy E. The effective magnitude , Equation (13), is the Richter magnitude value attenuated by the distance D to the epicentre, in this case, the impact site.
The seismic shaking caused by the Apophis impact has an absolute magnitude of on the Richter scale. The impact velocity on the sea floor is reduced by four orders of magnitude, compared to the surface impact velocity, because of the presence of the water layer, which significantly decreases the impact energy and the seismic shaking magnitude. Table 8 lists the distance D and the effective magnitude of the seismic shaking for three Portuguese locations. Figure 5a graphically represents the effective magnitude for all studied municipalities as a function of the impact site distance D. The seismic shaking model allows for negative values. The negative values have no physical representations. They merely mean that the effect does not reach that location.
The impact of the medium asteroid into the ocean floor would induce a seismic shaking of magnitude . This value is purely theoretical and means that the collision does not create a seismic wave. The non-existing seismic wave, because of the asteroid reaching the sea floor at such a low velocity, corroborates the possibility of disregarding the ocean floor impact completely. Nevertheless, Table 8 displays the effective magnitudes for the three locations, and Figure 5a for all municipalities.
The 5 km impactor’s sea floor impact generates a seismic shaking of on the Richter scale. This event can be loosely compared to the Lisbon earthquake of 1755 in terms of absolute magnitude, even though the distance between mainland Portugal and the epicentral point was roughly 300 km, less than half the distance D between mainland Portugal and the impact location. Distance plays a huge role in attenuating the seismic waves. As can be seen in Table 8 and in Figure 5a, most municipalities would experience an effective magnitude of around , less than half the absolute value. By consulting the Abbreviated Modified Mercalli Intensity scale [14], we can convert these average magnitudes into qualitative terms. In the Mercalli scale, the correspondent intensities are III and IV.
3.3. Overpressure
The overpressure values from the impact-induced shock wave were obtained with (15). The distance in (14) is the distance to a 1 MT TNT equivalent explosion that experiences the same overpressure effects as the distance D from impact energy E. Both the distance and the pressure , for each impact scenario, are shown in Table 8. Figure 5b displays the overpressure as a function of the distance D for the three asteroids.
The Apophis-induced pressure values are in the high hundreds/low thousands, only potentially shattering windows, which requires kPa. In the medium-asteroid scenario, the overpressure values lie in the mid-hundreds range, not even allowing them to destroy windows.
For the 5 km impactor, the pressure results for all studied municipalities are naturally higher. Despite the results being in the several hundreds of pascals, the pressure difference would be felt, but not with significant consequences to the population directly. Most locations would experience the shattering of glass windows ( kPa), the roofs would be severely damaged ( kPa), and wood-framed buildings would almost collapse completely ( kPa). In the most affected locations, multi-story wall-bearing buildings would experience severe cracking, and interior partitions could be blown down ( kPa) [14].
3.4. Thermal Radiation
The thermal radiation assessment demands the estimation of the fireball generated, obtained with (16). Any other energy transfer method, such as atmospheric reflection, was dismissed. Two fractions related to the percentile of exposure of any location, because to the curvature of the Earth, needed to be estimated to determine the radiation that reaches a given municipality. The first was the ratio between the maximum fireball height below the horizon and the fireball radius . The second one was the fraction of visible fireball over the horizon f, defined in (18). Both are intrinsically related: if , then , and the municipality is completely shielded from direct exposure; if , then , meaning the location is exposed to thermal radiation, but has some protection; if , then , and the location is completely exposed, making Earth’s curvature irrelevant. The luminous efficiency needs to be defined to complete the assessment and estimate the thermal radiation per location. This value is the fraction of kinetic energy converted into thermal radiation. We set the upper and lower thermal radiation limits to and in the present work.
In Table 8, we can see the ratio of the maximum fireball height below the horizon to the radius of the fireball , and the high and low thermal radiation bounds , for the Portuguese territory. For the impact scenarios of Apophis and the medium asteroid, rows 1 and 2, respectively, all the values surpass unity. The locations are shielded from direct exposure, thereby not experiencing thermal radiation. Since every location has a zero joule per square metre thermal exposure, the vulnerabilities and casualties associated with this impact effect are also zero.
For the 5 km impactor scenario, row 3, the difference between upper and lower thermal radiation is two complete orders of magnitude for any studied municipality. The difference is related to the luminous efficiency, as the limits of the fraction also vary by two orders of magnitude. Figure 5e visually represents the upper and lower thermal radiation. From a distance of km onwards, no thermal radiation is experienced. For any municipality with a higher distance value, the fraction is more than one, and all subsequent values are zero.
Given the thermal radiation values for any given location, the qualitative impact effects can be estimated by comparison with the ignition factors of various materials. Assuming the highest thermal radiation possible, mainland Portugal and the Azores would experience the burning of clothes, plywood, grass, newspaper, and deciduous trees, and third-degree burns; see Table 1 from reference [14]. The Madeira Islands would experience the burning of grass, newspapers, and deciduous trees, while the population would experience second-degree burns. Assuming the lower thermal radiation , the population would not experience first degree burns, and no materials would ignite.
3.5. Ejecta
The material ejected from the crater is simpler to assess. Both the mean ejecta fragment diameter and the ejecta blanket thickness can be obtained by the direct relations presented in (21) and (22), respectively. The ejecta vulnerability assessment uses the ejecta blanket thickness , which, according to Figure 1d, should be in the centimetre range to have an impact on the population. In Table 9, both variables are shown for the three simulated impacts. In Figure 5c,d these values are represented visually for all studied municipalities.
For the Apophis impact, the ejected material from the collision site, either the mean diameter of ejecta fragments or the ejecta blanket deposition , would not be significant in size. The former would be in the range of micrometres and the latter in picometres. These values are too small to be perceived by the population and are likely to not cause any concerning damage, resulting in values of vulnerability and casualties of zero.
For the medium-asteroid scenario, the ranges of the mean ejecta fragment diameter and the ejecta blanket thickness are in nanometres and attometres. Therefore, the vulnerabilities and casualties would most likely be zero.
For the 5 km impactor, the mean ejecta fragment diameter and the ejecta blanket thickness would be in the millimetre range, making the matter perceivable by the population. The model did not assess the upper limit of mean ejecta fragment diameter, and larger chunks could still harm the population.
3.6. Tsunami
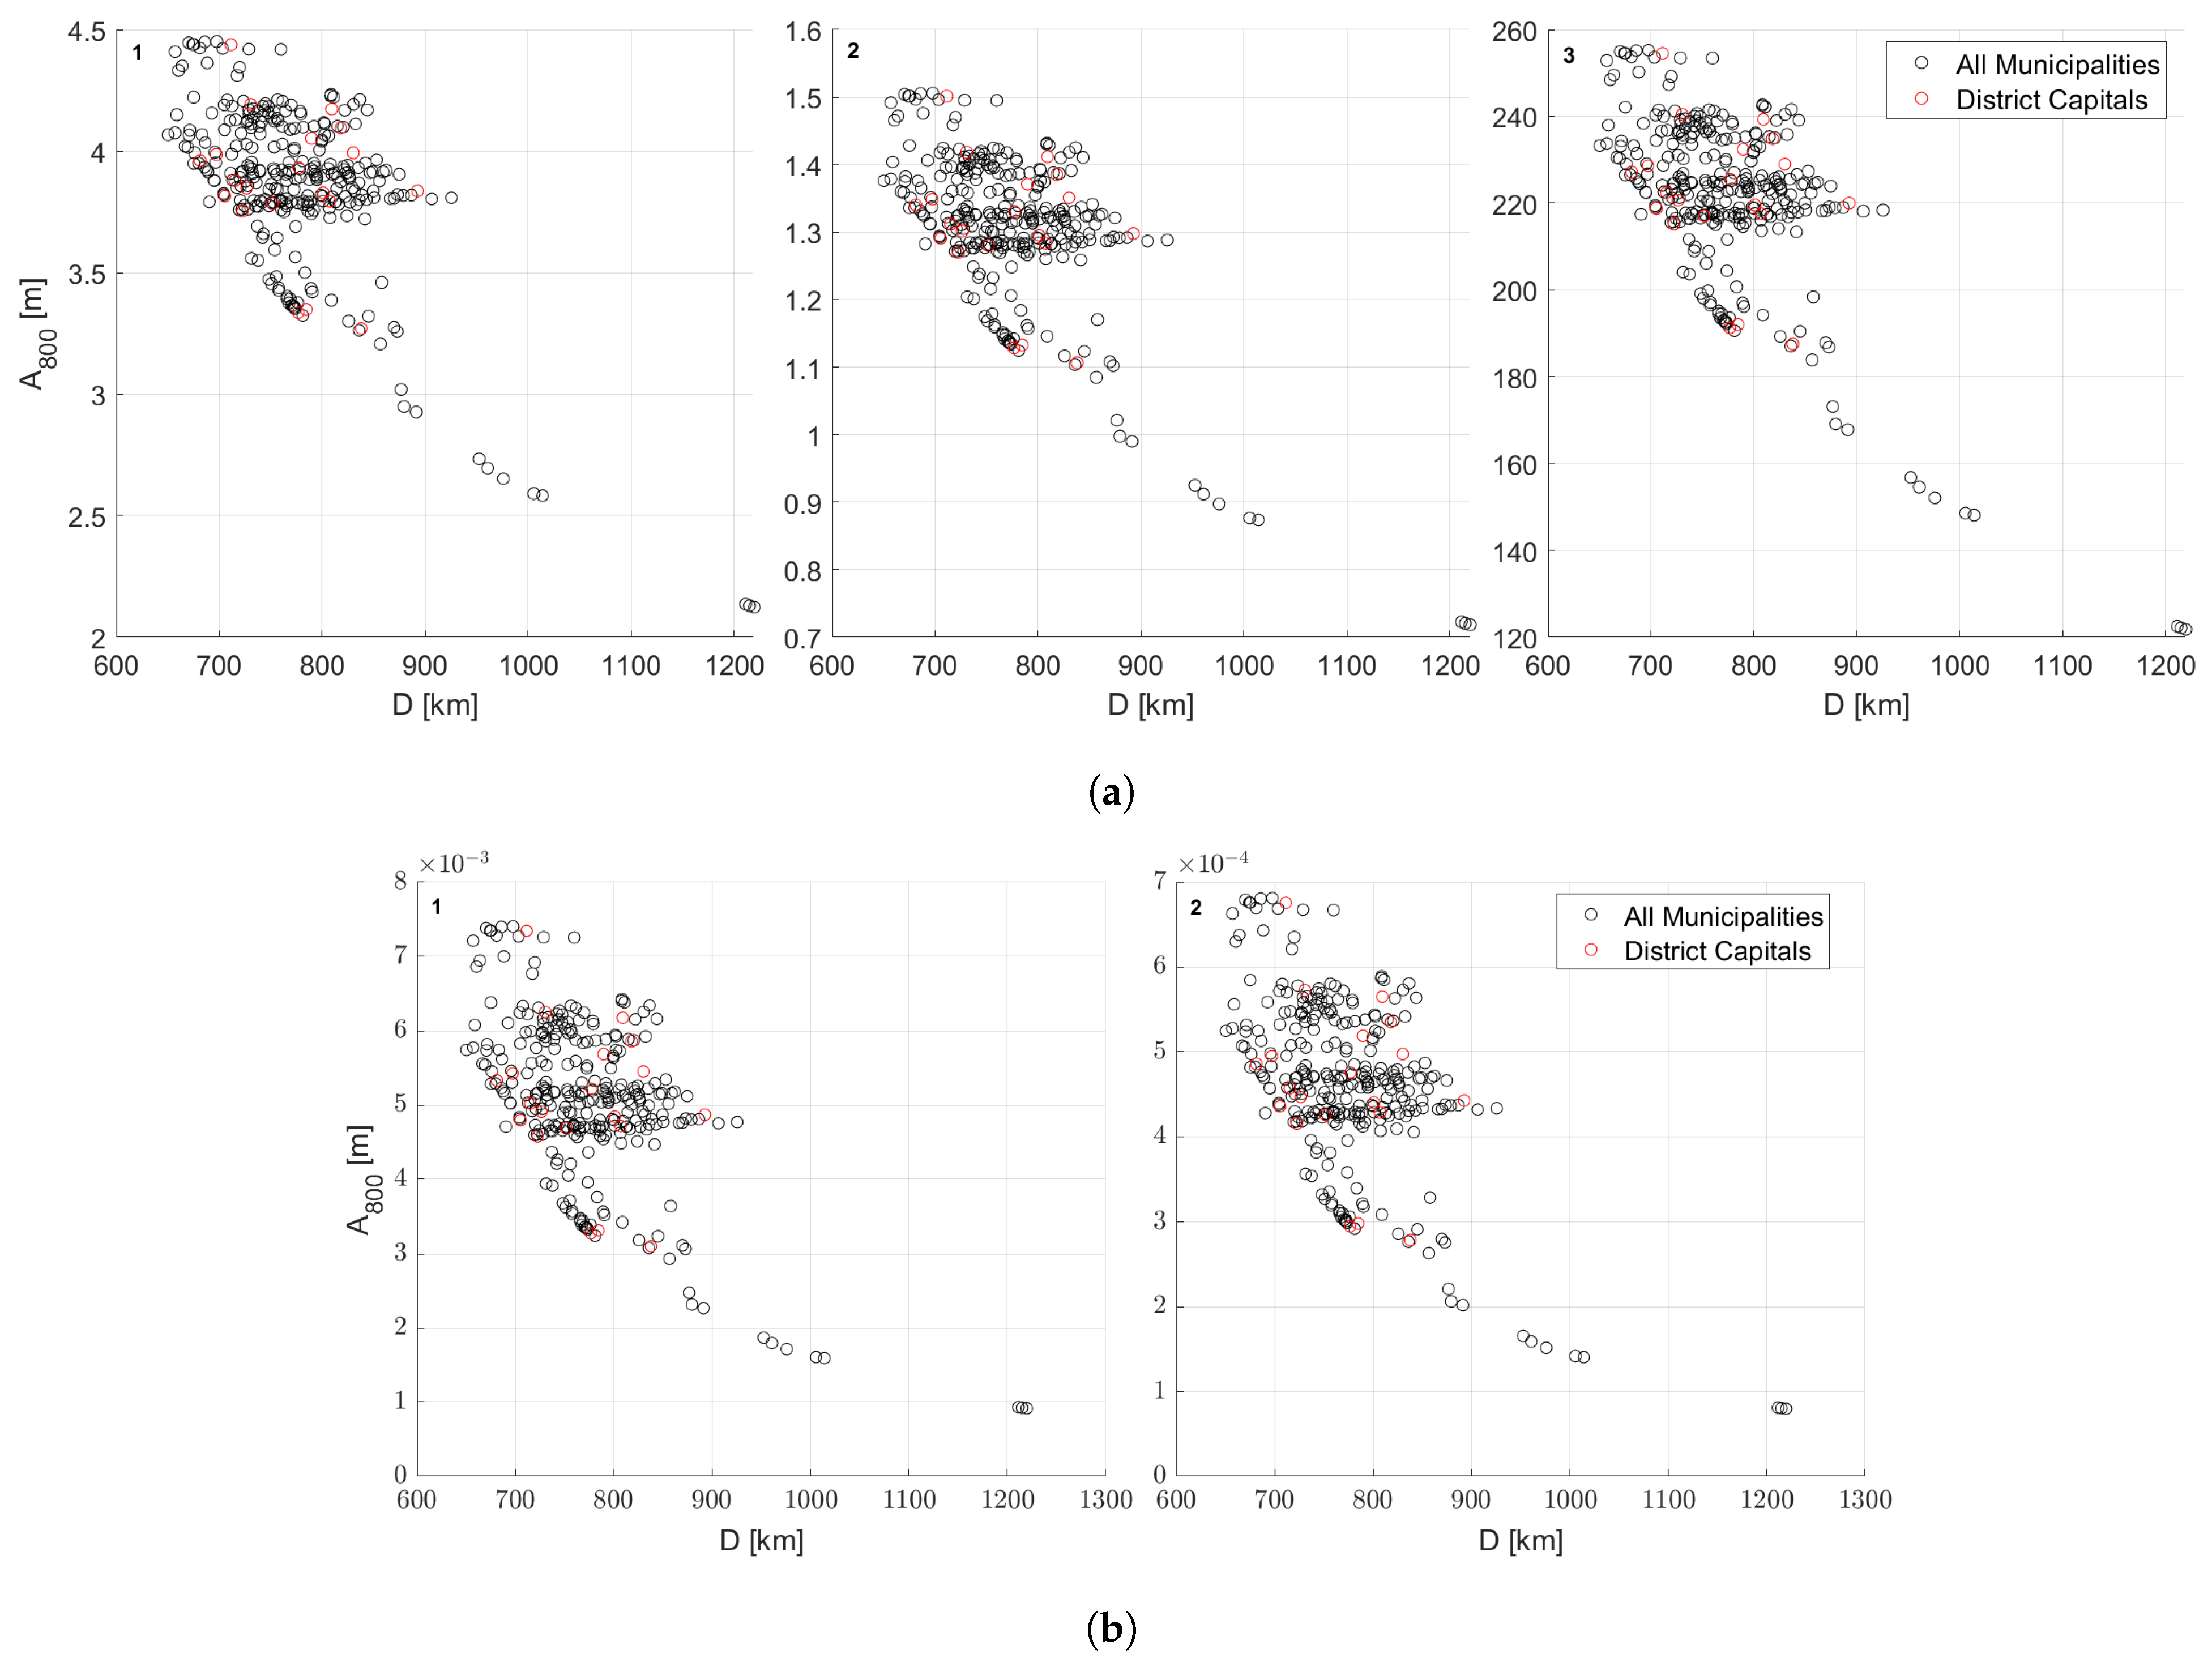
The ocean depth at the impact location is km. Thus, the ratio defines Apophis and the medium asteroid’s impacts as deep-water impacts, and the tsunami wave analysis consisted of two wave amplitude decay methods: one rim-wave amplitude method and one collapse wave amplitude method (Figure 6).
The 5 km impactor collision event is considered a shallow-water impact because of the asteroid diameter to ocean depth ratio . For such scenarios, a collapse wave would not form, and the only tsunami threat would be the creation and propagation of the rim wave [20]. Therefore, the tsunami assessment disregarded the formation of the collapse wave.
The wave amplitude propagation method disregards the ocean bathymetry, despite its relevance. The threshold between shallow and deep waters lies at the 800-m depth point, giving it extra significance [13]. Since the waters near the coast are less than 800 m deep and considered shallow, the amplitude method is not valid. Therefore, the authors developed a run-up wave computation method to properly assess the evolution of the waves near the coast and their final journey to the coastline. Figure 6 represents the tsunami waves amplitude at the threshold point obtained through (24) and (26).
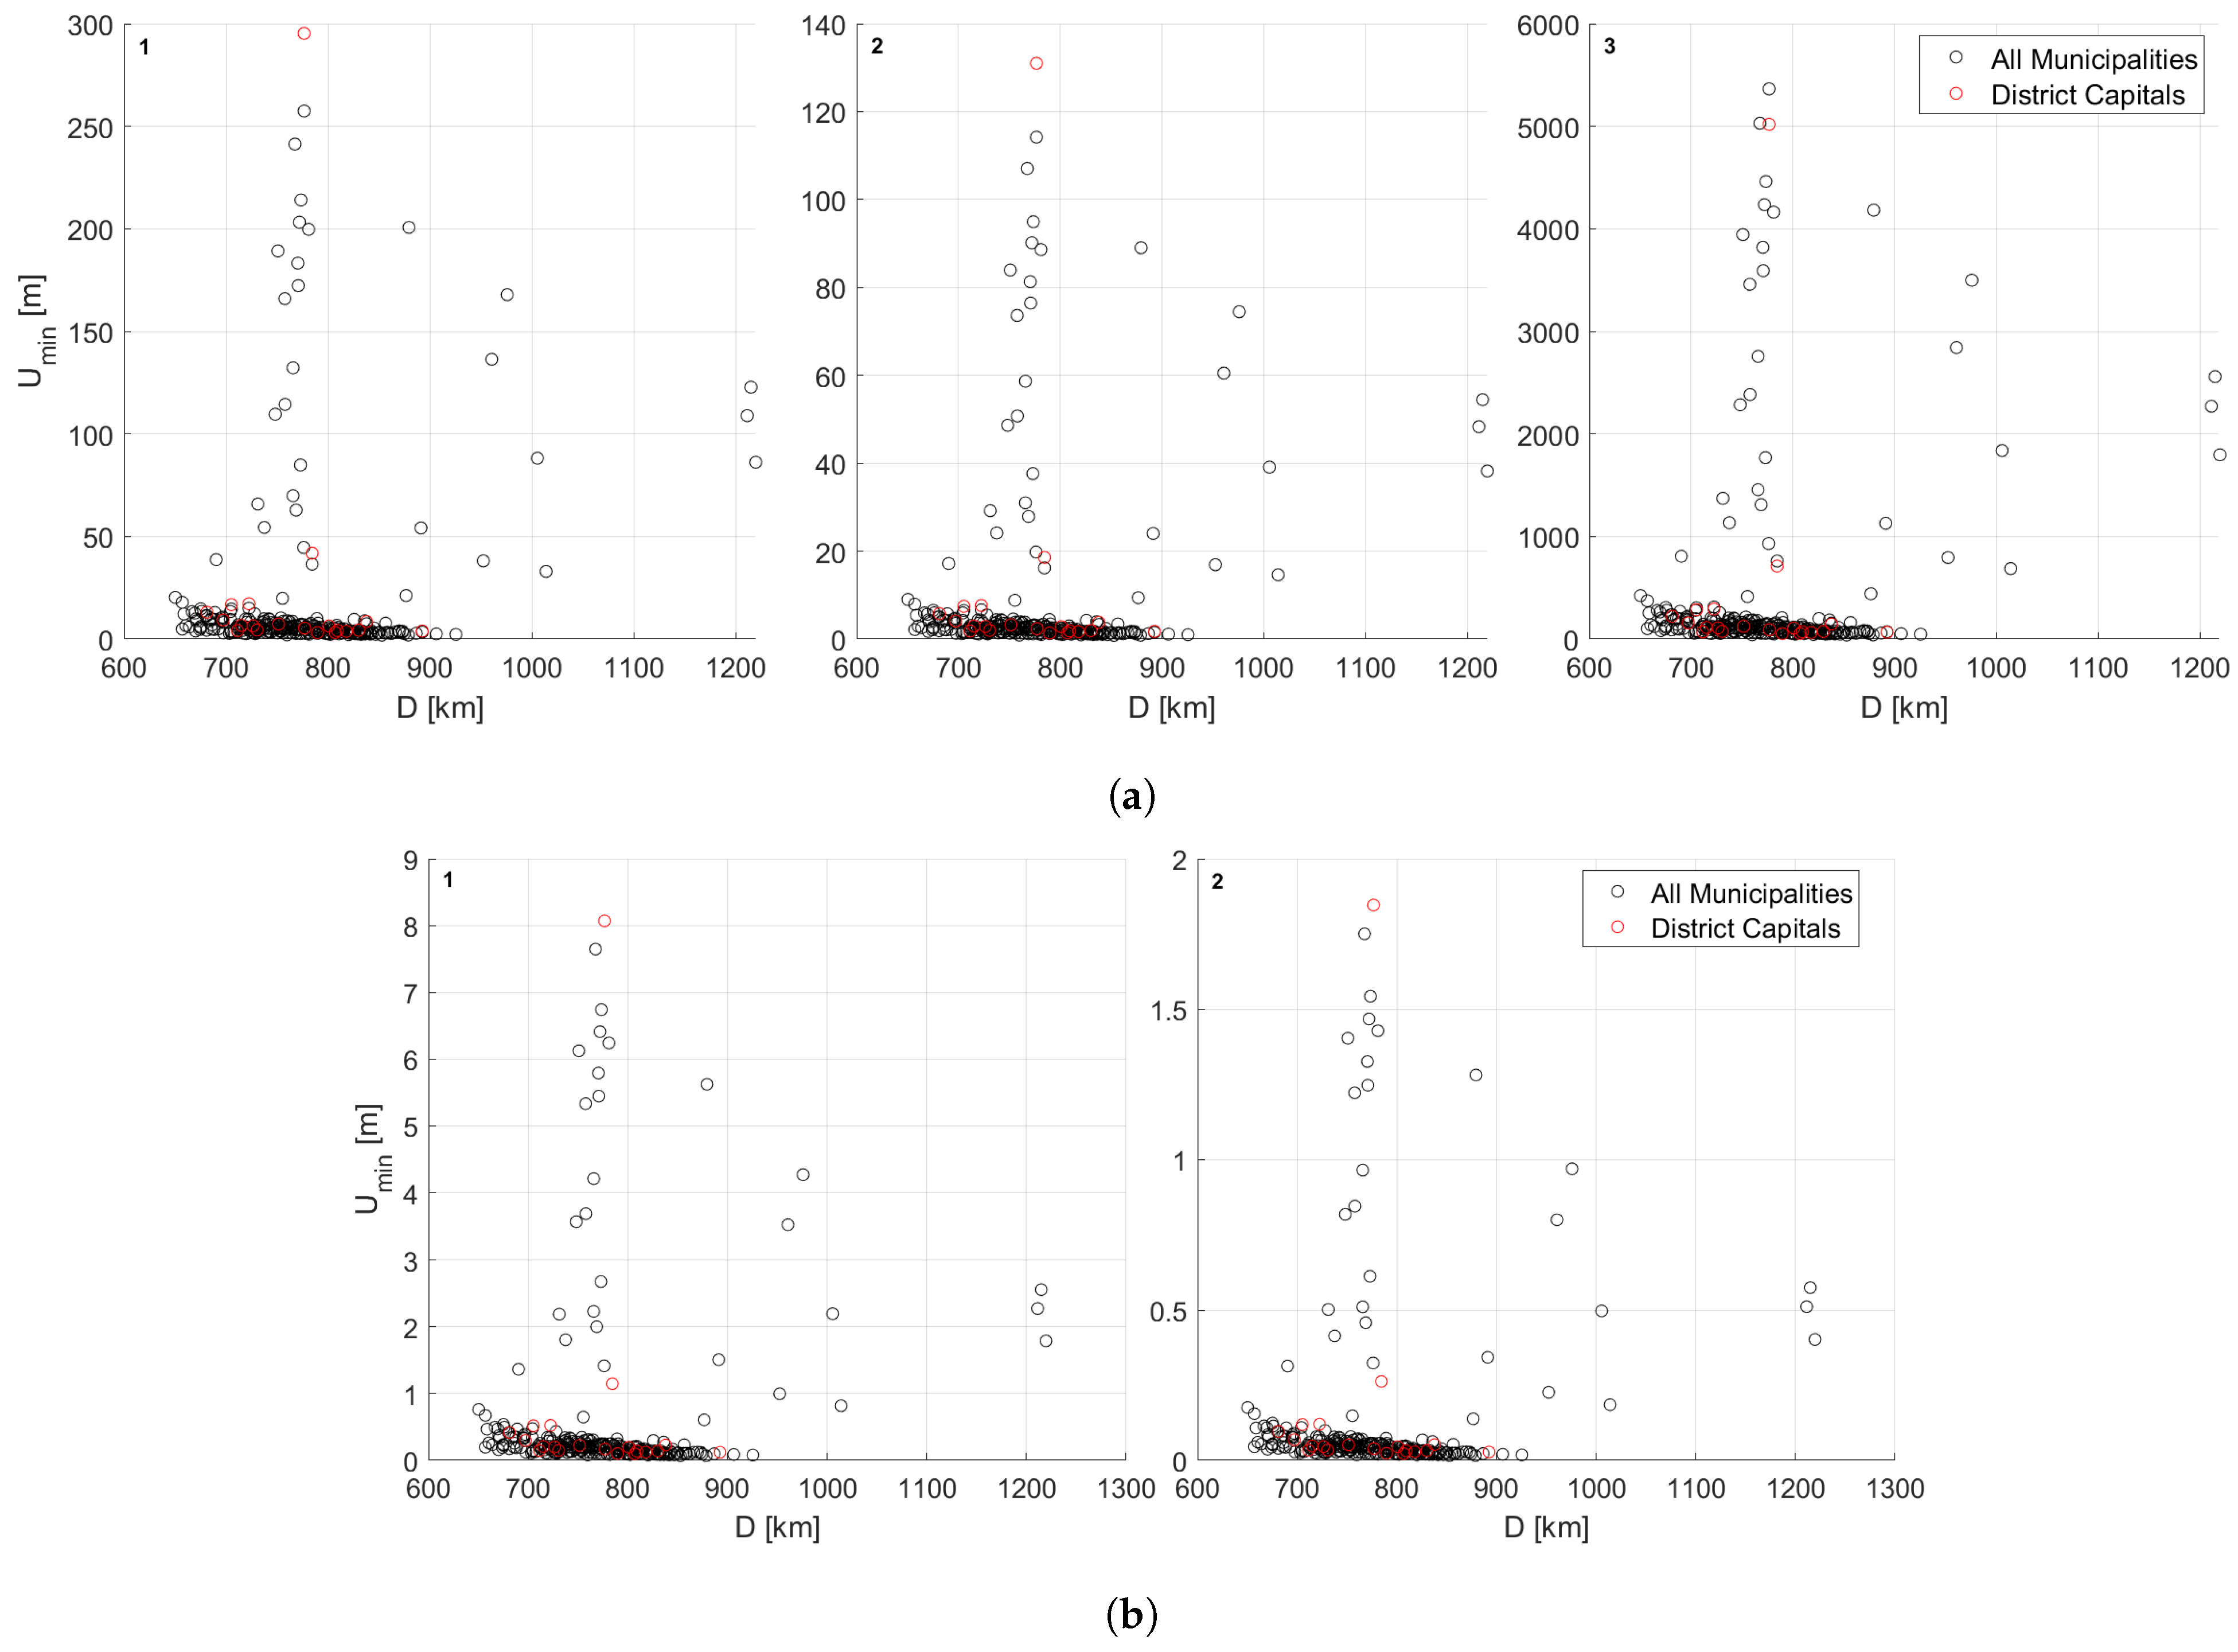
The principal variable in the tsunami hazard assessment is the run-up wave at the coastline. Thus, the paramount concern of the estimation is the wave behaviour in shallow water. To assess the run-up wave height, i.e., the height the wave can reach inland, the wave amplitude at the 800-m point and the distance from this point to the shore are needed. The value obtained with (28) cannot be directly used in the vulnerability models, as it assumes the location in question is at sea level. Since most of the studied municipalities are not coastal, a local run-up was calculated considering the maximum and minimum altitude. PORDATA, a contemporary Portugal geography database [29], provided the needed altitudes. The EDMOnet grid, which presents a detailed bathymetry profile of the European seas [30], supplied the values.
In Table 10, the most relevant values for the tsunami assessment are displayed. Row 1 represents the Apophis impact scenario, and rows 2 and 3 represent the medium-asteroid scenario and the 5 km impactor scenario, respectively. The amplitude at the deep–shallow water threshold, along with the corresponding minimum and maximum run-up, are presented for both waves. For rim-wave assessment, the amplitude values entail few disparities. The values only diverge in the run-up assessment. From this observation, the impact energy dictates the absolute nature of the values considered: amplitude and run-up, and the different slopes dictate the run-up fluctuation. The Azores and Madeira Islands present higher run-up values, possibly resulting from their volcanic nature and the reduced continental shelf that protects the coast of mainland Portugal.
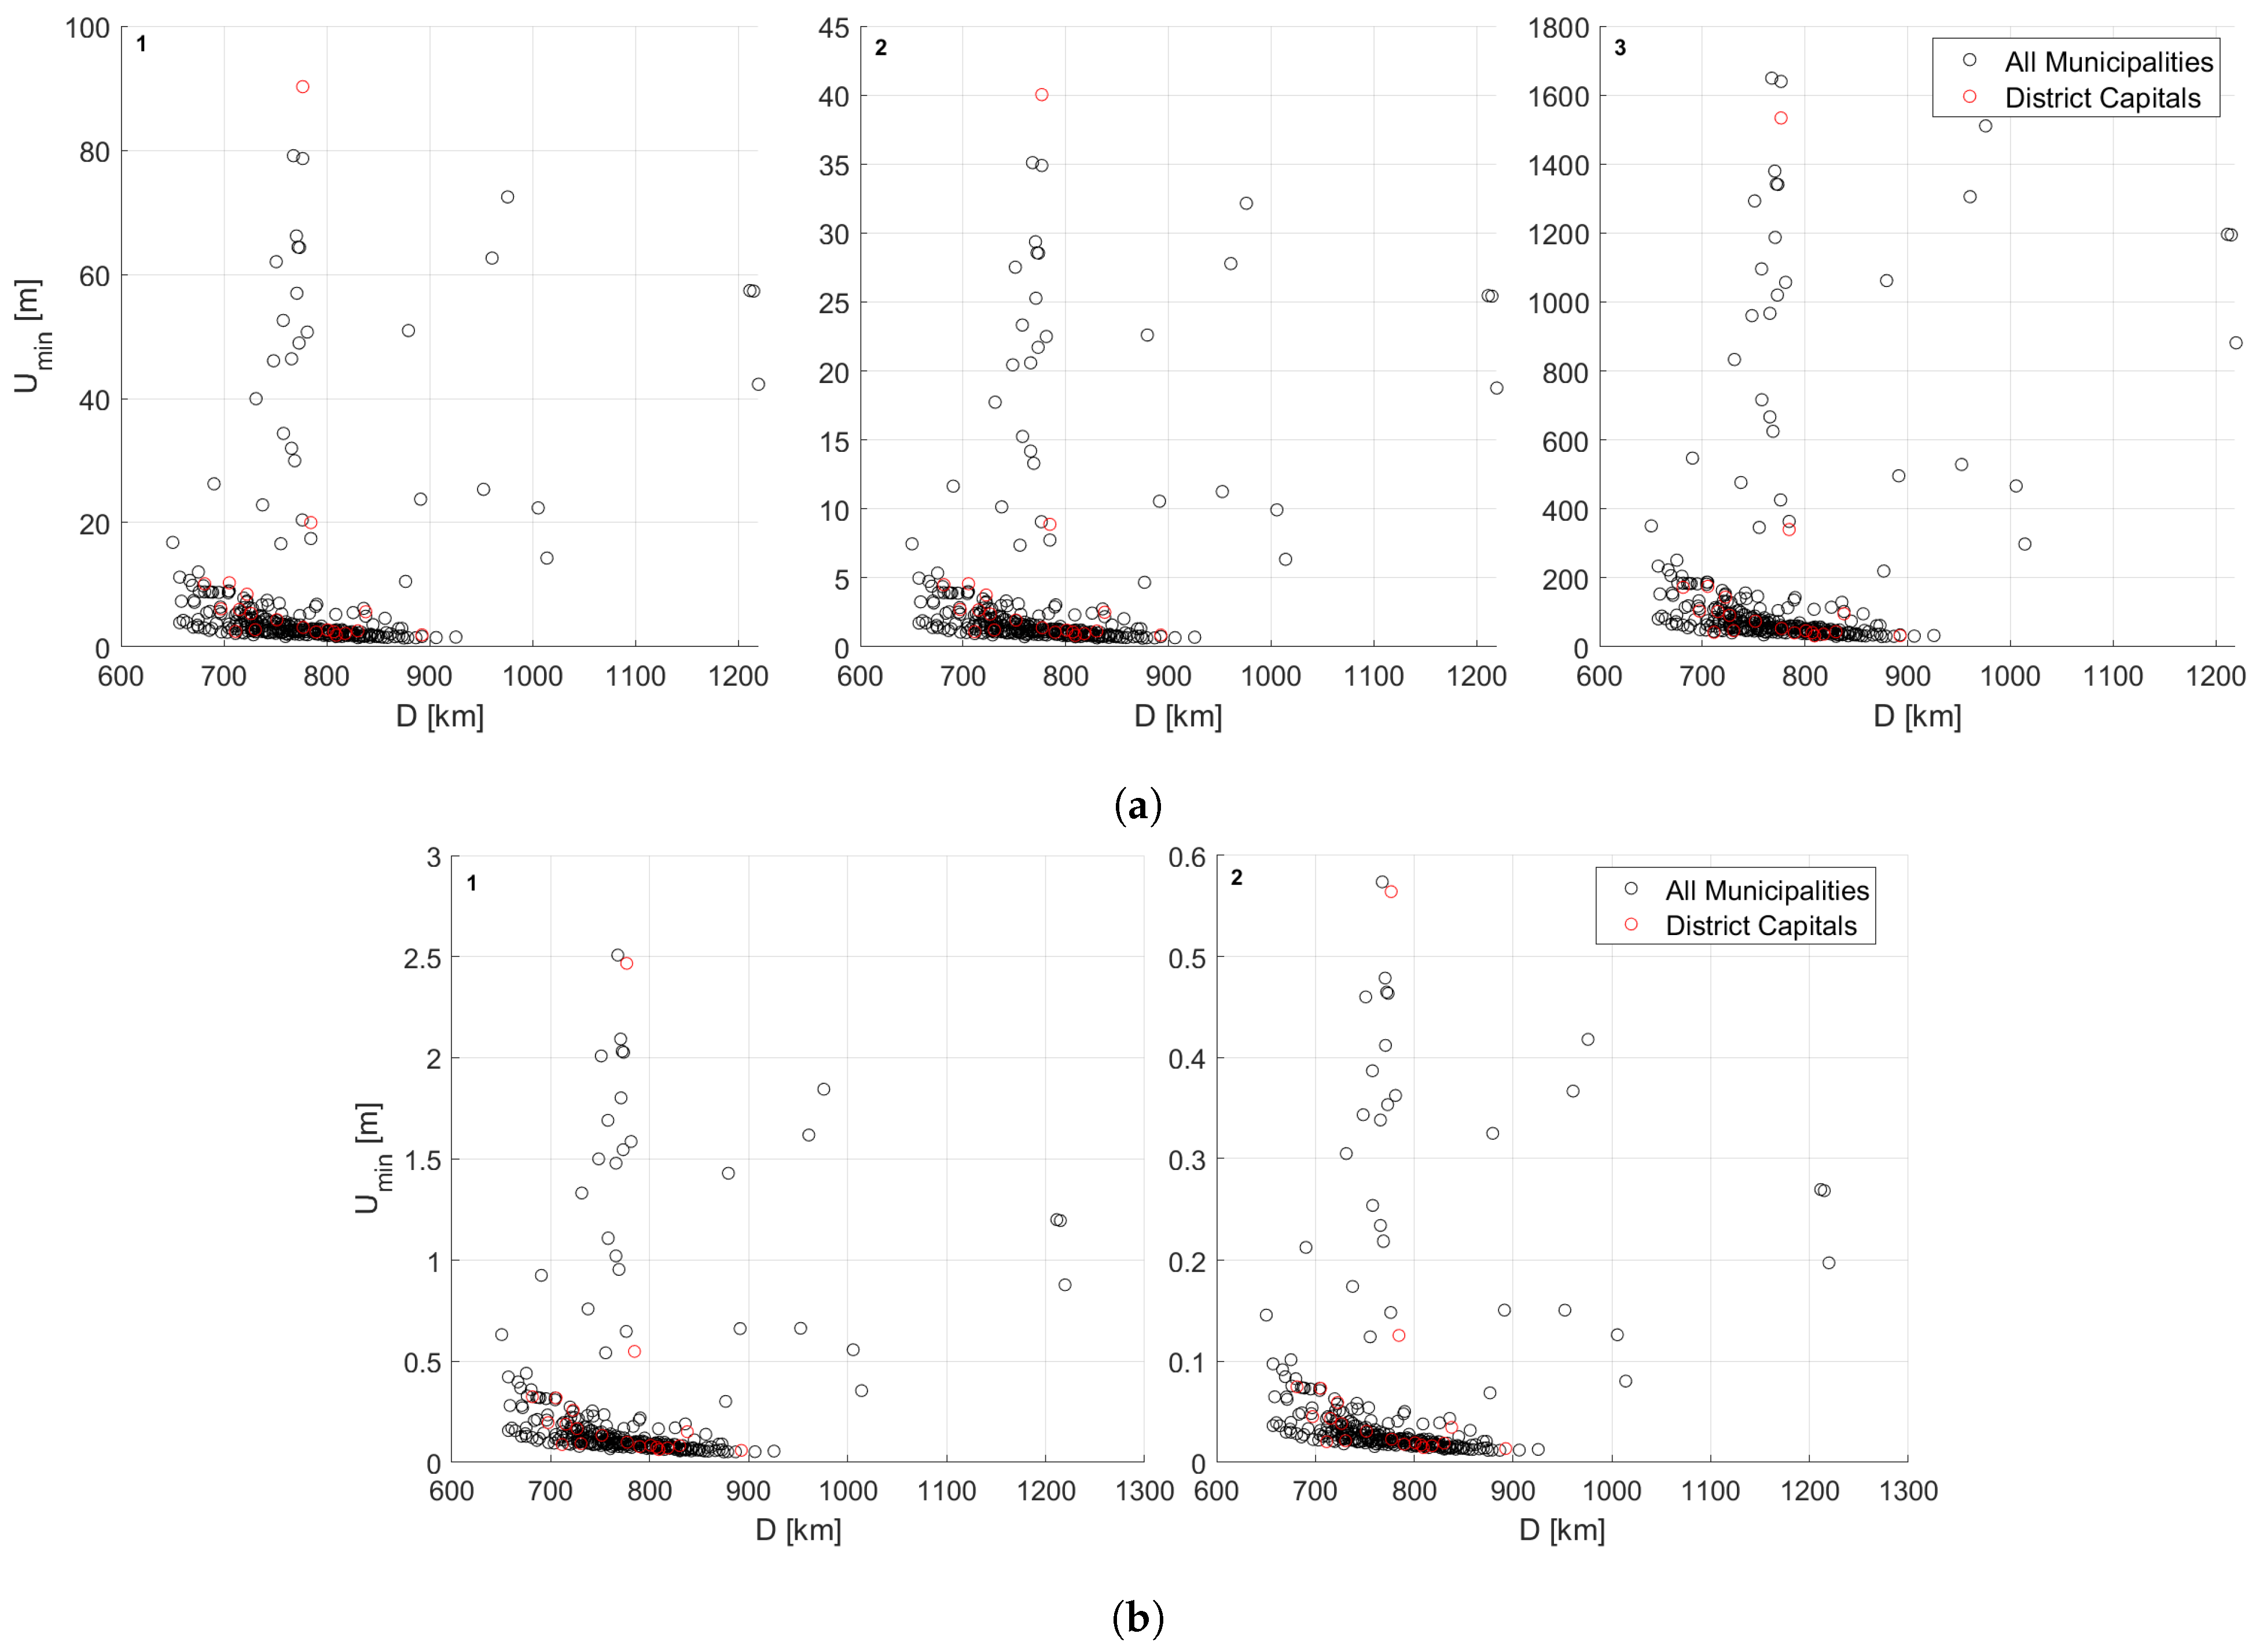
In Figure 7a and Figure 8a, there is a side-by-side comparison of the minimum and maximum run-up that the rim-wave amplitude method generates for the three impacts. All these run-up values are in relation to the sea level. The altitude still needs to be considered to obtain the local run-up.
The second wave amplitude decay method simulated is the one represented in (26), which tries to model the wave amplitude attenuation of the collapse wave with the distance. Table 10 displays these amplitude values. The relation between the amplitude and run-up values is similar to that in the previously discussed model. However, for the collapse wave, the orders of magnitude of the amplitude and run-up are lower than in the rim-wave estimations.
3.7. Global Effects
Table 11 exposes the qualitative global implications of each impact studied. Row 1 represents the Apophis impact; row 2 represents the medium-asteroid impact, and row 3 represents the 5 km impactor. Apophis would change the length of the day on Earth by about 27 picoseconds, which would be imperceptible by the population. The medium-asteroid impact would change the length of the day on Earth by about femtoseconds. As both asteroids have relatively small diameters and would impact Earth with relatively low velocities, their qualitative global implications are negligible. The 5 km impactor collision event would induce a 67 microsecond change in the total length of the day. That is a perceptible order of magnitude, but it is comparatively small. Even though this impact scenario would generate significant impact effects, they would not be on a large enough scale to cause any global change in the Earth’s orbit, rotation period, tilt of the axis, or mass.
3.8. Vulnerability
This subsection displays the individual vulnerabilities and respective casualties for each impact effect. It is worth reiterating that the vulnerabilities and casualties presented in this section are independent of one another. Thus, the total casualties from an impact are not the sum of the individual effects’ casualties.
The seismic shaking vulnerabilities were divided into three case scenarios, best, expected, and worst. For each, vulnerability and subsequent casualties were computed.
As seen in Table 8, the effective magnitude because of the Apophis’ impact is negative, which is only a mathematical result and represents non-existent seismic shaking activity in that location. As there is no activity, the vulnerabilities and the casualties are zero.
The seismic shaking vulnerability results of the medium asteroid are clear, whether there is a sea floor impact or not. In any case, the vulnerabilities are zero. If we assume an impact, the extremely low velocity with which the asteroid would reach the benthic layer would result in a purely mathematical negative value for the absolute magnitude of seismic shaking. Therefore, the formation of seismic waves would not occur. On the other hand, if we assume from the beginning that the water layer completely absorbs the impact, the asteroid will not reach the sea floor and thus not create a seismic shaking event.
In Table 12, all three scenarios are shown for the 5 km impactor collision event. Even though the seismic shaking on the Richter scale is positive, this vulnerability model predicts almost zero casualties for seismic shaking of this scale.
The overpressure vulnerability model is divided into three case scenarios: best, expected, and worst. Each scenario is associated with a specific overpressure vulnerability and a subsequent casualties value . Table 13 depicts the vulnerabilities and casualties. The air blast’s causalities for the Apophis and medium-asteroid scenarios, rows 1 and 2, despite reaching the hundreds on pascals, would not be significant when considering the entire Portuguese population. Given the overpressure values experienced after the 5 km impactor collision, row 3, most locations would experience glass window shattering, severely damaged roofs, and the almost complete collapse of wood-framed buildings. Although the results are certainly worse than the previous two, they fall short of significantly influencing the population.
The thermal radiation vulnerabilities are divided by case scenario: best, expected, and worst, and into lower and higher thermal radiation. This division means that for every location and case scenario, there are two values for the thermal radiation vulnerabilities and casualties. These thermal radiation thresholds are because of the luminous efficiency, a ratio that defines the amount of kinetic energy converted into thermal radiation. In this study, the luminous efficiency values were set to for the upper thermal radiation, and for the lower thermal radiation. In Table 14, the thermal vulnerabilities and casualties can be seen for the upper radiation limit and the lower limit , for the 5 km impactor case.
The fireballs generated by Apophis and the medium-asteroid cases would not be wide enough to reach any of the studied locations. The vast distance between the impact site and each municipality would allow the curvature of the Earth to serve as a shield from thermal radiation. As every location would not be directly exposed to radiation, and this model does not emulate radiation reflection or refraction, the vulnerabilities and respective casualties are considered to be zero.
Thermal radiation is the biggest threat from the 5 km impactor collision so far. For mainland Portugal, considering both upper and lower thermal radiation bounds and each case scenario, the vulnerability can range from to . The great range of vulnerability values speaks to the uncertainty and the many variables associated with thermal radiation. Despite this, thermal radiation is still a significant threat, as of the population represents people. For the Azores Islands, their distance from the impact shields some municipalities from the radiation. However, in the worst-case scenario, the vulnerability reaches of the population, meaning more than people. The tsunami vulnerability can yield values of one in the worst-case scenario, affecting all of its quarter-of-a-million inhabitants.
The ejecta vulnerability is related the ejecta blanket deposit and the likelihood of a building’s collapse because of its load. Three different case scenarios were used with the ejecta vulnerability model. The best-case scenario assumes the buildings have a strong frame, the worst-case scenario assumes the buildings are fragile, and the expected case scenario is a compromise between both. The vulnerability after the Apophis impact is irrelevant because the deposition of material deriving from the crater formation is null, and so are the subsequent casualties . There is also no visible difference in each location’s vulnerability.
Ejecta is, by definition, material ejected from the impact site during the excavation of the crater. We discussed in Section 3.1 the non-formation of a crater by the medium asteroid at the bottom of the sea. Therefore, its absence means the ejected material is zero, along with the vulnerabilities and casualties. Even though the 5 km impactor generates a significant crater and produces ejected material in the millimetre range that reaches Portugal’s mainland and the islands, its consequences are still considered negligible because the upper limit of the fragments’ diameter was not assessed.
Portugal is a geographically diverse country. It has coastal regions, exposed to tsunami threats, and mountain ranges, safer from such hazards. The high altitudes of most municipalities are a natural defence from this threat. However, Portugal’s vast coast is completely exposed and exhibits vulnerabilities. In Table 15 are displayed the vulnerabilities and casualties for the rim waves from the three impacts.
The Apophis-induced rim wave generates alarming casualty numbers, especially considering that these numbers only represent coastal regions. Considering a Portuguese population of on the mainland, in the best case, of the population is affected by the rim wave, and in the worst-case scenario, the affected population could reach a staggering value of . The situation on the islands is even worse. For the Azores Islands, assuming a population of , the rim wave affects to of the population. On Madeira Islands, all the inhabitants are affected, independently of the scenario. For the medium asteroid, the situation is not as dire, except on Madeira Islands because, independent of the scenario, it has casualties over . In mainland Portugal, the vulnerability ranges from to , which is still a significant threat, as those values correspond to and people. On the Azores Islands, the casualties range from over to over . For the 5 km impactor, the situation is catastrophic, independently of the scenario. The Azores and Madeira Islands have vulnerabilities of one, and all populations are affected by the first tsunami wave. The vulnerabilities on Portugal’s mainland range from to , considering that the tsunami only affects coastal regions.
The vulnerabilities and casualties resulting from the collapse wave would be much lower; see Table 16. For the Apophis asteroid, row 1, in mainland Portugal, the affected population ranges from to . However, of the population is still more than , which is still alarming. In the Azores Islands, is the maximum affected population, and in the Madeira Islands, in the worst scenario, of inhabitants would be affected. Regarding the medium asteroid’s results, row 2, the vulnerabilities of Portugal’s mainland range from to , and for the Azores Islands, the vulnerabilities range from to . For Madeira Islands, in the worst-case scenario, the vulnerability reaches . Overall, the collapse wave is a lesser threat compared with the rim wave. However, the results on their own are still alarming. As the impact occurred in deep water in these scenarios, the results contradict previous statements [20] that collapse waves are the principal concern in deep oceanic impact events.
4. Conclusions
The current work studied the short-term effects of three asteroid impacts on Portuguese residents. The celestial objects, assumed to impact the Earth at a angle, included: the Apophis asteroid, a 370-m body, impacting the Earth with a velocity km·s and a density kg·m; a 204-m medium-sized asteroid, representing an NEO threat, assumed to impact the Earth with a velocity km·s and a density kg·m; and an asteroid with a 5-km diameter, impacting the Earth with a velocity km·s and a density kg·m. In addition to the impact assessment for each municipality, the vulnerabilities and the correspondent casualties were assessed for each municipality and each impact effect independently.
Each impact effects assessment included a seismic shaking event, a shock wave, thermal radiation, ejecta deposit, tsunami waves, and the qualitative global effects. The seismic shock could be neglected in the Apophis and medium-asteroid cases, but the 5 km impactor case originated an magnitude earthquake. For the 5 km impactor case, the average pressure difference experienced in Portuguese territory because of the shock wave could cause massive structural damage and some potential casualties. However, it was not at all the most concerning threat. The fireball would be big enough to endanger some municipalities, causing thousands of casualties, but again, only for the 5 km impactor case. In all three simulations, the collapse of infrastructure because of the ejecta deposit was the smallest threat. The lack of benthic final crater formation, plus the great distance between the populations and the impact site, should prevent the depositing of ejected material in populated areas. The final impact effect studied was the tsunami. The tsunami would be felt throughout the territory in all three impact events, making it the most concerning impact effect. Regarding global implications, no impact was on a scale big enough to affect the Earth’s orbit, rotation period, rotational axis, or mass.
The vulnerability was assessed through pre-established vulnerability models for all the impact effects studied. All the models were subdivided into three case scenarios: best, expected, and worst.
The final estimates were of casualties in every municipality for every impact effect. There was a direct correlation between asteroid impact risk and population density. As such, the casualties were assessed with a simple product relation between the vulnerability and the population.
The rim wave was the most hazardous impact effect for all three impacts, having the highest average vulnerability values. The tsunami wave, independently of the simulation considered, had the ability to destructively affect several hundred-thousand or several million Portuguese people. The thermal radiation for the 5 km impactor could rival the rim wave, as the death toll could reach the millions as well. The impact effects that could be disregarded in terms of threat were the ejecta deposit and the seismic shaking. Even though the 5 km impactor collision estimated a shaking of on the Richter scale, the effective magnitude dropped by approximately half, which is enough to be felt, but not enough to cause any real damage to the population.
Author Contributions
Conceptualization, L.F.F.M.S. and R.H.M.; methodology, L.F.F.M.S. and R.H.M.; software, R.H.M.; validation, L.F.F.M.S., A.R.R.S. and R.M.; writing—original draft preparation, R.H.M.; writing—review and editing, L.F.F.M.S., A.R.R.S. and R.M. All authors have read and agreed to the published version of the manuscript.
Funding
This research received no external funding.
Institutional Review Board Statement
Not applicable.
Informed Consent Statement
Not applicable.
Data Availability Statement
Not applicable.
Acknowledgments
Fundação para a Ciência e Tecnologia (FCT), under LAETA, through AEROG and IDMEC by project UIDB/50022/2020; by FCT through ICT (Institute of Earth Sciences), project UIDB/04683/2020.
Conflicts of Interest
The authors declare no conflict of interest.
Abbreviations
| Wave amplitude at the deep/shallow water threshold | |
| Collapse wave amplitude | |
| Collapse wave maximum amplitude | |
| Rim-wave amplitude | |
| Rim wave maximum amplitude | |
| Drag coefficient | |
| Ejecta blanket deposition casualties | |
| Overpressure casualties | |
| Seismic shaking casualties | |
| Tsunami casualties | |
| Thermal radiation casualties | |
| D | Distance |
| Yield scaled distance | |
| Threshold diameter between simple and complex craters | |
| Final crater depth | |
| Final crater diameter | |
| Distance between the municipality and the deep/shallow water threshold point | |
| Transient crater depth | |
| Transient crater diameter | |
| Scaled distance | |
| E | Impact energy |
| Impact energy in kilotons TNT | |
| f | Ratio of the fireball above the horizon |
| Earth standard gravitational acceleration (9.80665 m/s) | |
| Sea depth at impact site | |
| h | Fireball maximum height below the horizon |
| Rim height | |
| Municipality altitude | |
| L | Asteroid diameter |
| Mean ejecta fragment diameter | |
| M | Seismic Richter scale magnitude |
| Earth mass | |
| Impactor mass | |
| Effective seismic Richter scale magnitude | |
| Impactor linear momentum | |
| Earth radius | |
| Fireball radius | |
| Peak overpressure at distance D | |
| Load of the ejecta blanket | |
| Scaled pressure | |
| q | Wave attenuation factor |
| s | Municipality slope |
| Earth rotation period | |
| Breccia lens thickness | |
| Ejecta blanket thickness | |
| U | Run-up wave height |
| Local run-up wave height | |
| Earth volume | |
| Earth mean orbital velocity | |
| Ejecta blanket deposition vulnerability | |
| Impact velocity | |
| Overpressure vulnerability | |
| Seismic shaking vulnerability | |
| Transient crater volume | |
| Tsunami vulnerability | |
| Thermal radiation vulnerability | |
| Earth angular momentum | |
| Impactor angular momentum | |
| Epicentral angle | |
| Change in Earth’s length of day | |
| Luminous efficiency | |
| Asteroid impact angle | |
| Impact site longitude | |
| Municipality longitude | |
| Impactor density | |
| Target density | |
| Water density | |
| Thermal energy per area unit | |
| Impact site latitude | |
| Municipality latitude |
References
- Müller, T.G.; Kiss, C.; Scheirich, P.; Pravec, P.; O’Rourke, L.; Vilenius, E.; Altieri, B. Thermal infrared observations of asteroid (99942) Apophis with Herschel. Astron. Astrophys. 2014, 566, 1–10. [Google Scholar] [CrossRef] [Green Version]
- Licandro, J.; Müller, T.; Alvarez, C.; Alí-Lagoa, V.; Delbo, M. GTC/CanariCam observations of (99942) Apophis. Astron. Astrophys. 2016, 585, 1–4. [Google Scholar] [CrossRef] [Green Version]
- Chesley, S.R. Potential impact detection for near-Earth asteroids: The case of 99942 Apophis (2004 MN4). Proc. Int. Astron. Union 2005, 1, 215–228. [Google Scholar] [CrossRef] [Green Version]
- Giorgini, J.D.; Benner, L.A.; Ostro, S.J.; Nolan, M.C.; Busch, M.W. Predicting the Earth encounters of (99942) Apophis. Icarus 2008, 193, 1–19. [Google Scholar] [CrossRef]
- Bancelin, D.; Colas, F.; Thuillot, W.; Hestroffer, D.; Assafin, M. Updated orbit of Apophis with recent observations. In Proceedings of the SF2A 2011: Annual Meeting of the French Society of Astronomy and Astrophysics, Paris, France, 21 June 2011; p. 629. [Google Scholar]
- Guo, P.; Ivashkin, V.V.; Stikhno, C.A.; Shkapov, P.M. Determination and investigation of asteroid Apophis’ trajectories set potentially colliding with the Earth in 2036. IOP Conf. Ser. Mater. Sci. Eng. 2018, 468. [Google Scholar] [CrossRef]
- Binzel, R.P.; Rivkin, A.S.; Thomas, C.A.; Vernazza, P.; Burbine, T.H.; DeMeo, F.E.; Bus, S.J.; Tokunaga, A.T.; Birlan, M. Spectral properties and composition of potentially hazardous Asteroid (99942) Apophis. Icarus 2009, 200, 480–485. [Google Scholar] [CrossRef]
- Britt, D.T.; Yeomans, D.; Housen, K.; Consolmagno, G. Asteroids Density, Porosity, and Structure. In Asteroids III; Bottke, W., Cellino, A., Paolicchi, P., Binzel, R., Eds.; University of Arizona Press: Tucson, AZ, USA, 2002; Volume 4.2, pp. 485–500. [Google Scholar] [CrossRef]
- Morais, R.H.; Santos, L.F.F.M.; Silva, A.R.R.; Melicio, R. Hypothetical Apophis deep ocean impact—Energy analysis. Acta Astronaut. 2021, 188, 438–450. [Google Scholar] [CrossRef]
- NASA. NEO Earth Close Approaches. Available online: https://cneos.jpl.nasa.gov/ca/ (accessed on 9 March 2020).
- Rumpf, C.M.; Lewis, H.G.; Atkinson, P.M. Asteroid impact effects and their immediate hazards for human populations. Geophys. Res. Lett. 2017, 44, 3433–3440. [Google Scholar] [CrossRef] [Green Version]
- Harris, A.W.; Chodas, P.W. The population of near-earth asteroids revisited and updated. Icarus 2021, 365, 114452. [Google Scholar] [CrossRef]
- Rumpf, C.M. Asteroid Impact Risk. Ph.D. Thesis, University of Southampton, Southampton, UK, 2016. [Google Scholar]
- Collins, G.S.; Melosh, H.J.; Marcus, R.A. Earth Impact Effects Program: A Web-based computer program for calculating the regional environmental consequences of a meteoroid impact on Earth. Meteorit. Planet. Sci. 2005, 40, 817–840. [Google Scholar] [CrossRef] [Green Version]
- Rumpf, C.M. Global Asteroid Risk Analysis. 2014; pp. 1–10. Available online: http://xxx.lanl.gov/abs/1410.4471 (accessed on 19 February 2019).
- Rumpf, C.M.; Lewis, H.G.; Atkinson, P.M. Global Impact Distribution of Asteroids and Affected Population; 2015; Available online: https://eprints.soton.ac.uk/377825/ (accessed on 19 October 2019).
- Rumpf, C.; Lewis, H.G.; Atkinson, P.M. Monitoring the Global Asteroid Impact Risk. In Proceedings of the 66th IAF International Astronautical Congress, Jerusalem, Israel, 10 October 2015; Volume IAC-15.B5. [Google Scholar]
- Rumpf, C.M.; Lewis, H.G.; Atkinson, P.M. The global impact distribution of Near-Earth objects. Icarus 2016, 265, 209–217. [Google Scholar] [CrossRef] [Green Version]
- Rumpf, C.M.; Lewis, H.G.; Atkinson, P.M. On the influence of impact effect modelling for global asteroid impact risk distribution. Acta Astronaut. 2016, 123, 165–170. [Google Scholar] [CrossRef] [Green Version]
- Wünnemann, K.; Collins, G.S.; Weiss, R. Impact of a cosmic body into Earth’s Ocean and the generation of large tsunami waves: Insight from numerical modeling. Rev. Geophys. 2010, 48, 1–26. [Google Scholar] [CrossRef] [Green Version]
- Johnson, B.C.; Collins, G.S.; Minton, D.A.; Bowling, T.J.; Simonson, B.M.; Zuber, M.T. Spherule layers, crater scaling laws, and the population of ancient terrestrial impactors. Icarus 2016, 271, 350–359. [Google Scholar] [CrossRef] [Green Version]
- Collins, G.; Melosh, J. Errata and Improvements in Earth Impact Effects Program; 2013; Available online: https://impact.ese.ic.ac.uk/ImpactEarth/ImpactEffects/effects.pdf (accessed on 1 June 2020).
- Khazins, V.M.; Shuvalov, V.V.; Svettsov, V.V. The Seismic Efficiency of Space Body Impacts. Sol. Syst. Res. 2018, 52, 547–556. [Google Scholar] [CrossRef]
- Matsue, K.; Yasui, M.; Arakawa, M.; Hasegawa, S. Measurements of seismic waves induced by high-velocity impacts: Implications for seismic shaking surrounding impact craters on asteroids. Icarus 2020, 338, 113520. [Google Scholar] [CrossRef]
- Collins, G.S.; Lynch, E.; McAdam, R.; Davison, T.M. A numerical assessment of simple airblast models of impact airbursts. Meteorit. Planet. Sci. 2017, 52. [Google Scholar] [CrossRef] [Green Version]
- Svetsov, V.V.; Shuvalov, V.V. Thermal radiation and luminous efficiency of superbolides. Earth Planet. Sci. Lett. 2018, 503, 10–16. [Google Scholar] [CrossRef]
- Svetsov, V.; Shuvalov, V. Thermal radiation from impact plumes. Meteorit. Planet. Sci. 2019, 54, 126–141. [Google Scholar] [CrossRef] [Green Version]
- Rumpf, C.M.; Lewis, H.G.; Atkinson, P.M. Population vulnerability models for asteroid impact risk assessment. Meteorit. Planet. Sci. 2017, 52, 1082–1102. [Google Scholar] [CrossRef] [Green Version]
- PORDATA. Base de Dados de Portugal Comtemporâneo. Available online: https://www.pordata.pt/Municipios/Altitude+m%c3%a1xima-50 (accessed on 30 April 2020).
- EMODnet. Undersanding the Topography of the European Seas. Available online: https://portal.emodnet-bathymetry.eu/ (accessed on 4 May 2020).
Figure 1.
Best, worst, and expected-case vulnerability models. (a) Seismic shaking. (b) Overpressure. (c) Thermal radiation. (d) Ejecta blanket deposition. (e) Tsunami.
Figure 1.
Best, worst, and expected-case vulnerability models. (a) Seismic shaking. (b) Overpressure. (c) Thermal radiation. (d) Ejecta blanket deposition. (e) Tsunami.

Figure 2.
Apophis crater dimensions for the transient craters (a) and the simple final craters (b) for the surface and sea floor were obtained by the listed relations (3)–(11) rather than modelling.

Figure 3.
Medium asteroid crater dimensions for the transient craters (a) and simple final craters (b) on the surface and sea floor were obtained by the listed relations (3)–(11) rather than modelling.

Figure 4.
Five-kilometre asteroid impactor crater dimensions for the transient craters (a) and simple final craters (b) on the surface and sea floor were obtained by the listed relations (3)–(11) rather than modelling.

Figure 5.
Impact effects as functions of the municipalities’ distances. The trends are represented by continuous lines. (a) Effective magnitude. (b) Overpressure. (c) Mean ejecta fragment diameter. (d) Ejecta blanket thickness. (e) Upper and lower thermal radiation.
Figure 5.
Impact effects as functions of the municipalities’ distances. The trends are represented by continuous lines. (a) Effective magnitude. (b) Overpressure. (c) Mean ejecta fragment diameter. (d) Ejecta blanket thickness. (e) Upper and lower thermal radiation.

Figure 6.
Tsunami wave amplitudes for Apophis (1), the medium asteroid (2), and the 5 km impactor (3) at 800 m depth as functions of the distance to municipalities. The black circles represent all municipalities. The red markers represent the values for the district capitals. (a) Rim-wave amplitude. (b) Collapse wave amplitude.

Figure 7.
Tsunami wave minimum run-up for Apophis (1), medium asteroid (2), and 5 km impactor (3) impacts, at the coast, as functions of the distance to municipalities. The red markers represent the values for the district capitals. (a) Rim-wave. (b) Collapse wave.
Figure 7.
Tsunami wave minimum run-up for Apophis (1), medium asteroid (2), and 5 km impactor (3) impacts, at the coast, as functions of the distance to municipalities. The red markers represent the values for the district capitals. (a) Rim-wave. (b) Collapse wave.

Figure 8.
Tsunami wave maximum run-up for Apophis (1), medium asteroid (2), and 5 km impactor (3) impacts, at the coast, as functions of the distance to municipalities. The red markers represent the values for the district capitals. (a) Rim-wave. (b) Collapse wave.
Figure 8.
Tsunami wave maximum run-up for Apophis (1), medium asteroid (2), and 5 km impactor (3) impacts, at the coast, as functions of the distance to municipalities. The red markers represent the values for the district capitals. (a) Rim-wave. (b) Collapse wave.


Table 1.
Global implications of an impact event [14].
Table 1.
Global implications of an impact event [14].
| Ratio | Interval | Qualitative Global Change |
|---|---|---|
| No noticeable change in orbit. | ||
| Noticeable change in orbit. | ||
| Substantial change in orbit. | ||
| Totally changes orbit. | ||
| No noticeable change in rotation period and tilt of axis. | ||
| Noticeable change in rotation period and tilt of axis. | ||
| Substantial change in rotation period and tilt of axis. | ||
| Totally changes rotation period and tilt of axis. | ||
| Earth is not strongly disturbed and loses negligible mass. | ||
| Earth is strongly disrupted but loses a little mass. | ||
| Earth is completely disrupted and loses all mass. |
Table 2.
Seismic shaking vulnerability coefficients.
| a | b | |
|---|---|---|
| best | −2.51 | −9.59 |
| expected | −2.52 | −8.69 |
| worst | −3.80 | −7.60 |
Table 3.
Overpressure vulnerability coefficients.
| best | −1.90 | −5.43 |
| expected | −2.42 | −4.40 |
| worst | −2.85 | −3.53 |
Table 4.
Thermal radiation vulnerability coefficients.
| a | |||
|---|---|---|---|
| best | 0.25 | −5.62 | −7.32 |
| expected | 0.47 | −5.62 | −7.32 |
| worst | 1.00 | −5.62 | −7.32 |
Table 5.
Ejecta blanket deposition vulnerability coefficients.
| a | b | c | |
|---|---|---|---|
| best | −1.00 | −5.84 | −2.58 |
| expected | −1.37 | −3.14 | −4.60 |
| worst | −4.32 | −1.61 | −4.13 |
Table 6.
Tsunami vulnerability coefficients.
| best | −4.53 | −1.21 | |
| expected | −3.80 | −1.11 | /2 − |
| worst | −3.07 | −1.02 |
Table 7.
Asteroids’ physical and impact properties.
| L [m] | [] | [kg/m] | [m/s] | E [J] | ||
|---|---|---|---|---|---|---|
| Apophis | surface | 370 | 45 | 3200 | 12,620 | |
| sea floor | 5.6 | |||||
| Medium | surface | 204 | 45 | 3100 | 10,840 | |
| Asteroid | sea floor | |||||
| 5 km | surface | 5000 | 45 | 2500 | 15,000 | |
| Impactor | sea floor |
Table 8.
Impact effects in Portuguese territory.
| D | ||||||||
|---|---|---|---|---|---|---|---|---|
| Mainland | 0 | 0 | ||||||
| 1 | Azores | 11 | 0 | 0 | ||||
| Madeira | 11 | 0 | 0 | |||||
| Mainland | 11 | 18 | 0 | 0 | ||||
| 2 | Azores | 13 | 23 | 0 | 0 | |||
| Madeira | 13 | 23 | 0 | 0 | ||||
| Mainland | 41 | |||||||
| 3 | Azores | 33 | ||||||
| Madeira | 33 | |||||||
Table 9.
Ejected material for the closest impact point in mainland Portugal, Azores and Madeira.
| Apophis | Medium | 5 km | ||||
|---|---|---|---|---|---|---|
| Asteroid | Impactor | |||||
| [m] | [pm] | [nm] | [am] | [mm] | [mm] | |
| Mainland | 7.2 | 14.9 | 195 | 12.3 | 1.4 | 10.7 |
| Azores | 5.1 | 10.2 | 139 | 8.4 | 0.98 | 7.3 |
| Madeira | 5.3 | 10.5 | 143 | 8.6 | 1.0 | 7.5 |
Table 10.
Distance to the shore from the 800 m depth point, wave amplitude at this point, and run-up heights for the rim and collapse waves in Portuguese territory.
Table 10.
Distance to the shore from the 800 m depth point, wave amplitude at this point, and run-up heights for the rim and collapse waves in Portuguese territory.
| Rim-Wave | Collapse Wave | |||||||
|---|---|---|---|---|---|---|---|---|
| [km] | [m] | [m] | [m] | [mm] | [m] | [m] | ||
| Mainland | 16 | 4.1 | 17 | 20 | 5.7 | 0.6 | 0.8 | |
| 1 | Azores | 11 | 3.6 | 23 | 54 | 4.0 | 0.8 | 1.8 |
| Madeira | 6.3 | 3.6 | 40 | 66 | 4.0 | 1.3 | 2.2 | |
| Mainland | 16 | 1.4 | 7.5 | 9.0 | 0.5 | 15 | 18 | |
| 2 | Azores | 11 | 1.2 | 10 | 24 | 0.4 | 17 | 41 |
| Madeira | 6.3 | 1.2 | 18 | 29 | 0.4 | 31 | 50 | |
| Mainland | 16 | — | ||||||
| 3 | Azores | 11 | ||||||
| Madeira | 6.3 | |||||||
Table 11.
Global implications of the three impact events.
| Ratio | Value | Qualitative Global Change | |
|---|---|---|---|
| 1 | No noticeable change in orbit. | ||
| No noticeable change in rotation period and tilt of axis. | |||
| Earth is not strongly disturbed and loses negligible mass. | |||
| 2 | No noticeable change in orbit. | ||
| No noticeable change in rotation period and tilt of axis. | |||
| Earth is not strongly disturbed and loses negligible mass. | |||
| 3 | No noticeable change in orbit. | ||
| No noticeable change in rotation period and tilt of axis. | |||
| Earth is not strongly disturbed and loses negligible mass. |
Table 12.
Seismic vulnerabilities and casualties in Portuguese territory.
| Best | Expected | Worst | ||||
|---|---|---|---|---|---|---|
| [] | [] | |||||
| Mainland | 0 | 0 | 2 | 2.1 | 31 | 3.2 |
| Azores | 0 | 0 | 0 | 0 | 0 | 0 |
| Madeira | 0 | 0 | 0 | 0 | 0 | 0 |
Table 13.
Overpressure vulnerabilities and casualties in Portuguese territory.
| Best | Expected | Worst | |||||
|---|---|---|---|---|---|---|---|
| [] | [] | [] | |||||
| Mainland | 1.4 | 2.2 | 3.2 | ||||
| 1 | Azores | 1.0 | 0.4 | 4.0 | 1.7 | 5.0 | 2.1 |
| Madeira | 3.0 | 1.2 | 5.0 | 2.0 | 6.0 | 2.4 | |
| Mainland | 1.4 | 2.2 | 3.2 | ||||
| 2 | Azores | 1.0 | 4.1 | 4.0 | 1.7 | 4.0 | 1.7 |
| Madeira | 3.0 | 1.2 | 5.0 | 2.0 | 6.0 | 2.4 | |
| Mainland | 4.0 | 5.1 | 9.9 | ||||
| 3 | Azores | 5.0 | 2.1 | 6.0 | 2.5 | 6.2 | |
| Madeira | 7.0 | 2.8 | 3.9 | 8.3 | |||
Table 14.
Thermal vulnerabilities and casualties in Portuguese territory.
| Best | Expected | Worst | |||||
|---|---|---|---|---|---|---|---|
| Mainland | 0.22 | 0.42 | 0.89 | ||||
| Azores | 0.15 | 0.28 | 0.60 | ||||
| Madeira | 0.25 | 0.47 | 1.0 | ||||
| Mainland | 0.006 | 0.011 | 0.024 | ||||
| Azores | 0.003 | 0.005 | 0.011 | ||||
| Madeira | 0.005 | 0.009 | 0.018 | ||||
Table 15.
Rim-wave vulnerabilities and casualties in Portuguese territory.
| Best | Expected | Worst | |||||
|---|---|---|---|---|---|---|---|
| Mainland | 0.07 | 0.16 | 0.24 | ||||
| 1 | Azores | 0.90 | 0.99 | 1.0 | |||
| Madeira | 1.0 | 1.0 | 1.0 | ||||
| Mainland | 0.01 | 0.04 | 0.08 | ||||
| 2 | Azores | 0.36 | 0.74 | 0.89 | |||
| Madeira | 0.99 | 1.0 | 1.0 | ||||
| Mainland | 0.79 | 0.81 | 0.81 | ||||
| 3 | Azores | 1.0 | 1.0 | 1.0 | |||
| Madeira | 1.0 | 1.0 | 1.0 | ||||
Table 16.
Collapse wave vulnerabilities and casualties in Portuguese territory.
| Best | Expected | Worst | |||||
|---|---|---|---|---|---|---|---|
| Mainland | 0.002 | 0.008 | 0.024 | ||||
| 1 | Azores | 0.006 | 0.024 | 0.073 | |||
| Madeira | 0.011 | 0.075 | 0.266 | ||||
| Mainland | 0.002 | 0.007 | 0.022 | ||||
| 2 | Azores | 0.004 | 0.016 | 0.048 | |||
| Madeira | 0.005 | 0.021 | 0.067 | ||||
Publisher’s Note: MDPI stays neutral with regard to jurisdictional claims in published maps and institutional affiliations. |
© 2022 by the authors. Licensee MDPI, Basel, Switzerland. This article is an open access article distributed under the terms and conditions of the Creative Commons Attribution (CC BY) license (https://creativecommons.org/licenses/by/4.0/).
Share and Cite
MDPI and ACS Style
Morais, R.H.; Santos, L.F.F.M.; Silva, A.R.R.; Melicio, R. Short-Term Consequences of Asteroid Impacts into the Ocean: A Portuguese Case Study. Universe 2022, 8, 279. https://0-doi-org.brum.beds.ac.uk/10.3390/universe8050279
AMA Style
Morais RH, Santos LFFM, Silva ARR, Melicio R. Short-Term Consequences of Asteroid Impacts into the Ocean: A Portuguese Case Study. Universe. 2022; 8(5):279. https://0-doi-org.brum.beds.ac.uk/10.3390/universe8050279
Chicago/Turabian StyleMorais, Renato H., Luís F. F. M. Santos, André R. R. Silva, and Rui Melicio. 2022. "Short-Term Consequences of Asteroid Impacts into the Ocean: A Portuguese Case Study" Universe 8, no. 5: 279. https://0-doi-org.brum.beds.ac.uk/10.3390/universe8050279
Note that from the first issue of 2016, this journal uses article numbers instead of page numbers. See further details here.