Oriented Polar Molecules in a Solid Inert-Gas Matrix: A Proposed Method for Measuring the Electric Dipole Moment of the Electron


1
Department of Physics, University of Toronto, Toronto, ON, M5S 1A7, Canada
2
Department of Physics and Astronomy, York University, Toronto, ON, M3J 1P3, Canada
*
Author to whom correspondence should be addressed.
Atoms 2018, 6(1), 3; https://0-doi-org.brum.beds.ac.uk/10.3390/atoms6010003
Submission received: 24 October 2017
/
Revised: 21 December 2017
/
Accepted: 27 December 2017
/
Published: 5 January 2018
(This article belongs to the Special Issue High Precision Measurements of Fundamental Constants)
Abstract
:We propose a very sensitive method for measuring the electric dipole moment of the electron using polar molecules embedded in a cryogenic solid matrix of inert-gas atoms. The polar molecules can be oriented in the -direction by an applied electric field, as has recently been demonstrated by Park et al. The trapped molecules are prepared into a state that has its electron spin perpendicular to , and a magnetic field along causes precession of this spin. An electron electric dipole moment would affect this precession due to the up to 100 GV/cm effective electric field produced by the polar molecule. The large number of polar molecules that can be embedded in a matrix, along with the expected long coherence times for the precession, allows for the possibility of measuring to an accuracy that surpasses current measurements by many orders of magnitude. Because the matrix can inhibit molecular rotations and lock the orientation of the polar molecules, it may not be necessary to have an electric field present during the precession. The proposed technique can be applied using a variety of polar molecules and inert gases, which, along with other experimental variables, should allow for careful study of systematic uncertainties in the measurement.
1. Introduction
Extensions of the Standard Model of particle physics are necessary to explain the presence of dark matter and to explain the asymmetry between matter and antimatter in the universe. The Standard Model predicts that the electric dipole moment of the electron, , is along the direction of its spin, and is probably of order 10 cm [1,2,3], whereas most extensions (for example, supersymmetric theories [4,5]) predict a much larger value for .
The two most precise measurements of are by the ACME collaboration [6] (who use a beam of metastable ThO, and measure 2.1(4.5) × 10cm), and the JILA collaboration [7] (who use trapped metastable HfF ions and measure 0.9(7.8) × 10 cm). The results of these measurements are both consistent with zero and their weighted average gives 1.4(3.9) × 10 cm, which sets a 90% confidence interval of 7 × 10 cm. A stronger limit (or a nonzero measurement of ) is necessary to guide Standard Model extensions.
Measurements of are performed by watching electron spins precess within a magnetic field, and measuring any change in this precession rate due to the presence of an electric field. The angle through which they precess is given by
where is the magnetic moment of the electron, B is the applied magnetic field, is the effective electric field that the electron experiences inside the molecule or molecular ion, and T is the time that the electron is precessing. The ± signs correspond to the cases for which the electric and magnetic fields are oriented in parallel and antiparallel directions.
The precision of from such a measurement, assuming the measurement is statistically limited by shot-noise, is
where N is the total (integrated) number of electrons whose precession is detected. The value of is between 10 and 100 GV/cm for most polar molecules (and polar molecular ions) used for electron electric-dipole-moment studies, and therefore greatly improved measurements can only be obtained by large improvements in N or in T. The ACME experiment [6] uses an N of order 10, and a T of order 1 ms. The JILA measurement [7,8] uses an N of order 10, and a T of approaching 1 s.
Improvements in N and in T should be possible for both the molecular ion and the neutral molecule measurements. For molecular ion experiments, the number of trapped ions seems to be practically limited to be less than approximately 10 ( for a month of one-second-long measurements) due to interactions between co-trapped ions. Laser cooling and trapping experiments of neutral polar molecules are planned by several groups (e.g., with YbF [9] and TlF [10]), but, even assuming the same performance from a molecular trap as an atom trap, the maximum molecule number is unlikely to exceed 10 molecules per trap cycle ( for a month of one-second-long measurements). Beam experiments with a T of approaching 1 s could potentially reach N of 10, if the considerable experimental difficulties of maintaining beam collimation and field control over tens of meters can be achieved.
We propose here a method that will allow for a much larger N, while maintaining a large value of T. The method involves embedding polar molecules in an inert-gas matrix. We refer to this method as EDM (Electric Dipole Measurements using Molecules within a Matrix). The method exploits the fact that the inert-gas matrices are transparent, and that the influence of the matrix on the molecule is small enough to still allow for state preparation and detection techniques similar to those used in molecular beam measurements of . The number of embedded polar molecules could range from 10 to 10, or more. We expect that a T of approaching 1 s should be possible given that second-long coherence times were demonstrated for cesium atomic spins in solid-helium crystals [11,12] and 0.1 s has been demonstrated for rubidium atoms in an argon matrix [13]. With a measurement cycle time of one second and a one-month-long measurement, N would be 10 to 10. This would lead to a statistical measurement precision of = ∼10 to ∼10 cm, which represents an improvement of between seven and nine orders of magnitude when compared to the current uncertainty on .
The EDM method requires the embedded polar molecules to be oriented within the inert-gas matrix. Only recently [14] has it been demonstrated that polar molecules can be fully oriented in an inert-gas matrix by the application of electric fields of between 1 and 3 MV/cm, using the novel technique [15] of ice-film nanocapacitors. Previous to this achievement, it was thought [16] that a completely oriented sample would not be feasible.
Furthermore, molecules trapped in a matrix can have their rotations inhibited by the forces between the ions that make up the molecule and the polarizable inert-gas atoms that are their nearest neighbors in the matrix. Theoretical understanding of this inhibition of rotations (which can lock molecules into librator states instead of their usual rotational states) has been studied using Devonshire octahedral model potentials [17,18]. The model describes the motion of the trapped molecules in terms of hindered rotations and librations, and shows that the rotational spectrum includes trapped librator states for strong coupling. Here, strong coupling occurs for large values of the ratio of the potential barrier that hinders rotation (caused by the inert-gas–molecule interactions) divided by the rotational constant of the molecule. The librator states may allow the polar molecules to remain oriented, even after the applied electric field is turned off.
There are several advantages of measuring in a matrix, as opposed to in a solid such as gadolinium–iron garnet [19,20,21]. The spacing between inert-gas atoms in the matrix is large, leading to only small perturbations on the embedded molecules to be studied. Since the matrix is transparent, standard spectroscopy techniques can be used in studying the embedded molecules. In addition, the matrix allows for the large available in polar molecules, and, in addition, one can change the species and density of the embedded molecules. With EDM, can be measured using the individual molecules (using methods similar to those used for trapped ions or molecular beams), rather than observing the bulk properties of the solid. That is, EDM gives both the advantage of measuring with large sample sizes (as in solid-state measurements), and the advantage of applying precise, shot-noise-limited spectroscopic techniques (as used in the most precise measurements of [6,7,22]).
A previous suggestion [23] of using molecules in inert-gas matrices for measurements of involved detection of a very small magnetization induced by the presence of in the of the molecule, assuming that the molecules are oriented by an external field. Here, we suggest a more standard approach to measuring using techniques similar to those used for molecular-beam measurements of (see, for example, References [22,24]). Other authors have explored [25] the possibility of using atoms within an inert-gas matrix to measure . Using atoms instead of molecules has the advantage of less complicated, and more easily calculated, quantum states, but has the drawback of the much smaller (of approximately 100 times the applied field [26]). Nonetheless, the possibility of using atoms may have to be reevaluated in light of the much larger applied electric fields recently demonstrated in Reference [14], although these fields will still lead to an of approximately 100 MV/cm, compared to the approximately 100 GV/cm fields obtained with polar molecules.
Some details of the proposed EDM method are outlined in the following section. However, many of the steps will need further development and experimental verification to prove the viability and strength of the EDM method for determining . The methods described are also well-suited to nuclear electric dipole measurements, as nuclear spin coherence times of well over 1 s can be obtained at low temperatures in bulk material [27], and we would expect even longer times within inert-gas matrices.
2. Components for the EDM Method
2.1. Inert-Gas Solids
The solid state of inert gases has been studied for over a century, and their properties (see, for example, [28]) are well known. The inert solids most commonly used for matrix studies (Ne, Ar, Kr and Xe) all have face-centered-cubic (fcc) structure, with the cube sizes being 4.5, 5.3, 5.6, and 6.1 Angstroms, respectively. They have melting points of 24.5, 83.8, 115.9, and 165.1 K, and all have extremely low vapor pressures if cooled to temperatures of a few kelvin or lower. Single crystals of a cubic centimeter or larger [29,30] have been produced. Bulk solids have been shown to sustain fields of over 10 kV/cm [31] without arcing, and fields as large as 3 MV/cm have been successfully applied to thin films [14].
2.2. The Study of Molecules Trapped in an Inert-Gas Solid
Inert-gas matrices have proven to be very useful (for example, References [32,33,34,35,36]) for studying molecules trapped within them—particularly reactive molecules, since the individual molecules can be isolated by the matrix. Because the lattice is transparent, the trapped molecules can be excited with lasers and fluorescence can be observed. Although the presence of the inert-gas matrix broadens the spectral lines, resolutions of 0.1 to 1 cm, or better (for example, References [14,34,37]), are still possible for vibrational transitions. The matrix can suppress [38,39] molecular rotations, leaving molecules librating about a preferred direction. Electron spin resonance spectroscopy (see, for example, [40]) has been routinely used to study matrix-trapped molecules. Optically pumped rubidium atoms within an inert-gas matrix [13] show that electron spin polarization can be maintained for a coherence time of up to 0.1 s.
2.3. Oriented Polar Molecules within an Inert-Gas Lattice
Polar molecules are particularly suited to being trapped in an inert-gas matrix. The strong interaction between the polarizable inert-gas atoms of the matrix and the two charges within the (typically ionically bonded) polar molecule serves to clamp the position of the polar molecule, as well as inhibiting its rotational motion.
Recently, Park, et al. [14] have demonstrated that embedded polar molecules within solid Ar, can be fully oriented by an externally applied electric field. They demonstrated complete orientation with CHO, HCl, and HO molecules embedded at a concentration of approximately 1:1000 within a 7-kelvin Ar solid. The field required for complete orientation was approximately 1 MV/cm, and they showed that the fractional orientation of the sample follows a thermodynamic model, which predicts that the applied electric field required is proportional to the temperature of the matrix divided by the dipole moment of the polar molecule. At colder temperatures, such as those available from a pumped liquid helium (∼1 K) or a dilution refrigerator (∼100 mK), the field needed for complete alignment would be expected to be correspondingly smaller.
Park et al. [14] produced the 1 MV/cm fields using the recently developed technique [15] of ice-film nanocapacitors, in which cesium ions are deposited on top of a 300-nm-thick film (grown on a cryogenic platinum substrate) that consisted of solid argon (with embedded polar molecules) sandwiched between two layers of DO. The number of polar molecules in their sample was approximately 10 per mm, and, at this concentration, they found that monomers strongly dominate over multimers. With areas of a square centimeter, or more, and with scaling to thicker films, one could imagine doing an EDM experiment with as many as polar molecules.
2.4. Choice of Polar Molecule
To measure , one needs a molecule that has at least one unpaired electron spin (which will precess under the combined magnetic and electric fields). For large , one needs a polar molecule in which the unpaired electron is as close as possible to one of the nuclei. This proximity to the nucleus requires a heavy atom with an unpaired electron in an s-orbital. Molecules that satisfy these criteria typically tend to be chemically reactive. Therefore, they are usually produced as molecular beams in a vacuum by methods ranging from laser ablation of solid precursors (ablated into an inert or reactive carrier gas stream [41,42]) to chemical reactions at high temperatures [43]. The EDM method is compatible with the production of molecules using such methods, as these molecular beams can be mixed into an inert-gas stream, which then impinges onto a cryogenic surface to grow an inert-gas crystal with embedded molecules.
An important advantage of the EDM scheme is that the trapping method is generic, and can be used with a wide variety of polar molecules, irrespective of their chemical stability. In particular, a range of molecules with similar chemical properties but large differences in their values of (e.g., YbF and HgF, as shown in Table 1), can be used as a powerful means of distinguishing systematic effects from a real signal. Such a study would be complicated by the requirement of a second set of lasers for the measurement, but may prove necessary for the improved precision suggested here.
A wish list for a molecule to be used in the EDM scheme includes a large value of and a large electric dipole moment. The latter is important to facilitate orientation in a smaller applied electric field. Additionally, a large difference between the ground-state electric dipole moment of the molecule and that in an excited state will lead to large Stark shifts of optical transitions between the two states, which could be used for selectively detecting molecules along a particular orientation. A large moment of inertia for the molecule is also desirable, since it will help to lock the molecule into a librator state. Table 1 lists for some candidate molecules that might be used in an EDM experiment. The list includes the radioactive molecule RaF since the EDM method is well-suited to experiments with radioactive molecules, and is compatible with their production from rare-isotope beam sources.
2.5. The Time Sequence for EDM
The envisioned EDM experiment would use cold polar molecules from a cryogenic buffer-gas beam source sprayed onto a cryogenic surface along with a steady stream of an inert gas (likely, neon or argon). Once polar molecules are oriented within the inert-gas matrix, the same set of molecules can be repeatedly used for EDM measurements.
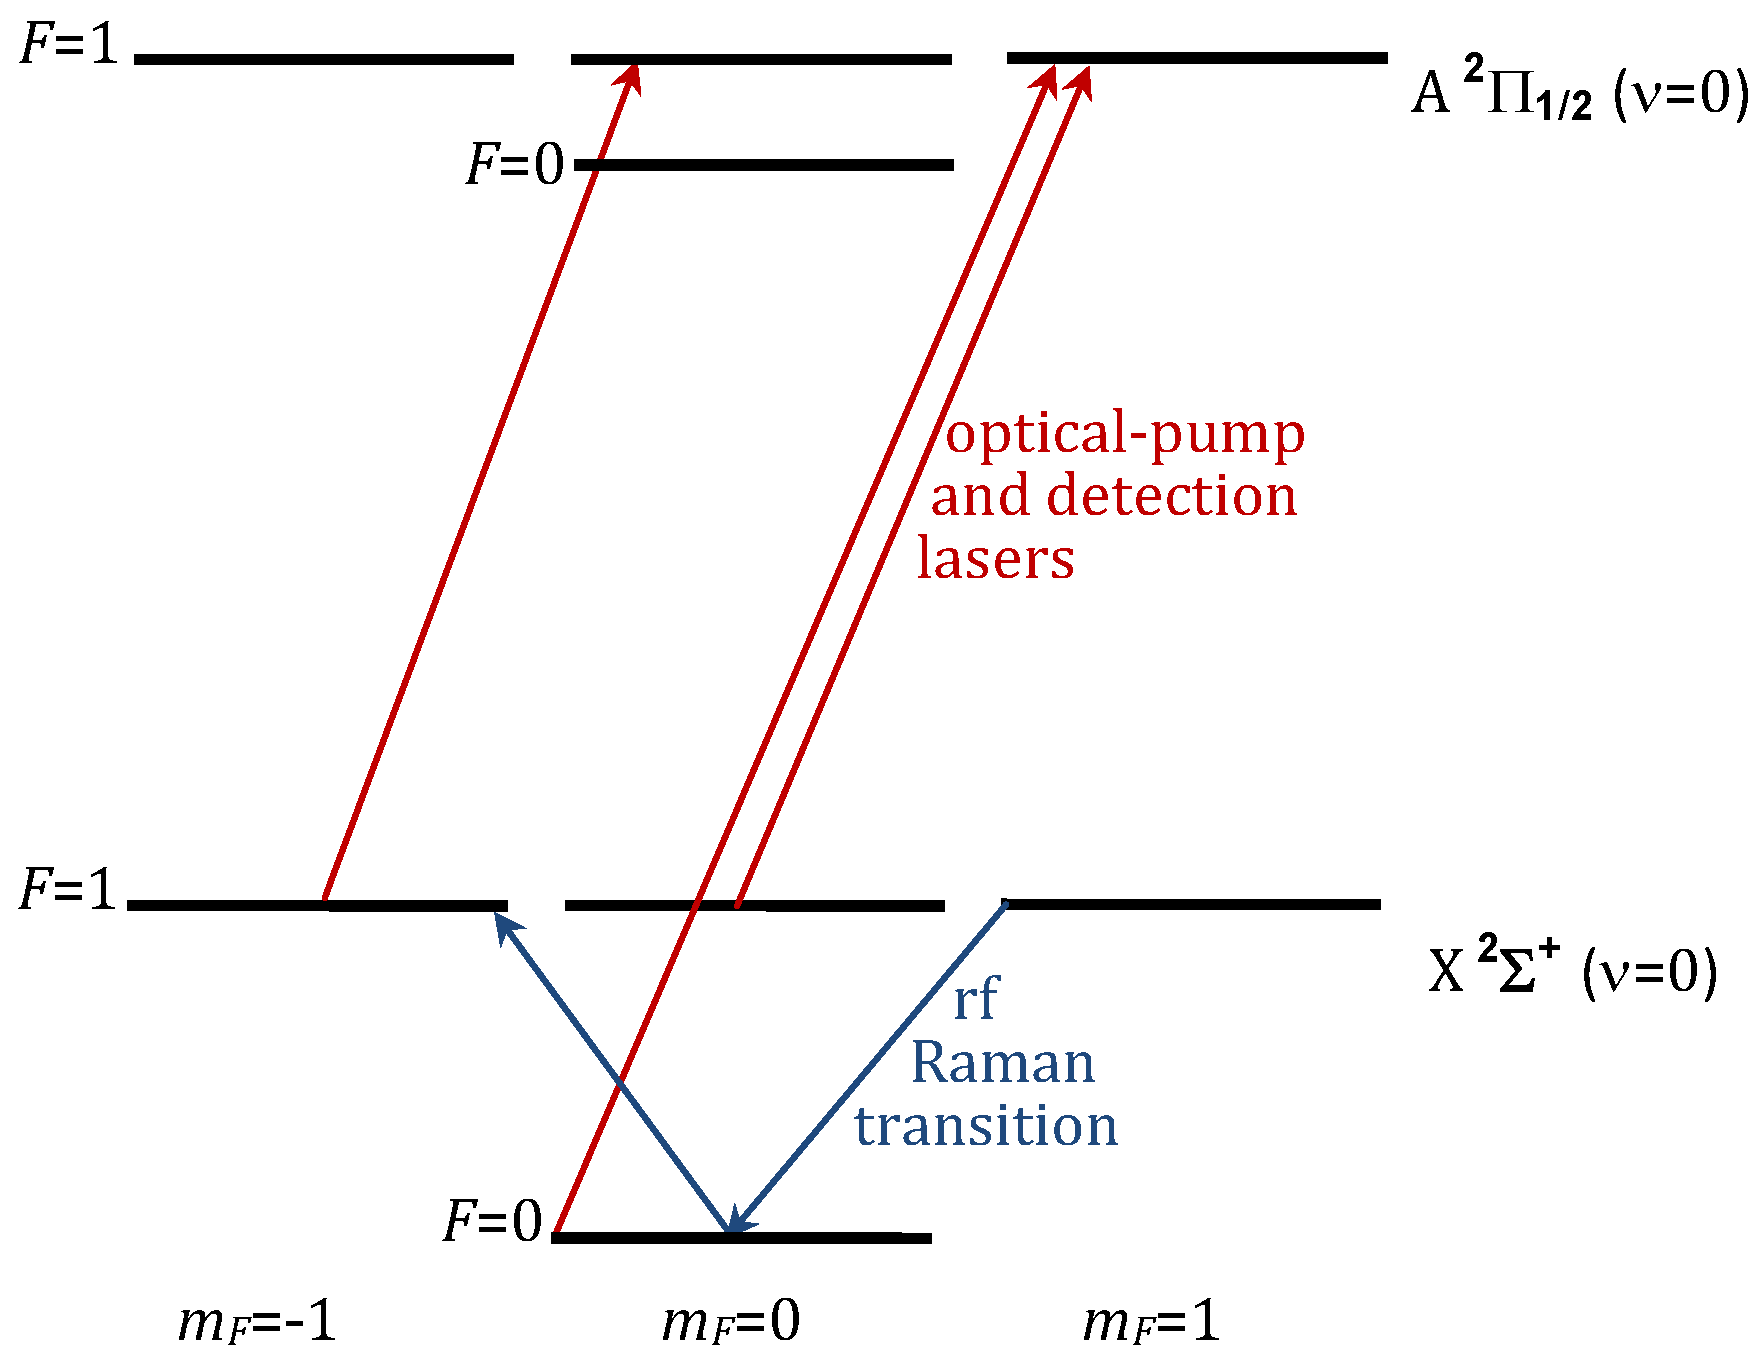
For simplicity, we describe a straightforward measurement sequence that would allow for an EDM measurement of , and we use the YbF molecule, to illustrate the sequence. The relevant energy structure for the oriented YbF molecule is shown in Figure 1.
At the cryogenic temperatures of the matrix, the molecules will be thermalized into the ground vibrational state, as well as into the lowest-energy librational state. (For the case of strongly-oriented molecules, the usual rotational states are replaced by more widely spaced librational states.) The X ground state of YbF has a total nuclear spin of 1/2 and a total electron spin of 1/2, giving hyperfine states with F = 0 and F = 1, as shown in Figure 1. In the first step of the measurement sequence, the oriented molecules are optically pumped into the F = 1, state using circularly polarized light tuned to the X ( = 0)-to-A ( = 0) transition. A pulsed laser (or other broadband source) is used to broaden the spectrum of the light so that it can communicate to both hyperfine levels, and to allow for any inhomogeneous broadening that might be caused by the matrix. Radiative decay paths to excited vibrational states are expected to be small, and molecules in the excited vibrational states will decay back to the ground vibrational state on the 10-ms time scale (or faster, due to the influence of the matrix).
The next step in the measurement sequence is a /2 pulse of radiofrequency driving the F = 1, = 1 to F = 1, = Raman transition (see Figure 1). This pulse creates an equal coherent superposition of the F = 1, and F = 1, states, which has an electron spin angular momentum oriented in the direction. This spin will precess for a time T due to an applied magnetic field in the direction and (if is nonzero) due to the aligned with , as described by Equation (1). Spin precession is observed routinely in matrix-trapped molecules in electron spin resonance spectroscopy (see, for example, [40]). The magnitude of the magnetic field used for the precession will depend on a number of factors, including the inhomogeneity of the field (caused, for example, by stray fields due to the substrate, or due to imperfect shielding) and the possible variation in the g factor (for example, at different sites in the lattice or due to lattice imperfections). The precession time T could be approximately 1 s. The best T to use would depend on the measured coherence time for the electron spin, but ∼1 s seems possible given that second-long coherence times were reported for cesium atomic spins in solid-helium crystals [11,12].
After precession, the spin direction could be detected by a combination of another rf Raman pulse, followed by a circularly-polarized detection laser and observation of the resulting fluorescence. A 3/2 rf Raman pulse would transfer an electron spin oriented along back into the F = 1, = 1 state, whereas it would transfer an electron spin oriented along into the F = 1, = state. Right-circular-polarized () laser light (see Figure 1) only excites molecules in the = state (i.e., the = 1 state is a dark state), and, therefore, observing the resulting fluorescence gives a measurement of the precession angle. An alternative to rf Raman pulses is to use optical pumping with laser pulses that are synchronized with the spin precession [48].
To determine , the measurement needs to be repeated with the relative direction of the electric and magnetic field reversed, to see if there is a difference in the precession. The details of the measurement technique employed in an EDM experiment would, of course, depend on the molecule used, and, more importantly, on the techniques needed to control possible systematic effects.
2.6. Orientation without an Electric Field
Because the interaction between the matrix and the polar molecule can inhibit rotation [17,18,38,39], it may be possible to find a polar molecule (and an inert gas) for which the orientation is sufficiently well locked to allow the orientation of the polar molecules to remain, after the external electric field that oriented them is turned off. The locked orientation might allow for an EDM measurement in the absence of an applied electric field, which would minimize any systematic effects associated with this electric field.
Furthermore, it may not even be necessary to apply an electric field to initially orient the molecules. In a single inert-gas crystal, the polar molecules prefer to align along a number of axes relative to the fcc matrix (as determined by the interaction between the dipole and the neighboring inert-gas atoms in the crystal). If the molecular orientation is sufficiently locked, molecules that start in one orientation will remain in that orientation, at least for the one second required to complete a measurement of . One could selectively perform a measurement on the molecules that are oriented along the -direction (chosen to be one of the preferred axes) by selectively detecting only molecules in this orientation, using the Stark shifts from an electric field applied during the detection step. The applied electric field need only be present during optical excitation of this detection step (and does not need to be present during the precession of the electron spin). Selective detection of -oriented molecules result from the fact that the Stark-shift rates are different for different orientations of the molecule. (For an applied field of 100 kV/cm, a typical polar molecule experiences shifts of between approximately −100 GHz and +100 GHz, depending on the orientation of the molecule relative to the applied field.) The detection laser would be tuned to the Stark-shifted frequency of the -oriented molecules to select only these molecules, and therefore only record the precession for those electrons that experience an in this direction.
Being able to separately access molecules oriented in the and directions allows for an excellent co-magnetometer for the measurement. Since both molecules are simultaneously co-located within the same inert-gas matrix, the difference between the precession angles for the two orientations gives a measure of that properly eliminates the effects of temporal and spatial variations of the magnetic field.
3. Potential Advantages of the EDM Method
The main advantage of the EDM method is the large number of molecules that can be embedded into the matrix, and the long interaction times possible for these trapped molecules, along with the large effective electric field that is available with polar molecules. That is, EDM can allow for large N, T and in Equation (2), allowing for a large improvement in the statistical uncertainty of a measurement.
Other potential advantages of EDM involve the control of systematic effects. Because the crystal is built out of an inert gas, it can be produced with ultrahigh purity compared to ordinary solid-state hosts. Additionally, the measurement can easily be repeated with different inert gases, and with different distances between the polar molecules, in order to study systematic effects. Similarly, the substrate on which the gas is frozen, which could be an important contributor to decoherence and systematic effects, could be varied. The substrate (and any impurities in the substrate) will likely have to be within micrometers of the polar molecules. Magnetic Johnson noise from conducting substrates could be important (for this, low temperatures and resistive substrates would be better), and impurities (including nuclear spins) in the substrate can lead to decoherence. A material such as isotopically pure silicon or diamond might be necessary in order to obtain a mechanically and magnetically clean substrate. Finally, we propose to also use a second molecule (possibly co-located in the same inert-gas matrix and measured simultaneously) as a further test against systematics.
Another advantage of EDM is the small volume in which the molecules are contained. The small volume will allow for efficient collection and detection of fluorescence. It will also allow for easier magnetic shielding, and could allow for the magnetic coils producing the fields to be mechanically rotated to reverse the field (in addition to reversing the field by reversing the current). The thin film envisioned for the measurement would minimize the effect of magnetic fields caused by leakage currents. These fields, if they have a component along , can mimic the effect of an electron electric dipole moment. Here, this effect should be minimal, since only a small amount of charge is needed to create the fields, and, even if it did leak across the sample, it would be expected to take an approximately direct path across the film. Thus, any potential leakage current would be small, and the migrating charges would be expected to travel almost parallel to the z-direction, leading to an insignificant component of magnetic field along .
The possibility of having the precession take place without an applied electric field could be a powerful weapon against electric-field induced systematic effects, as well as providing orientation reversal without electric field reversal (even for molecules that do not have -doublets [49,50]), simply by separately detecting the interspersed and oriented molecules (by a small tuning of the detection laser).
Although the prospects for the control of systematic effects seem hopeful, clearly, further very careful studies of possible systematic effects will have to be performed when implementing the EDM method.
4. Conclusions
We propose the use of oriented polar molecules in inert-gas matrices as a pathway to improving the experimental limit on the electric dipole moment of the electron. Our proposed method relies on demonstrated techniques, and holds tremendous promise for improving the statistical sensitivity of an electron electric dipole moment experiment. At the same time, the method offers a number of advantageous features for suppressing systematic errors. Improved measurements of this moment would provide strong input for beyond the Standard Model theories of high-energy physics.
Acknowledgments
This workl is supported by NSERC, CRC, CFI and ORF.
Author Contributions
The authors contributed equally to this work.
Conflicts of Interest
The authors declare no conflict of interest.
References
- Pospelov, M.; Ritz, A. CKM benchmarks for electron electric dipole moment experiments. Phys. Rev. D 2014, 89, 056006. [Google Scholar] [CrossRef]
- Pospelov, M.E.; Khriplovich, I.B. Electric dipole moment of the W boson and the electron in the Kobayashi-Maskawa model. Yad. Fiz. 1991, 53, 1030–1033. [Google Scholar]
- Booth, M. The electric dipole moment of the W and electron in the standard model. arXiv, 1993; arXiv:hep-ph/9301293. [Google Scholar]
- Ibrahim, T.; Itani, A.; Nath, P. Electron electric dipole moment as a sensitive probe of PeV scale physics. Phys. Rev. D 2014, 90, 055006. [Google Scholar] [CrossRef]
- McKeen, D.; Pospelov, M.; Ritz, A. Electric dipole moment signatures of PeV-scale superpartners. Phys. Rev. D 2013, 87, 113002. [Google Scholar] [CrossRef]
- Baron, J.; Campbell, W.C.; DeMille, D.; Doyle, J.M.; Gabrielse, G.; Gurevich, Y.V.; Hess, P.W.; Hutzler, N.R.; Kirilov, E.; Kozyryev, I.; et al. Order of magnitude smaller limit on the electric dipole moment of the electron. Science 2014, 343, 269. [Google Scholar] [PubMed]
- Cairncross, W.B.; Gresh, D.N.; Grau, M.; Cossel, K.C.; Roussy, T.S.; Ni, Y.; Zhou, Y.; Ye, J.; Cornell, E.A. A precision measurement of the electron’s electric dipole moment using trapped molecular ions. Phys. Rev. Lett. 2017, 119, 153001. [Google Scholar] [CrossRef] [PubMed]
- Leanhardt, A.E.; Bohn, J.L.; Loh, H.; Maletinsky, P.; Meyer, E.R.; Sinclair, L.C.; Stutz, R.P.; Cornell, E.A. High-resolution spectroscopy on trapped molecular ions in rotating electric fields: A new approach for measuring the electron electric dipole moment. J. Mol. Spectrosc. 2011, 270, 1–25. [Google Scholar] [CrossRef]
- Tarbutt, M.R.; Sauer, B.E.; Hudson, J.J.; Hinds, E.A. Design for a fountain of YbF molecules to measure the electron’s electric dipole moment. New J. Phys. 2013, 15, 053034. [Google Scholar] [CrossRef]
- Hunter, L.R.; Peck, S.K.; Greenspon, A.S.; Alam, S.S.; DeMille, D. Prospects for laser cooling TlF. Phys. Rev. A 2012, 85, 012511. [Google Scholar] [CrossRef]
- Arndt, M.; Kanorsky, S.I.; Weis, A.; Hänsch, T.W. Long electronic spin relaxation times of Cs atoms in solid 4He. Phys. Rev. Lett. 1995, 74, 1359. [Google Scholar] [CrossRef] [PubMed]
- Kanorsky, S.I.; Lang, S.; Lücke, S.; Ross, S.B.; Hänsch, T.W.; Weis, A. Millihertz magnetic resonance spectroscopy of Cs atoms in body-centered-cubic 4He. Phys. Rev. A 1996, 54, R1010–R1013. [Google Scholar] [CrossRef] [PubMed]
- Kanagin, A.N.; Regmi, S.K.; Pathak, P.; Weinstein, J.D. Optical pumping of rubidium atoms frozen in solid argon. Phys. Rev. A 2013, 88, 063404. [Google Scholar] [CrossRef]
- Park, Y.; Kang, H.; Kang, H. Brute force orientation of matrix-isolated molecules: Reversible reorientation of formaldehyde in an argon matrix toward perfect alignment. Angew. Chem. 2017, 56, 1046–1049. [Google Scholar] [CrossRef] [PubMed]
- Shin, S.; Kim, Y.; Moon, E.; Lee, D.H.; Kang, H.; Kang, H. Generation of strong electric fields in an ice film capacitor. J. Chem. Phys. 2013, 139, 074201. [Google Scholar] [CrossRef] [PubMed]
- Lemeshko, M.; Krems, R.V.; Doyle, J.M.; Kais, S. Manipulation of molecules with electromagnetic fields. Mol. Phys. 2013, 111, 1648. [Google Scholar] [CrossRef]
- Flygare, W.H. Molecular rotation in the solid state. Theory of rotation of trapped molecules in rare gas lattices. J. Chem. Phys. 1963, 39, 2263. [Google Scholar] [CrossRef]
- Kiljunen, T.; Schmidt, B.; Schwentner, N. Aligning and orienting molecules trapped in octahedral crystal fields. Phys. Rev. A 2005, 72, 053415. [Google Scholar] [CrossRef]
- Heidenreich, B.J.; Elliott, O.T.; Charney, N.D.; Virgien, K.A.; Bridges, A.W.; McKeon, M.A.; Peck, S.K.; Krause, D.; Gordon, J.E.; Hunter, L.R.; et al. Limit on the electron electric dipole moment in gadolinium-iron garnet. Phys. Rev. Lett. 2005, 95, 253004. [Google Scholar] [CrossRef] [PubMed]
- Kim, Y.J.; Liu, C.-Y.; Lamoreaux, S.K.; Visser, G.; Kunkler, B.; Matlashov, A.N.; Long, J.C.; Reddy, T.G. New experimental limit on the electric dipole moment of the electron in a paramagnetic insulator. Phys. Rev. D 2015, 91, 102004. [Google Scholar] [CrossRef]
- Lamoreaux, S.K. Solid-state systems for the electron electric dipole moment and other fundamental measurements. Phys. Rev. A 2002, 66, 022109. [Google Scholar] [CrossRef]
- Hudson, J.J.; Kara, D.M.; Smallman, I.J.; Sauer, B.E.; Tarbutt, M.R.; Hinds, E.A. Improved measurement of the shape of the electron. Nature 2011, 473, 493–496. [Google Scholar] [CrossRef] [PubMed]
- Kozlov, M.G.; Derevianko, A. Proposal for a sensitive search for the electric dipole moment of the electron with matrix-isolated radicals. Phys. Rev. Lett. 2006, 97, 063001. [Google Scholar] [CrossRef] [PubMed]
- Kara, D.M.; Smallman, I.J.; Hudson, J.J.; Sauer, B.E.; Tarbutt, M.R.; Hinds, E.A. Measurement of the electron’s electric dipole moment using YbF molecules: Methods and data analysis. New J. Phys. 2012, 14, 103051. [Google Scholar] [CrossRef]
- Weis, A.; Kanorsky, S.; Lang, S.; Hänsch, T.W. Can atoms trapped in solid helium be used to search for physics beyond the standard model? In Atomic Physics Methods in Modern Research; Springer: Berlin, Germany, 1997; pp. 57–75. [Google Scholar]
- Nataraj, H.S.; Sahoo, B.K.; Das, B.P.; Mukherjee, D. Intrinsic electric dipole moments of paramagnetic atoms: rubidium and cesium. Phys. Rev. Lett. 2008, 101, 033002. [Google Scholar] [CrossRef] [PubMed]
- Zhong, M.; Hedges, M.P.; Ahlefeldt, R.L.; Bartholomew, J.G.; Beavan, S.E.; Wittig, S.M.; Longdell, J.J.; Sellars, M.J. Optically addressable nuclear spins in a solid with a six-hour coherence time. Nature 2015, 517, 177–180. [Google Scholar] [CrossRef] [PubMed]
- Pollack, G.L. The solid state of rare gases. Rev. Mod. Phys. 1964, 36, 748. [Google Scholar] [CrossRef]
- Endoh, Y.; Shirane, G.; Skalyo, J. Lattice dynamics of solid neon at 6.5 and 23.7 K. Phys. Rev. B 1975, 11, 1681. [Google Scholar] [CrossRef]
- Berne, A.; Boato, G.; De Paz, M. Experiments on solid argon. Il Nuovo Cimento B 1966, 46, 182–209. [Google Scholar] [CrossRef]
- Eshchenko, D.G.; Storchak, V.G.; Brewer, J.H.; Morris, G.D.; Cottrell, S.P.; Cox, S.F.J. Excess electron transport and delayed muonium formation in condensed rare gases. Phys. Rev. B 2002, 66, 035105. [Google Scholar] [CrossRef]
- Mann, D.E. Infrared spectra of HCl, DCl, HBr, and DBr in solid rare-gas matrices. J. Chem. Phys. 1966, 44, 3453. [Google Scholar] [CrossRef]
- Van Zee, R.J.; Seely, M.L.; Weltner, W. YbH and YbD molecules: ESR and optical spectroscopy in argon matrices at 4 K. J. Chem. Phys. 1977, 67, 861. [Google Scholar] [CrossRef]
- Dubost, H. Infrared absorption spectra of carbon monoxide in rare gas matrices. Chem. Phys. 1976, 12, 139–151. [Google Scholar] [CrossRef]
- Knight, L.B., Jr.; Wise, M.B. The generation and ESR investigation of the BeF radical in rare gas matrices. J. Chem. Phys. 1980, 73, 4198. [Google Scholar] [CrossRef]
- Mason, M.G. Mid- and far-infrared spectra of HF and DF in rare-gas matrices. J. Chem. Phys. 1971, 54, 3491. [Google Scholar] [CrossRef]
- Lang, V.I.; Winn, J.S. Matrix-isolated OCS: The high resolution infrared spectra of a cryogenically solvated linear molecule. J. Chem. Phys. 1991, 94, 5270. [Google Scholar] [CrossRef]
- Kiljunen, T.; Schmidt, B. Alignment and orientation of molecules in matrices. Anal. Control Ultrafast Photoinduced React. 2007, 87, 337. [Google Scholar]
- Kiljunen, T.; Schmidt, B.; Schwentner, N. Time-dependent alignment of molecules trapped in octahedral crystal fields. J. Chem. Phys. 2006, 124, 164502. [Google Scholar] [CrossRef] [PubMed]
- Knight, L.B. ESR investigations of H2O+, HDO+, D2O+, and H217O+ isolated in neon matrices at 4 K. J. Chem. Phys. 1983, 78, 5940. [Google Scholar] [CrossRef]
- Tarbutt, M.R.; Hudson, J.J.; Sauer, B.E.; Hinds, E.A.; Ryzhov, V.A.; Ryabov, V.L.; Ezhov, V.F. A jet beam source of cold YbF radicals. J. Phys. B At. Mol. Opt. Phys. 2002, 35, 5013–5022. [Google Scholar] [CrossRef]
- Hutzler, N.R.; Parsons, M.F.; Gurevich, Y.V.; Hess, P.W.; Petrik, E.; Spaun, B.; Vutha, A.C.; DeMille, D.; Gabrielse, G.; Doyle, J.M. A cryogenic beam of refractory, chemically reactive molecules with expansion cooling. Phys. Chem. Chem. Phys. 2011, 13, 18976–18985. [Google Scholar] [CrossRef] [PubMed] [Green Version]
- West, E.; Baron, J.; Hutzler, N.; Ang, D.; Haefner, J.; Lasner, Z.; Panda, C.; West, A.; DeMille, D.; Gabrielse, G.; et al. Improved Thermochemical Beam Source of ThO for Measuring the Electric Dipole Moment of the Electron. Proceedings of APS Division of Atomic and Molecular Physics Meeting 2017, Sacramento, CA, USA, 5–9 June 2017. [Google Scholar]
- Abe, M.; Gopakumar, G.; Hada, M.; Das, B.P.; Tatewaki, H.; Mukherjee, D. Application of relativistic coupled-cluster theory to the effective electric field in YbF. Phys. Rev. A 2014, 90, 022501. [Google Scholar] [CrossRef]
- Prasannaa, V.S.; Vutha, A.C.; Abe, M.; Das, B.P. Mercury monohalides: Suitability for electron electric dipole moment searches. Phys. Rev. Lett. 2015, 114, 183001. [Google Scholar] [CrossRef] [PubMed]
- Sasmal, S.; Pathak, H.; Nayak, M.K.; Vaval, N.; Pal, S. Relativistic coupled-cluster study of RaF as a candidate for the parity- and time-reversal-violating interaction. Phys. Rev. A 2016, 93, 062506. [Google Scholar] [CrossRef]
- Lee, J.; Meyer, E.R.; Paudel, R.; Bohn, J.L.; Leanhardt, A.E. An electron electric dipole moment search in the X 3Δ1 ground state of tungsten carbide molecules. J. Mod. Opt. 2009, 56, 2005–2012. [Google Scholar] [CrossRef]
- Jacobs, J.P.; Klipstein, W.M.; Lamoreaux, S.K.; Heckel, B.R.; Fortson, E.N. Limit on the electric-dipole moment of 199Hg using synchronous optical pumping. Phys. Rev. A 1995, 52, 3521. [Google Scholar] [CrossRef] [PubMed]
- DeMille, D.; Bay, F.; Bickman, S.; Kawall, D.; Hunter, L.; Krause, D.; Maxwell, S.; Ulmer, K. Search for the electric dipole moment of the electron using metastable PbO. In Proceedings of the Conference on Art and Symmetry in Experimental Physics: Festschrift Commins (Eugene D), Berkeley, CA, USA, 20–21 May 2001. [Google Scholar]
- Eckel, S.; Hamilton, P.; Kirilov, E.; Smith, H.W.; DeMille, D. Search for the electron electric dipole moment using Ω-doublet levels in PbO. Phys. Rev. A 2013, 87, 052130. [Google Scholar] [CrossRef]
Figure 1.
(Color online) Energy-level diagram for relevant levels of YbF, as an illustration of how EDM could be implemented. The diagram is not to scale.
Figure 1.
(Color online) Energy-level diagram for relevant levels of YbF, as an illustration of how EDM could be implemented. The diagram is not to scale.


Table 1.
for some candidate molecules that could be used with the EDM method. Other molecules, including chlorides and oxides, would also be suitable for EDM.
© 2018 by the authors. Licensee MDPI, Basel, Switzerland. This article is an open access article distributed under the terms and conditions of the Creative Commons Attribution (CC BY) license (http://creativecommons.org/licenses/by/4.0/).
Share and Cite
MDPI and ACS Style
Vutha, A.C.; Horbatsch, M.; Hessels, E.A. Oriented Polar Molecules in a Solid Inert-Gas Matrix: A Proposed Method for Measuring the Electric Dipole Moment of the Electron. Atoms 2018, 6, 3. https://0-doi-org.brum.beds.ac.uk/10.3390/atoms6010003
AMA Style
Vutha AC, Horbatsch M, Hessels EA. Oriented Polar Molecules in a Solid Inert-Gas Matrix: A Proposed Method for Measuring the Electric Dipole Moment of the Electron. Atoms. 2018; 6(1):3. https://0-doi-org.brum.beds.ac.uk/10.3390/atoms6010003
Chicago/Turabian StyleVutha, A. C., M. Horbatsch, and E. A. Hessels. 2018. "Oriented Polar Molecules in a Solid Inert-Gas Matrix: A Proposed Method for Measuring the Electric Dipole Moment of the Electron" Atoms 6, no. 1: 3. https://0-doi-org.brum.beds.ac.uk/10.3390/atoms6010003
Note that from the first issue of 2016, this journal uses article numbers instead of page numbers. See further details here.