The Equivalent Circuit Approach for the Electrical Diagnostics of Dielectric Barrier Discharges: The Classical Theory and Recent Developments


Abstract
:1. Introduction
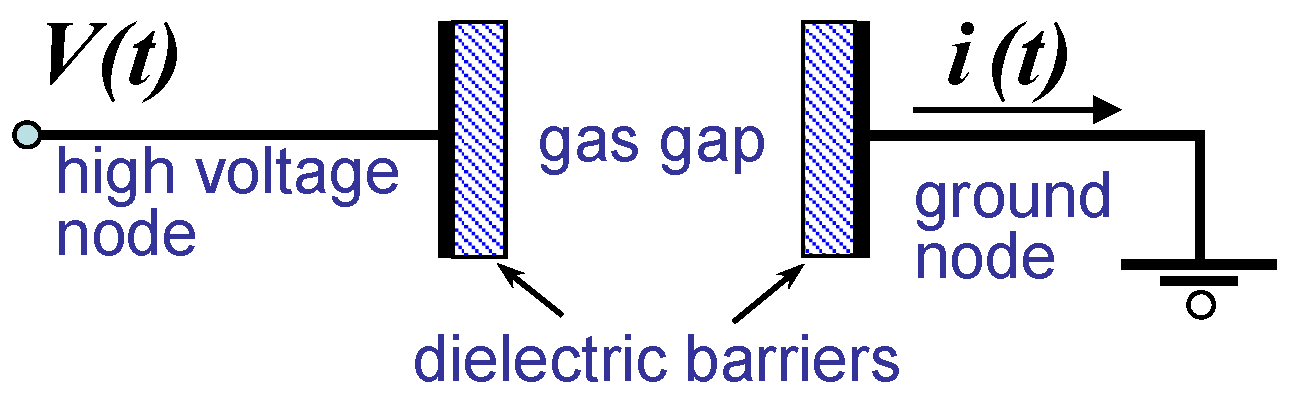
2. Basics of DBD Operation and Challenges for the Electric Diagnostics
3. The Classical Electrical Theory of Ozonizers
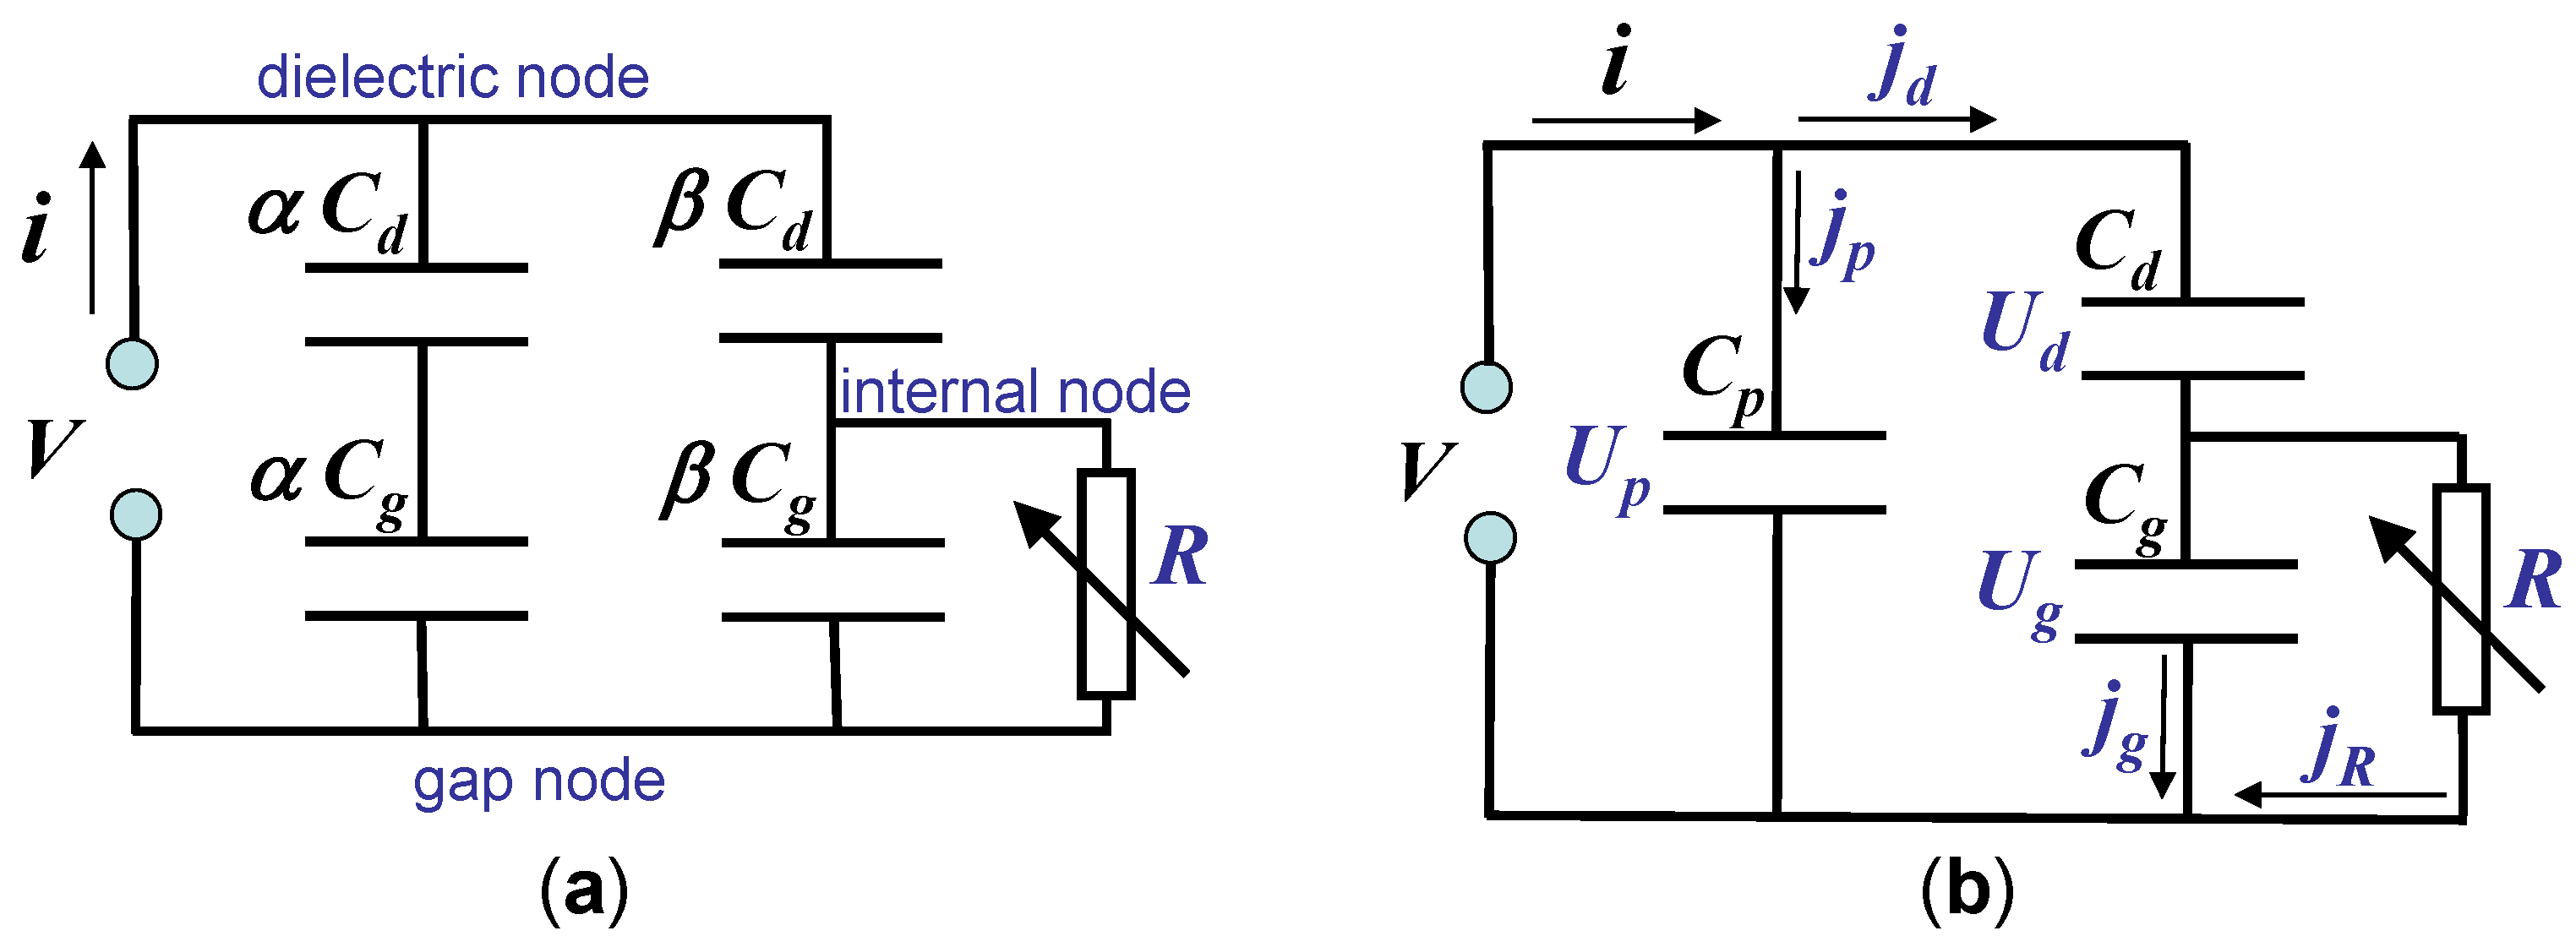
4. Suggestions for the Equivalent Circuit Approach
5. Revision of the Equivalent Circuit Approach and the Classical Electrical Theory of Ozonizers
5.1. Validity of the Equivalent Circuit Approach
5.2. Determination of and
5.3. Discharge Current
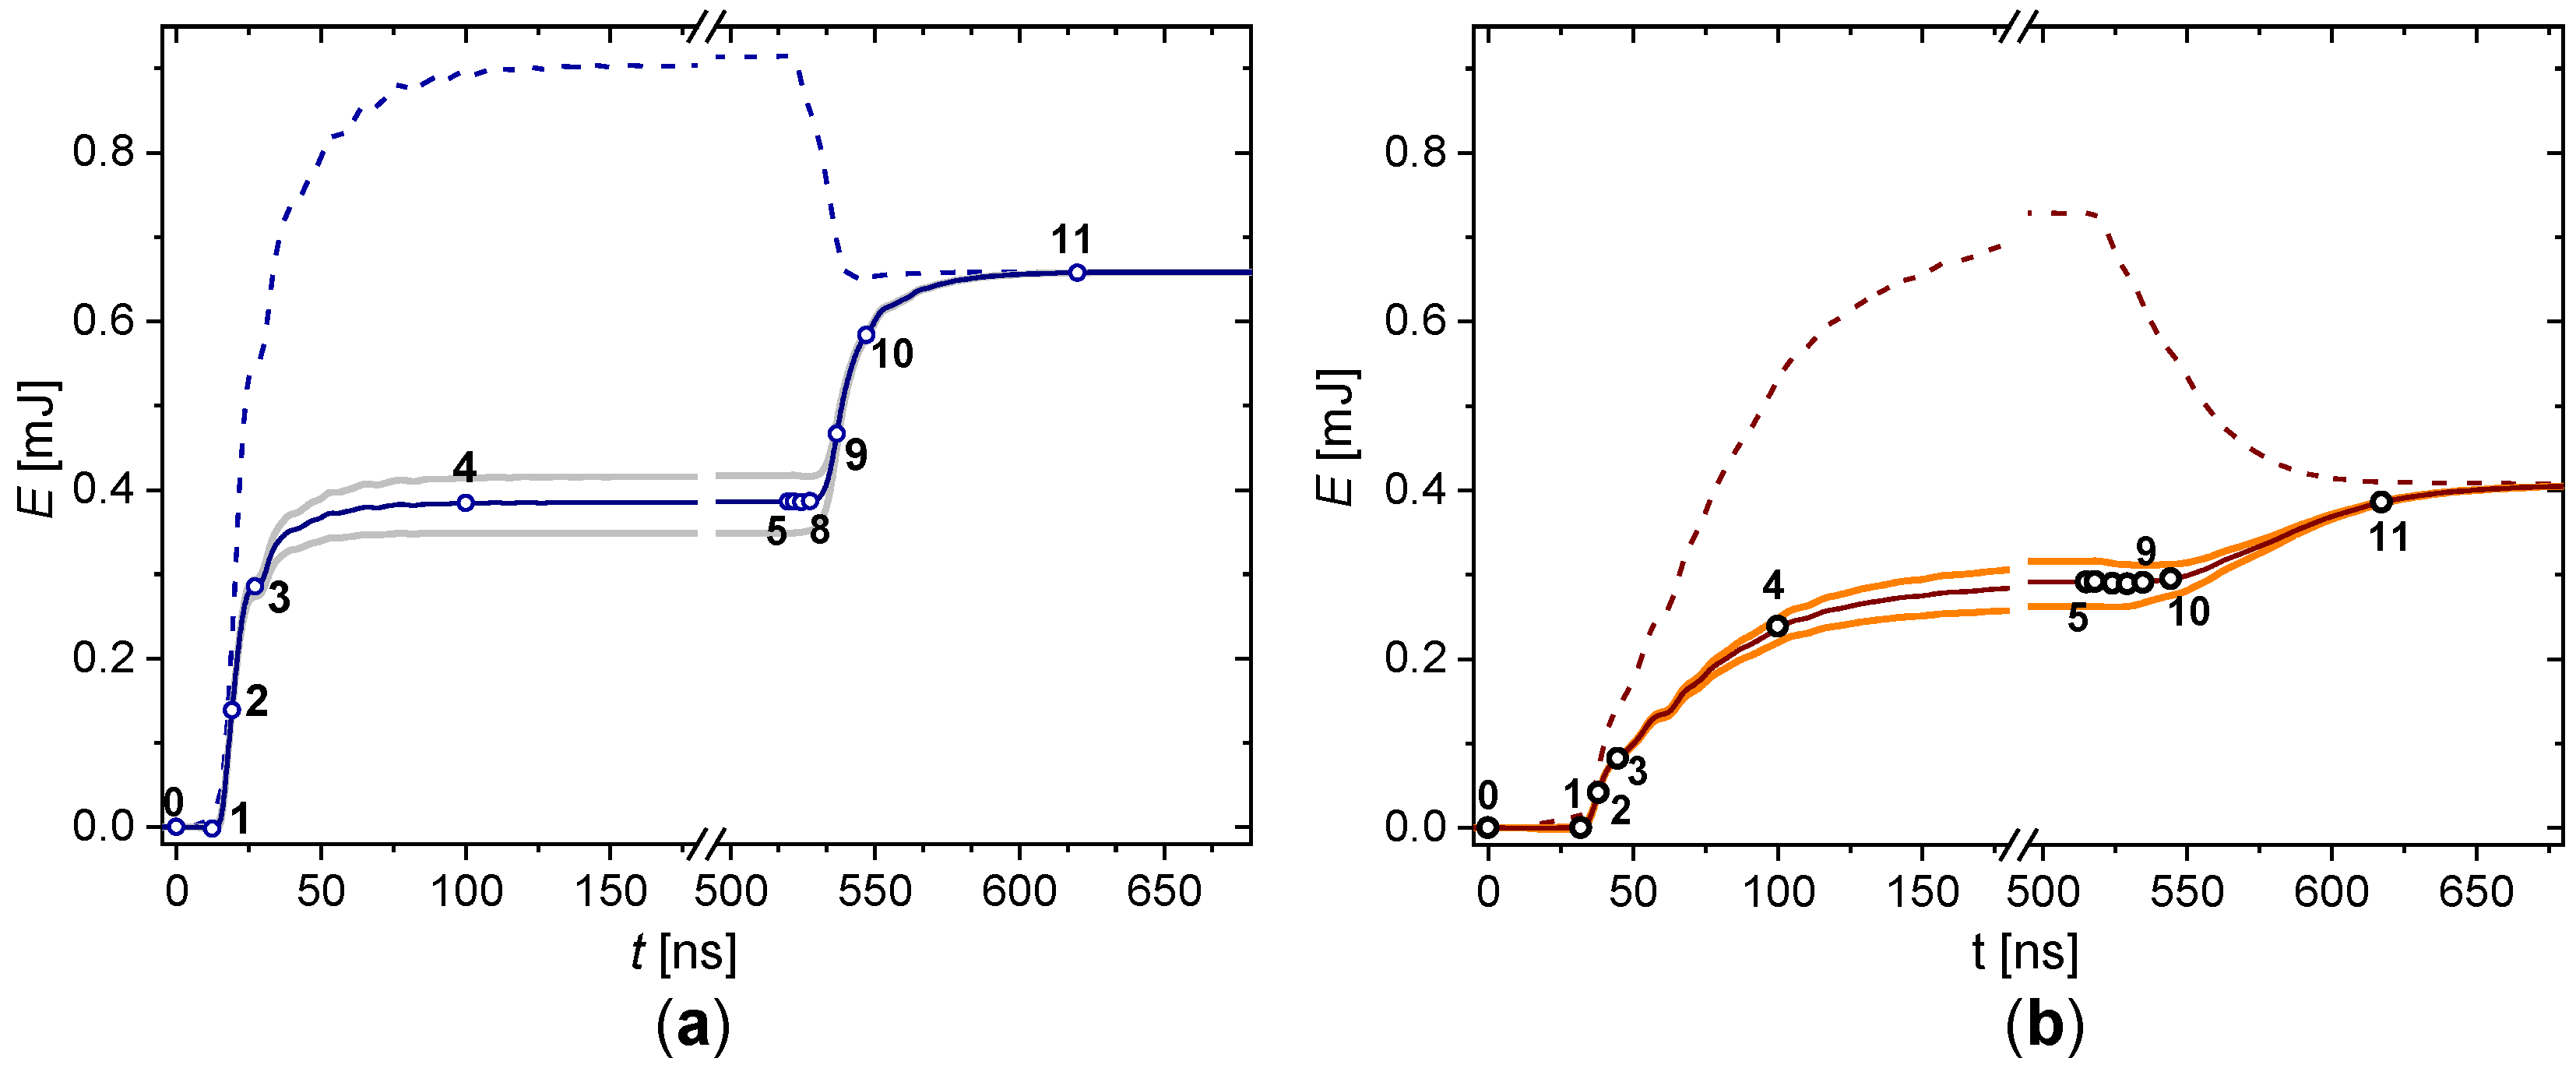
5.4. Dissipated Energy and Relevance of the Equivalent Circuit
6. Further Development of the Equivalent Circuit Approach and Open Questions
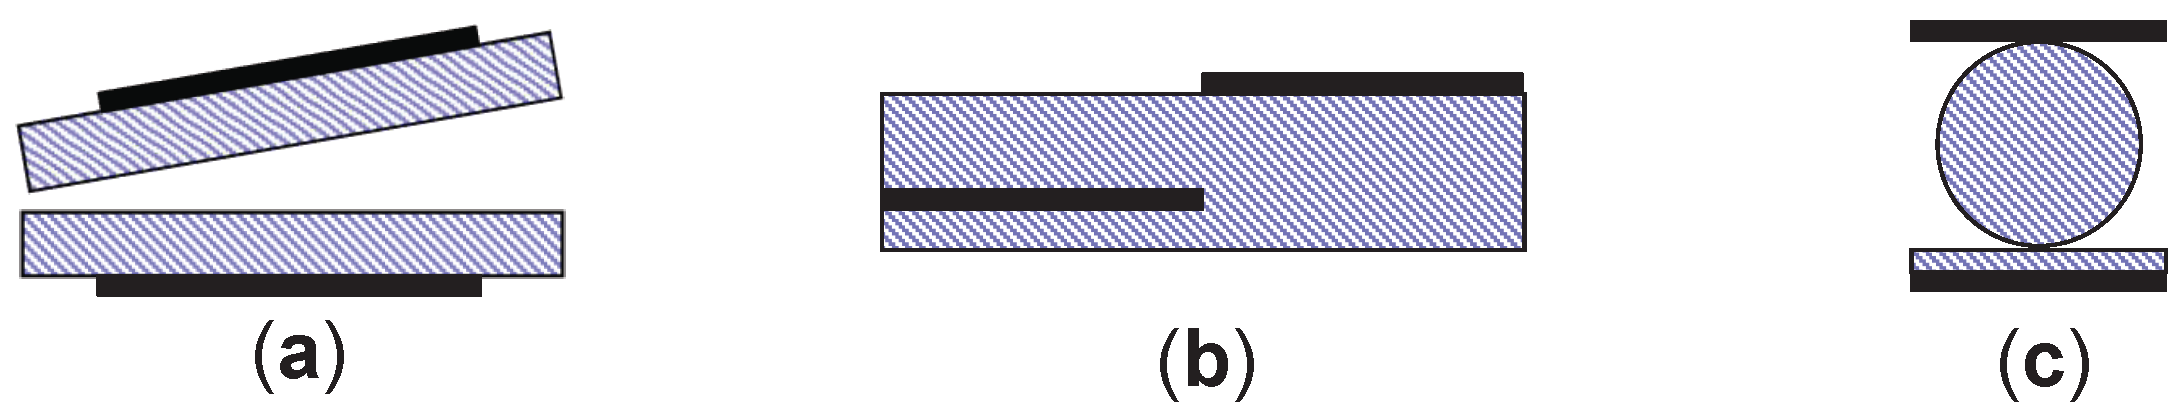
6.1. Discharge with Tilted Electrodes and Partial Discharging
6.2. Surface Discharge
6.3. Packed Bed Reactor
7. Summary
Author Contributions
Funding
Acknowledgments
Conflicts of Interest
Abbreviations
| DBD | dielectric barrier discharge |
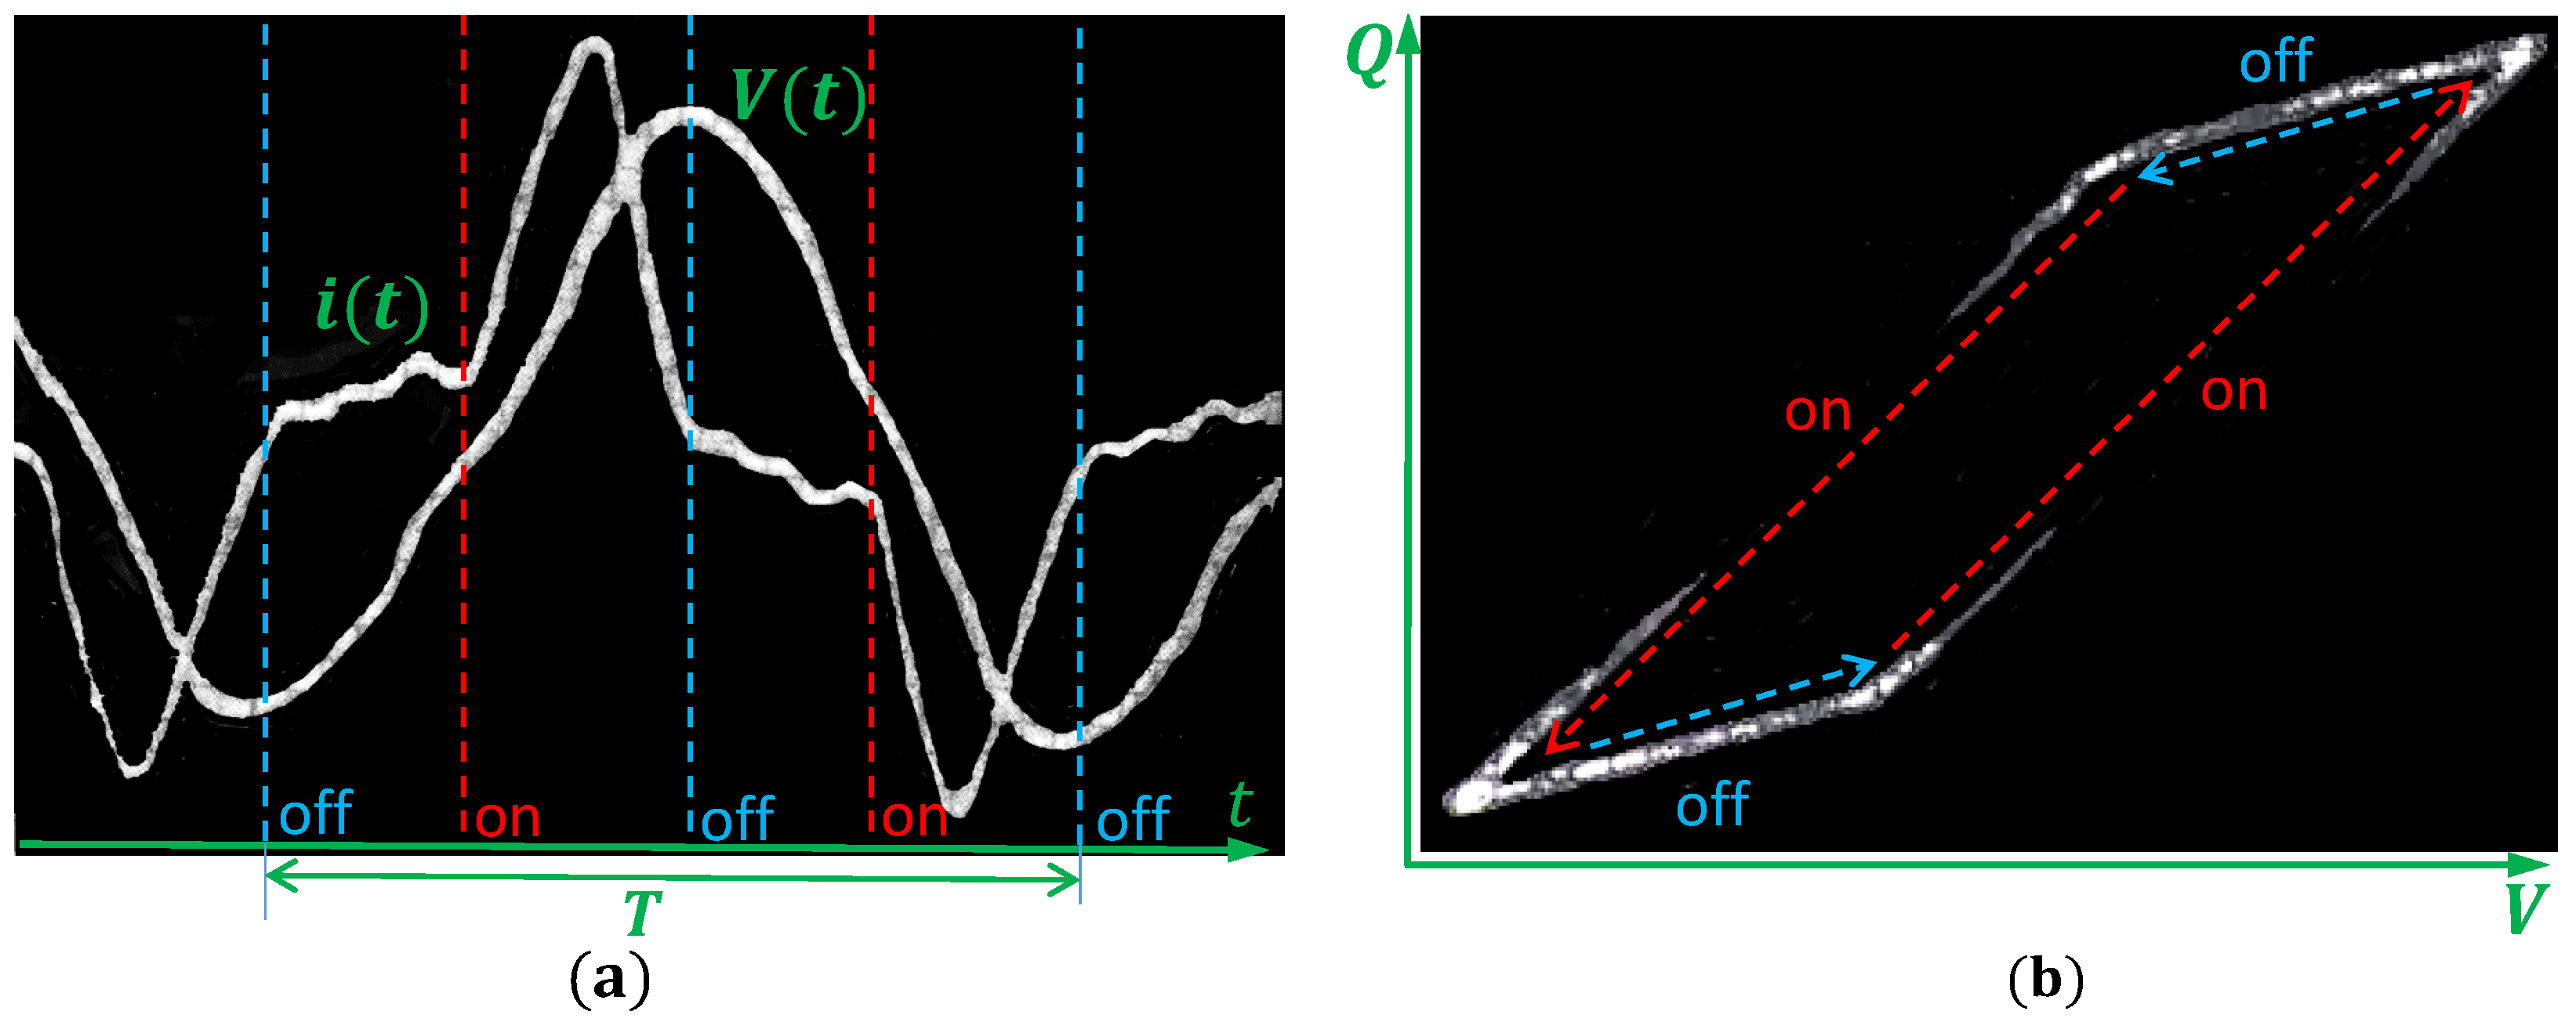
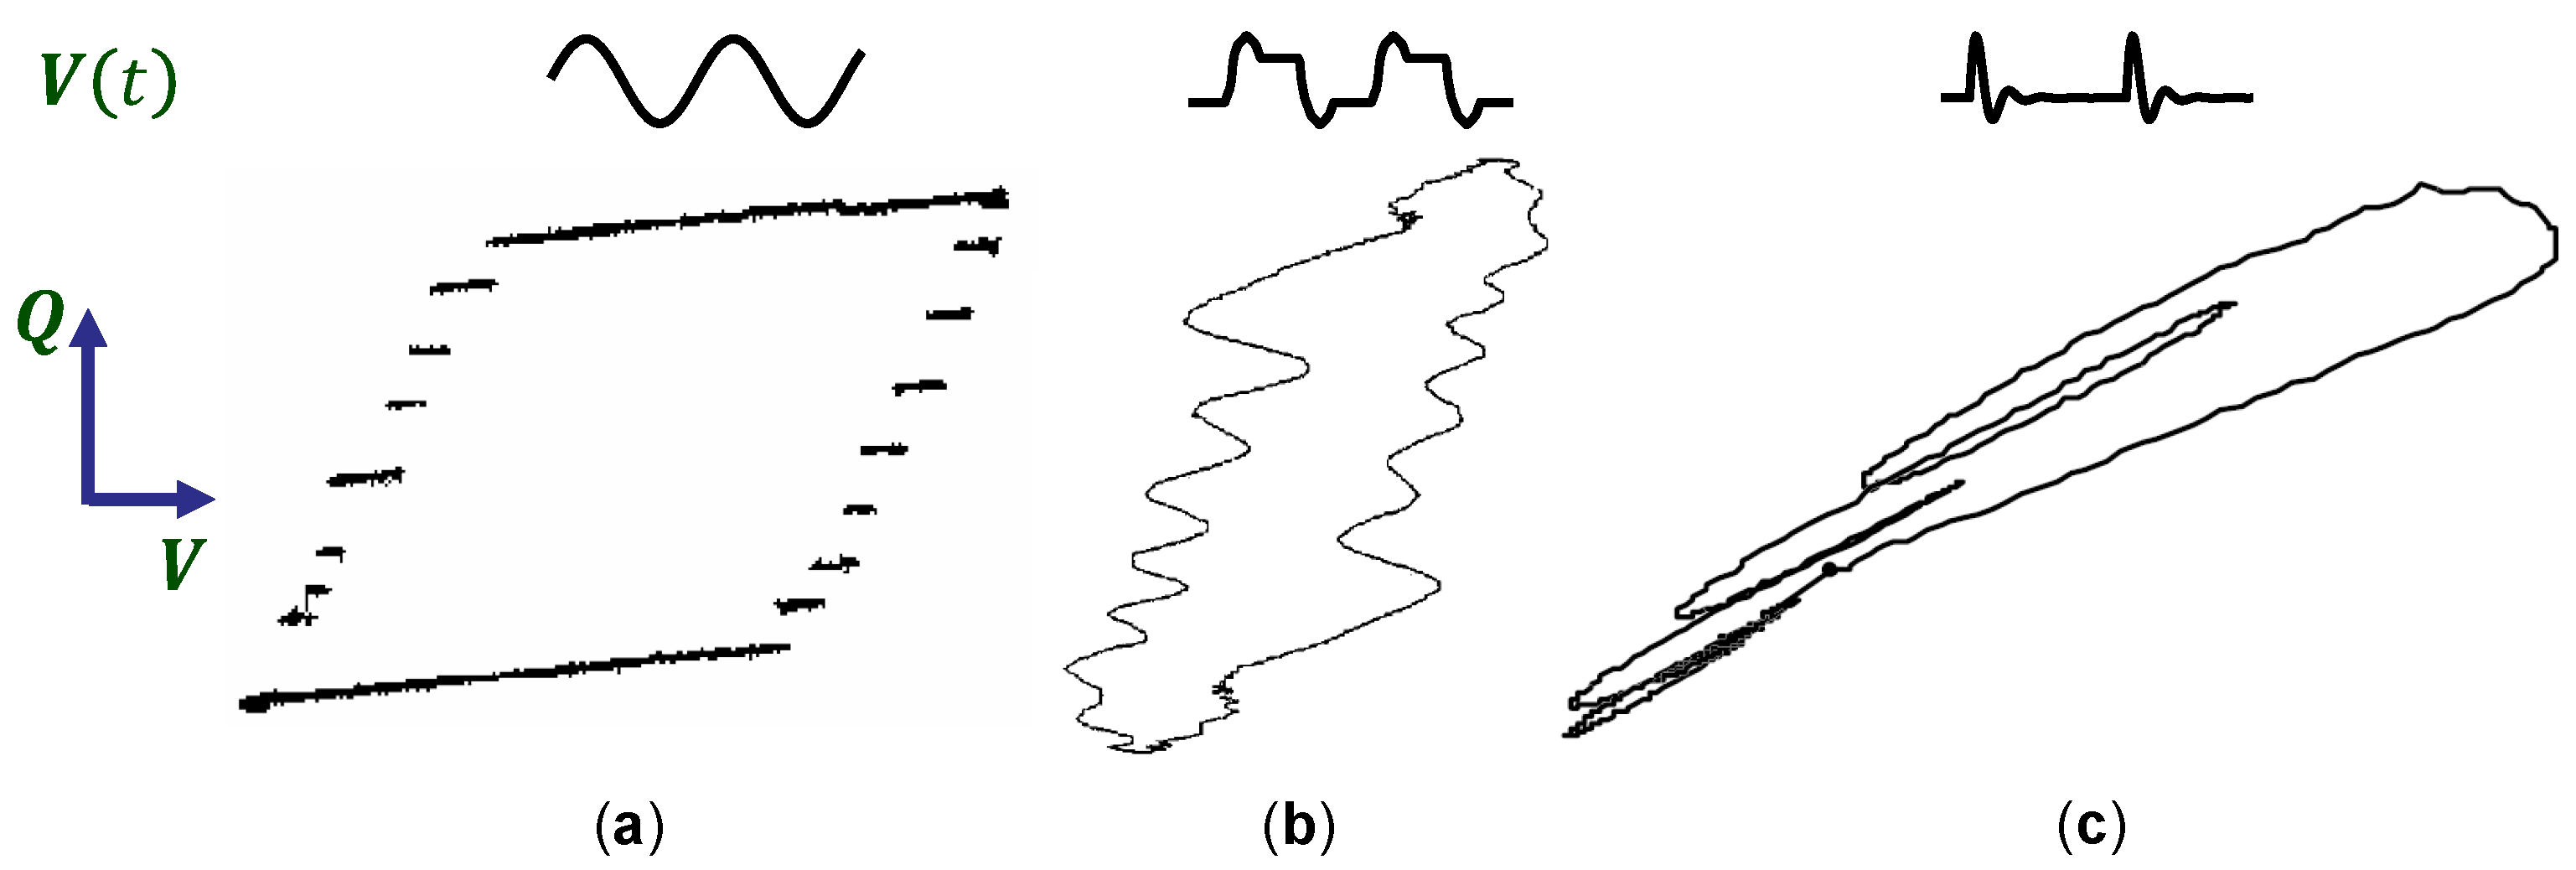
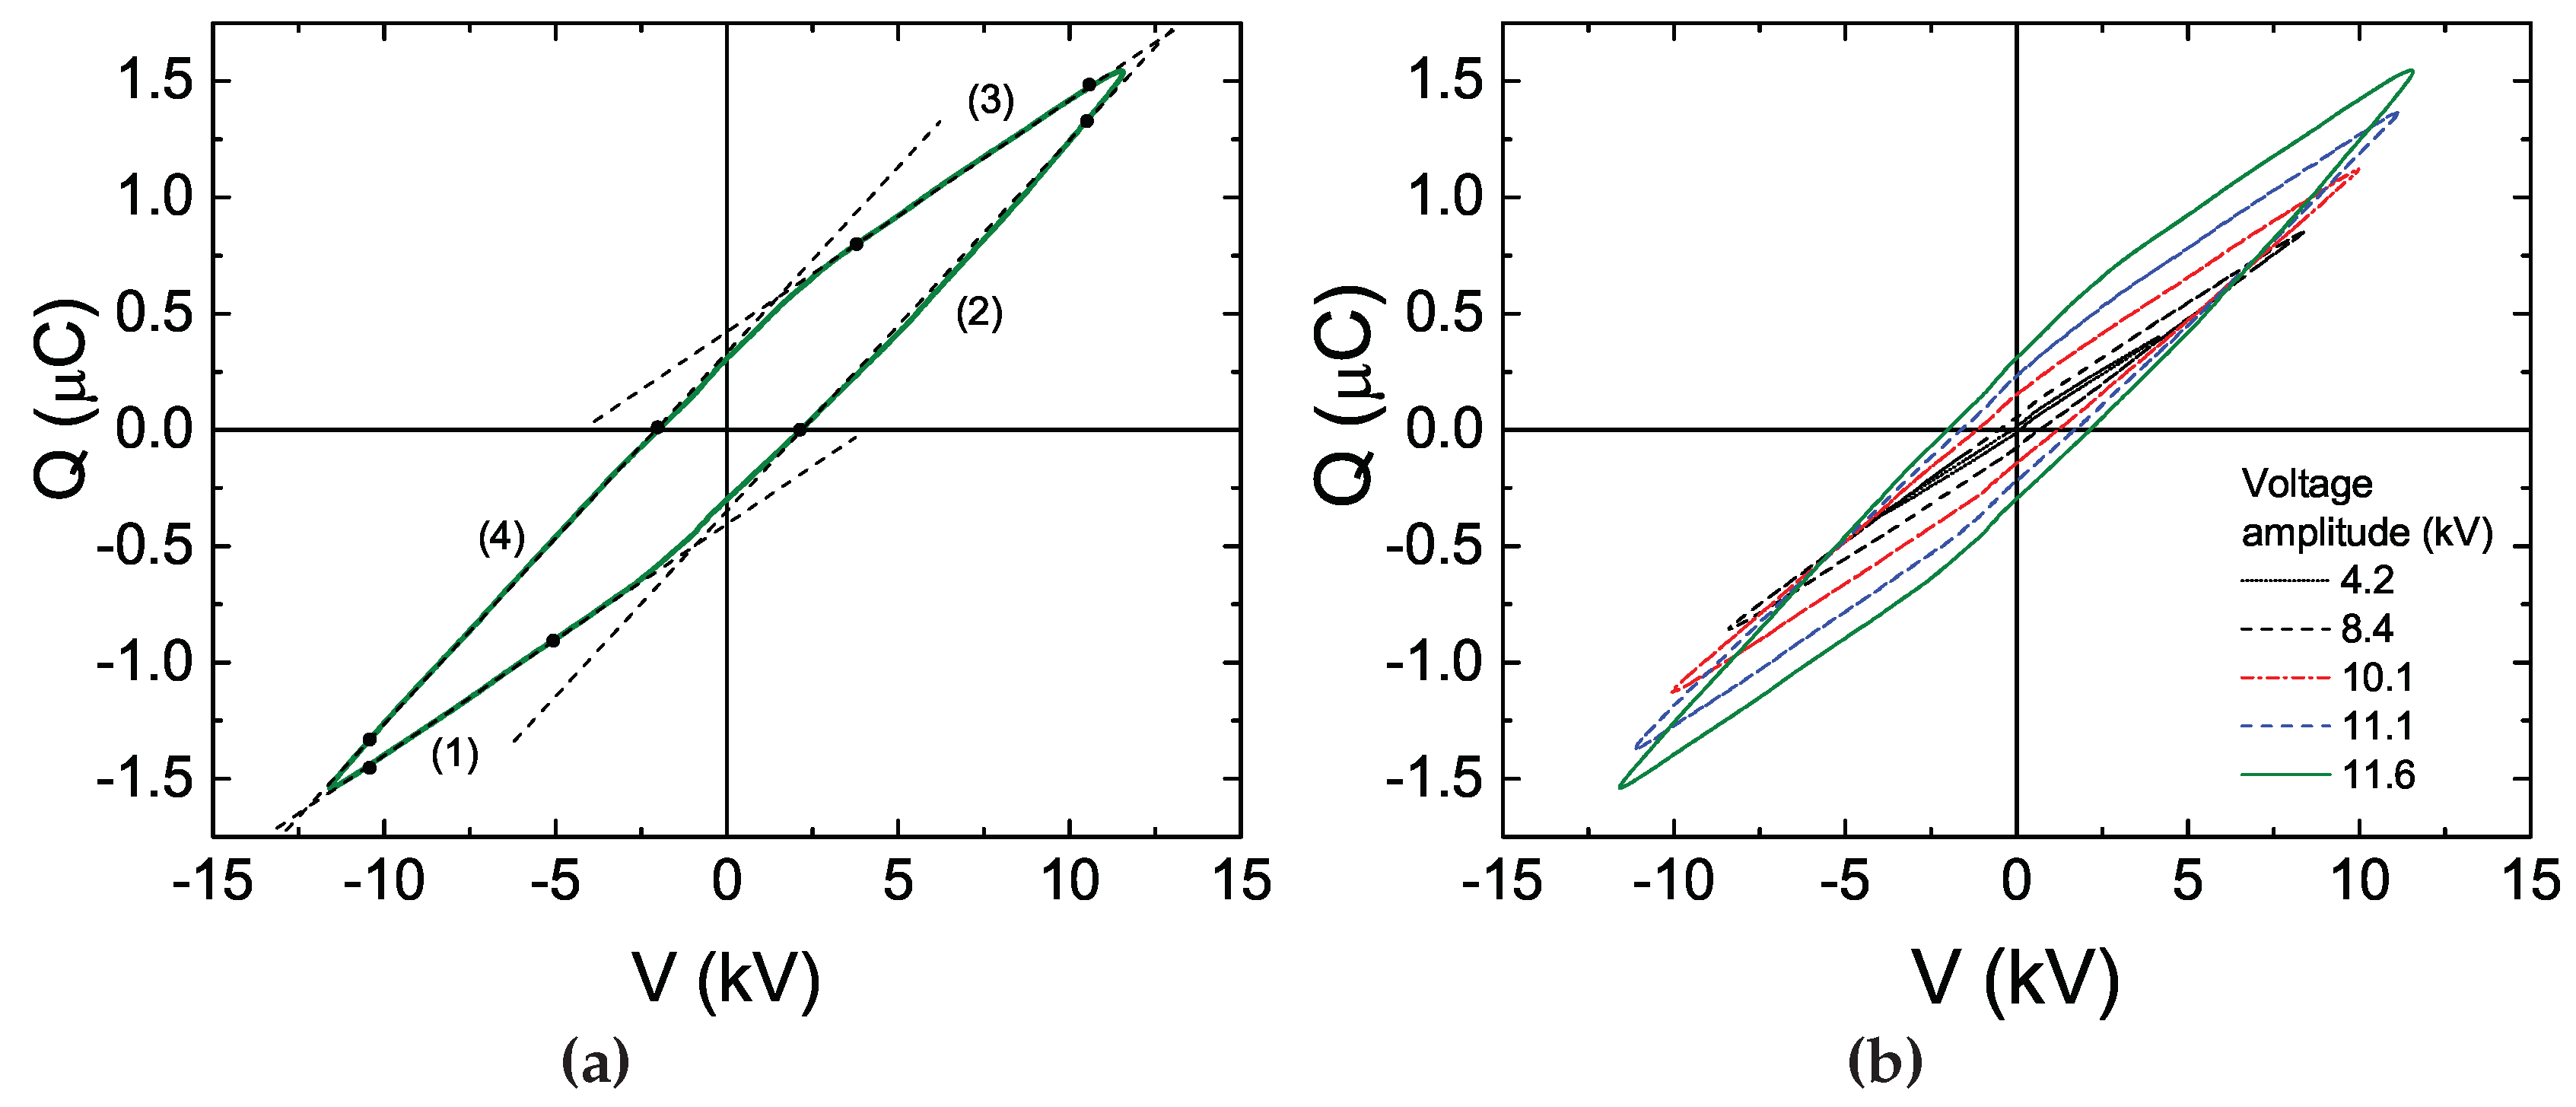
| -plot | charge voltage characteristics |
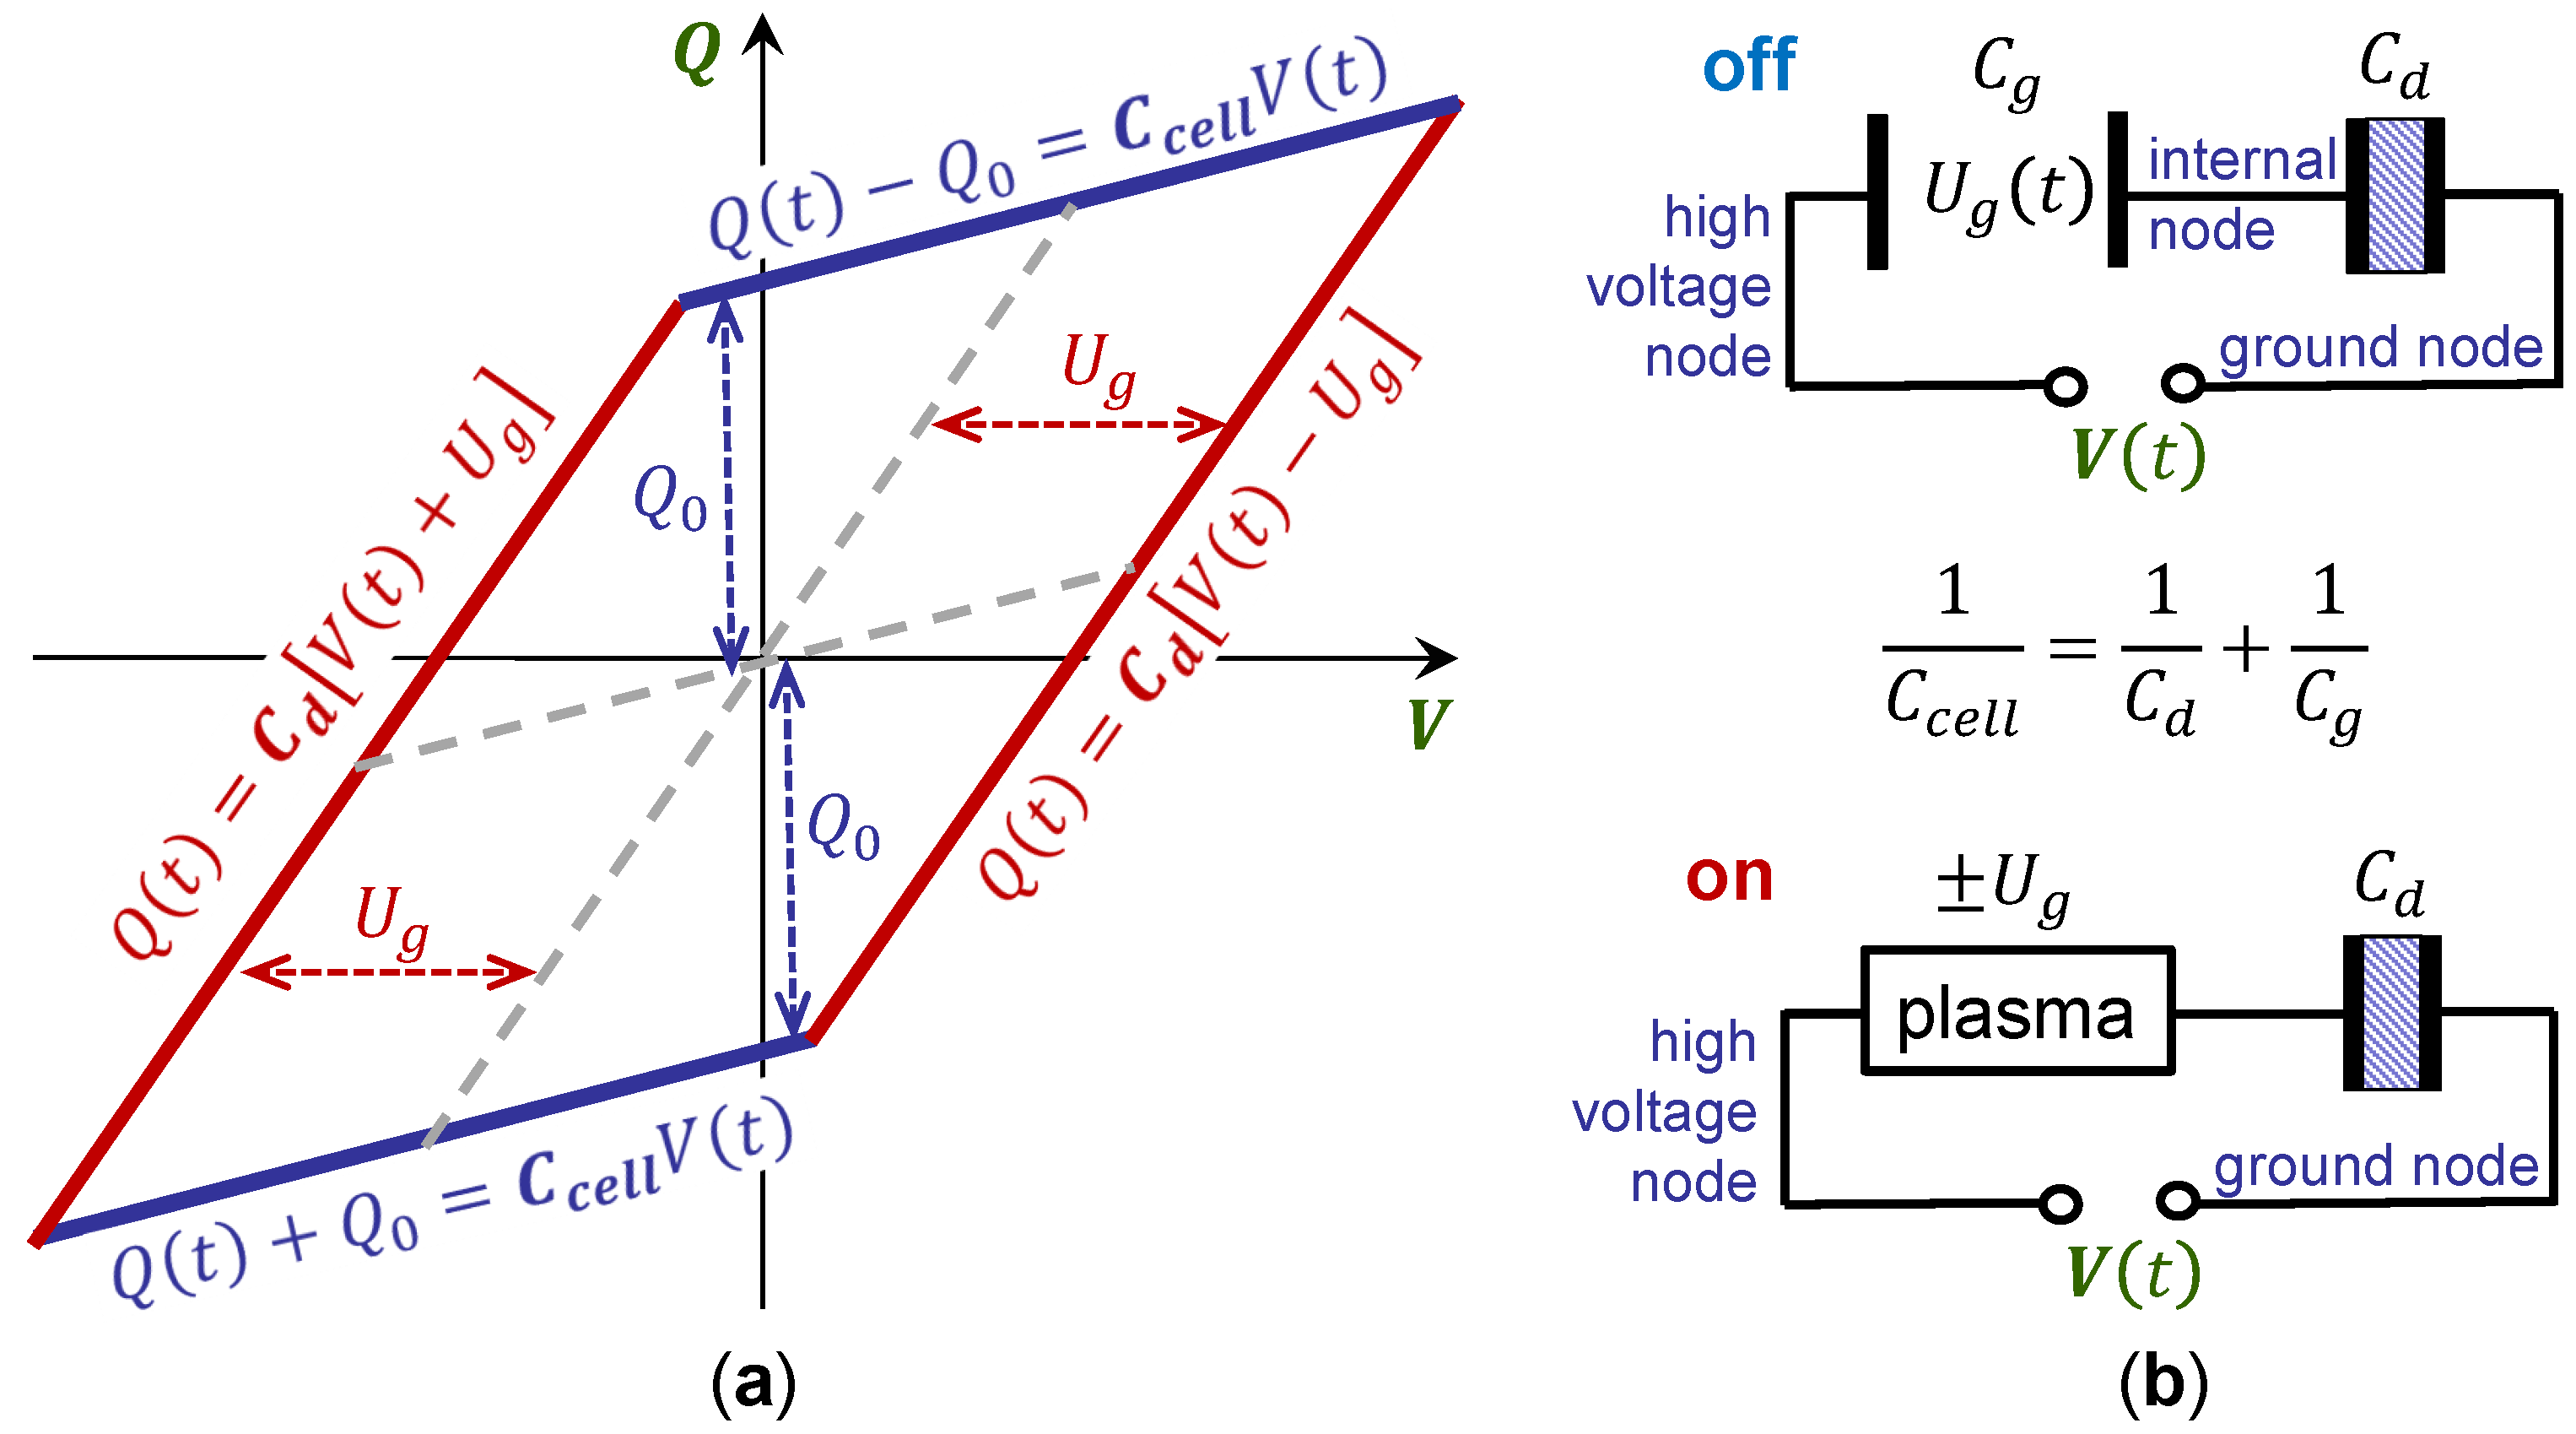
| capacitance of the reactor cell without discharge | |
| the capacitance associated with dielectric barriers of the reactor cell, sometimes able to be seen as a reactor capacitance during the active discharge phase | |
| capacitance values obtained from the slopes of the -plot, which can coincide with and if a parasitic capacitance is negligible | |
| the capacitance associated with the gas gap of the reactor cell | |
| , , | measurable values: external current, applied voltage, and charge |
| current measured without discharge (discharge off) | |
| , | equivalent circuit parameters: discharge current and gas gap voltage |
| the values of the gas gap voltage corresponding to the ignition (breakdown) and extinguishing of the discharge | |
| the maximal value of the measured charge | |
| the value of the applied voltage when is reached, often corresponding to the voltage amplitude or the maximum of the applied voltage | |
| the value of the gas gap voltages when is reached, residual voltage | |
| the relative areas of the reactor cell, normalized on the whole area, which are not influenced and occupied by the discharge, respectively | |
| the value of the -plot derivative near to in the case of the sinusoidal applied voltage |
References
- Kogelschatz, U. Advanced Ozone Generation. In Process Technologies for Water Treatment (Earlier Brown Boveri Symposia); Stucki, S., Ed.; Plenum: New York, NY, USA, 1998; pp. 87–118. [Google Scholar] [CrossRef]
- Zhou, A.; Chen, D.; Ma, C.; Yu, F.; Dai, B. DBD Plasma-ZrO2 Catalytic Decomposition of CO2 at Low Temperatures. Catalysts 2018, 8, 256. [Google Scholar] [CrossRef]
- Xuan, K.; Zhu, X.; Cai, Y.; Tu, X. Plasma Oxidation of H2S over Non-stoichiometric LaxMnO3 Perovskite Catalysts in a Dielectric Barrier Discharge Reactor. Catalysts 2018, 8, 317. [Google Scholar] [CrossRef]
- Siemens, W. Ueber die elektrostatische Induction und die Verzögerung des Stroms in Flaschendrähten. Poggendorffs Ann. Phys. Chem. 1857, 102, 66–122. [Google Scholar] [CrossRef]
- Li, Y.; Atif, R.; Chen, K.; Cheng, J.; Chen, Q.; Qiao, Z.; Fridman, G.; Fridman, A.; Ji, H.-F. Polymerization of D-Ribose in Dielectric Barrier Discharge Plasma. Plasma 2018, 1, 13. [Google Scholar] [CrossRef]
- Brandenburg, R. Dielectric barrier discharges: Progress on plasma sources and on the understanding of regimes and single filaments. Plasma Sources Sci. Technol. 2017, 26, 053001. [Google Scholar] [CrossRef]
- Manley, T.C. The electric characteristics of the ozonator discharge. Trans. Electrochem. Soc. 1943, 84, 83–96. [Google Scholar] [CrossRef]
- Lomaev, M.I. Determination of energy input in barrier discharge excilamps. Atmos. Ocean. Opt. 2001, 14, 1005–1008. [Google Scholar]
- Liu, S.; Neiger, M. Excitation of dielectric barrier discharges by unipolar submicrosecond square pulses. J. Phys. D Appl. Phys. 2001, 34, 1632–1638. [Google Scholar] [CrossRef]
- Bibinov, N.K.; Fateev, A.A.; Wiesemann, K. Variations of the gas temperature in He/N2 barrier discharges. Plasma Sources Sci. Technol. 2001, 10, 579–588. [Google Scholar] [CrossRef]
- Pipa, A.V.; Hoder, T.; Koskulics, J.; Schmidt, M.; Brandenburg, R. Experimental determination of dielectric barrier discharge capacitance. Rev. Sci. Instrum. 2012, 83, 075111. [Google Scholar] [CrossRef] [PubMed]
- Pipa, A.V.; Koskulics, J.; Brandenburg, R.; Hoder, T. The simplest equivalent circuit of a pulsed dielectric barrier discharge and the determination of the gas gap charge transfer. Rev. Sci. Instrum. 2012, 83, 115112. [Google Scholar] [CrossRef] [PubMed]
- Pipa, A.V.; Hoder, T.; Brandenburg, R. On the Role of Capacitance Determination Accuracy for the Electrical Characterization of Pulsed Driven Dielectric Barrier Discharges. Contrib. Plasma Phys. 2013, 53, 469–480. [Google Scholar] [CrossRef]
- Peeters, F.J.J.; van de Sanden, M.C.M. The influence of partial surface discharging on the electrical characterization of DBDs. Plasma Sources Sci. Technol. 2015, 24, 015016. [Google Scholar] [CrossRef]
- Kriegseis, J.; Grundmann, S.; Tropea, C. Power consumption, discharge capacitance and light emission as measures for thrust production of dielectric barrier discharge plasma actuators. J. Appl. Phys. 2011, 110, 013305. [Google Scholar] [CrossRef]
- Butterworth, T.; Allen, R.W.K. Plasma-catalyst interaction studied in a single pellet DBD reactor: Dielectric constant effect on plasma dynamics. Plasma Sources Sci. Technol. 2017, 26, 065008. [Google Scholar] [CrossRef]
- Samojlovich, V.G.; Gibalov, I.V.; Kozlov, K.V. Physical Chemistry of the Barrier Discharge; DVS: Düsseldorf, Germany, 1997; pp. 1–261. ISBN 978-3-87155-744-6. [Google Scholar]
- Brandenburg, R.; Navratil, Z.; Jansky, J.; St’ahel, P.; Trunec, D.; Wagner, H.-E. The transition between different modes of barrier discharges at atmospheric pressure. J. Phys. D Appl. Phys. 2009, 42, 085208. [Google Scholar] [CrossRef]
- Buntat, Z.; Harry, J.E.; Smith, I.R. Generation of a Homogeneous Glow Discharge in Air at Atmospheric Pressure. Elektrika 2007, 9, 60–65. [Google Scholar]
- Mildren, R.P.; Carman, R.J. Enhanced performance of a dielectric barrier discharge lamp using short-pulsed excitation. J. Phys. D Appl. Phys. 2001, 34, L1–L6. [Google Scholar] [CrossRef]
- Massines, F.; Gherardi, N.; Naude, N.; Segur, P. Glow and Townsend dielectric barrier discharge in various atmosphere. Plasma Phys. Control Fusion 2005, 47, B577–B588. [Google Scholar] [CrossRef]
- Kogelschatz, U. Fundamentals of Dielectric-Barrier Discharges. In Non-Equilibrium Air Plasmas at Atmospheric Pressure; Becker, K.H., Kogelschatz, U., Schoenbach, K.H., Barker, R.J., Eds.; Institute of Physics: Bristol, UK, 2004; pp. 68–75. ISBN 9780750309622. [Google Scholar]
- Falkenstein, Z.; Coogan, J.J. Microdischarge behavior in the silent discharge of nitrogen-oxygen and water-air mixtures. J. Phys. D Appl. Phys. 1997, 30, 817–825. [Google Scholar] [CrossRef]
- Synek, P.; Zemánek, M.; Kudrle, V.; Hoder, T. Advanced electrical current measurements of microdischarges: Evidence of sub-critical pulses and ion currents in barrier discharge in air. Plasma Sources Sci. Technol. 2018, 27, 045008. [Google Scholar] [CrossRef]
- Cho, G.; Shin, M.; Jeong, J.; Kim, J.; Hong, B.; Koo, J.; Kim, Y.; Choi, E.; Fechner, J.; Letz, M.; et al. Glass tube of high dielectric constant and low dielectric loss for external electrode fluorescent lamps. J. Appl. Phys. 2007, 102, 113307. [Google Scholar] [CrossRef]
- Siliprandi, R.A.; Romana, H.E.; Barni, R.; Riccardi, C. Characterization of the streamer regime in dielectric barrier discharges. J. Appl. Phys. 2008, 104, 063309. [Google Scholar] [CrossRef]
- Tay, W.H.; Yap, S.L.; Wong, C.S. The Electrical Characteristics of a Filamentary Dielectric Barrier Discharge. AIP Conf. Proc. 2010, 1250, 532. [Google Scholar] [CrossRef]
- Takashima, K.; Yin, Z.; Adamovich, I.V. Measurements and kinetic modeling of energy coupling in volume and surface nanosecond pulse discharges. Plasma Sources Sci. Technol. 2013, 22, 015013. [Google Scholar] [CrossRef]
- Akishev, Y.; Aponin, G.; Balakirev, A.; Grushin, M.; Karalnik, V.; Petryakov, A.; Trushkin, N. Spatial-temporal development of a plasma sheet in a surface dielectric barrier discharge powered by a step voltage of moderate duration. Plasma Sources Sci. Technol. 2013, 22, 015004. [Google Scholar] [CrossRef]
- Becker, M.M.; Hoder, T.; Brandenburg, R.; Loffhagen, D. Analysis of microdischarges in asymmetric dielectric barrier discharges in argon. J. Phys. D Appl. Phys. 2013, 46, 355203. [Google Scholar] [CrossRef]
- Pinchuk, M.E.; Stepanova, O.M.; Lazukin, A.V.; Astafiev, A.M. A simple XCOS/SCILAB model of a DBD Plasma jet impinging on a target. In 29th Summer School and International Symposium on the Physics of Ionized Gases; Poparić, G., Obradović, B., Borka, D., Rajković, M., Eds.; Vinča Institute of Nuclear Sciences: Belgrade, Serbia, 2018; pp. 214–217. ISBN 978-86-7306-146-7. [Google Scholar]
- Fang, Z.; Ji, S.; Pan, J.; Shao, T.; Zhang, C. Electrical Model and Experimental Analysis of the Atmospheric-Pressure Homogeneous Dielectric Barrier Discharge in He. IEEE Trans. Plasma Sci. 2012, 40, 883–891. [Google Scholar] [CrossRef]
- Tay, W.H.; Yap, S.L.; Wong, C.S. Electrical Characteristics and Modeling of a Filamentary Dielectric Barrier Discharge in Atmospheric Air. Sains Malays. 2014, 43, 583–594. Available online: http://www.ukm.my/jsm/pdf_files/SM-PDF-43-4-2014/12%20W.H.%20Tay.pdf (accessed on 18 January 2019).
- Valdivia-Barrientos, R.; Pacheco-Sotelo, J.; Pacheco-Pacheco, M.; Benítez-Read, J.S.; López-Callejas, R. Analysis and electrical modelling of a cylindrical DBD configuration at different operating frequencies. Plasma Sources Sci. Technol. 2006, 15, 237–245. [Google Scholar] [CrossRef]
- Simeni, M.S.; Tang, Y.; Frederickson, K.; Adamovich, I.V. Electric field distribution in a surface plasma flow actuator powered by ns discharge pulse trains. Plasma Sources Sci. Technol. 2018, 27, 104001. [Google Scholar] [CrossRef]
- Obrusník, A.; Bílek, P.; Hoder, T.; Šimek, M.; Bonaventura, Z. Electric field determination in air plasmas from intensity ratio of nitrogen spectral bands: I. Sensitivity analysis and uncertainty quantification of dominant processes. Plasma Sources Sci. Technol. 2018, 27, 085013. [Google Scholar] [CrossRef]
- Ivković, S.S.; Obradović, B.M.; Cvetanović, N.; Kuraica, M.M.; Purić, J. Measurement of electric field development in dielectric barrier discharge in helium. J. Phys. D Appl. Phys. 2009, 42, 225206. [Google Scholar] [CrossRef]
- Cvetanović, N.; Galmiz, O.; Synek, P.; Zemánek, M.; Brablec, A.; Hoder, T. Electron density in surface barrier discharge emerging at argon/water interface: Quantification for streamers and leaders. Plasma Sources Sci. Technol. 2018, 27, 025002. [Google Scholar] [CrossRef]
- Konjević, N.; Ivković, M.; Sakan, N. Hydrogen Balmer lines for low electron number density plasma diagnostics. Spectrochim. Acta B 2012, 76, 16–26. [Google Scholar] [CrossRef]
- Naudé, N.; Cambronne, J.-P.; Gherardi, N.; Massines, F. Electrical model and analysis of the transition from an atmospheric pressure Townsend discharge to a filamentary discharge. J. Phys. D Appl. Phys. 2005, 38, 530–538. [Google Scholar] [CrossRef]
- Enache, I.; Naudé, N.; Cambronne, J.-P.; Gherardi, N.; Massines, F. Electrical model of the atmospheric pressure glow discharge (APGD) in helium. Eur. Phys. J. Appl. Phys. 2006, 33, 15–21. [Google Scholar] [CrossRef]


© 2019 by the authors. Licensee MDPI, Basel, Switzerland. This article is an open access article distributed under the terms and conditions of the Creative Commons Attribution (CC BY) license (http://creativecommons.org/licenses/by/4.0/).
Share and Cite
Pipa, A.V.; Brandenburg, R. The Equivalent Circuit Approach for the Electrical Diagnostics of Dielectric Barrier Discharges: The Classical Theory and Recent Developments. Atoms 2019, 7, 14. https://0-doi-org.brum.beds.ac.uk/10.3390/atoms7010014
Pipa AV, Brandenburg R. The Equivalent Circuit Approach for the Electrical Diagnostics of Dielectric Barrier Discharges: The Classical Theory and Recent Developments. Atoms. 2019; 7(1):14. https://0-doi-org.brum.beds.ac.uk/10.3390/atoms7010014
Chicago/Turabian StylePipa, Andrei V., and Ronny Brandenburg. 2019. "The Equivalent Circuit Approach for the Electrical Diagnostics of Dielectric Barrier Discharges: The Classical Theory and Recent Developments" Atoms 7, no. 1: 14. https://0-doi-org.brum.beds.ac.uk/10.3390/atoms7010014