Simulation of Spectra Code (SOS) for ITER Active Beam Spectroscopy
by
 ,
,
Manfred von Hellermann
1,*,†, 
Maarten de Bock
2,
Oleksandr Marchuk
1 ,
,
Detlev Reiter
1,
Stanislav Serov
3 and
Michael Walsh
2 1
Institute for Energy and Climate Research IEK-4, Forschungszentrum Jülich GmbH, 52425 Jülich, Germany
2
ITER organization, Route de Vinon-sur-Verdon, CS 90 046, 13067 St Paul-Lez-Durance, France
3
ITER-Russian-Federation, Moscow 123098, Russia
*
Author to whom correspondence should be addressed.
†
retired.
Atoms 2019, 7(1), 30; https://0-doi-org.brum.beds.ac.uk/10.3390/atoms7010030
Submission received: 24 January 2019
/
Revised: 13 February 2019
/
Accepted: 15 February 2019
/
Published: 1 March 2019
(This article belongs to the Special Issue Plasma Spectroscopy in the Presence of Magnetic Fields)
Abstract
:The concept and structure of the Simulation of Spectra (SOS) code is described starting with an introduction to the physics background of the project and the development of a simulation tool enabling the modeling of charge-exchange recombination spectroscopy (CXRS) and associated passive background spectra observed in hot fusion plasmas. The generic structure of the code implies its general applicability to any fusion device, the development is indeed based on over two decades of spectroscopic observations and validation of derived plasma data. Four main types of active spectra are addressed in SOS. The first type represents thermal low-Z impurity ions and the associated spectral background. The second type of spectra represent slowing-down high energy ions created from either thermo-nuclear fusion reactions or ions from injected high energy neutral beams. Two other modules are dedicated to CXRS spectra representing bulk plasma ions (H+, D+, or T+) and beam emission spectroscopy (BES) or Motional Stark Effect (MSE) spectrum appearing in the same spectral range. The main part of the paper describes the physics background for the underlying emission processes: active and passive CXRS emission, continuum radiation, edge line emission, halo and plume effect, or finally the charge exchange (CX) cross-section effects on line shapes. The description is summarized by modeling the fast ions emissions, e.g., either of the α particles of the fusion reaction or of the beam ions itself.
1. Introduction to the SOS Project
The need for quantitative evaluation of complex line emission spectra as observed in hot fusion plasmas initiated a challenging development of sophisticated interpretation tools based on integrating advanced underlying atomic modeling [1] with detailed treatment of the plasma environment. The successful merging of the relevant plasma and atomic physics has led to routine diagnostic procedures which have contributed enormously to the understanding of plasma processes and also to a wide acceptance of spectroscopy as a reliable diagnostic method [2]. The concept of Integrated Data Analysis emphasizes the role of global data consistency in a Bayesian probability frame work [3] where quantitative spectroscopy can provide key plasma data [4].
The Simulation of Spectra (SOS) 1 project has been started at JET back in the mid-nineties with the main purpose of developing a tool capable of predicting reliably expected spectroscopic diagnostic performance of future fusion devices such as ITER [5,6,7] or EAST [8,9], and even more importantly, to use experimental results from existing fusion devices as a bench-marking tool. The background is a comprehensive data base gained from the JET CXRS diagnostic [10] which uses advanced spectral analysis codes (CXSFIT, [11]) and CX data processing code Charge Exchange Analysis Package (CHEAP). In order to explore the options for real-time CX analysis required for plasma control the development of neural network tools [12] was launched at JET at the end of the nineties. The Bayesian approach used for the neural network project led to the result that each plasma parameter, as extracted from a CX spectrum, is characterized by its associated probability space and hence effective training of a neural network structure, suggests filling the parameter probability space by the creation of synthetic spectra, which implies forward modeling of passive and active spectra. Obviously, any forward modeling of spectra and creation of synthetic spectra has to be benchmarked against observed experimental spectra on current fusion devices. The concept of an eternal diagnostic loop describing the cycle of atomic modeling, plasma modeling, prediction of spectra, parametrization of spectra and comparing modeled spectra to real spectra, then refining the underlying models, etc., has been outlined in several papers [13,14,15].
The SOS code addresses primarily spectra linked to beam induced active spectroscopy, that is, charge exchange recombination spectroscopy (CXRS) on thermal (<30 keV) and fast plasma ions (30 keV < E < 3.5 MeV) and beam emission spectroscopy (BES, MSE). Both reactions are exemplified below:
Here is a fully stripped bulk plasma or impurity ion in the hot plasma (H+, D+, T+, He2+, Ne10+, C6+, etc.), is a beam atom (either hydrogen, deuterium or tritium), , are highly excited H-like ions and excited beam atoms, respectively. The measurements of the emitted photons as a result of radiative stabilization of the captured or excited electrons to the ground state of atoms and ions provides the basis of the CXRS and BES diagnostics. In the case of CXRS reaction the synthetic line shapes need to be reconstructed from a convolution of emission rate function and the original particle velocity distribution function projected into the direction of observation. This requires a three-dimensional integration in velocity space. However, for the case of low ion temperatures the resultant synthetic spectrum retains in first order approximation [16] its Gaussian-like shape and the observed spectra may be described in terms of apparent Doppler-width (ion temperature), apparent Doppler shift (plasma rotation) and apparent amplitude (ion density).
A second class of non-Gaussian synthetic line shape arises in the case of passive CX line emission [17], which represent the non-local, line-of-sight integrated, measurement of spectra induced by the interaction of neutral hydrogen streaming from the wall into the plasma and fully stripped confined impurity ions:
The key input for the modeling of the passive charge-exchange (PCX) is the neutral hydrogen density at the plasma decaying exponential-like from the wall. SOS has implemented a tailored EIRENE [18] executable which produces the atomic and molecular densities required for the PCX modeling. Two further cases of thermal spectra, associated with neutral beam injection, but which are in contrast to the active CX feature, the ‘prompt’ CX feature, not as clearly localized are ‘halo’ and ‘plume’ spectral features and which require the reconstruction of synthetic line-of-sight integrated spectral shapes. The halo effect [19,20,21] refers to the cloud of neutrals accompanying the beam penetration path interacting with the plasma environment via collisions with electrons and ions and creating a supplementary spectrum representing the same atomic transition as the CX line emission. The ‘plume’ effect [22,23,24,25] is evident mostly in the case of the CXRS HeII spectrum: the excitation by electrons of resulting H-like He can be comparable with the CXRS signal thus extending the emission zone due to the thermal motion of H-like ions. The rapid decay of excitation rate coefficient as (~1/n3) where n is the principal quantum number prevents the appearance of plume in all other impurities except of He (see also PEC values for HI, HeII, and CVI in Figure 2h). Finally, the type of synthetic active spectra simulated by SOS is that of fast-ion-CX-spectra, i.e., slowing-down fusion alpha particles [26,27,28,29,30], fast beam ions [31,32,33,34,35,36] or minority ions accelerated by Ion Cyclotron Resonance Heating (ICRH). In all three examples of FICX (Fast-Ion-CXRS), the range of energies of the fast ions exceeds by far the width of the CX emission rate function which typically peaks around 50 keV/amu, and contributes dominantly to measurable signals for relative collision velocities less than 100 keV/amu. As a result, the broad slowing-down distribution function is convolved by a comparatively narrow emission rate function and the observed spectral shape is no longer a direct, undistorted image of the original velocity distribution function [28,29].
2. SOS Physics Background
2.1. Atomic Data used in SOS
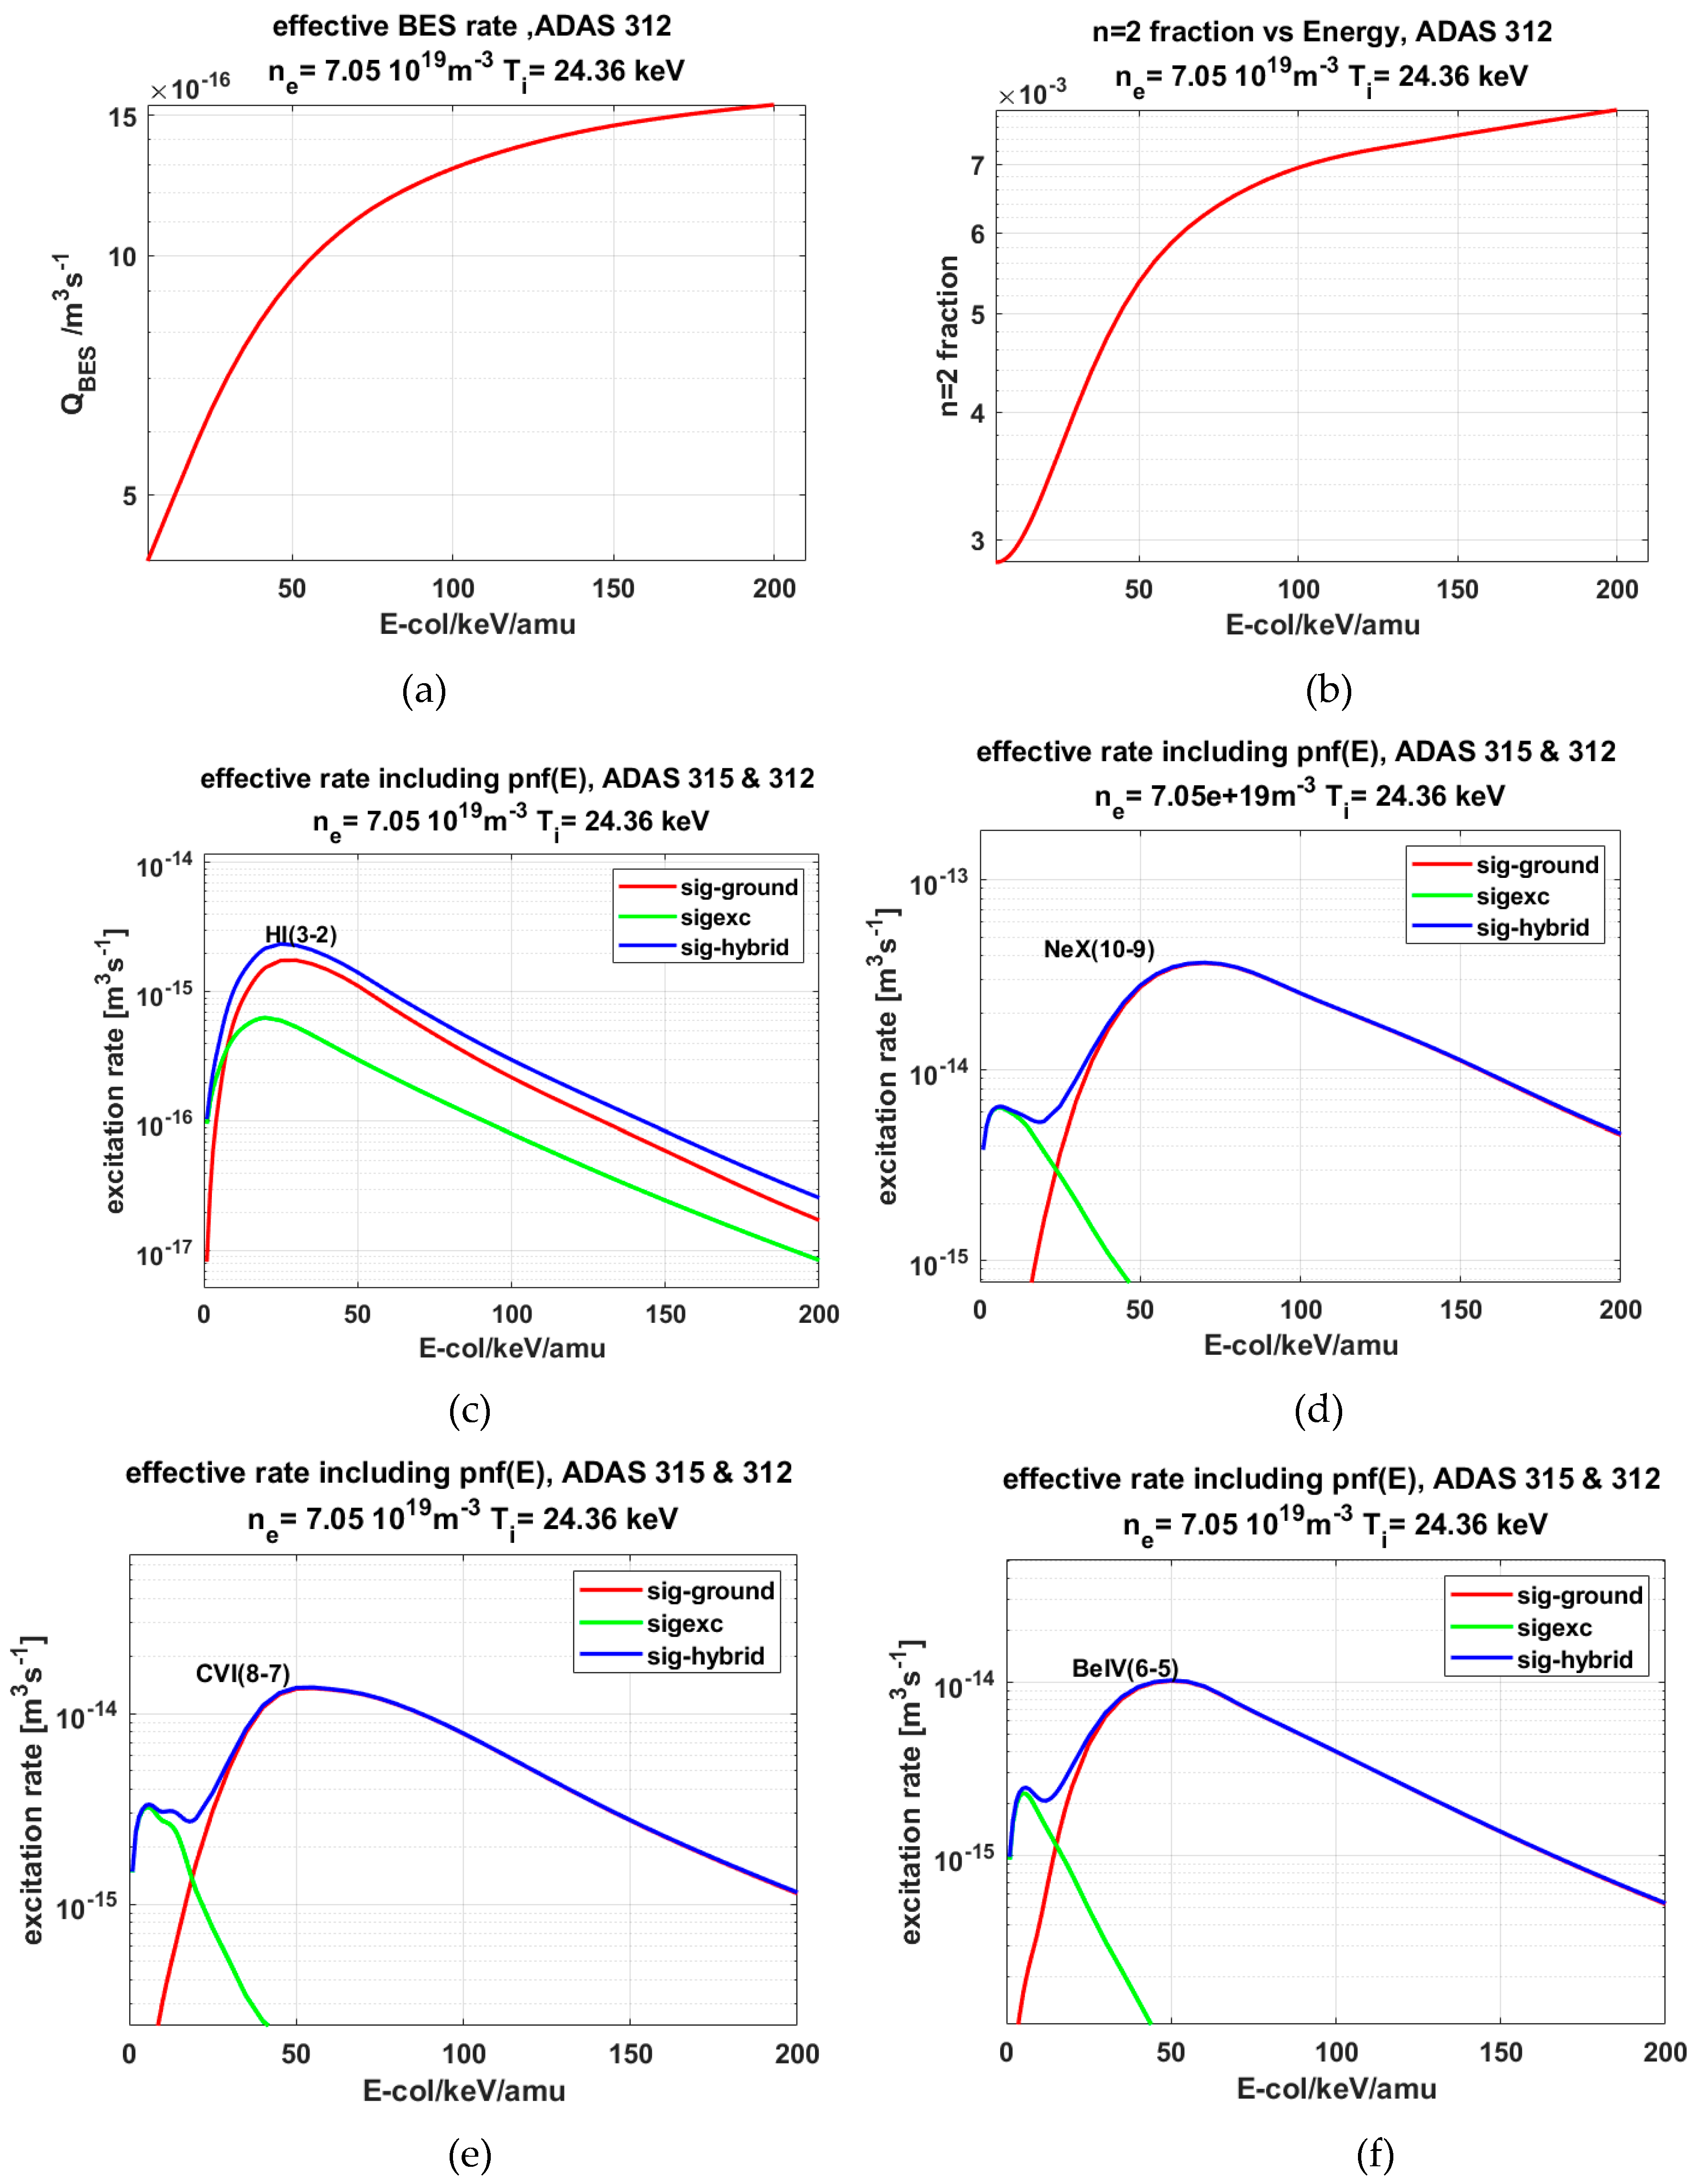
The main source for atomic data used in SOS is the ADAS data base [1]. In the case of the MSE modeling the recent review of the statistical populations in a collisional fusion plasma as developed by Marchuk et al. [37] is used. For any SOS run the used atomic data can be displayed. As illustration, here the main low-Z CX effective emission rate and the excited n = 2 beam population are shown. In Figure 1 two representative ITER plasma scenarios which are used throughout this paper are shown, one a low-density case (8·1019 m−3, 9 MA steady-state at burn) and the second a high-density case (1.2·1020 m−3, 15 MA-flat-density-profile). For the atomic data we have selected the 9 MA-steady-state-at-burn-up case as illustration. In Figure 2 the results from ADAS calculations relevant for the CXRS diagnostics are summarized. Figure 2a–h show the effective rate coefficient of beam-emission and charge-exchange for main impurity ions in fusion plasmas. The calculations are shown as a function of collisional beam energy, the electron density electron and ion temperature. The impurity composition is the one representative for ITER (He+2 4%, Be+4 2%, Ne+10 0.3%, C+6 0.1%). Other examples of calculations of n = 2 and higher levels could be also found in [38]. One should also take into account that the statistical assumption for the n = 2 levels of hydrogen beam becomes valid only at high plasma density only. Finally, Figure 2h shows the photon emission coefficients necessary for modeling of plume and hallo effects.
2.2. Neutral Beam Model
SOS uses two neutral beam models. The first is a rather crude description of the entire beam assembly represented by a single point-like ion source, and a Gaussian-like shape which expands along the beam path. The second approach, the Finite-Ion-Grid description, takes into account the actual ion grid with its finite dimensions and finite number of beamlets, for example, in the case of ITER the negative ion beam source assembly is a grid of 560 mm × 1520 mm with 20 × 64 ion sources that is 1280 beamlets, which are focused onto a common point close to the plasma entry. The local neutral beam or beamlet profile may be described by a Gaussian profile with a 1/e-radius w⊥. For a non-circular beam-shape one gets:
Here, P- is the neutral beam power, ζ is the attenuation factor described below and E is the energy of the beam atom, r is the distance from the beam axis. The z-axis is here along the beam axis and x and y (r2 = x2 + y2) denote perpendicular directions.
Whereas the 1/e folding length is determined by the design of the neutral beam the most comprehensive part remains the calculation of attenuation factor ζ.
The attenuation factor ζ = nbeam (ρ)/nbeam (ρ = 1) is calculated by a line-integration along the beam path, it requires the radial density profiles electrons and impurity ions as well as ion specific atomic stopping cross-sections. Making use of charge neutrality and expressing the proton (deuteron) concentration nd/ne by way of the measured impurity concentrations, i.e., , where Z is the charge of ion z and cz = nz/ne the impurity concentration, one obtains for the exponent in the attenuation factor:
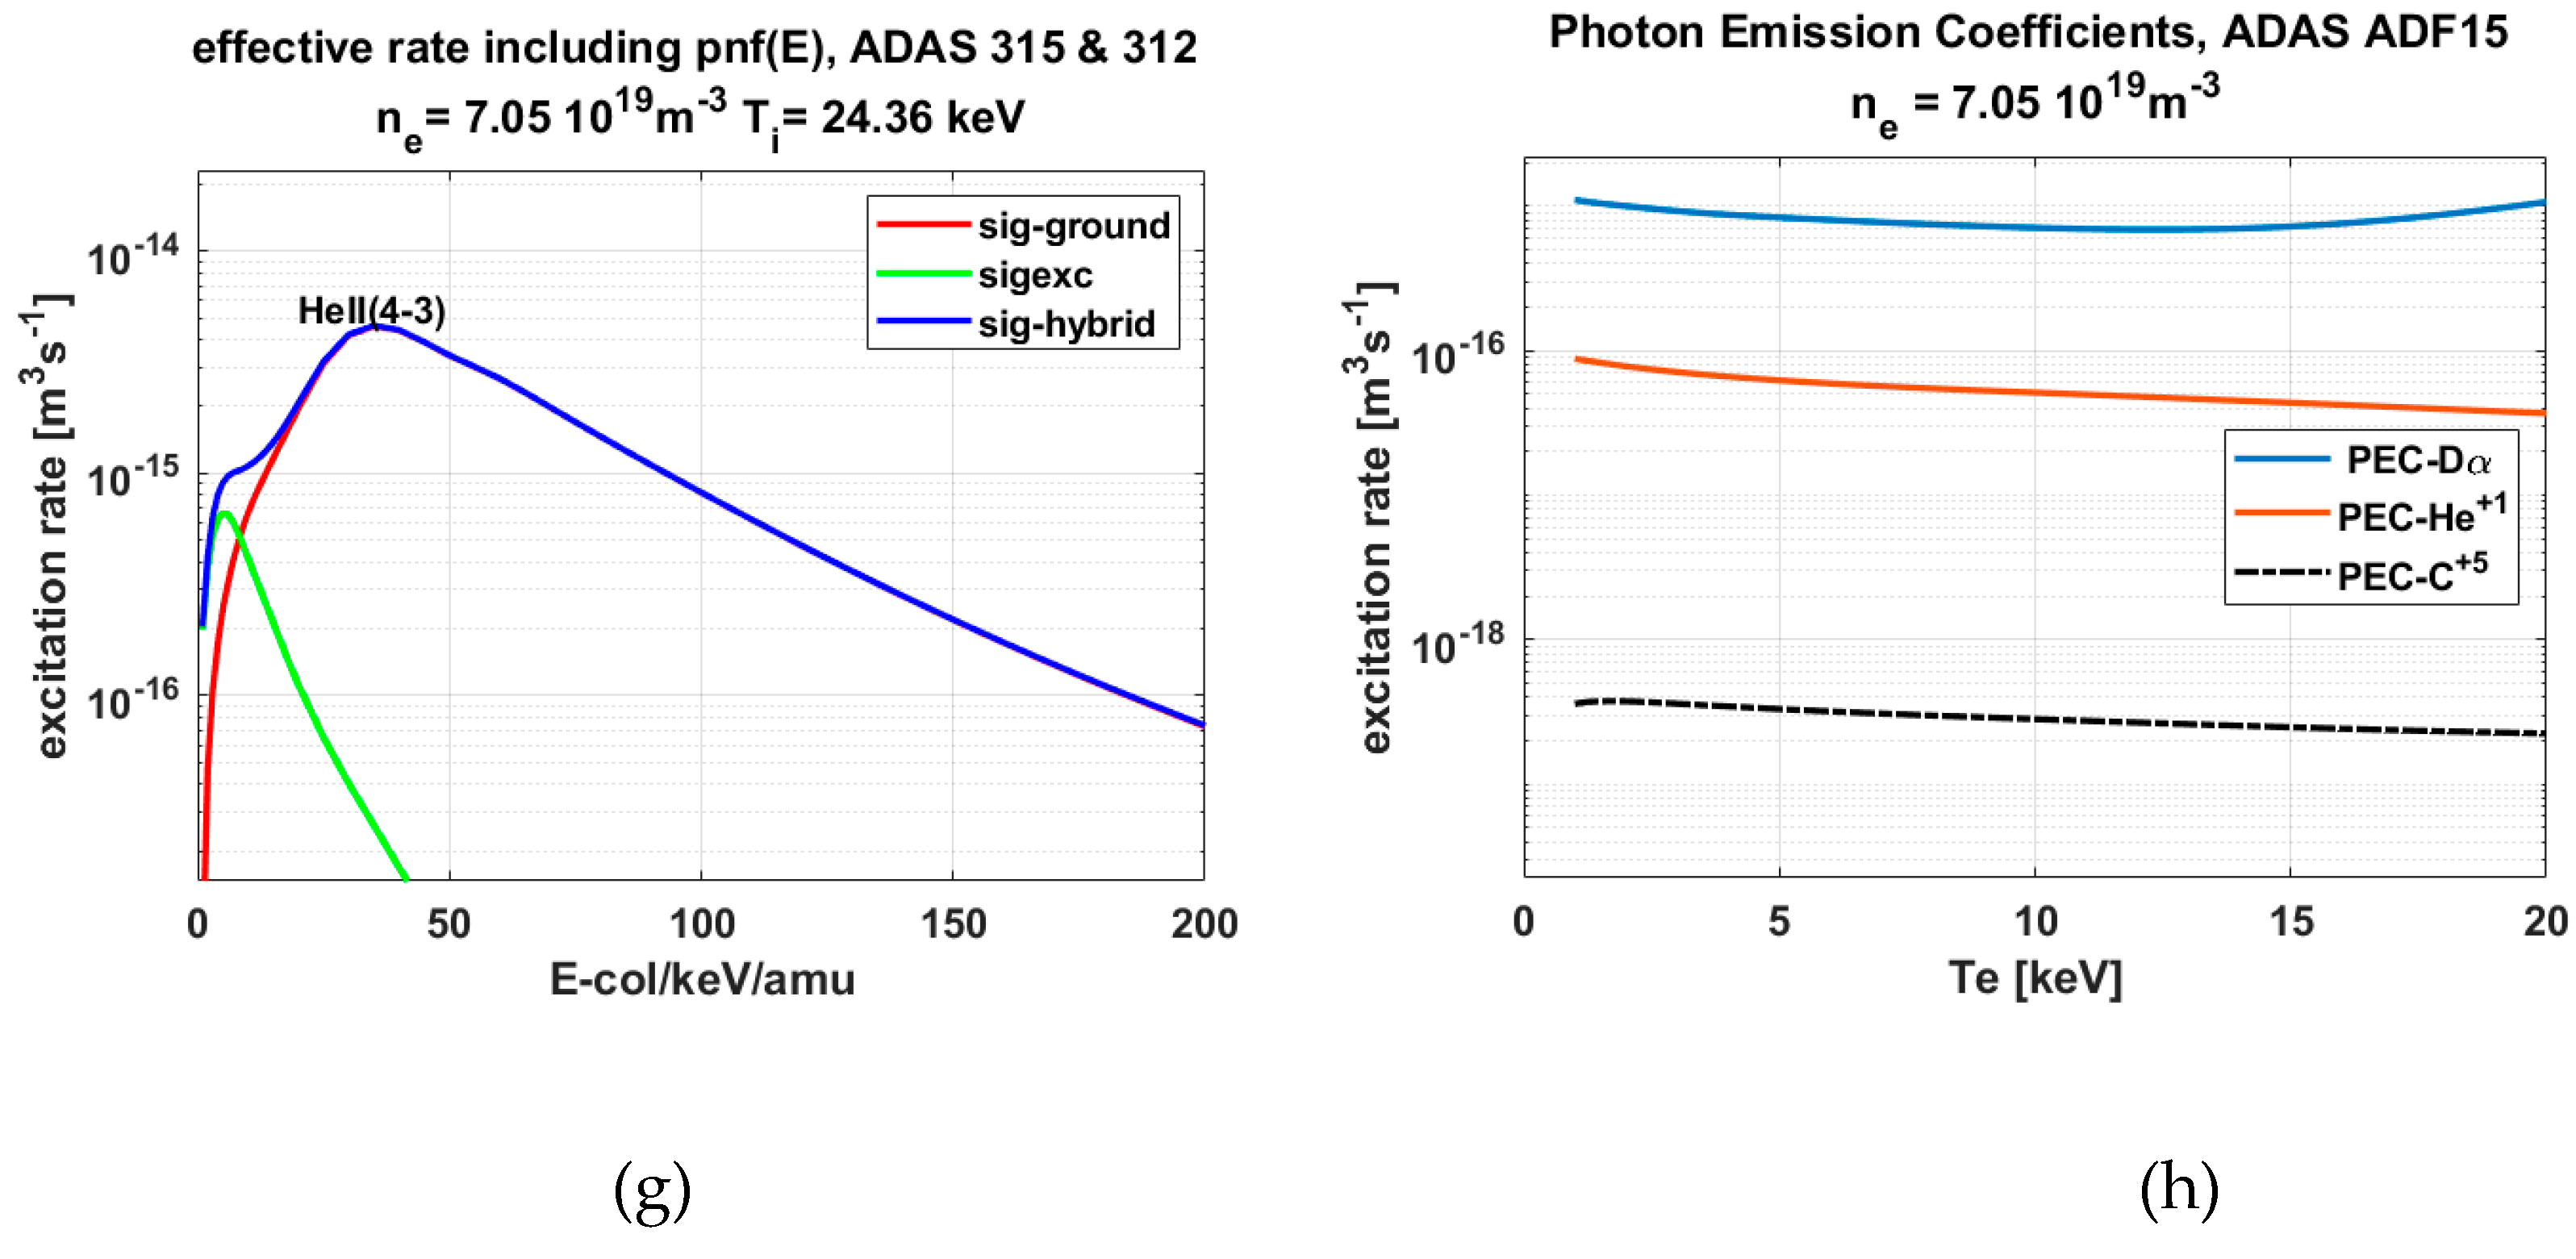
The ADAS effective stopping cross-sections σstop,z (see Figure 3b) for the injected neutral beam include ionization and charge exchange losses induced by electrons and ions [39,40].
This beam attenuation Equation (2) summarizes also in a nut shell the essential principles of the SOS (or originally the CHEAP code at JET). For a full collisional modeling of the local neutral beam stopping factor, as required for the derivation of the local neutral beam density, one needs all low-Z ion densities contributing to the beam stopping process. So, any CXRS data analysis is ultimately an iterative process, where an initial plasma impurity composition is assumed as a starting point for a beam density calculation leading then to a new set of revised impurity ion densities derived from CXRS measurements and a new beam stopping calculation can start again. Luckily this is a rapidly converging process.
A key issue for the ITER CXRS diagnostic is the proposed absolute calibration of deduced ion densities by a joint use BES and CXRS sharing the same observation optics and thus deriving the local neutral beam density from the ratio of CXRS/BES signals [41]. For this reason, multi-wavelength high-throughput spectrometers are proposed enabling simultaneous measurements of Dα, HeII/BeIV and CVI/NeX spectra from exactly the same plasma location. However, until now a detailed comparison between beam densities as derived from beam-emission spectra at JET and those derived via beam-attenuation along the beam path do not demonstrate satisfactory agreement [34]. Although both densities are consistently correlated over a wide range of beam energies, plasma densities and temperatures, a systematic deviation of the order 30% is found with BES derived data lower than those derived from beam attenuation. One of possible reasons could be either uncertainties in beam geometry and/or optical alignment errors of the observation periscope, or alternatively, an uncertainty in the ionization cross section of the beam. For example, the most recent accurate calculations (CCC) [42] demonstrate higher ionization cross sections as for instance from ADAS. A higher ionization rate implies a lower effective BES rate and hence higher BES densities and also a stronger attenuation and hence lower attenuation-derived densities.
The attenuation factor ζ is calculated by a line-integration along the beam path, it requires the radial density profiles of electrons and impurity ions as well as ion specific atomic stopping cross-sections (Figure 3b). The ADAS effective stopping cross-sections for the injected neutral beam include ionization and charge exchange losses induced by electrons and ions [30,39]. For the forward prediction SOS starts from estimates of both the plasma impurity composition, and also their respective radial profiles.
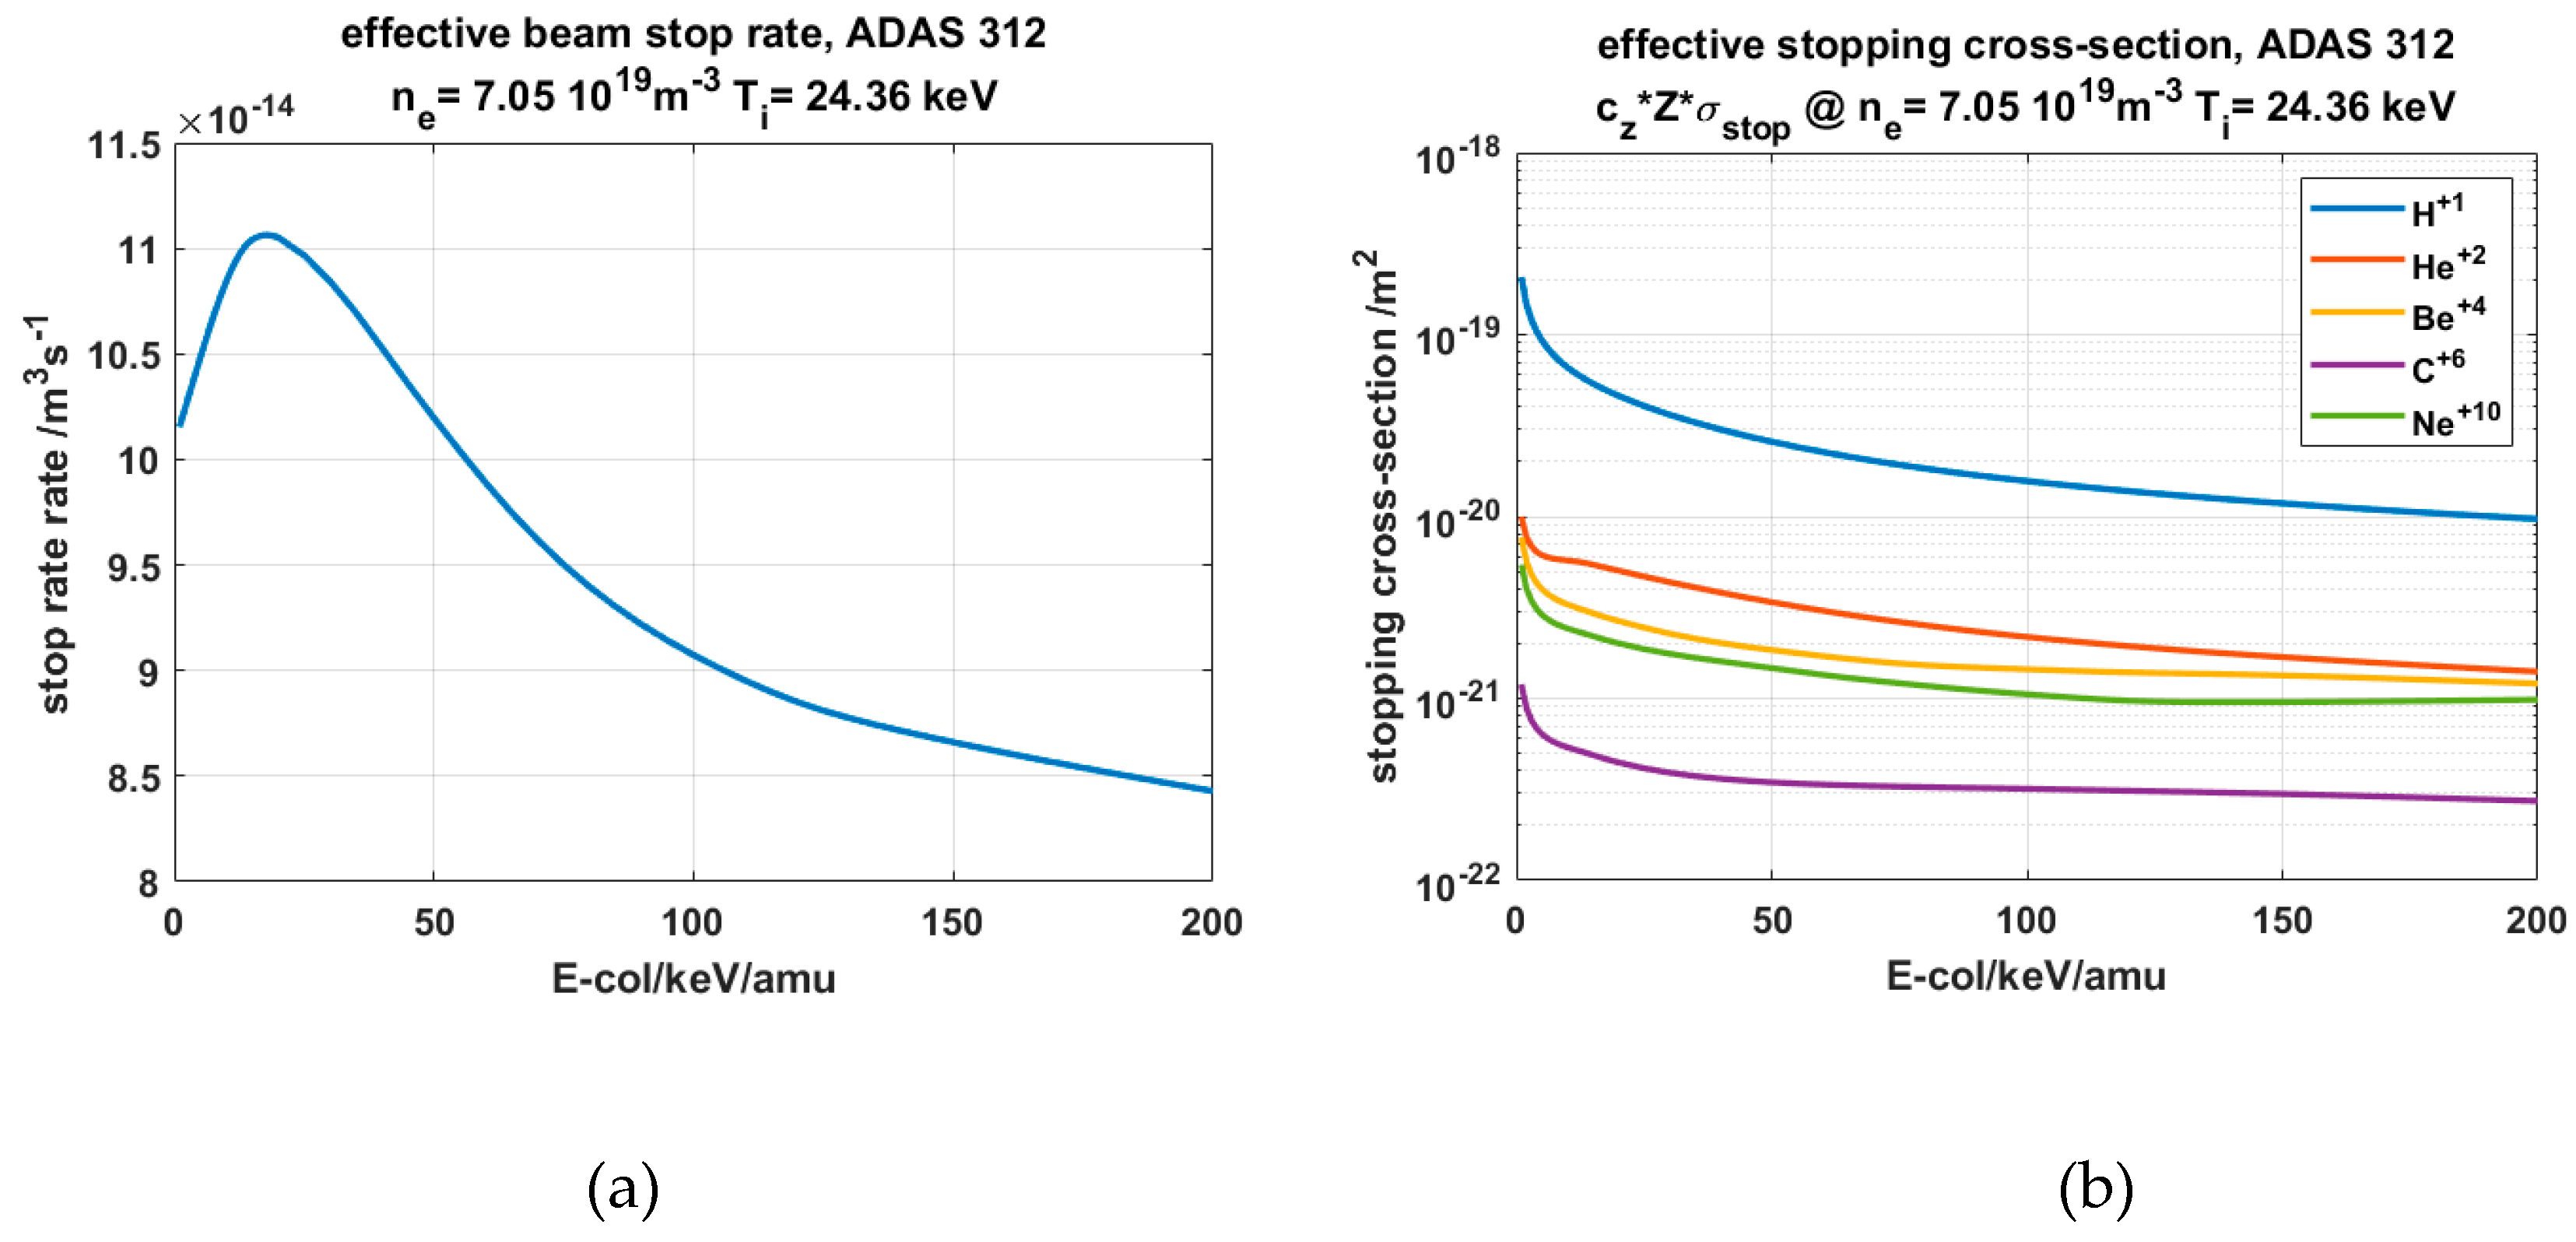
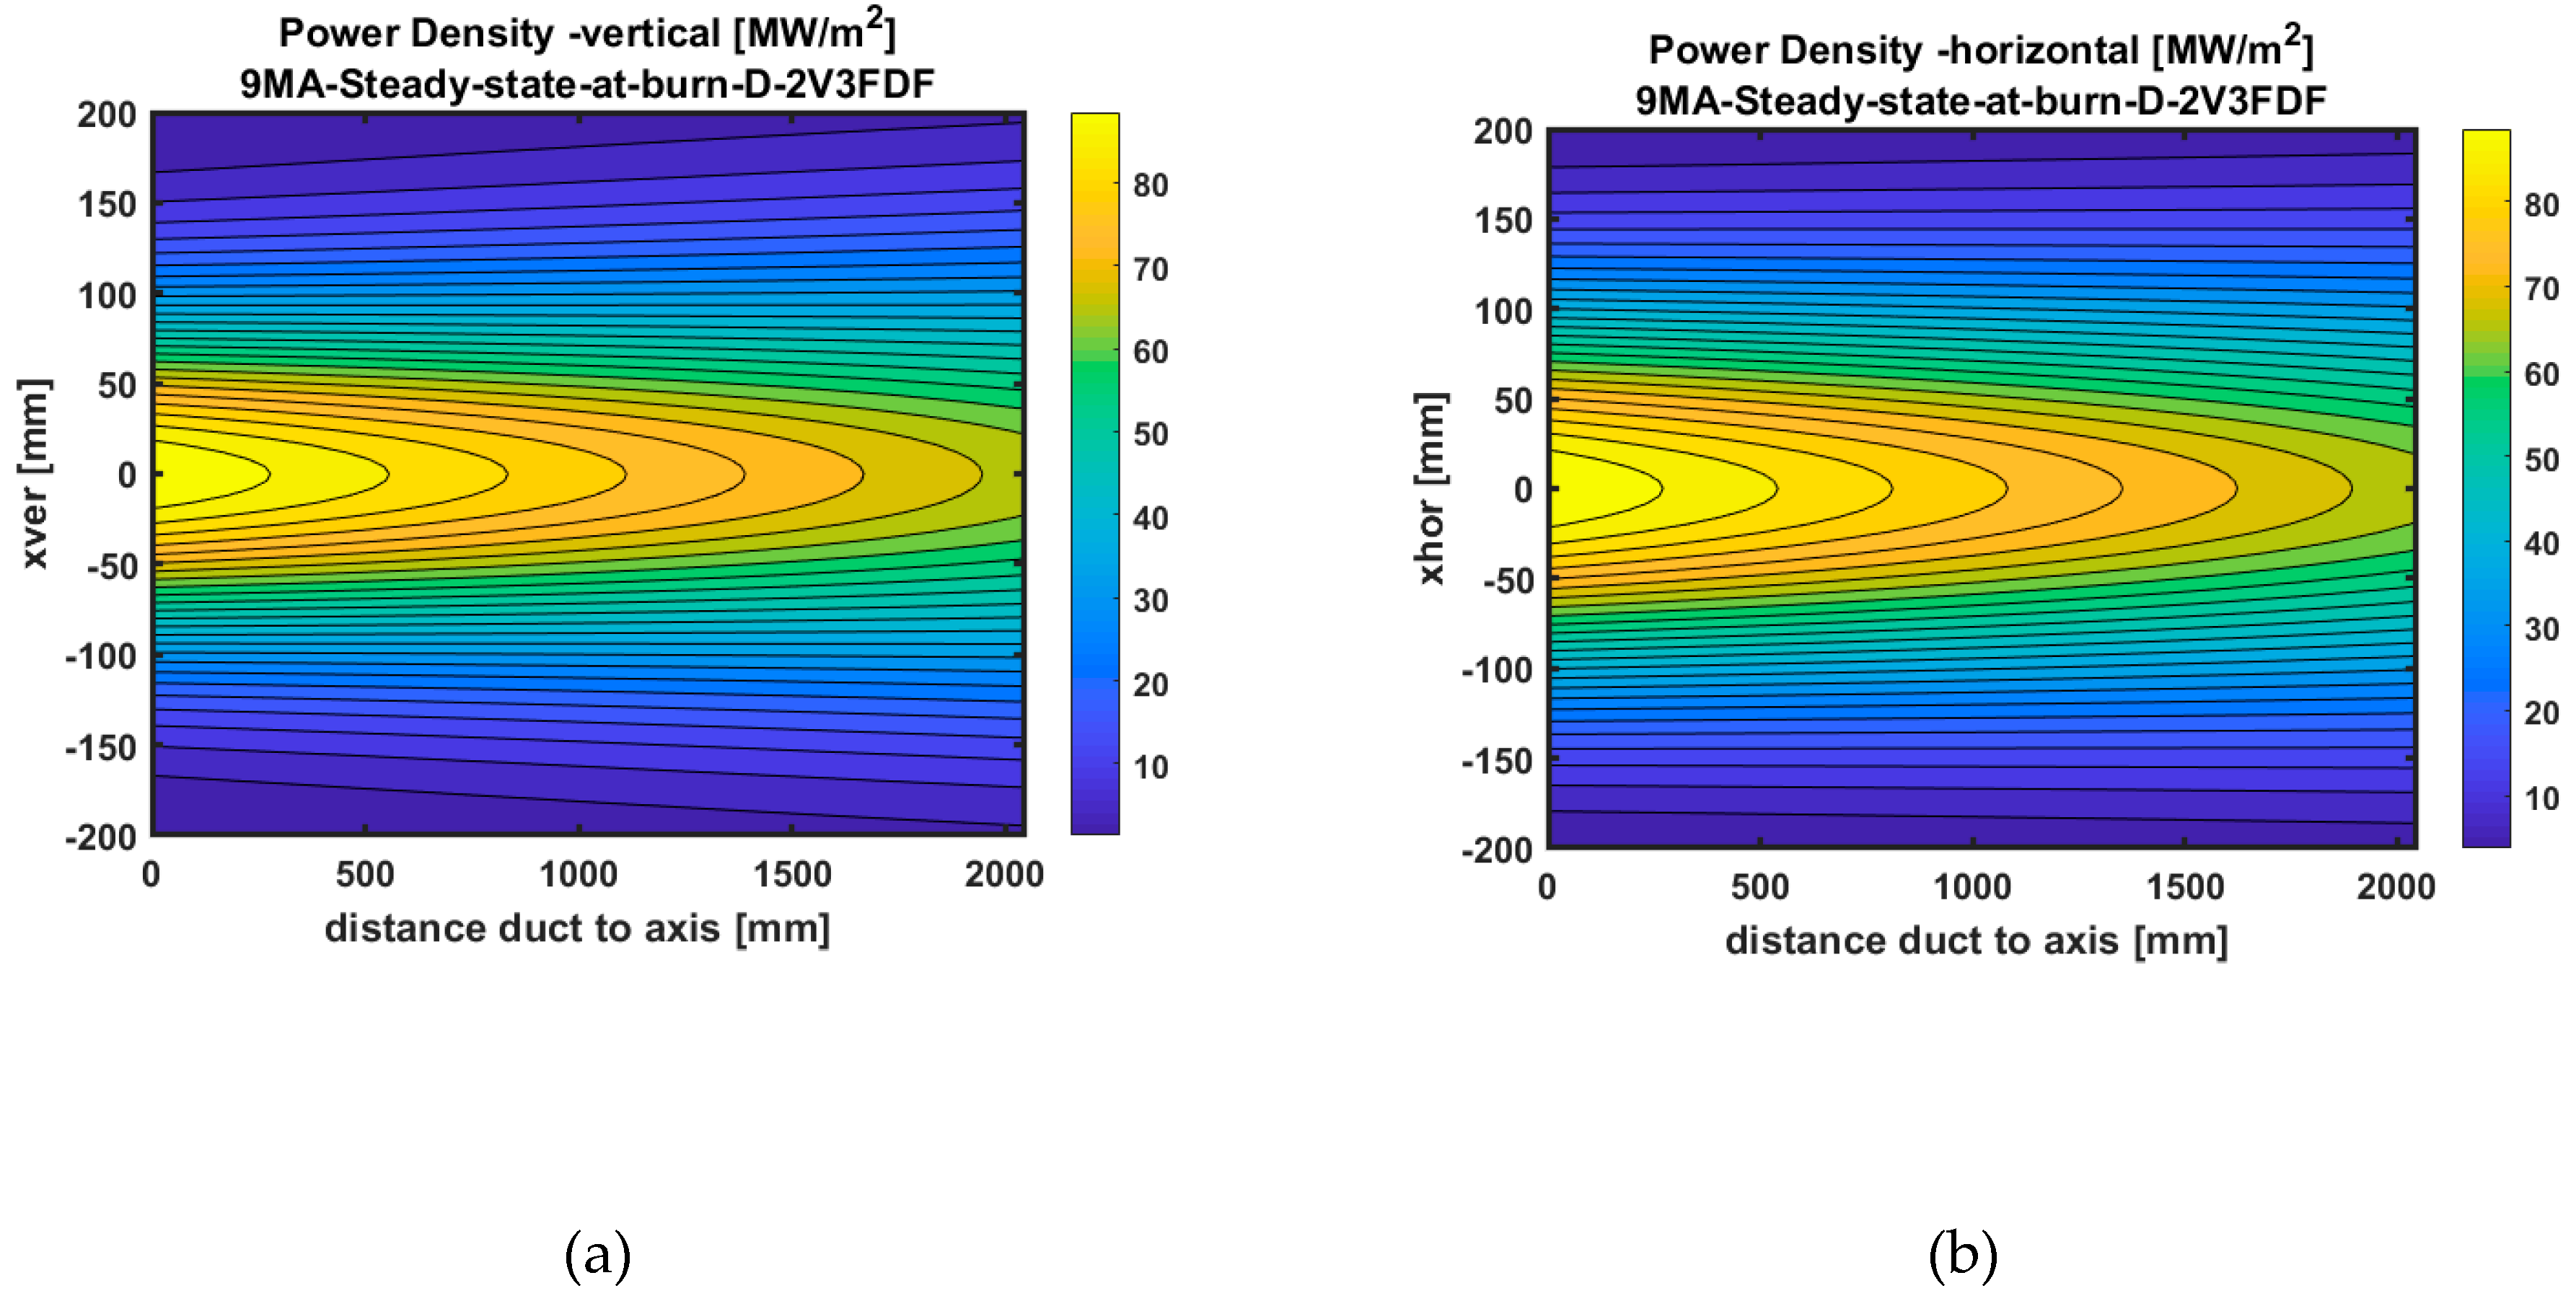
We have used here only one representative beam energy E and beam power P (as it would be the case for a negative ion source neutral beam). Figure 4a,b show the ITER diagnostics neutral beam (DNB) power density profiles in vertical and horizontal direction as a contour plot versus distance from duct position (plasma entry) for the low-density 9MA case.
2.3. SOS Continuum Radiation Modeling
The underlying plasma continuum spectrum is integral part of any fusion spectrum, in fact in the ITER case it is the dominant light source, typically orders of magnitudes above the expected CXRS spectra. Historically, the plasma continuum radiation (cf. [42]) which is a common light source accessible to all visible spectroscopic diagnostics, is frequently used as in-situ calibration source enabling a consistent integrated data analysis. The calculation of line-of-sight integrated free-free continuum radiation requires plasma profiles as well as local Gaunt factors (cf. [43,44,45]). SOS uses the Burgess–Summers Gaunt factor calculations [44] depending on wavelength, electron temperature, and ion charge.
The measurability of any active spectrum, assuming for example, a modulated Diagnostic Neutral Beam, depends crucially on the active signal level compared to the noise-level of the underlying continuum background spectrum and also intensive plasma edge lines (e.g., diffusively reflected Dalpha radiation from the diverter). Any feasibility study for active beam based CXRS depends therefore crucially on accurate mapping of line-of-sight paths through the plasma making and accurate reconstruction of continuum radiation.
2.4. SOS Modeling of Neutral Density Using EIRENE Code
SOS uses for the calculation of atomic and molecular densities a tailored stand-alone executable of the EIRENE code [18]. The neutral density at the plasma boundary is derived from the hydrogenic particle flux hitting the wall assuming 100% recycling. The particle flux is calculated from the total particle plasma content, its surrounding wall surface and an estimated particle confinement time associated with a mean radial diffusion of D = 0.5 m2/s, and local thermal velocity corresponding to 5 eV. The derived plasma boundary density is thus only a crude average estimate and local values most likely deviate considerably. However, the main purpose of the SOS neutral density modeling is the provision of a radial shape of neutral atoms across the last closed magnetic flux surface which is needed for the modeling of the passive CX emission layer. This enables the reconstruction of a line of sight integrated synthetic passive spectrum (see next section).
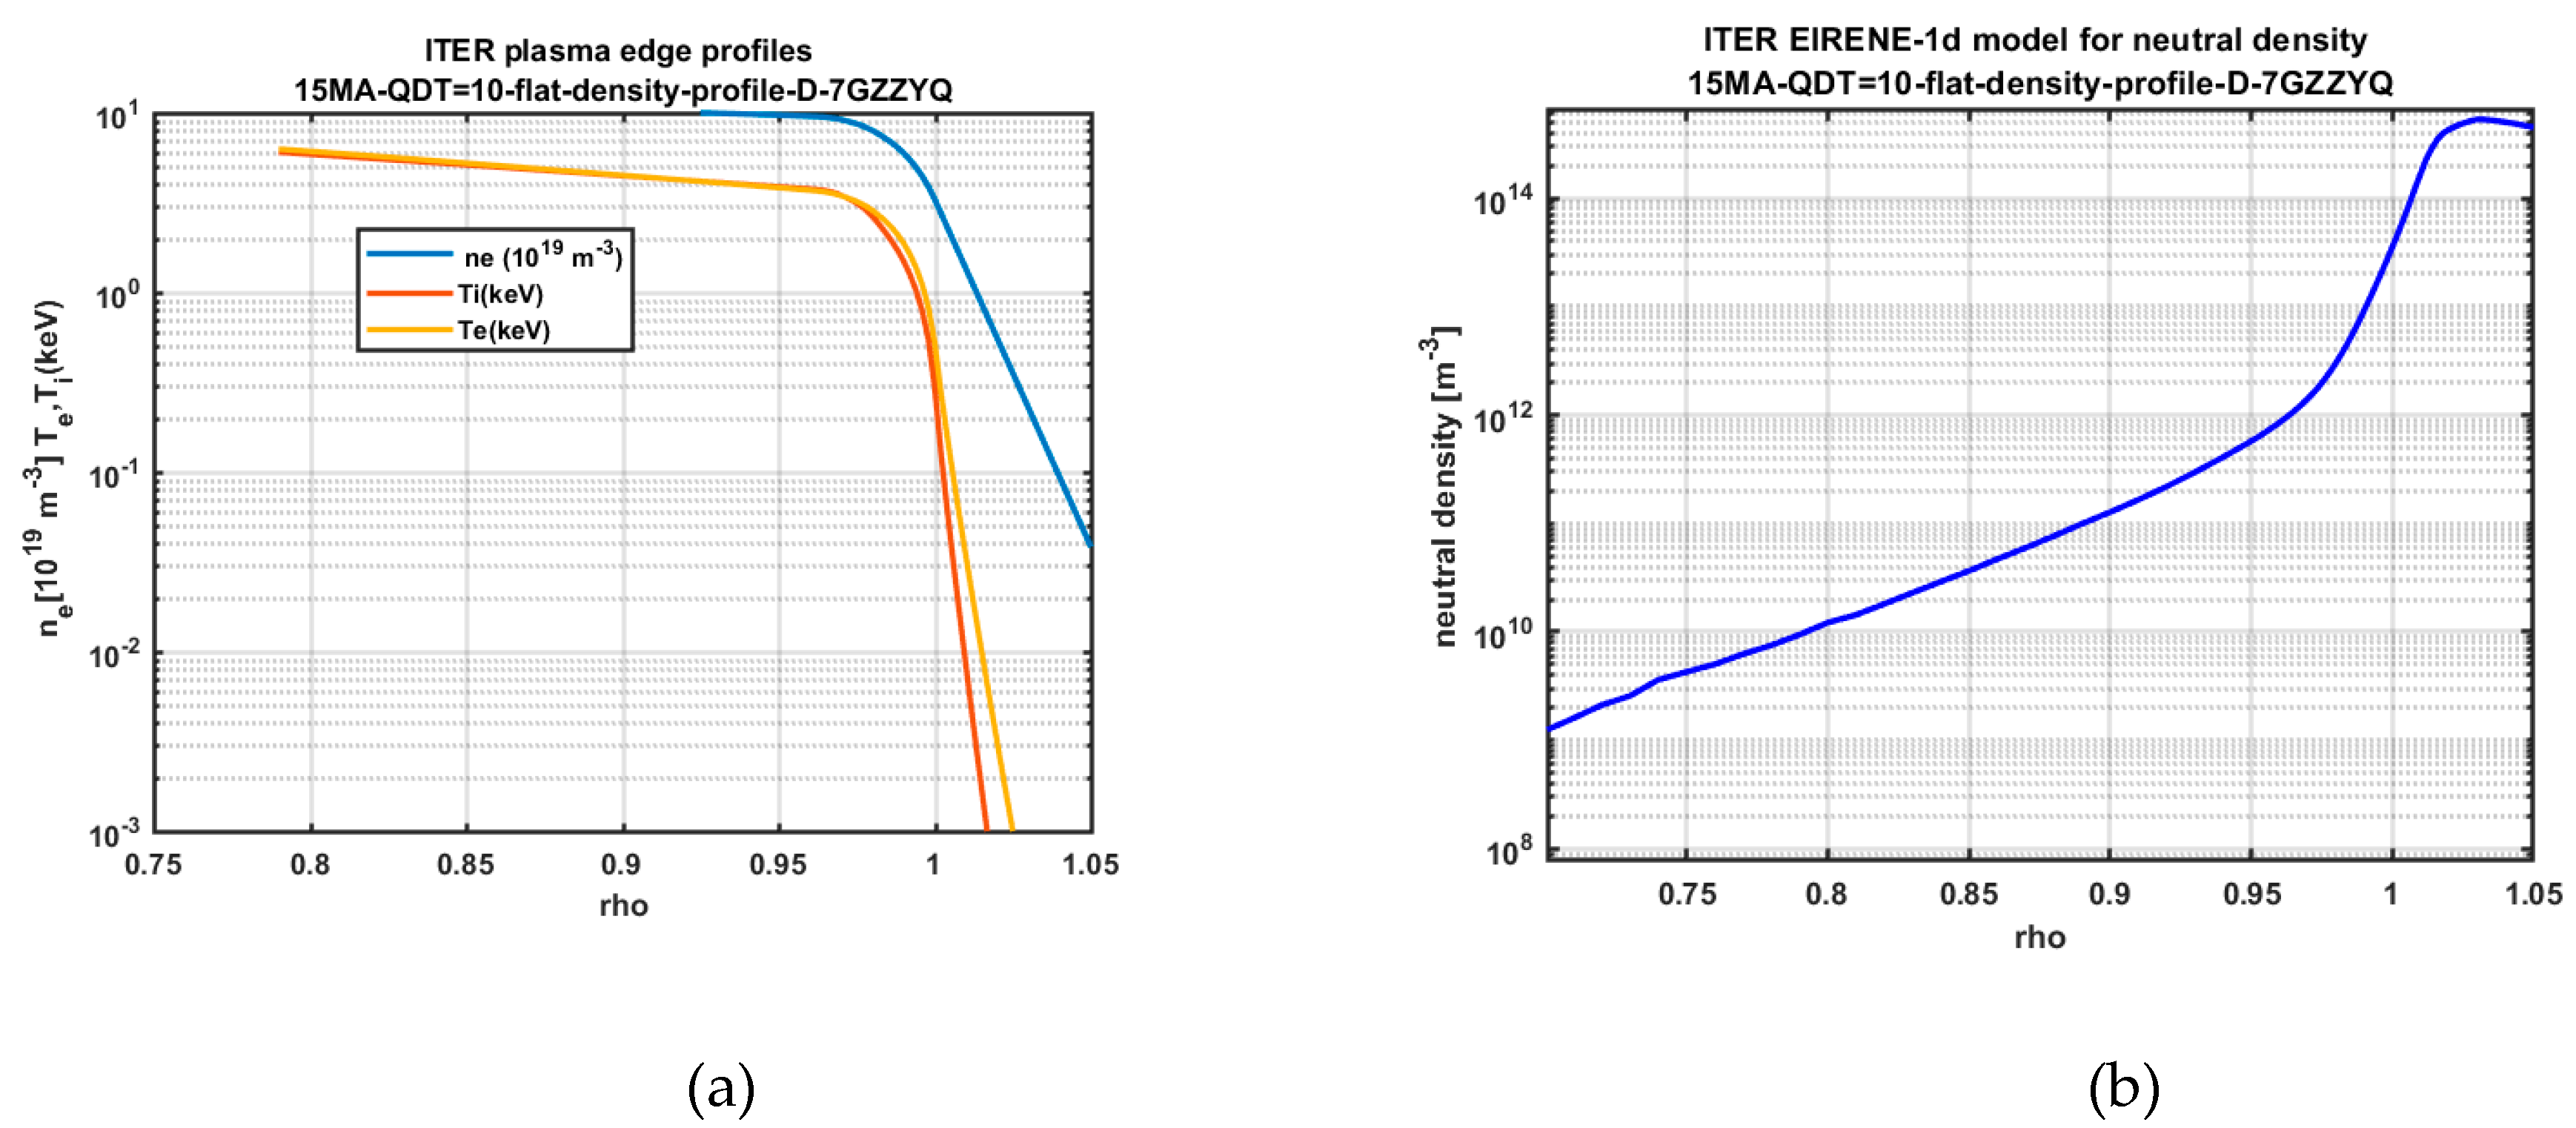
The required EIRENE inputs are plasma profiles for ne, Te and Ti mapped on normalized radii which are exponentially extended beyond the standard radial grid, which ends normally at the magnetic separatrix last closed surface, ρ = 1. The extended plasma profiles cover the range from magnetic axis to plasma wall (0 < ρ < 1.05). The wall position is assumed to be at ρ = 1.05. The extended plasma profiles for the ITER 15MA scenario (see also Figure 1b) are shown in logarithmic scale in Figure 5a. Figure 5b demonstrates the EIRENE modeling of atomic hydrogen density.
2.5. Passive Charge Exchange Synthetic Line of Sight Integrated Spectra
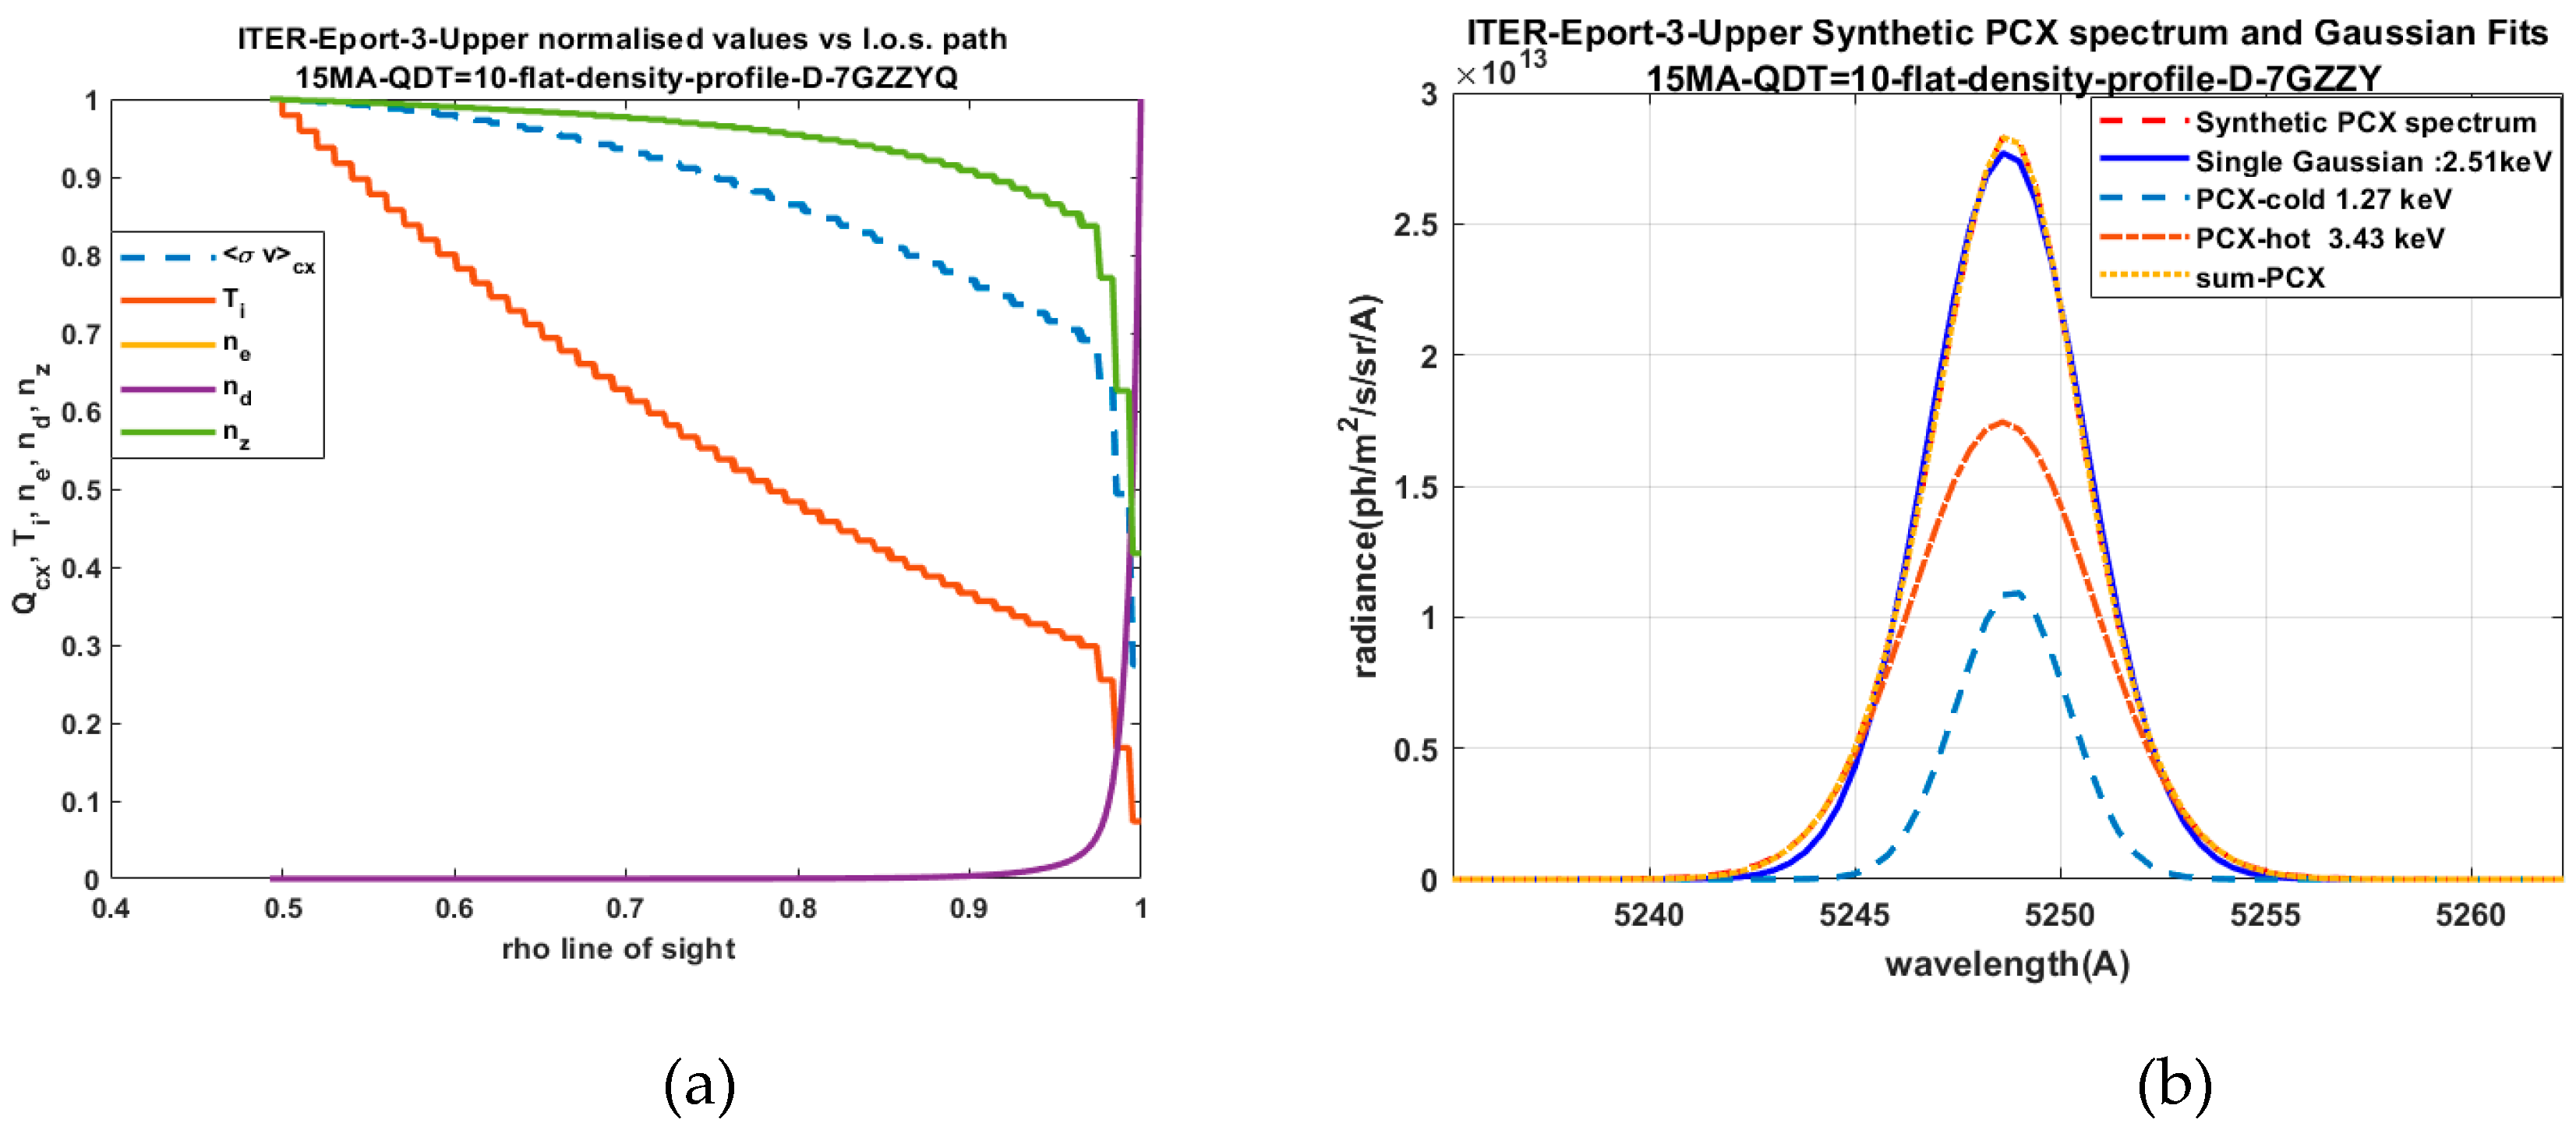
A further example of the iterative evaluation process of CXRS spectra is the synthetic PCX spectrum (cf. [46]) which is calculated from a neutral density profile nd (ρ) acting as donor for the PCX reaction, a radial density profile nz(ρ) of the explored impurity ion, and finally a local CX excitation rate < σv > CX (ρ). Since the PCX feature is part of a composite spectrum including passive and active features, the PCX spectral model needs to be updated after each iteration
The line of sight integration along path s is mapped on the associated magnetic flux coordinate ρ = r/α. The Doppler width λd(ρ) and Doppler shift λ0 represent local ion temperatures and plasma rotation. The following example (Figure 6b) illustrates the potential asymmetric and non-Gaussian character of the resulting synthetic PCX spectrum for the ITER high-density case.
2.6. SOS Modeling of the BES (Motional Stark Effect) Spectrum
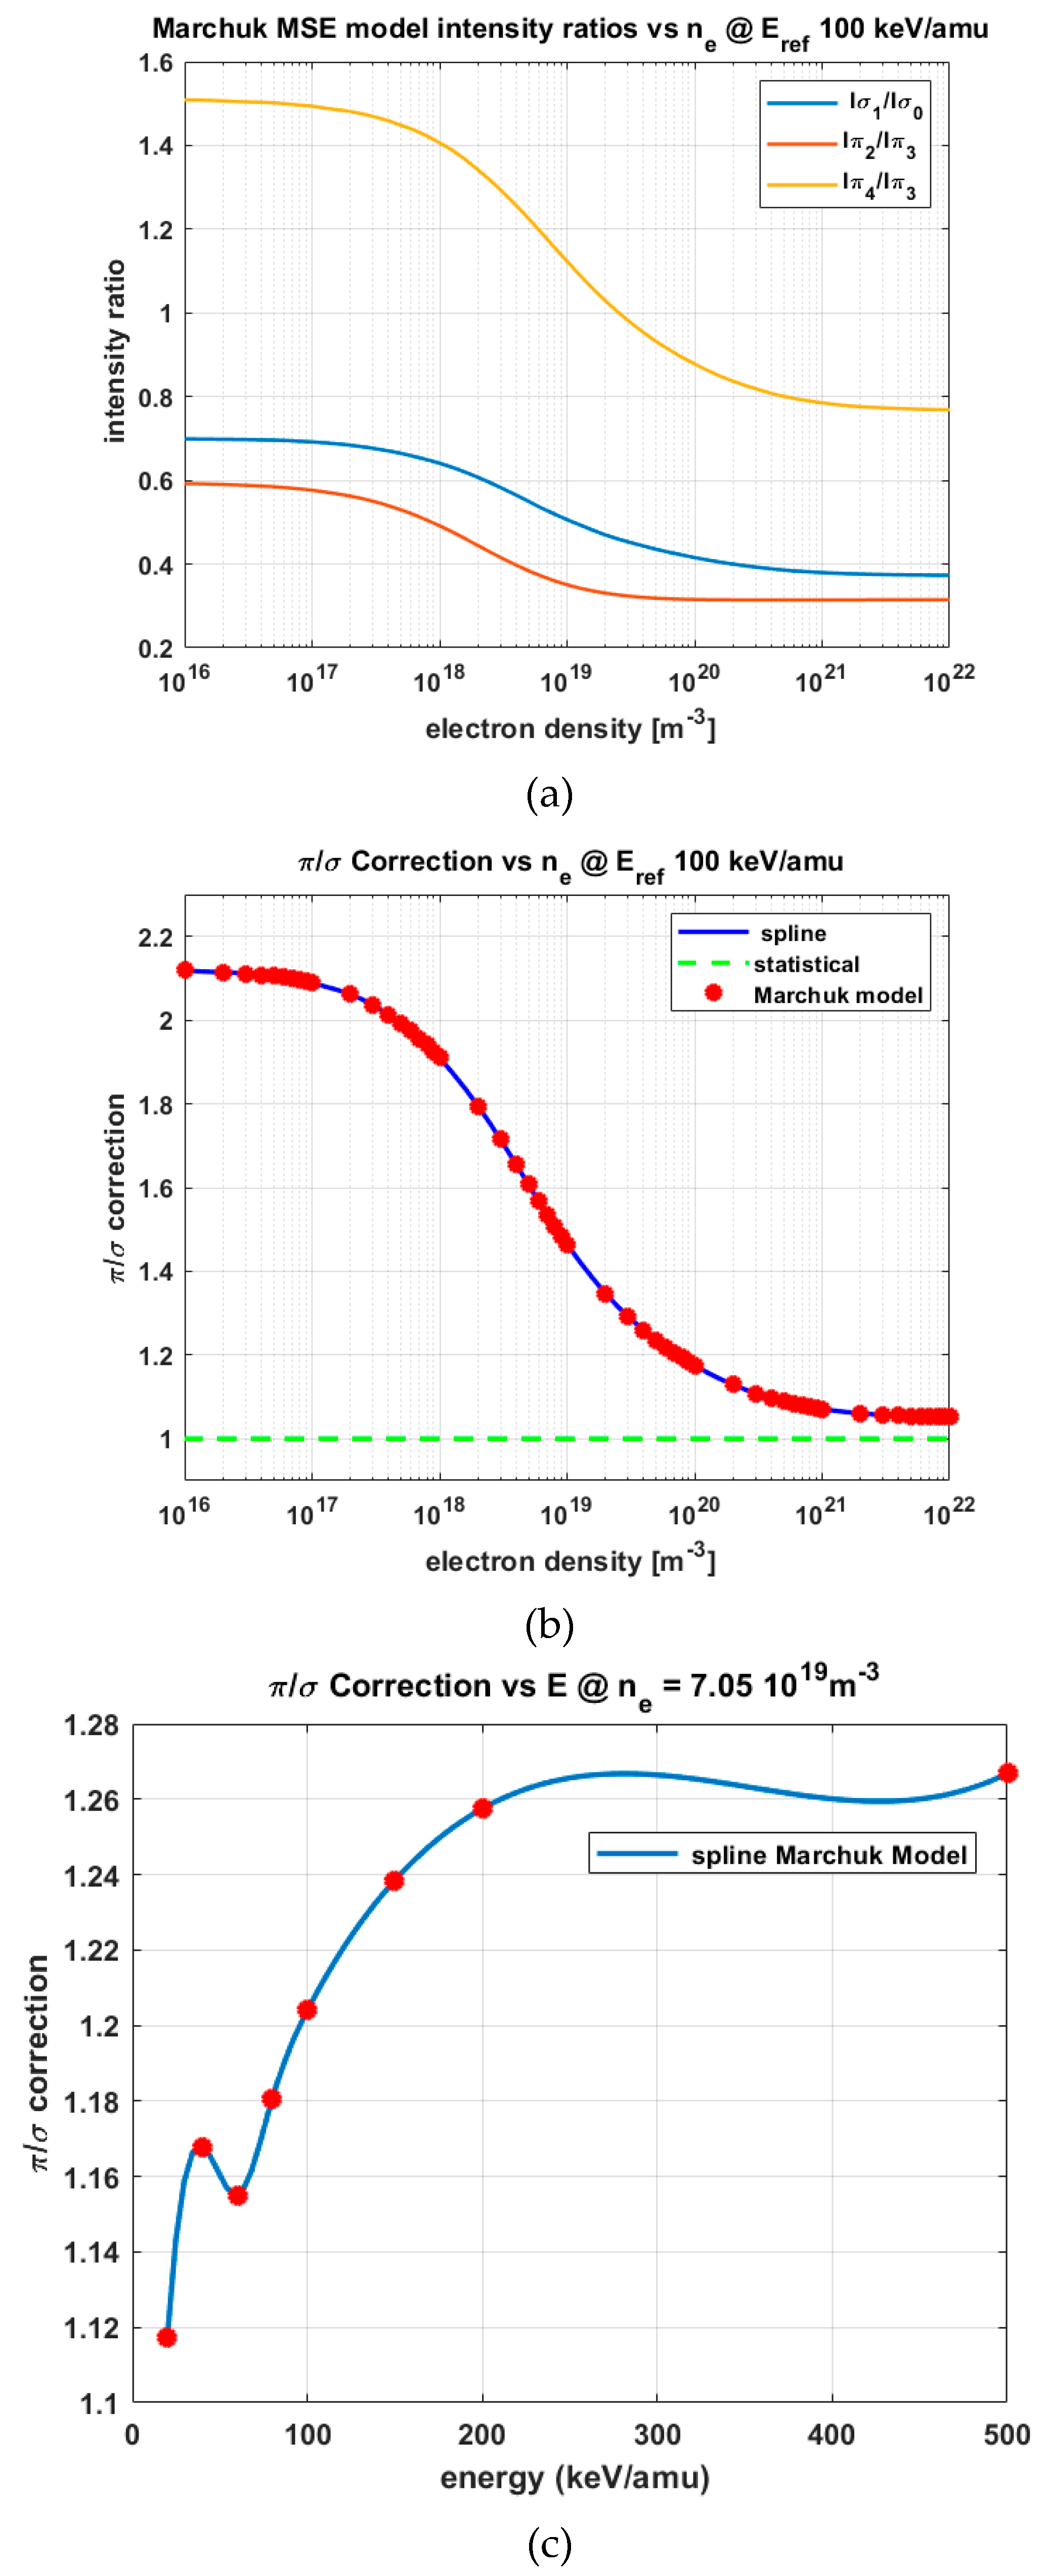
The Motional Stark Effect induced by the high-energy neutral beam passing through a strong toroidal magnetic field is considered to be a powerful diagnostic tool assisting the reconstruction of local magnetic fields in a magnetically confined plasma, e.g., the so-called q-profiles. The ultimate aim is to use MSE as tool to constrain the reconstruction of current profiles and thus minimize associated intrinsic uncertainties using extensive equilibrium codes (EFIT). The technique is much advanced and is implemented in many of present fusion devices [47,48]. The challenge for SOS is to provide an adequate and precise prediction tool for the expected MSE spectra including a reliable estimate for the extraction of amplitudes, line-splits and associated error bars [49]. The task was recently solved by replacing the established statistical models with the simulation of populations of neutral beam in pure parabolic states [37]. Following this collisional approach, one is able to describe the relative intensity ratio for: , , and the sum of the different polarization components with high precision at intermediate density above 3–5 × 10¹⁹ m−3. Nevertheless, in the low density or corona regime of operation the discrepancy remains. On the one hand it was shown that the calculations of the cross-sections in parabolic states represent the linear combination of the elements of density matrix of excitation. But on the other hand, the comprehensive methods of calculations provide still quite different results [50]. The verification and benchmarking the new data is one of the most challenging tasks for the next years. Currently the SOS utilizes the results [37] as a function of beam energy and density. The results of calculations from non-statistical model are summarized in Figure 7. This means the σ0 component can be expressed entirely in terms of the multiplet sub-level line ratio and the ratio of π/σ sigma group. The line shape profile of each component is again can be described using the Gaussian shape (Figure 8).
Asymmetry of Observed MSE Spectra Caused by Divergence of Neutral Beam Assembly
SOS MSE modeling takes into account the angular spread of velocity vectors in the divergent cone of a neutral beam crossing the magnetic field thus causing a spread of Lorentz field values (ELorentz = v × B). Similarly, the non-perpendicular intersection of line of sight and angular cone of neutral beam leads to an associated spread of observed Doppler shifts of the MSE spectrum. This is in particular the case for the MSE diagnostic on ITER using the nearly tangentially injected heating beams (D0, 500 keV/am, 1.7 MW). A comprehensive treatment of the MSE model as developed by De Bock [48] takes also into account the additional smearing effect caused by the finite cone of the observation optics. For the ITER case with substantial observation F-numbers (>30) this effect is small compared to the smearing effect caused by the substantial size of the Negative Ion Grids and the significant angular spread of the 1280 beamlets.
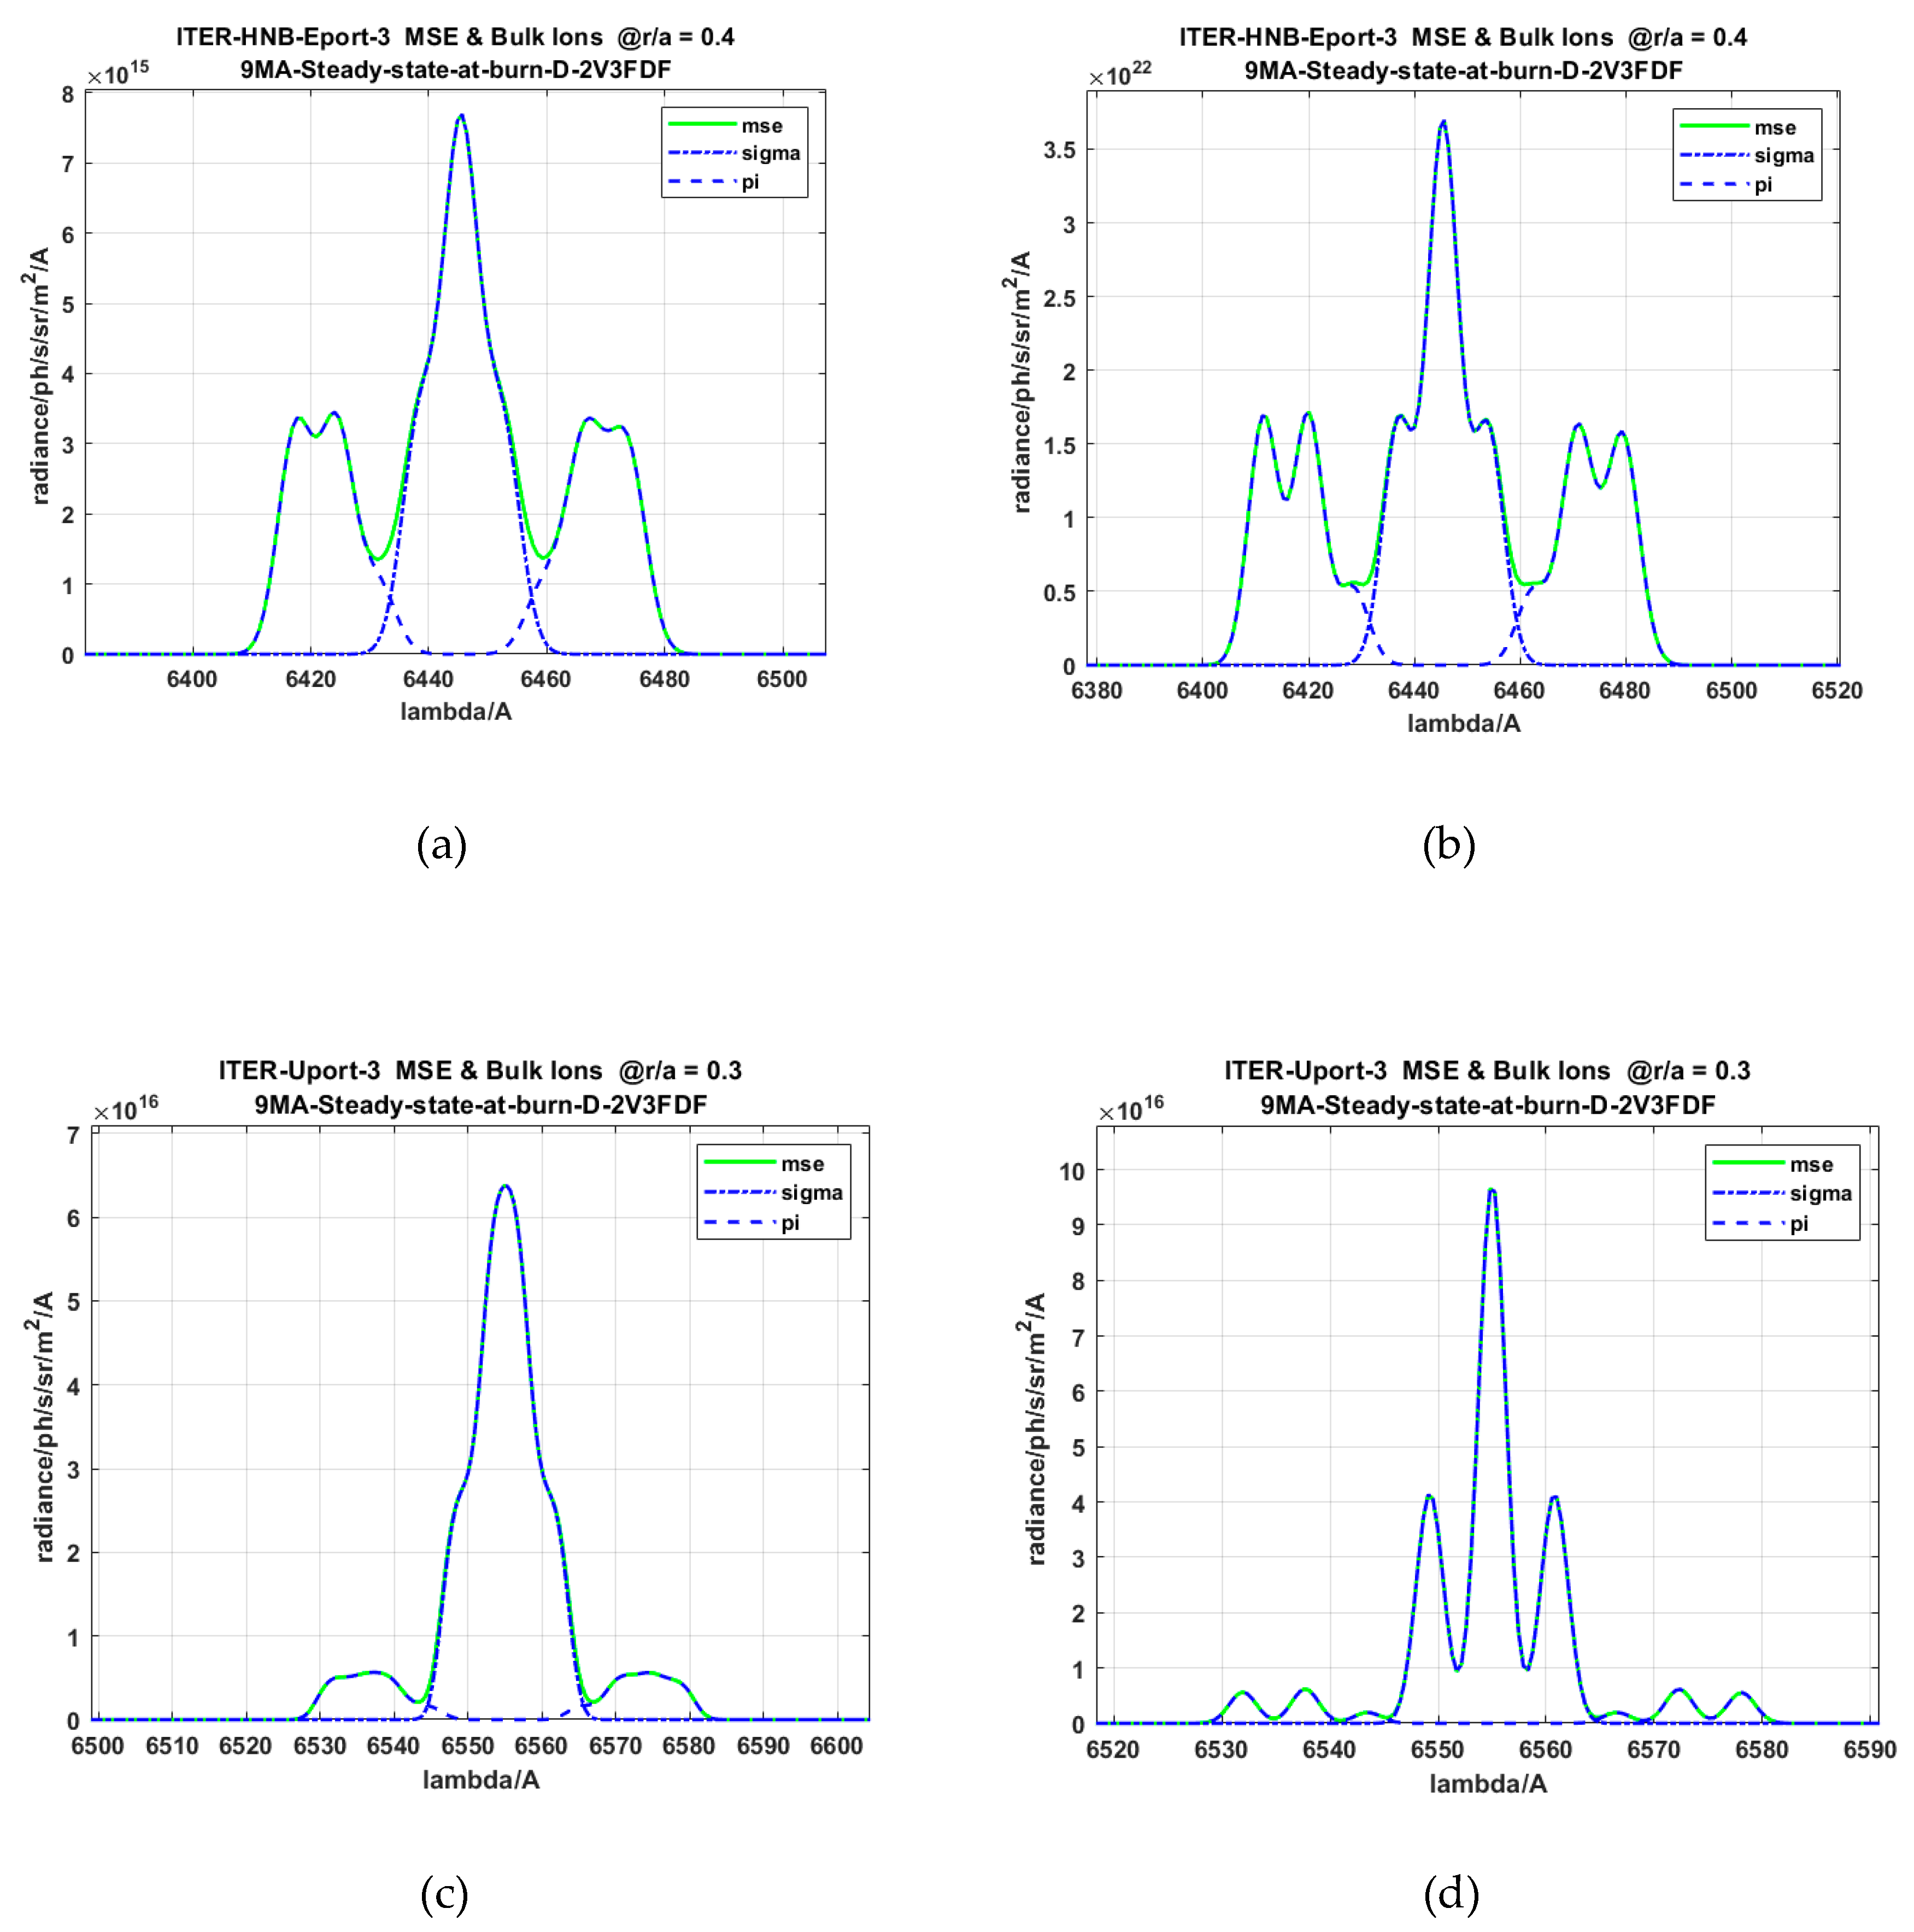
The following examples illustrate the asymmetric character of simulated ITER MSE spectra in the two cases of using the ITER heating beams (HNB) or the diagnostic beam (DNB).
2.7. SOS Halo Model
Any injection of a high energy neutral (hydrogenic) beam into a fusion plasma is accompanied by the creation of a neutral cloud (halo) along its injection path.
Many experimental observations (e.g., MAST, JET, AUG, DIII-D) have indicated that the halo dimensions are comparable, or at least close, to the actual neutral beam diameter. Obviously, in its role as probe beam for CXRS, the local beam and halo densities need to be precisely established for any quantitative prediction of CX spectra, and even more importantly, for their exploitation as a donor for the CX reaction and derivation of local plasma ion densities. For example, the main purpose of the ITER CXRS diagnostic systems (Edge CXRS and Core CXRS), is the measurement of local alpha particle densities and ion temperatures. Recent extensive computational models based on a Monte-Carlo procedure have successfully predicted local densities of beam and halo neutrals in a 3d Tokamak geometry [51]. The underlying principle is the launching of a substantial number of neutrals and followings their random path after multiple collisions with plasma ions and neutrals. The Halo diffusion model is described by the continuity equation and Fick’s law:
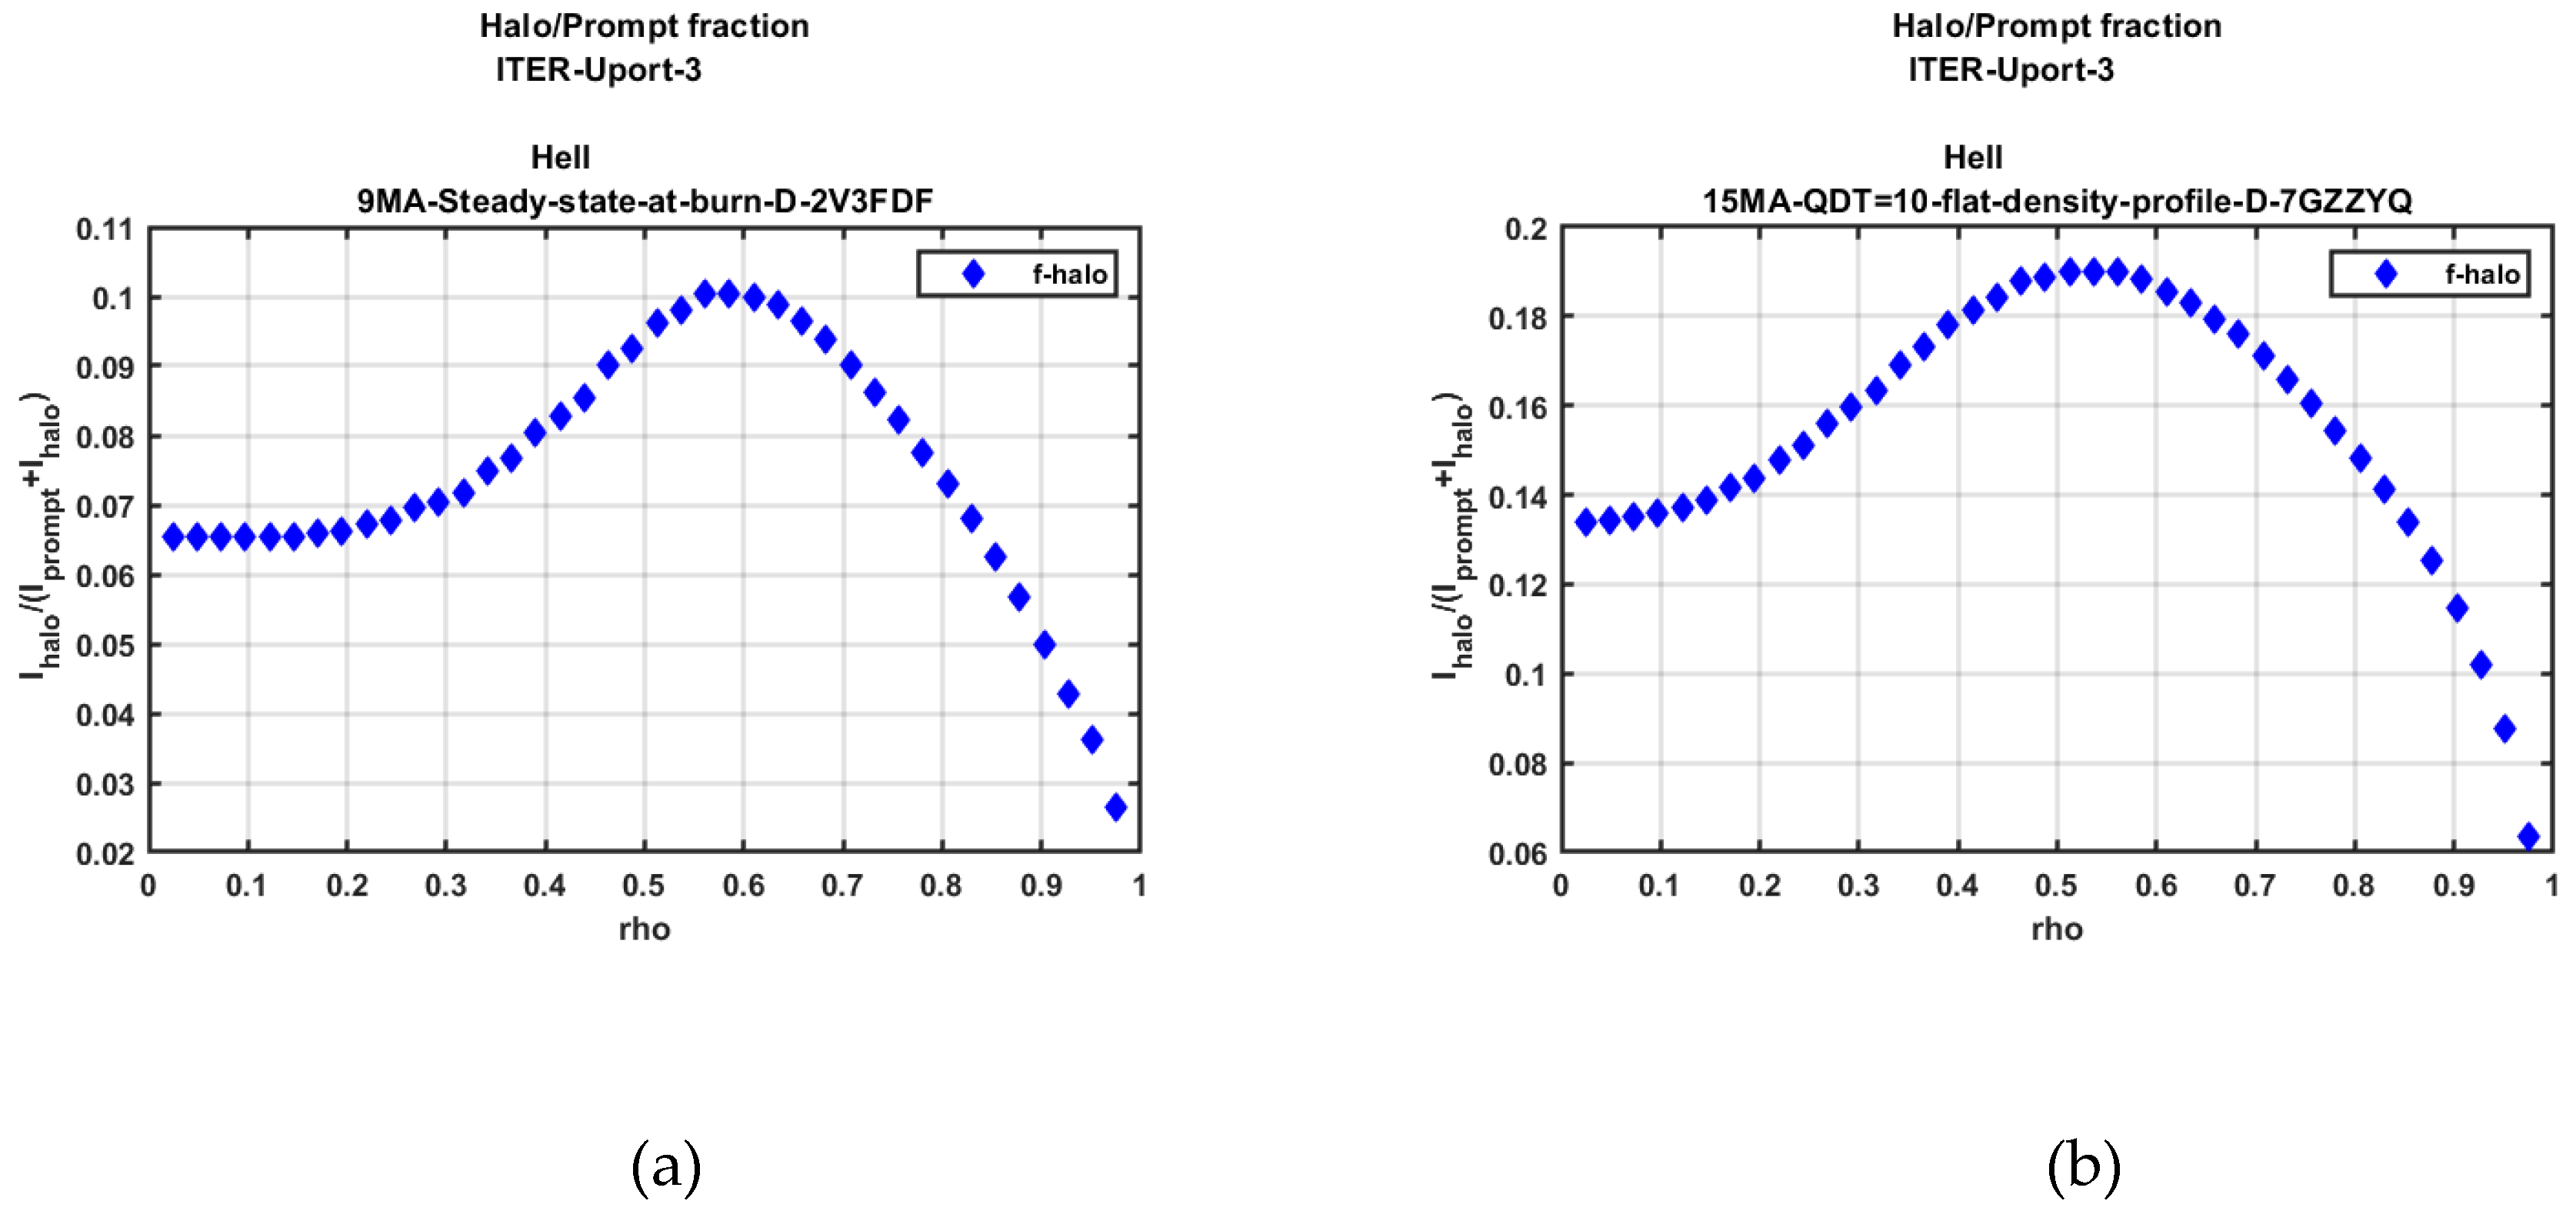
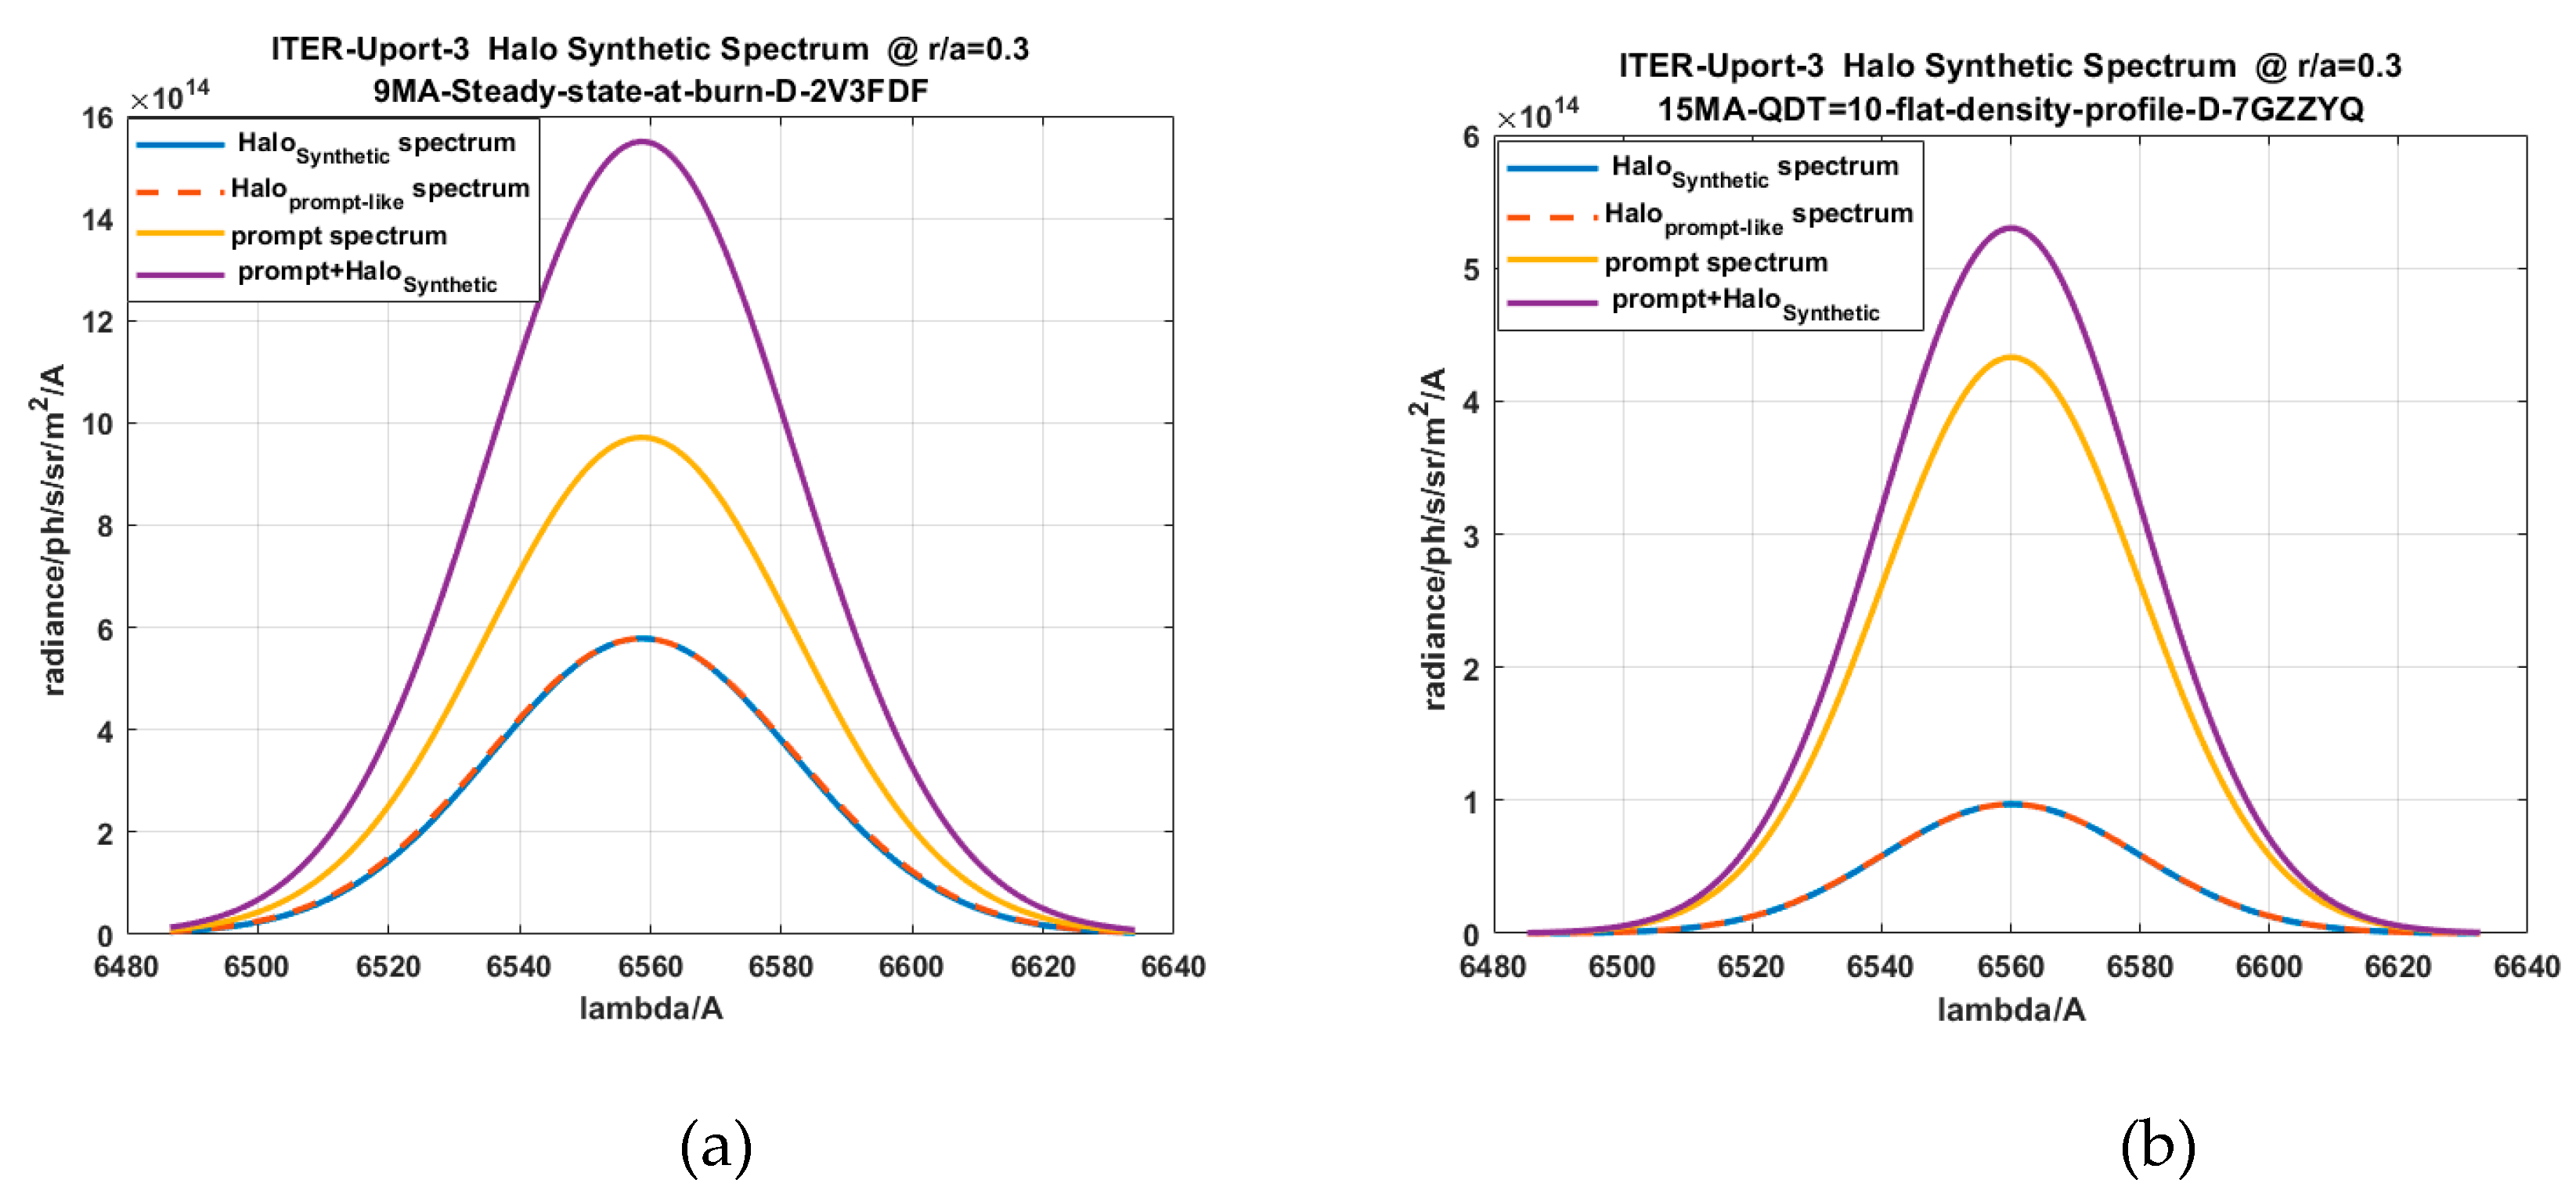
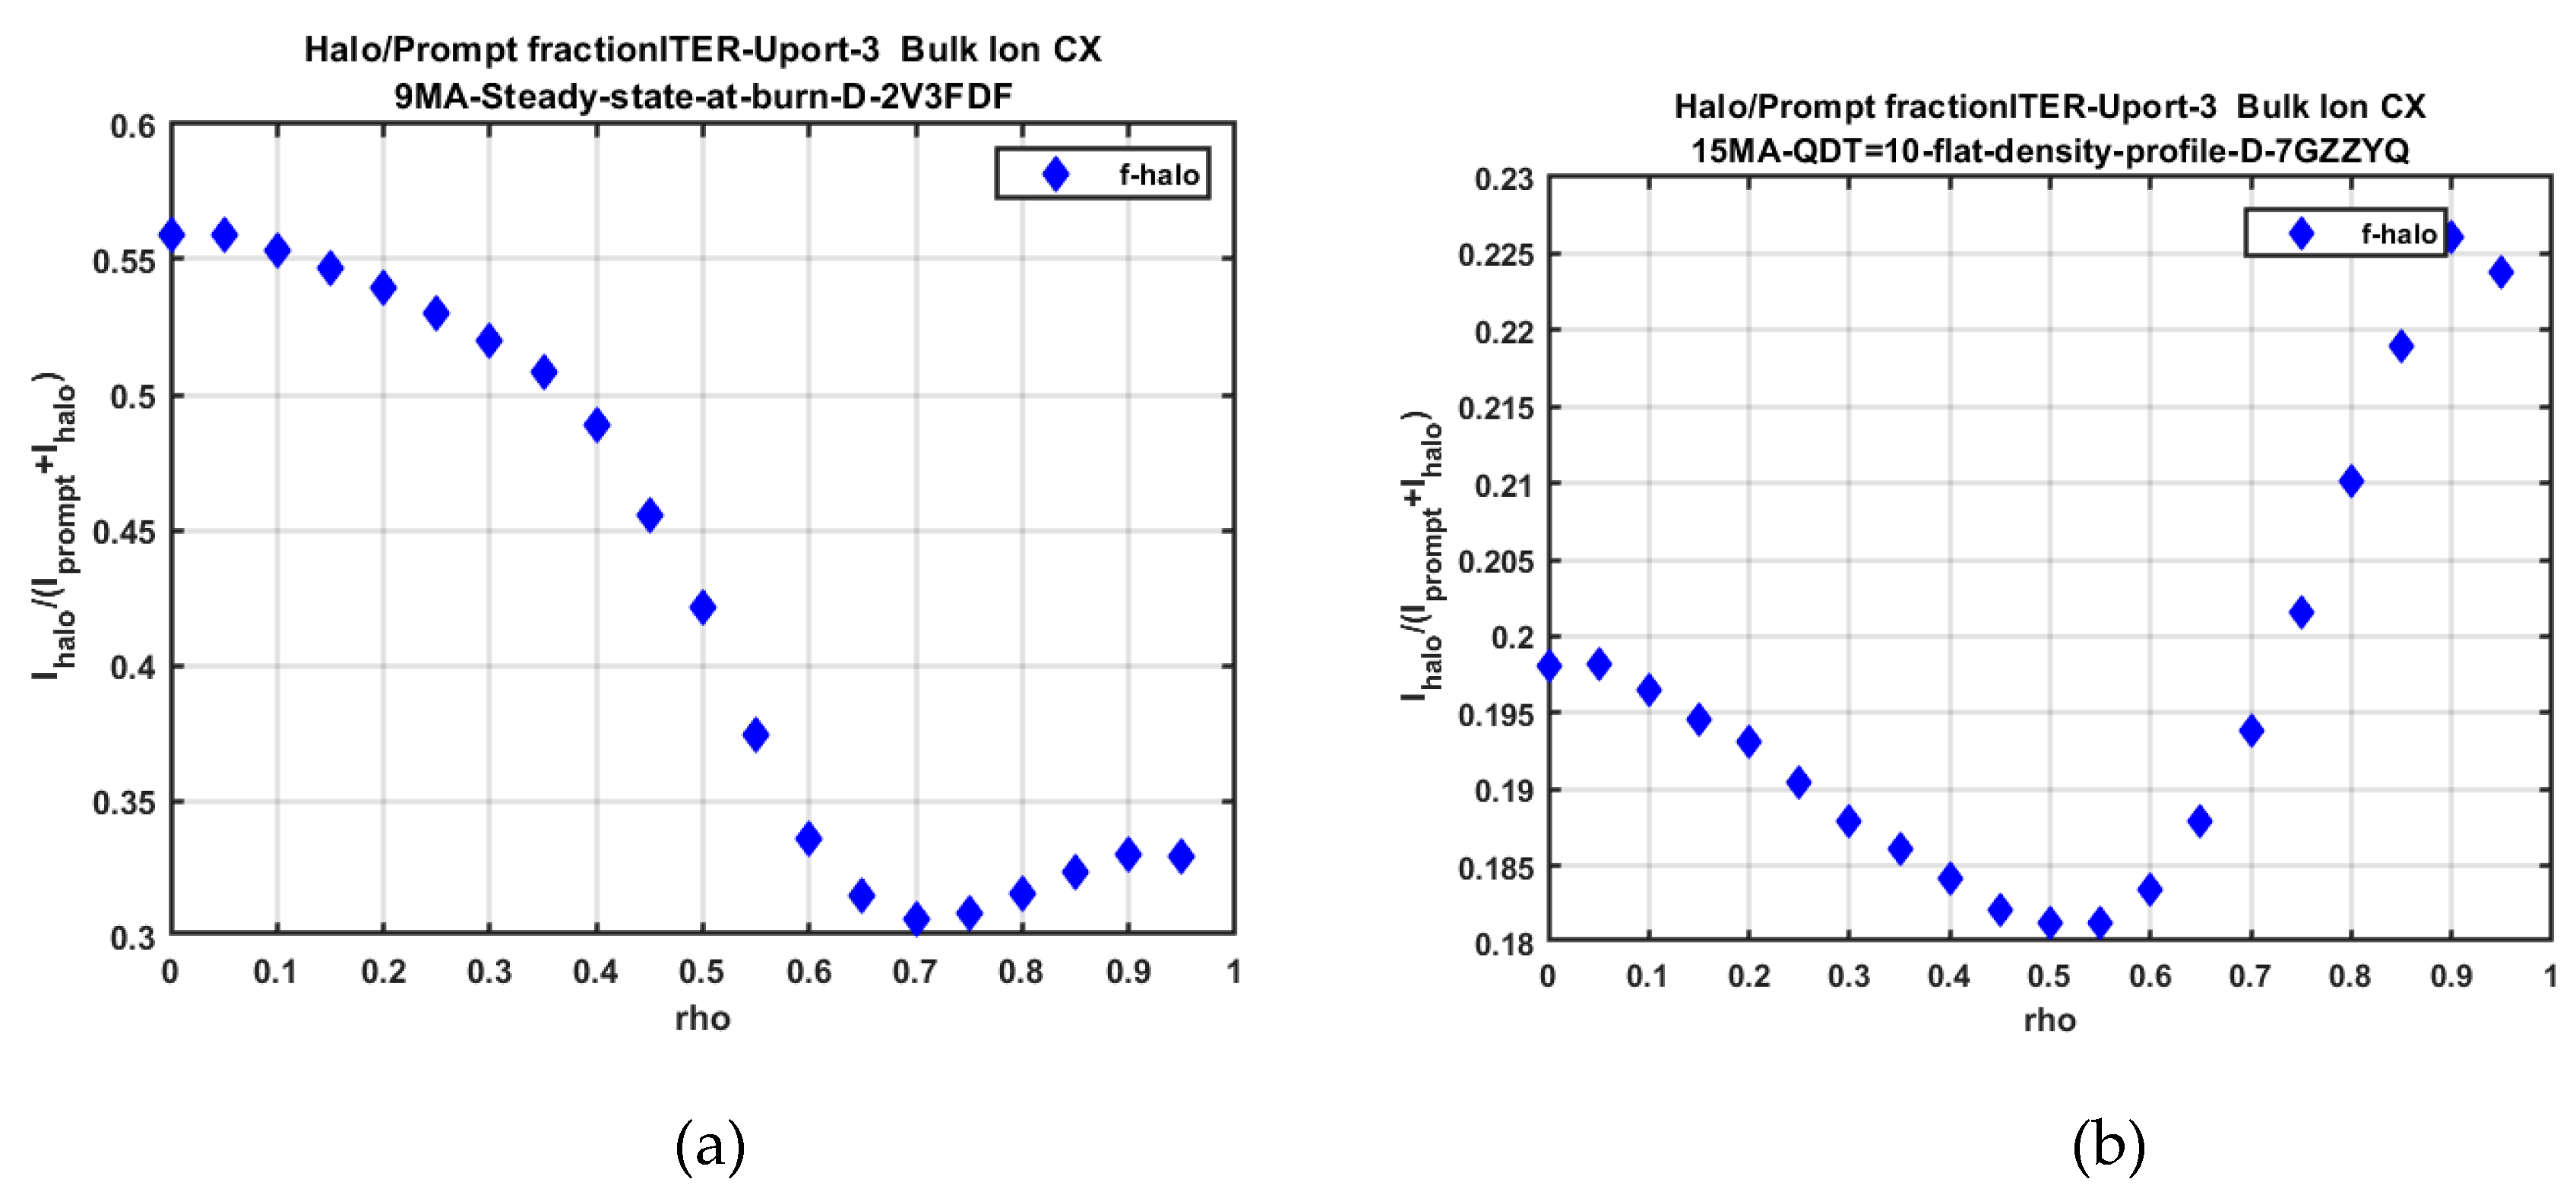
Here, the halo source (Shalo) is produced by the charge-exchange between fast beam atoms and thermal plasma ions. On the other hand, the ionization by electron and ion impact of the halo remains the major loss mechanism (α = ne<σeive> +ni<σiivi>, see Figure 9a). The observed emission of halo is in general stimulated by two processes: (a) by the direct capture into the n = 3 of hydrogen (QCX) or by capture into the ground state and by the subsequent excitation by the electron impact (QPEC). The solution of the diffusion and continuity differential equations leads to the reconstruction of radial halo profiles along the beam path, here radial refers to the distance from the beam axis. Figure 9b shows one example for the modeled halo density and beam density profiles for the case of the ITER 9 MA scenario with low halo-density, but compared to the actual neutral beam, significantly broader profile. However, the actual halo/prompt ratio spectrum (Figure 10) depends on the product of nhalo*QCX(T) and nbeam*QXC(E) respectively. The radial profiles of halo fractions (Ihalo/(Iprompt+Ihalo) are shown in Figure 11.
The observed halo spectrum is a line-of-sight-integrated spectrum. Each step along the line-of-sight path s is mapped onto the associated flux surface label ρ = r/a, and the synthetic sum-spectrum is created by summing up each spectrum, characterized by its local Doppler width λd and Doppler shifted peak position λz,0 and weighted by its local emissivity nhalo*nz*QCX
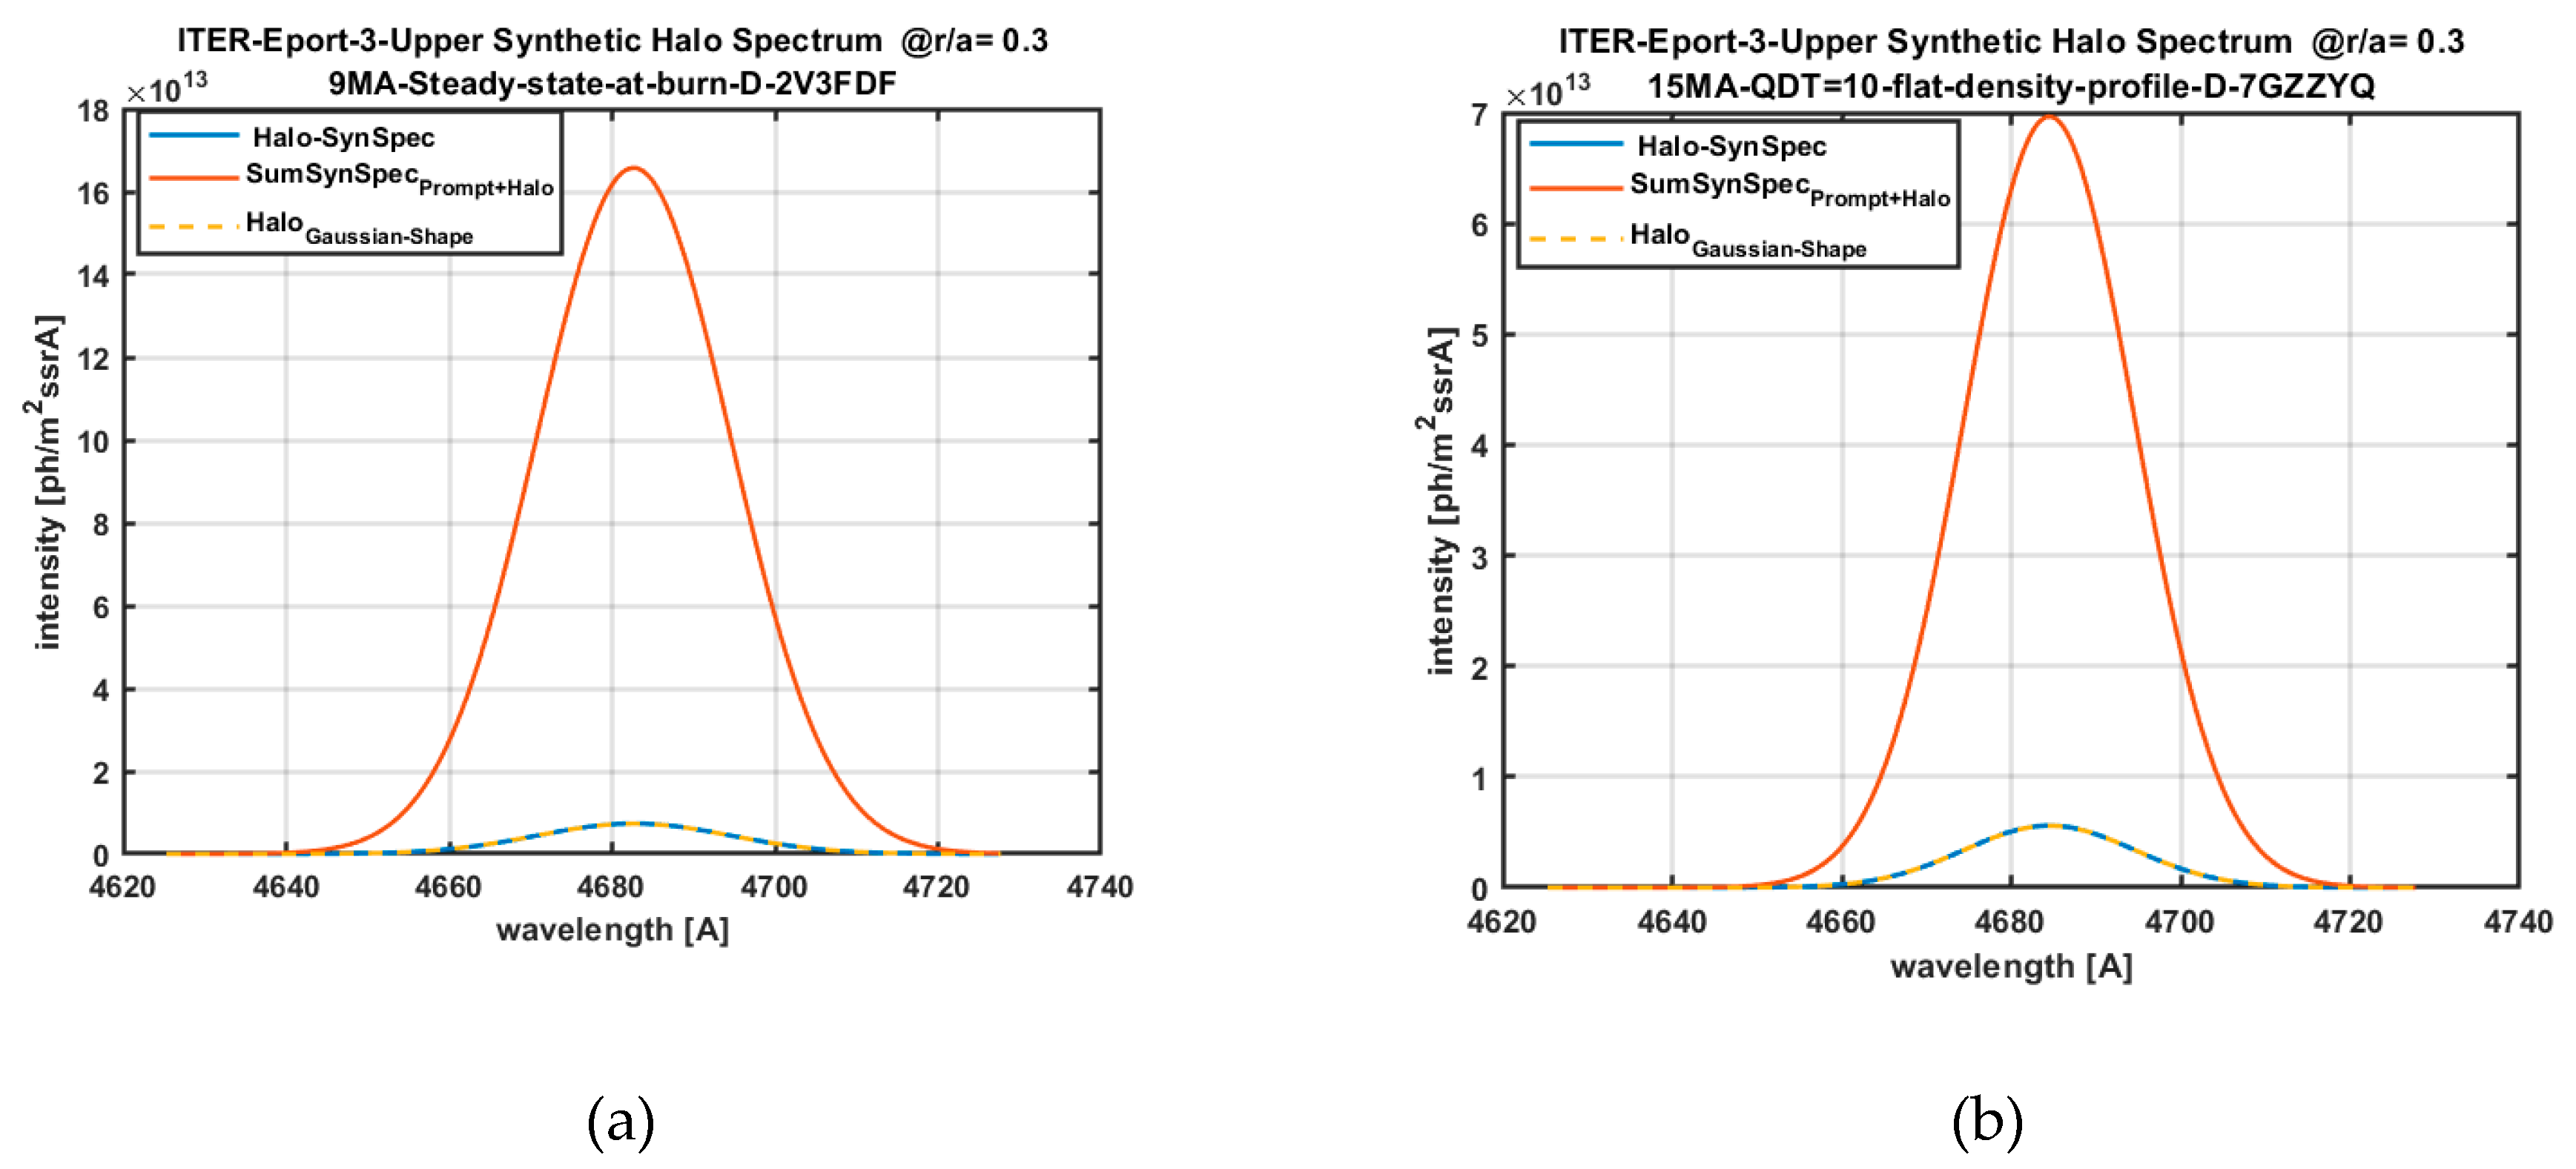
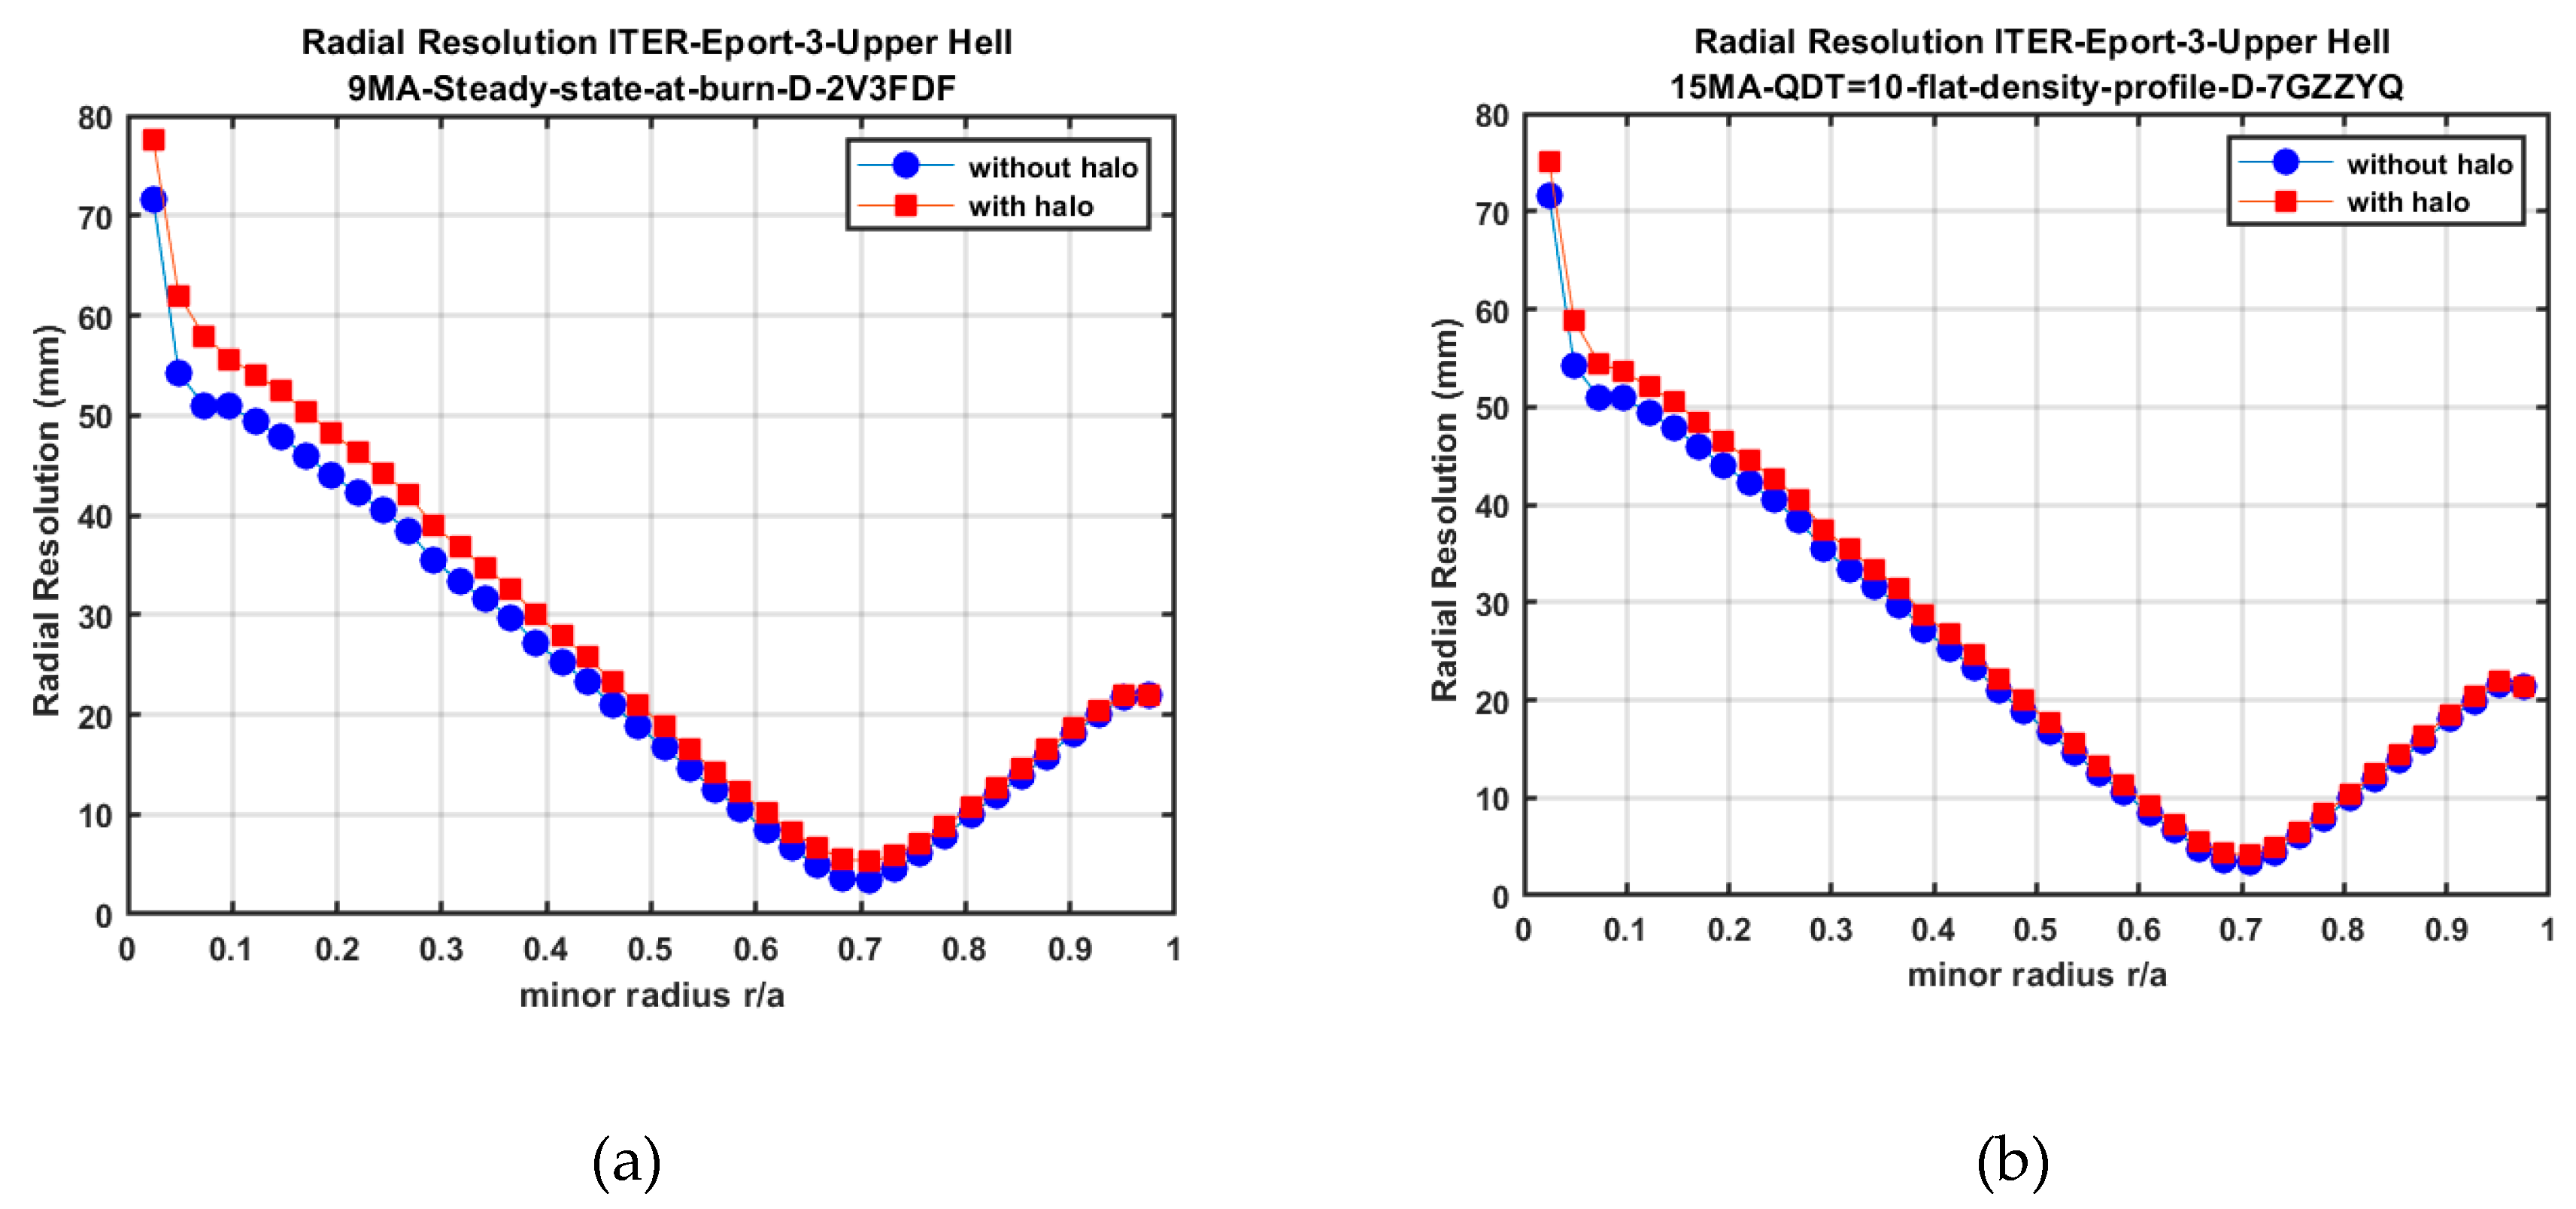
The most important outcome of the SOS halo modeling is the near localized character of the halo spectrum and its spectral shape which is almost identical to the Gaussian shape of the prompt CX reaction (cf. Figure 10). The halo effect essentially leads to a signal boost whilst preserving the spectral shape, however, accompanied by a moderate deterioration of the radial resolution (Figure 12).
The radial resolution σρ is derived from the expectation value for the local emission radius as determined by the weighted line-of sight integrated emissivity
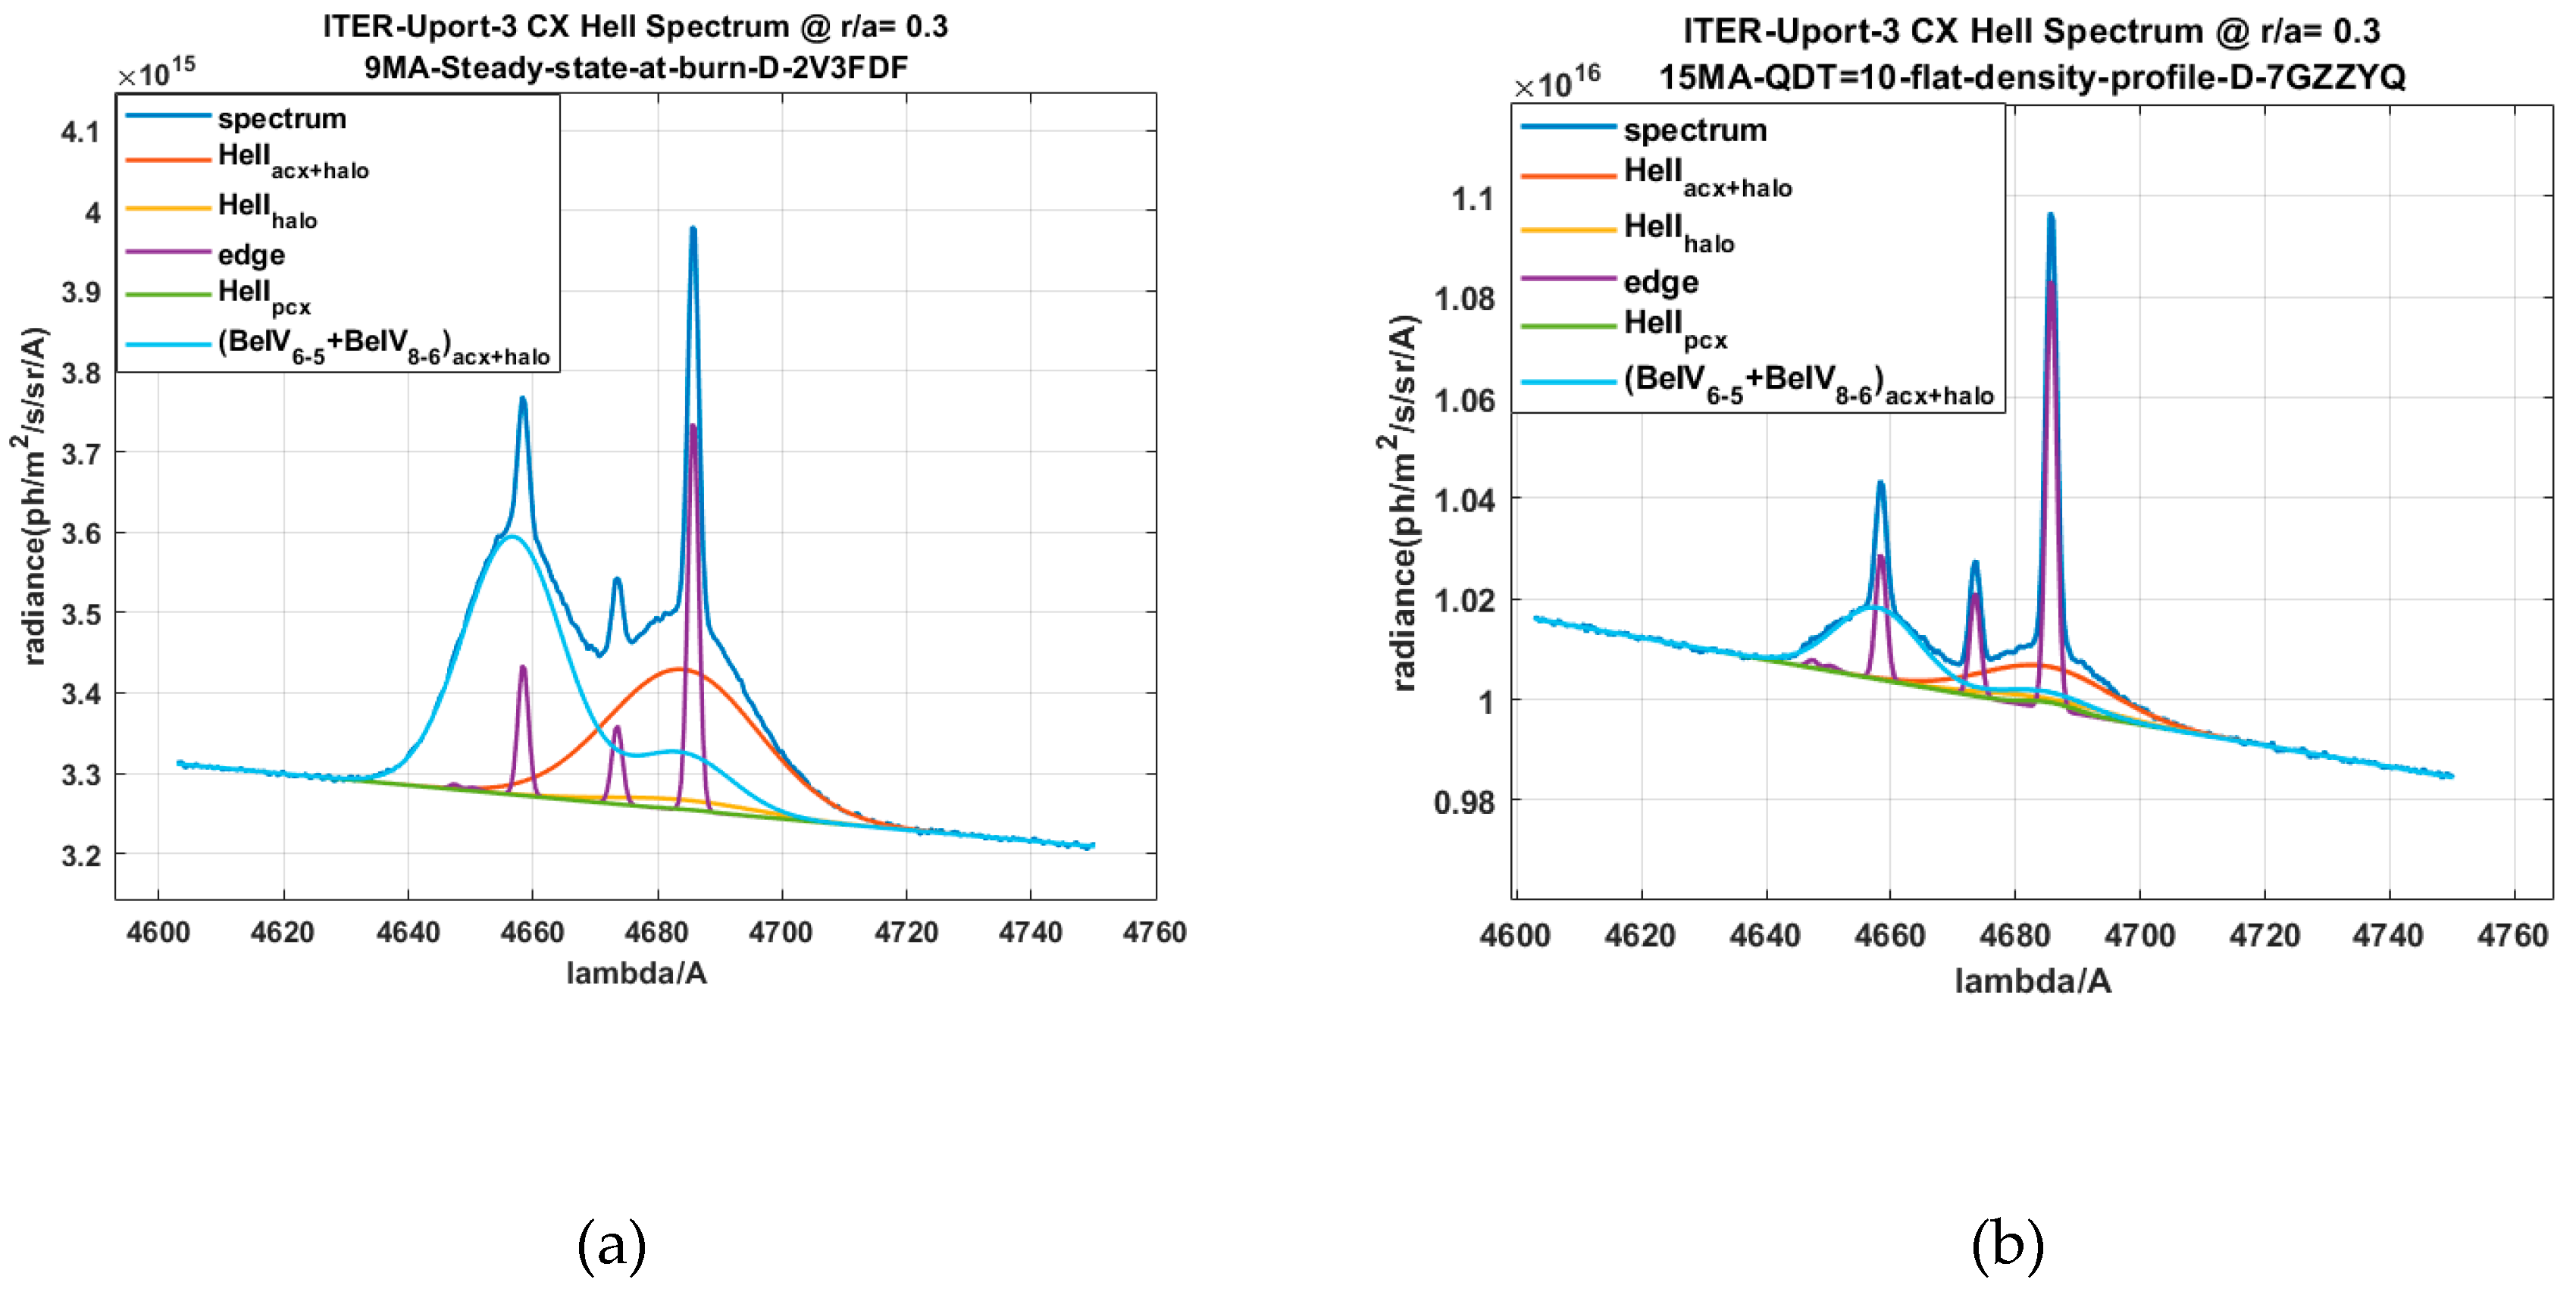
In order to derive the actual impurity ion density nz which is the ultimate aim of any CX diagnostic, the halo effect leads to an additional systematic error source caused by uncertainties in atomic data. In the case of the joint co-existence of both HeII and BeIV CX spectra in the same spectral region is actually a positive effect for the data retrieval accuracy assuming that the two ions have the same local ion temperature and local Doppler shift caused by plasma rotation. This implies that only one common unknown ion temperature and plasma rotation parameter is treated in a least-square minimization procedure when evaluating measured noisy spectra. Figure 13 demonstrates the impact of halo emission on the simulated spectra for two ITER plasma scenarios, with an assumed impurity ion composition of He (2%) and Be (4%). The spectra show the very low signal level of the He II PCX component, a comparatively strong halo component, a broad ACX (active charge exchange) HeII line and a broad ACX Be VI (n = 6 → n = 5) line. The BeIV ACX spectrum is accompanied by its twin spectrum (n = 8 →n = 6) at the same wavelength as the HeII spectrum.
D-alpha Halo Effect
The most pronounced halo effect occurs for the case of the Dalpha-CX spectrum. Here we have to consider two atomic excitation processes for the halo cloud. The electron impact excitation of the halo cloud contributes significantly to the total Dalpha halo spectrum (see also PEC rates in Figure 2h)
where the Dα halo emissivity is given by:
here QCX(Ti(s)) is the local Dα-CX emission rate along the line of sight path s and QPEC the electron impact excitation rate. The line of sight integrated synthetic spectrum is then:
2.8. Impact of Ion Temperature and Plasma Rotation on the Line Shape of CXRS Lines in SOS Model
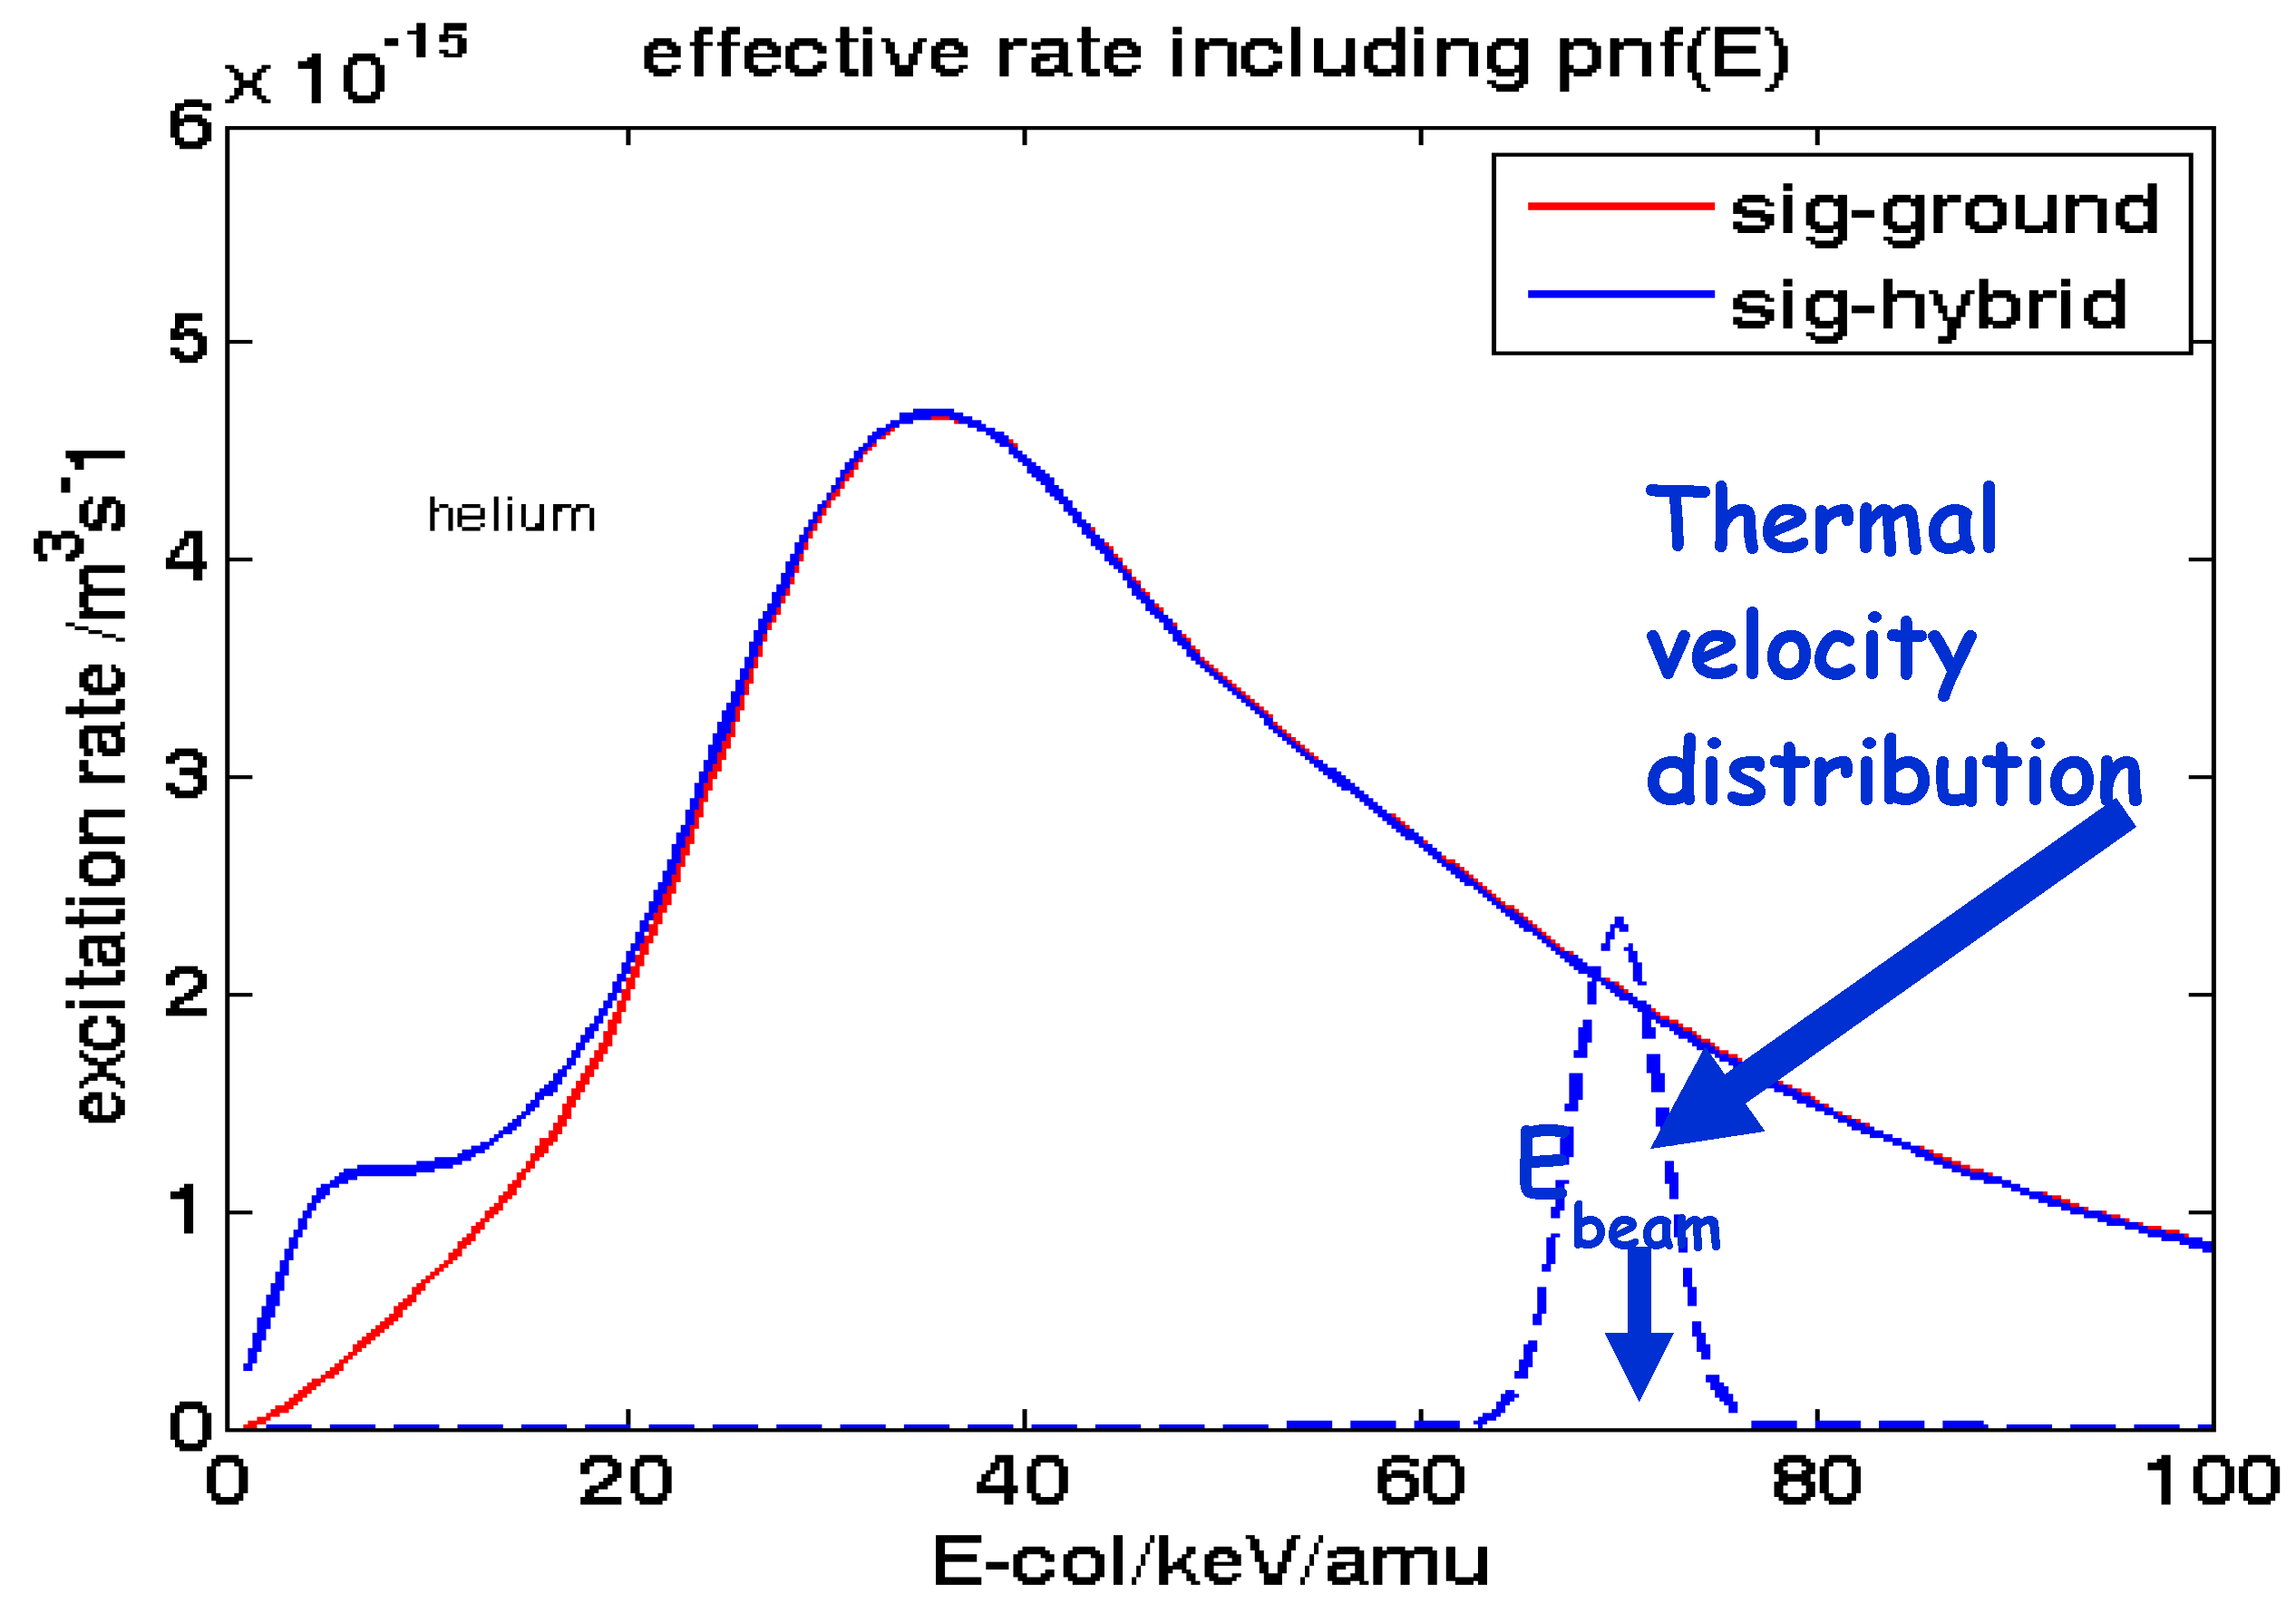
For the case of thermal ions with low ion temperature the relative collisional velocity between the ions and beam atoms is dominated by the beam velocity and hence the change of the effective atomic emission rate is only very small over the Maxwellian distribution. This effect is exemplified in Figure 17.
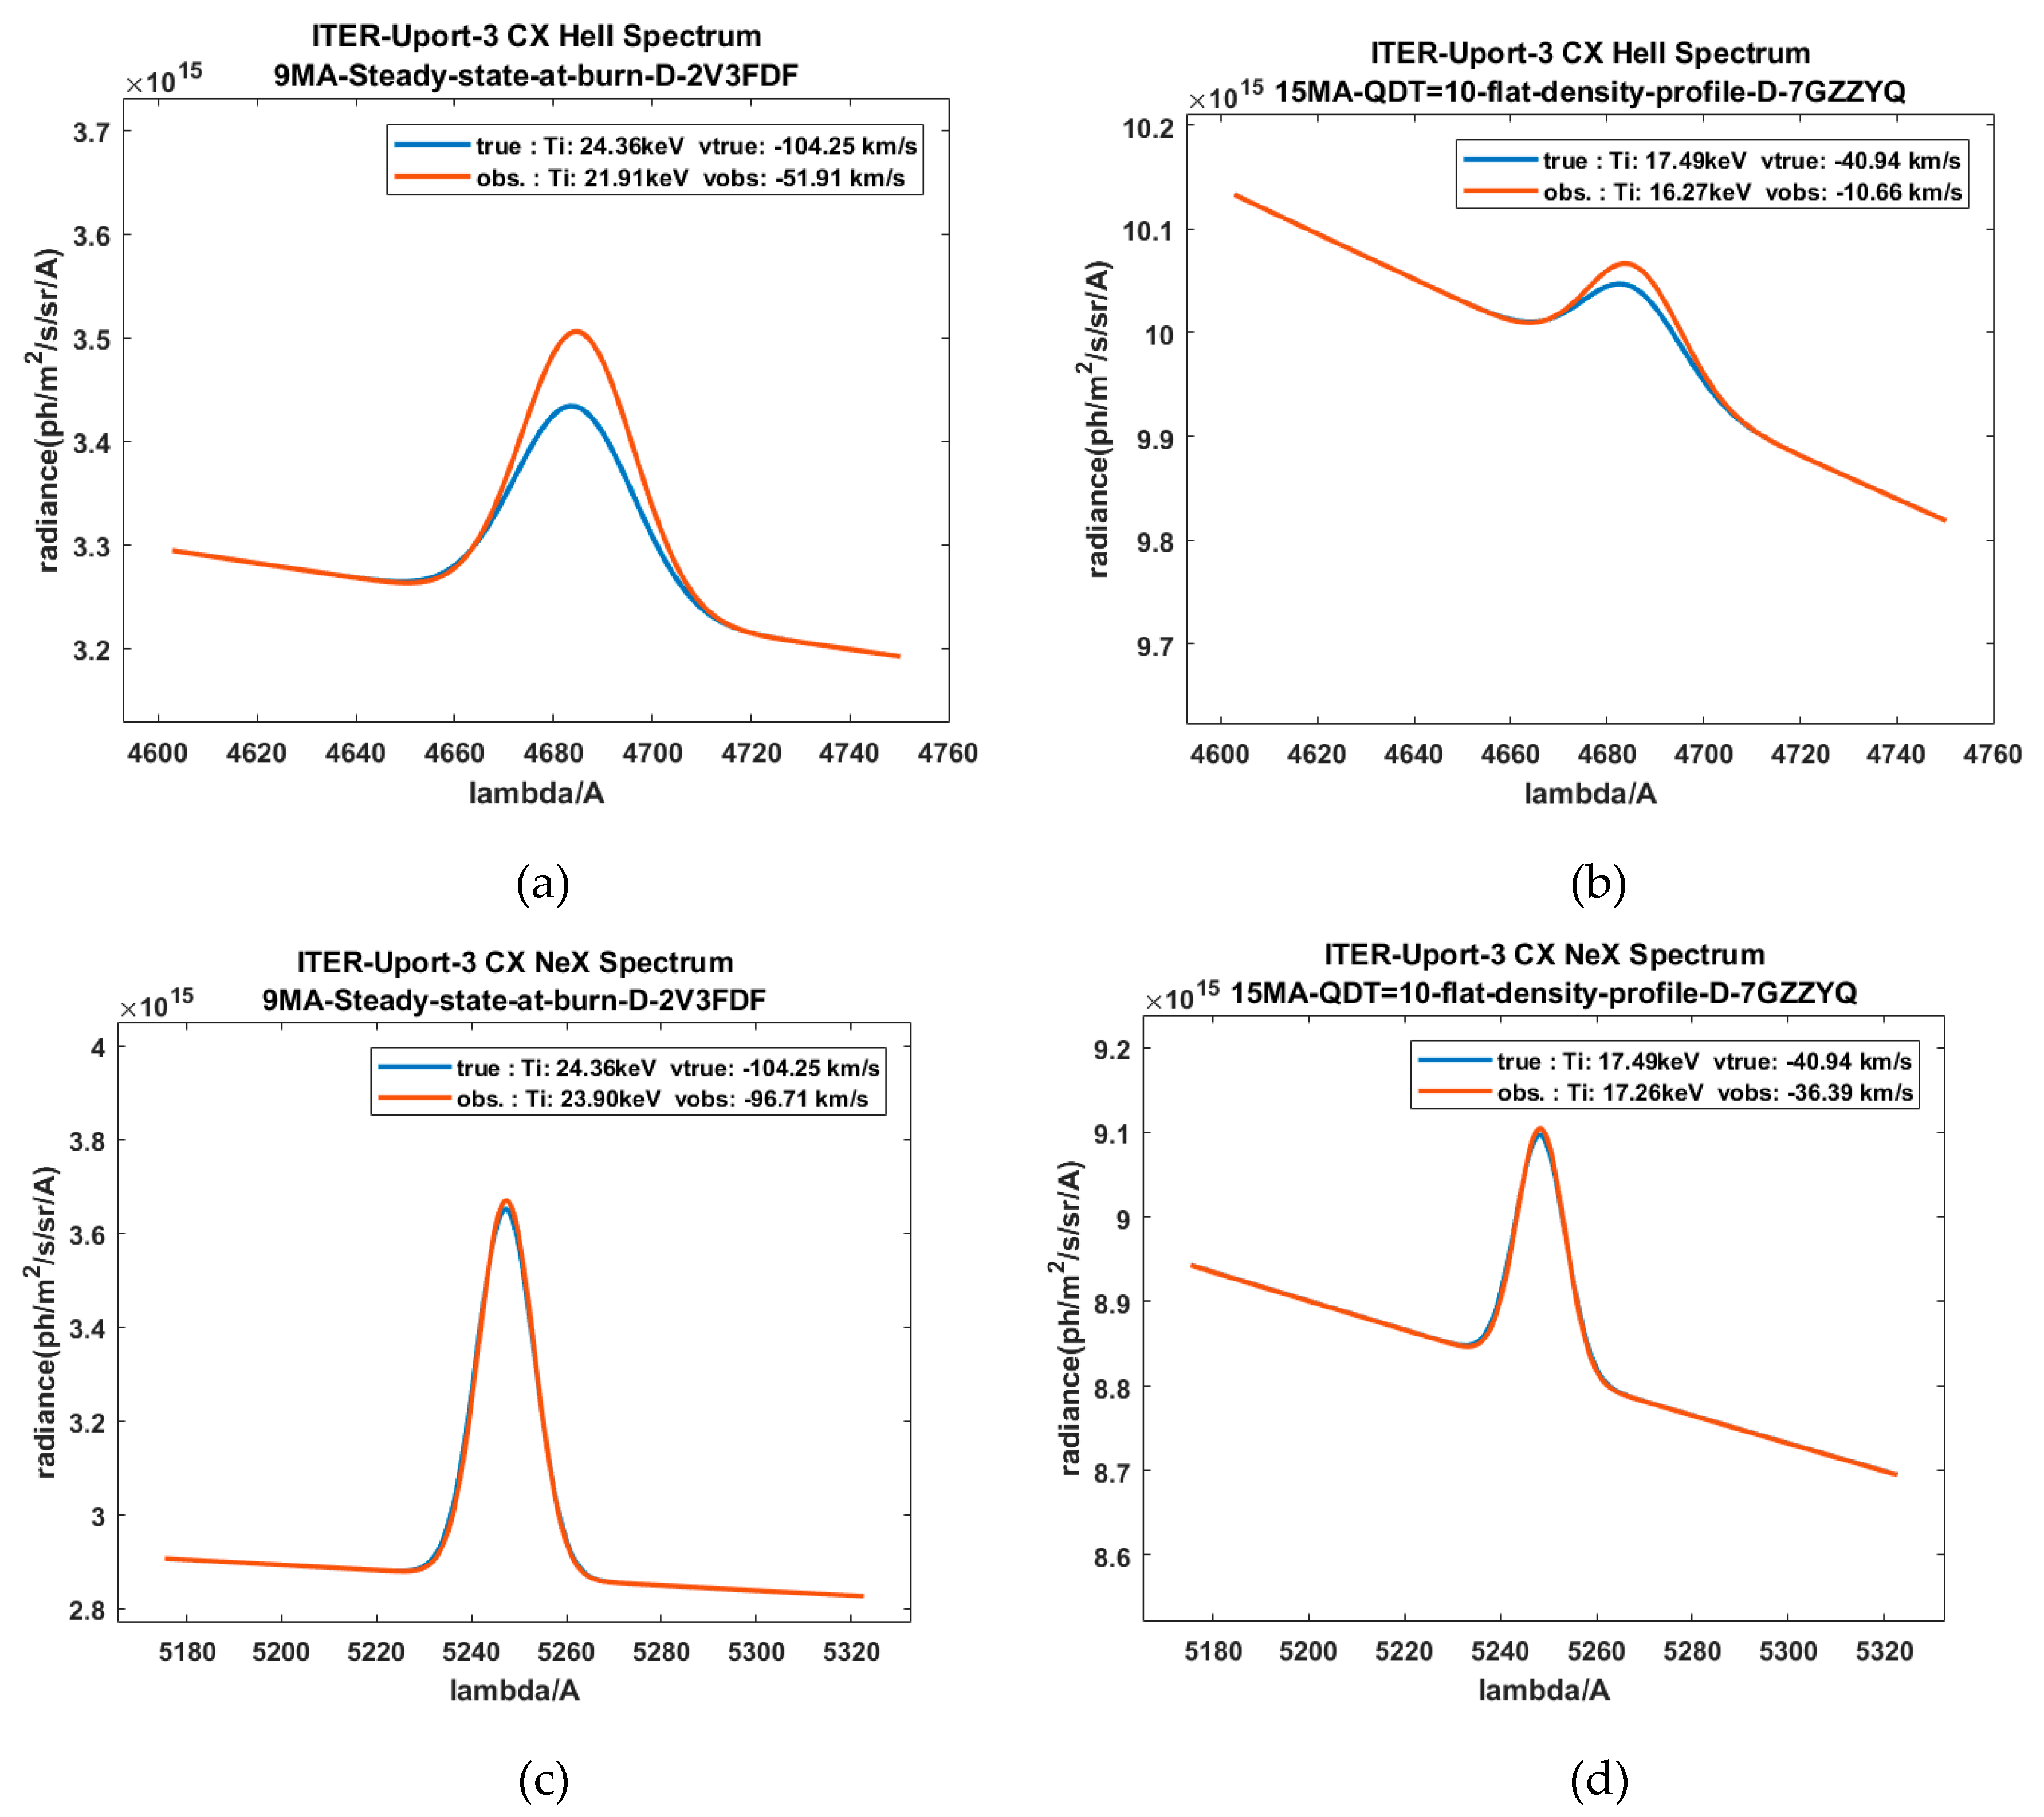
So, for instance, the ion temperature of the order of 5 keV, as assumed here, has only a minor impact on the line shape and excitation rate as the charge-exchange cross section is flat at high beam energy. However, for the beam energy comparable with the ion temperature, as is the case for ITER, a significant effect on the rate coefficient and the observed emission profile could be observed, that is, the effective rate coefficient, could be enhanced. Second, the line shape becomes asymmetrical. As shown for example in [16] the first order derivative leads to apparent Doppler shift of the spectral line and the second derivative leads to modification of the width of the spectral line. At the beam energy below 20 keV the strong increase of emission rate of He II CXRS line is observed. Figure 18 demonstrates the impact of ion temperature on the asymmetry of the observed spectral lines of He and Ne.
2.9. SOS Modeling of Plume Effect
The plume effect arises from impurity ions Z+z−1 created by charge capture processes along the beam path which then propagate along the magnetic field lines and finally may reach the observation line-of-sight. Along the line-of-sight the H-like ions can be excited by electron collision and hence emit the same spectrum as produced by the prompt charge exchange process between beam and fully ionized low-Z ions:
and the excitation by electrons along the line of sight:
The strategy for the plume modeling of the line-of-sight-integrated synthetic plume spectrum is to start from any point along the line of sight and follow then the magnetic field lines both clockwise and anti-clockwise establishing the nearest point to the neutral beam path. This ‘nearest’ point determines the local plume source rate for a given minimum distance assuming a Gaussian beam profile (cf. beam section in this paper). The modeling of the plume effect is illustrated on the example of the He+ spectrum. In order to derive the number of plume ions reaching the observation line of sight we need to solve the continuity and transport equation following the description given by Kappatou et al. [25].
Here v|| is the plume ion velocity along the field line, indices i refer to the 3 beam energy components (i = 1,2,3) and its surrounding halo (i = 4) respectively, each with its specific profile (Gaussian and Halo profile), < σv > CX,tot is the effective total CX capture rate for ground and excited states, x is the co-ordinate along the magnetic field line starting from the nearest point close to the neutral beam path and ending at the line of sight intersection.
τion = Λmean-free-path/ v is the ionization time following collision of plume ions with electrons and ions along the field line. Considering the actual velocity distribution f(v||, vrot, vth) of the plume ion propagating along the field lines which is shifted in velocity space due to the plasma rotation we get:
The linear differential equation for f(x, v||) is solved by the variation of constant method:
And finally, the synthetic plume spectrum integrated along line-of-sight sight path s
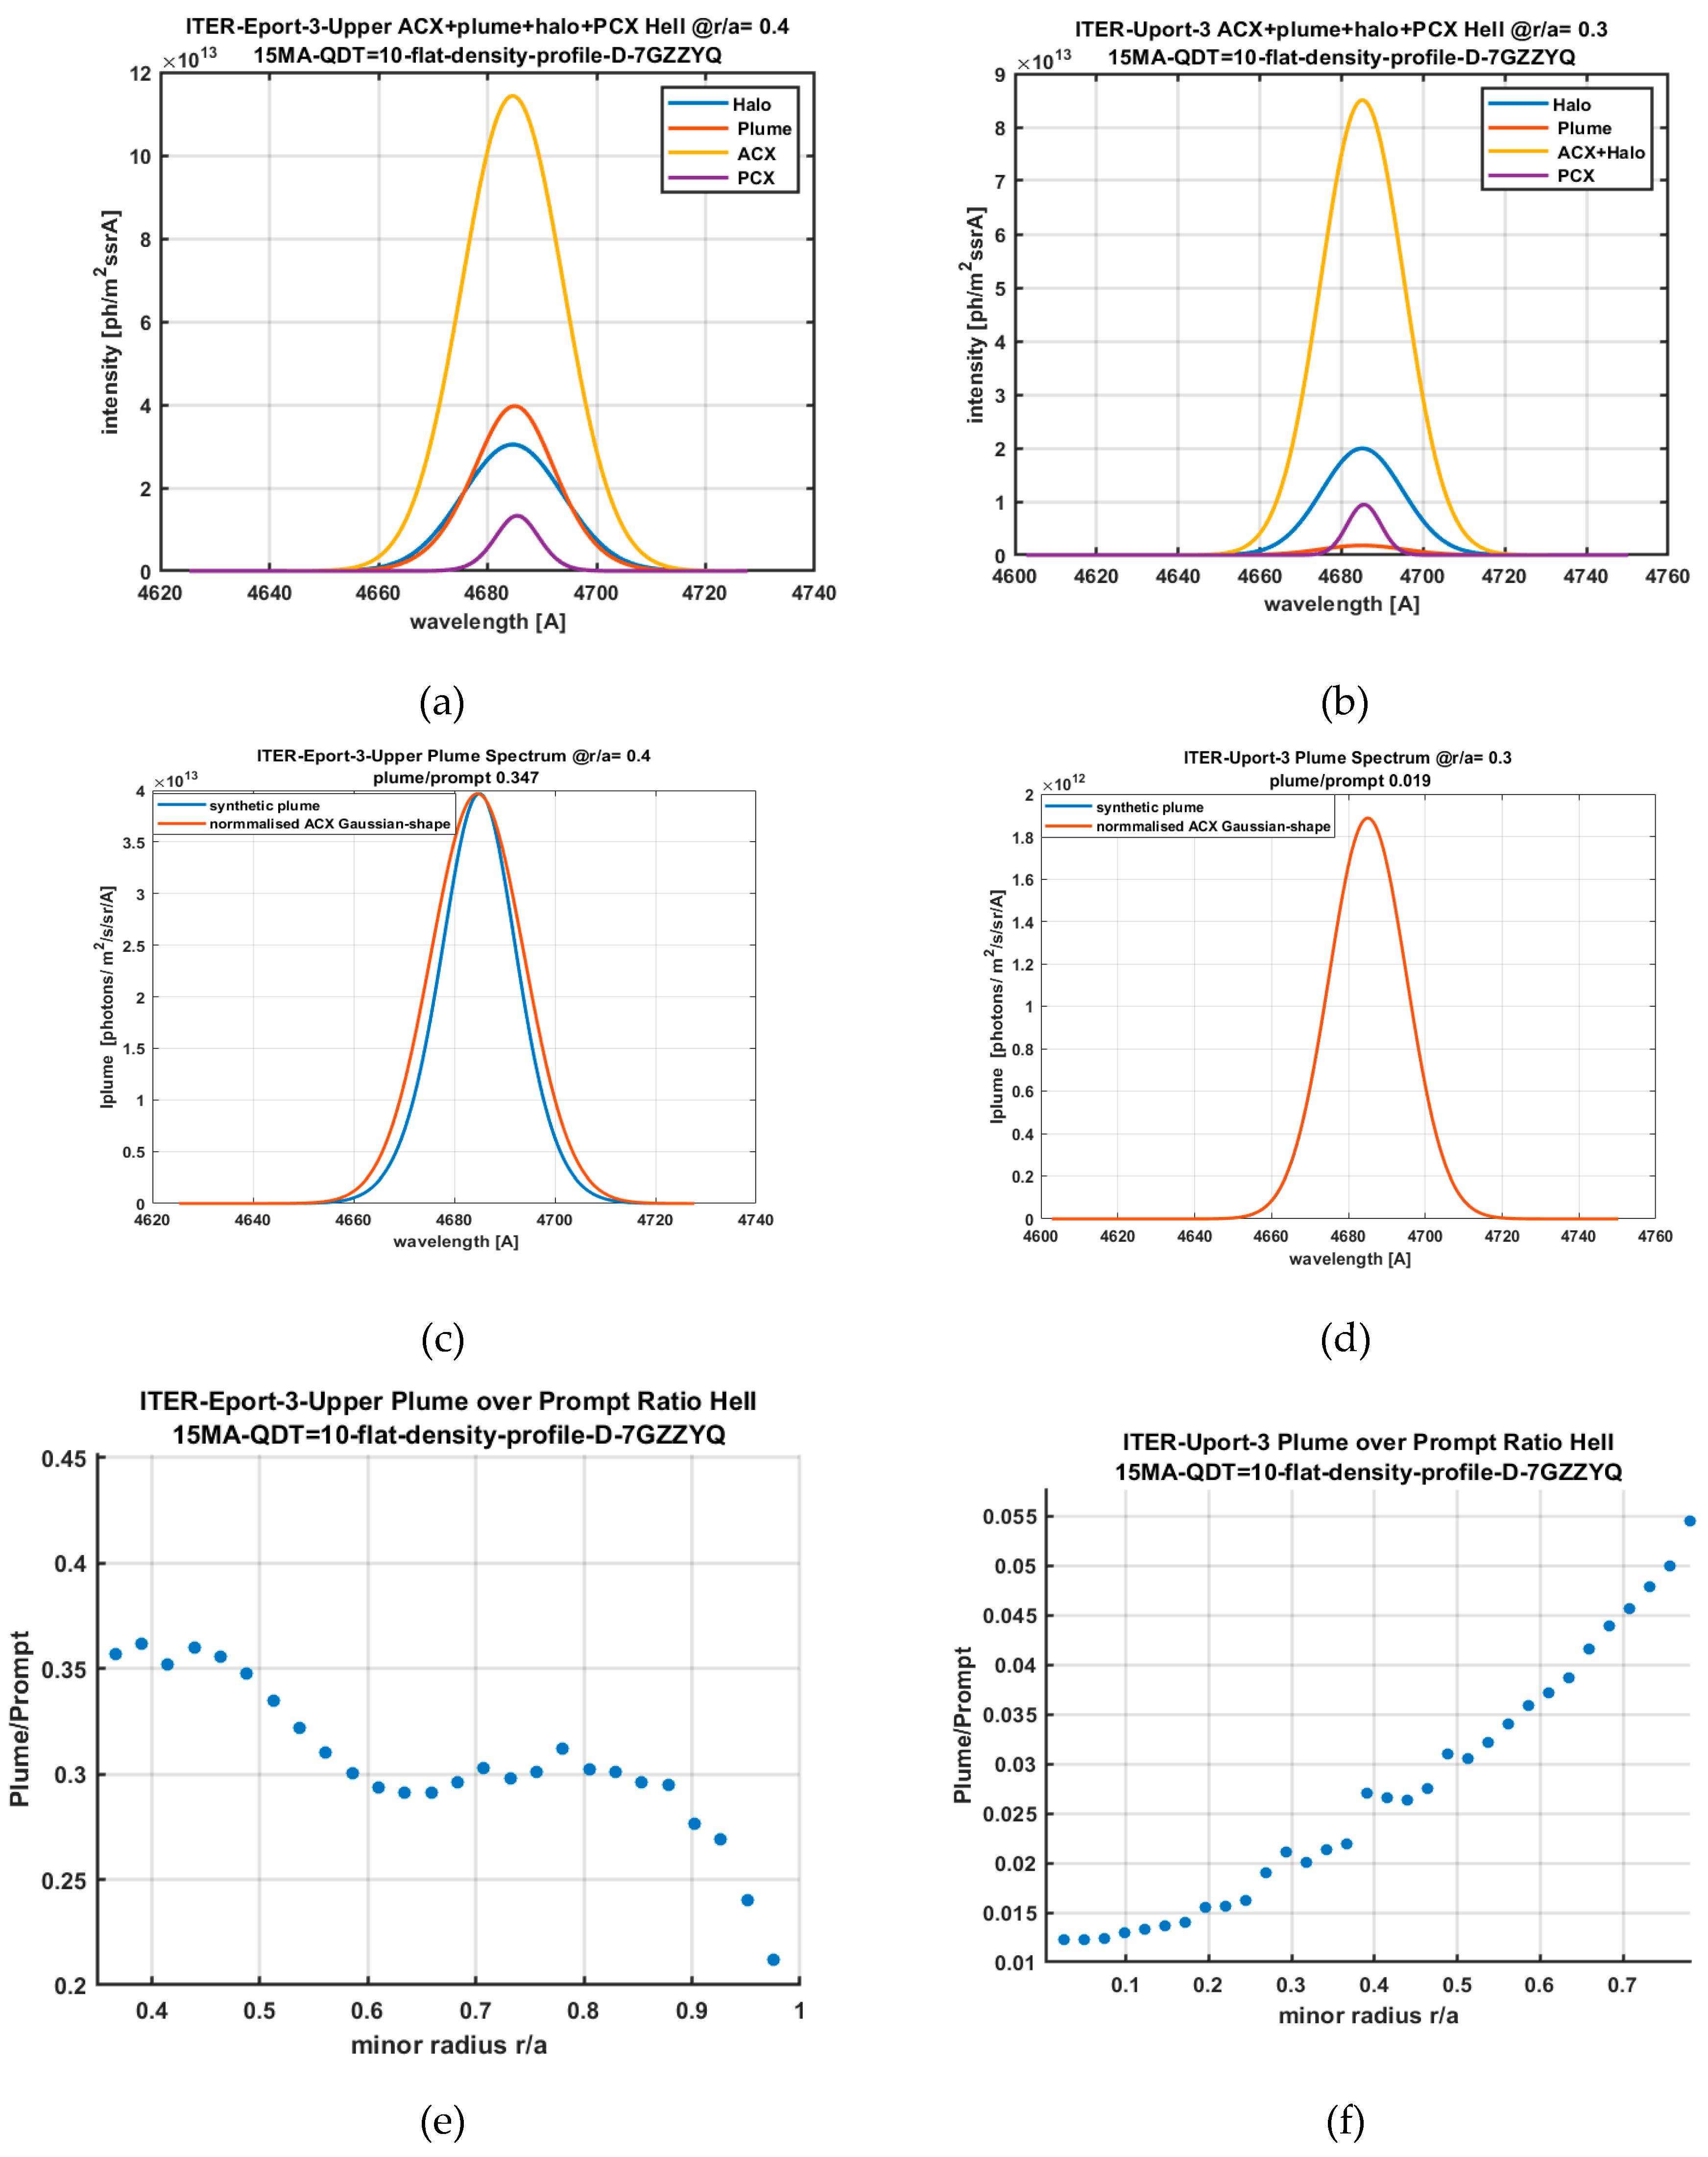
The following graphs illustrate the results of SOS plume calculations (Figure 19) for the case of ITER scenario ‘15MA-QDT=10 flat-density-profile D-7GGGYQ’.
One should emphasize that the plume effect has been a challenging goal for many years of CXRS modeling efforts (cf. [22,23,24,25]). One of the reasons are the difficulties in modeling the dynamics of H-like ions exactly. For example, neither gyro-motion nor the diffusion perpendicular to magnetic lines of H-like ions have been included so far. Therefore, the modeling of plume in spite of the recent progress in modeling and experimental evidence and validation [25] remains one of the open challenges in the CXRS spectroscopy. Ultimately, a reliable assessment of experimental and theoretical uncertainties, for example, in any CXRS based helium ash measurement in a fusion plasma, depends on error estimates for each of the composite HeII spectral components. The competition of comparable ‘nuisance’ spectra such as halo, plume, or PCX contributes to the number of free parameters in a least-square minimization process and thus to the overall errors of extracted parameters. In present day fusion devices, the problem is usually pragmatically solved by assuming a free-amplitude for the PCX component. For the ITER CXRS diagnostic the combination of several observation ports (Uport-3, Eport-3-Upper, and Eport-3-Lower) provide the means of exploiting a combination of lines of sight with minimum plume effect, e.g., top-port observation and expected maximum plume-effect for the Upper Equatorial port Eport-3-Upper with lines of sight close to magnetic field lines.
2.10. Fast Ion CXRS
Four separate cases for Fast Ion CXRS (FICX) spectra are treated in SOS: confined fusion α particles, escaping α particles, 3He+2 minority heating and finally slowing down beam ions. The common feature is the procedure of calculating the observed CX spectrum from the convolution of a 3d slowing-down velocity distribution function with a collision velocity dependent CX emission rate function (cf. [28,29]). The velocity distribution function consists of a fast particle source rate and a 3D slow-down function. The first three cases are presented by isotropic functions in velocity space, whereas slowing-down beam ions are characterized by an anisotropic slowing-down function (cf. [29] and Figure 22) and the pitch-angle at birth before thermalization starts. A slowing-down distribution function implies a velocity space covering the birth energy, e.g., in the case of alpha particles 3.5 MeV down to thermal energies and for the slowing-down beam ions, as for example, the slowing-down ions of ITER heating beams 1 MeV.
In contrast to the Gaussian spectral shape representing thermalized particles, the slowing-down spectrum representing fast ions is significantly broader and consequently also by the same token significantly lower in amplitude. This implies an even harder experimental challenge. The expected amplitudes are comparable to the photon noise of the underlying spectral background and FICX relies on dedicated, that is, high-throughput, broad-band-instrumentation. In order to explore the detection limit of slowing-spectra the preferred display of FICX studies is a semilogarithmic presentation: log(I) versus Δλ2 or log(I) or versus Δv2 in velocity space that is E, where E is the fast particle energy. The Maxwellian thermal spectrum is then presented by a straight line and the slowing-down feature by a broad-band spectrum beginning at the birth energy. The highest detectable energy is given by the point where signal and noise level are equal.
The measurement of escaping alpha particles has been a longstanding issue in the fusion diagnostics community and has been brought up at numerous topical ITPA meetings for discussion. Since the 1 MeV ITER heating beams provide a source of neutral atoms with comparable energy to fusion alpha particles it is a challenging exercise to explore the options or feasibility of measuring, for example, the population density of escaping fast alpha particles just outside the magnetically confined region in the throat of the HNB injection path. The source of escaping alphas is an instability driven depletion of fusion alphas from the core region of the plasma [27]. SOS has implemented a feasibility study case for the exploration of using the outermost line of sight of equatorial port-E3 intersecting the HNB injector in the E-port-4 duct. The preliminary study assumes a 10% fraction of the alpha particle population transferred by bursts of instabilities from the core region (ρ = 0.5) into the separatrix region preserving its local velocity distribution.
A similar challenge is the measurement of a fast particle population density as created in the case of a 1 MeV, 3He minority heating. A 3He feasibility study module is implemented in SOS as a development project based presently on a preliminary synthetic flat slowing-down function in order to explores test cases of a 5% 3He minority. It is expected that a more detailed and parametrized presentation of the slowing-down of minority ions will enable further studies.
We have selected two illustrational case studies, one for confined fusion alpha particles and the second slowing-down beam ions respectively.
For the ITER feasibility study we assume the use of commercial high-throughput F1.8 spectrometers. In addition to instrumental optimization of spectrometers, SOS enables the simulation of signal-to-noise enhancements by combining or binning the photoelectron of several adjacent pixels which corresponds to energy binning
2.10.1. Confined Fusion Alphas
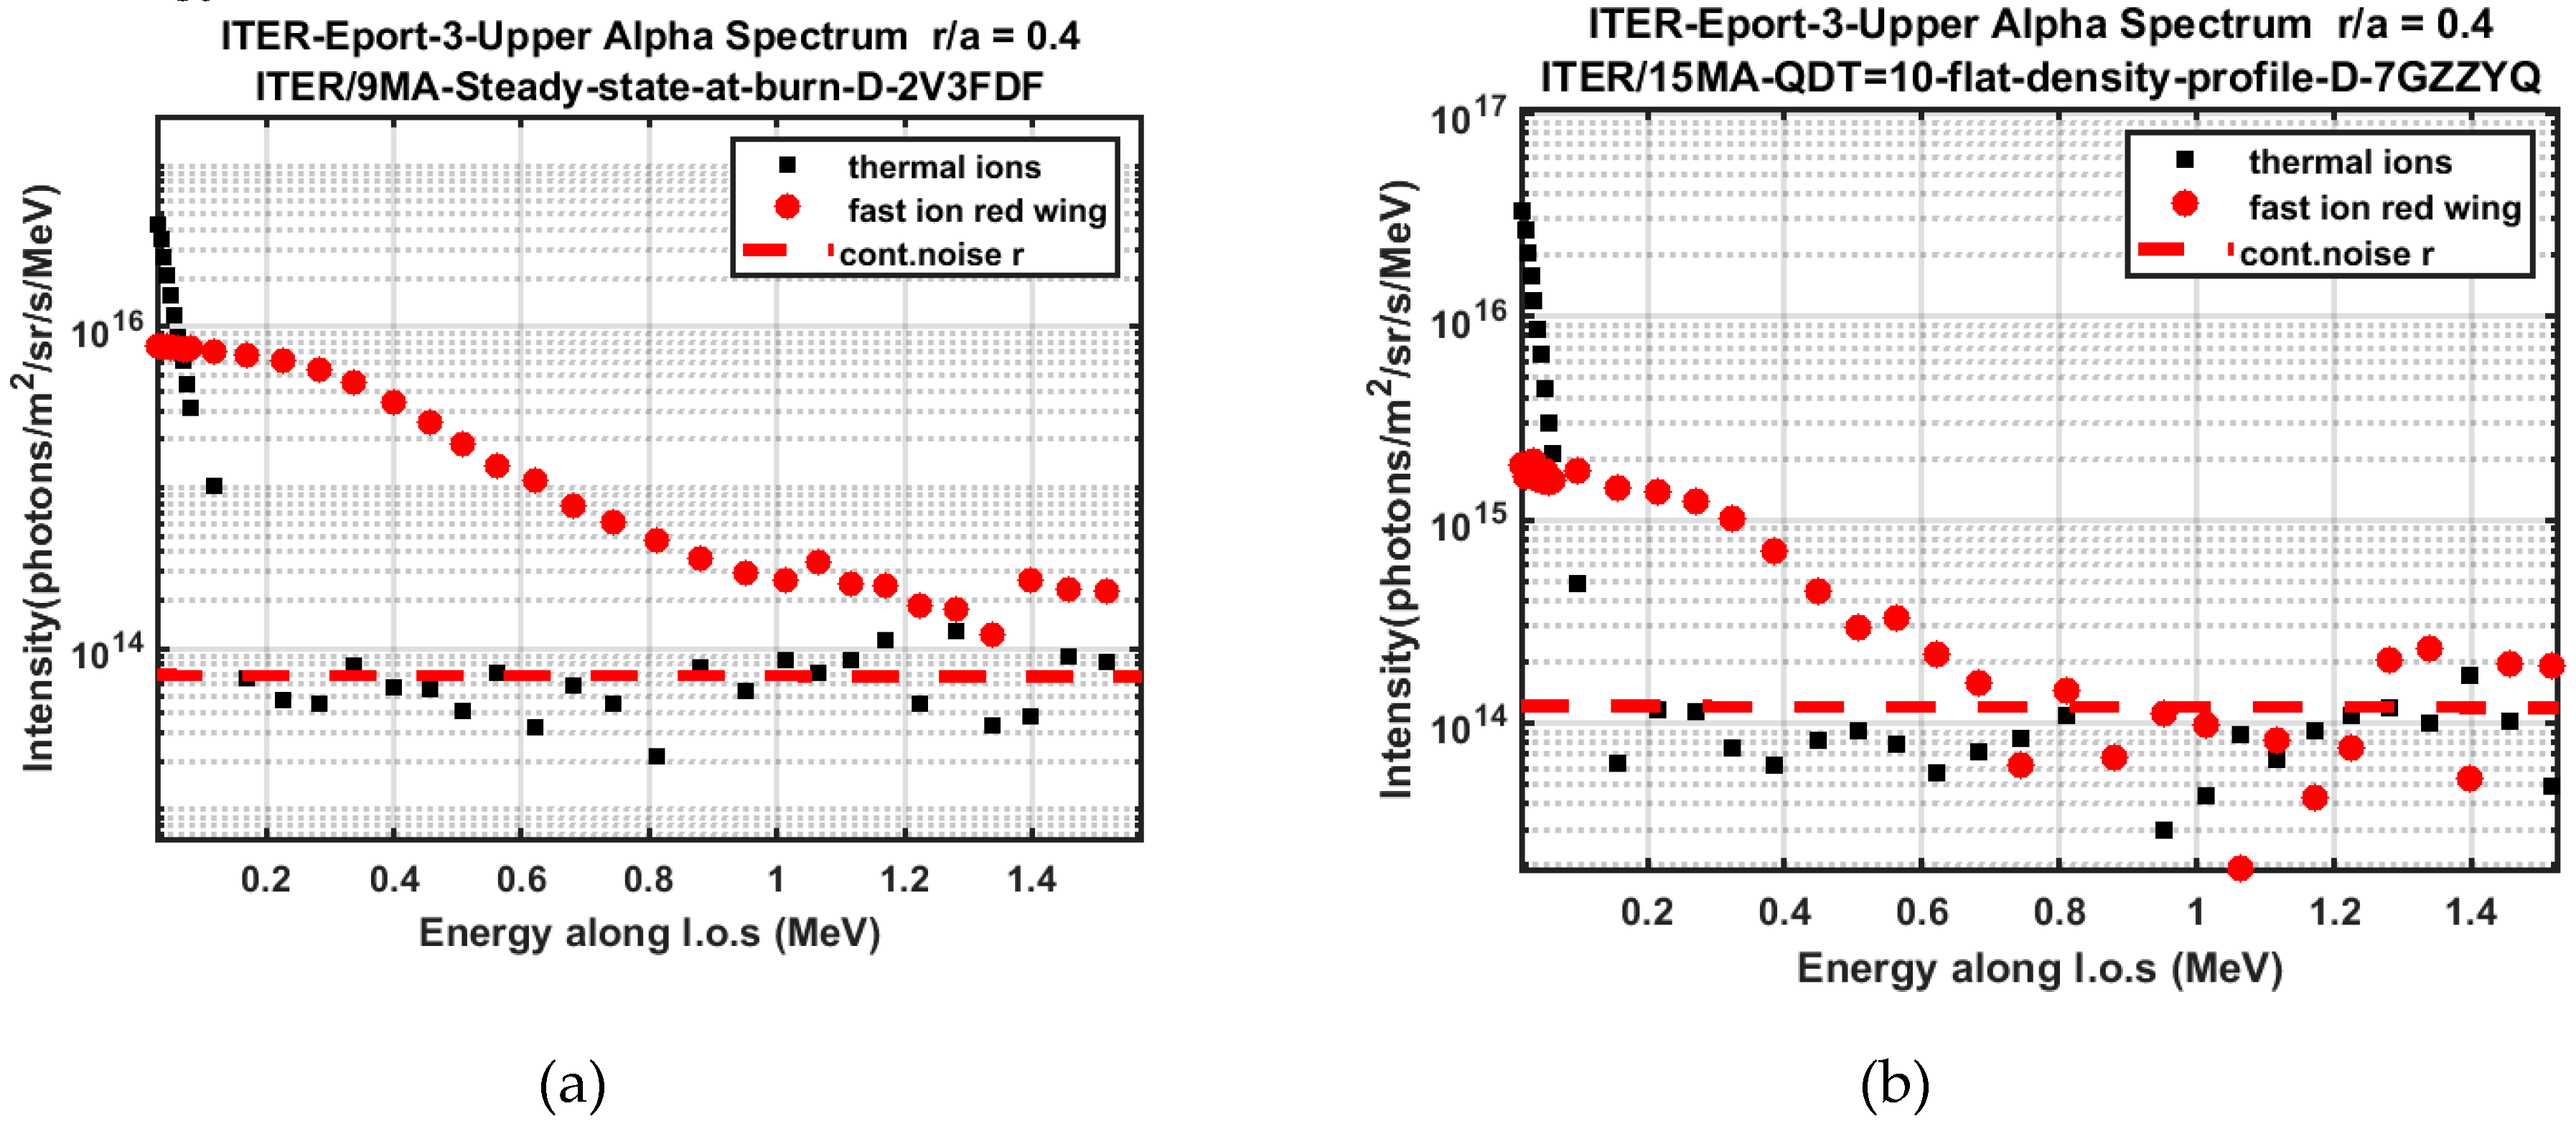
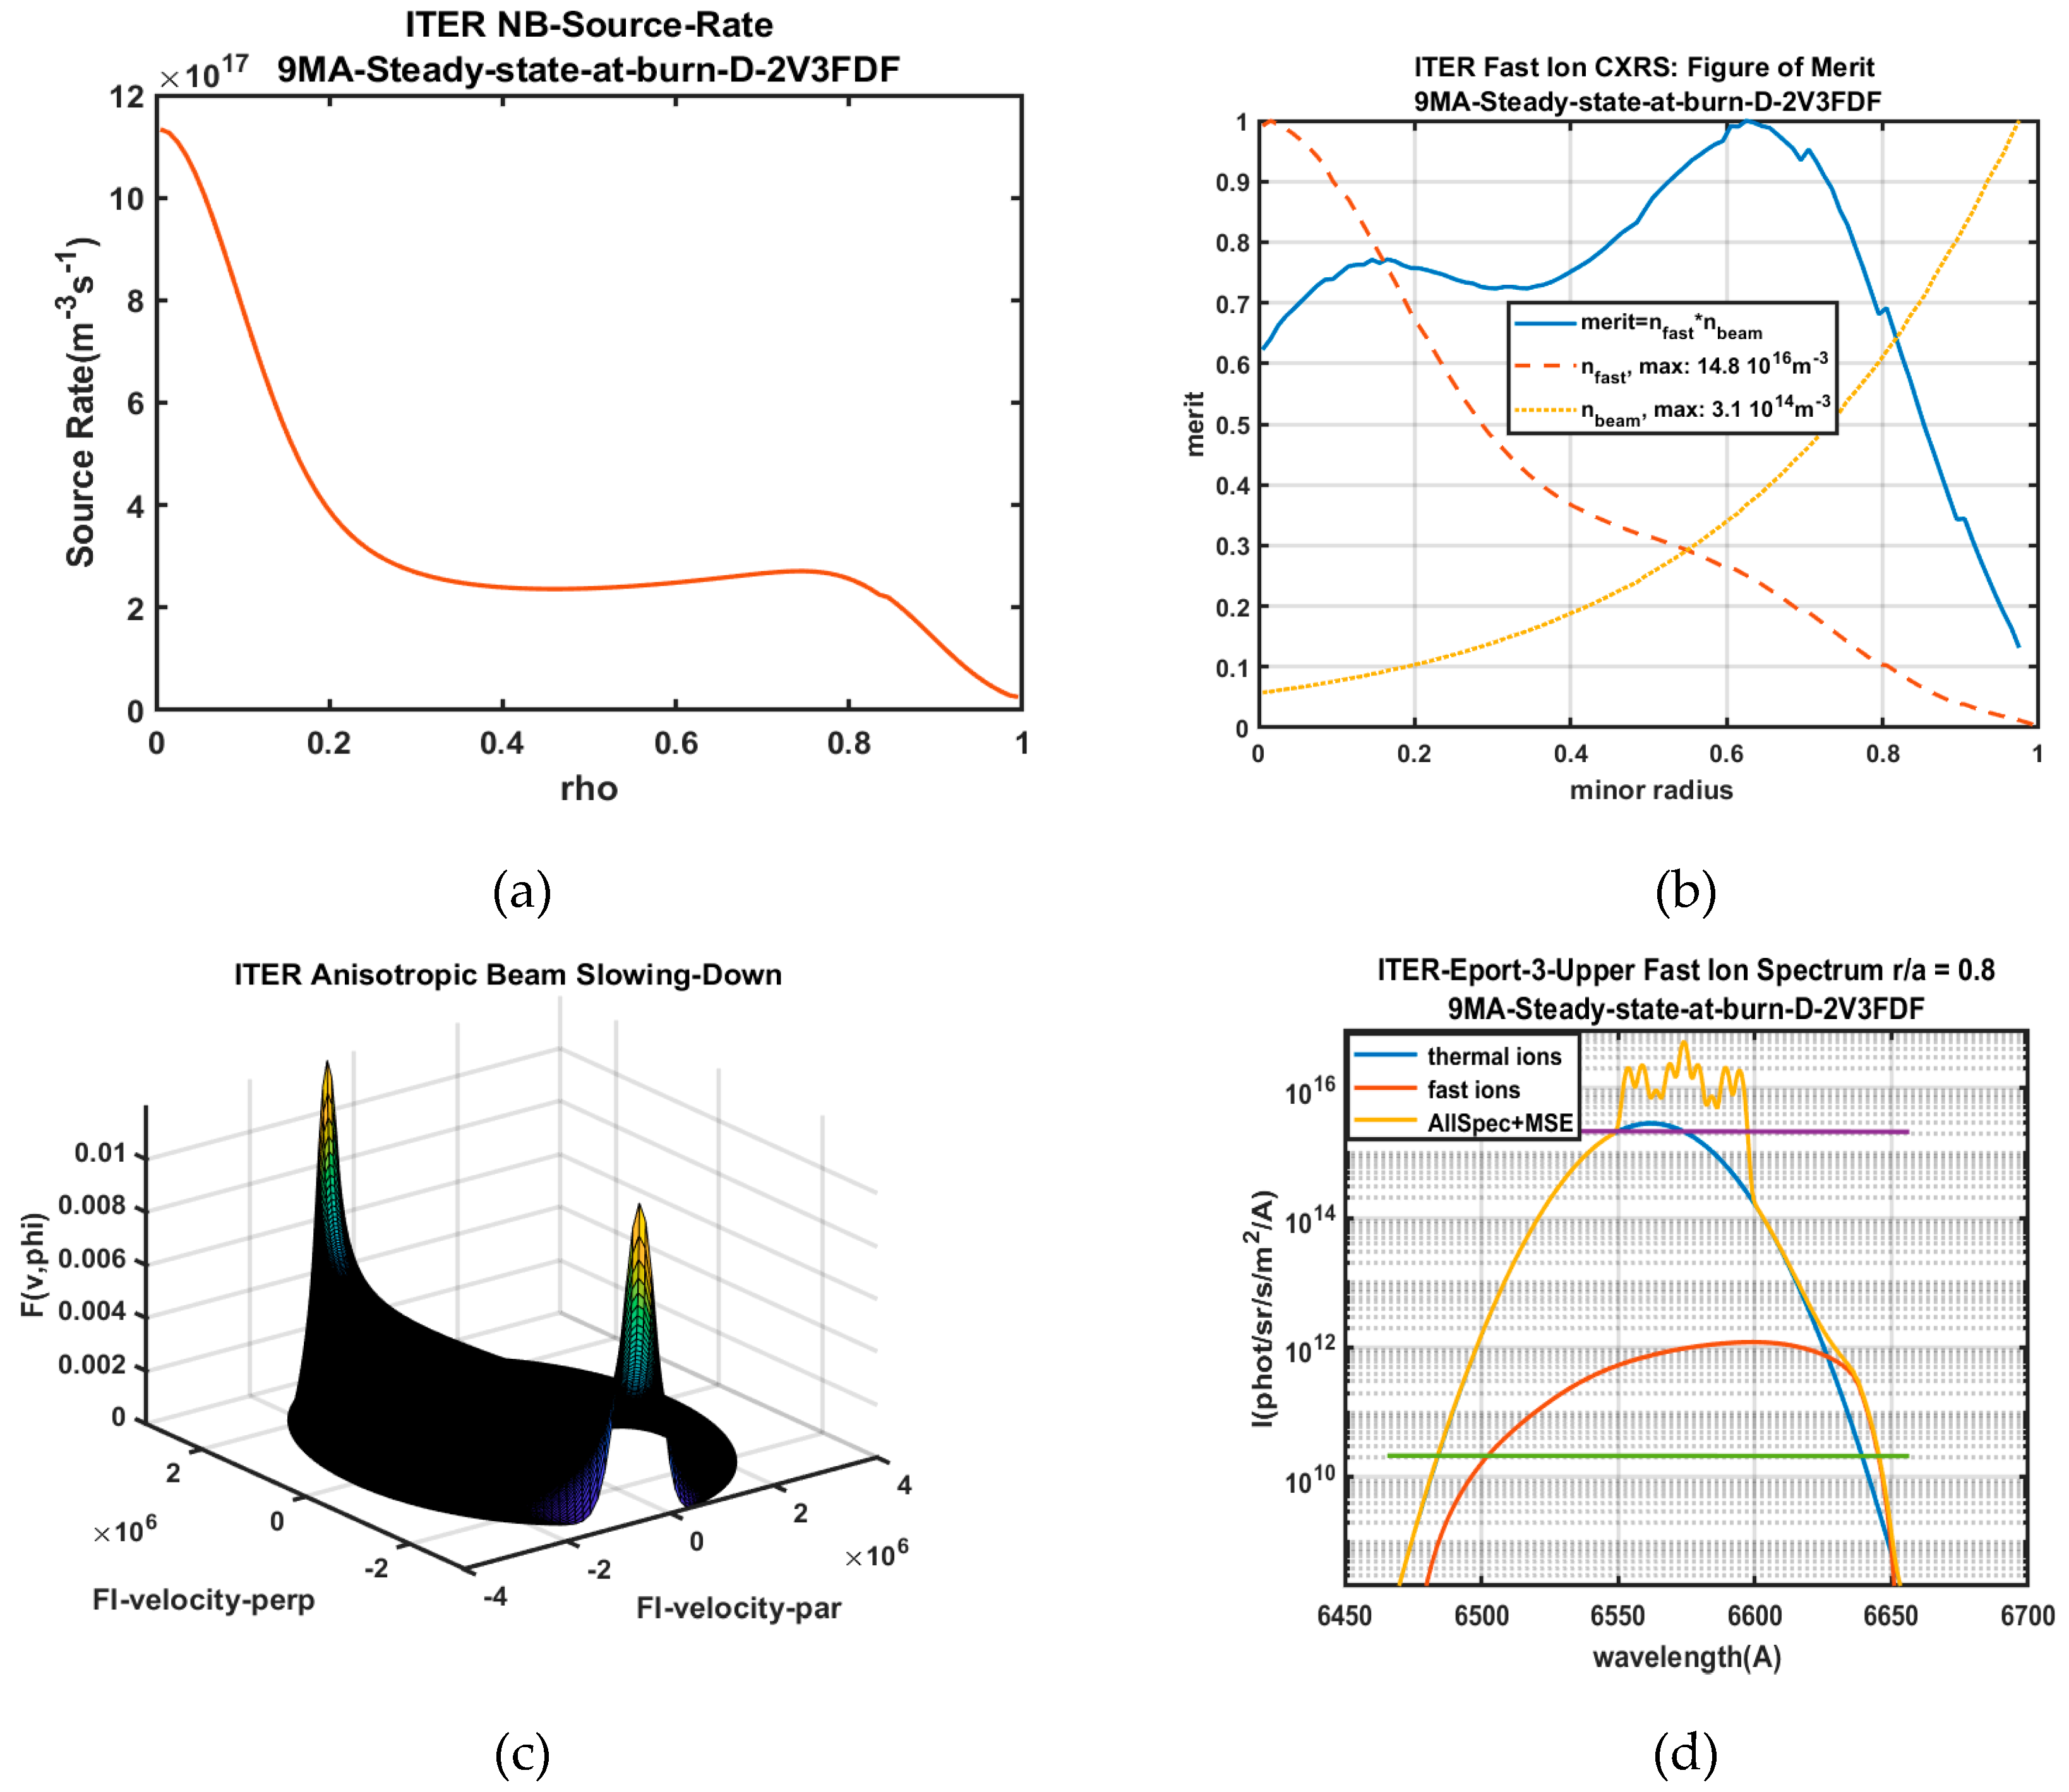
The following examples illustrate SOS predictions for the performance of the ITER CXRS diagnostic applied to the confined α particle studies using optimized high-throughput, broad-band instruments. The peaked α particle density profile on the one hand and a strong attenuation of the DNB neutral density on the other hand leads to a maximum CXRS signal about halfway to the plasma centre. For the high-density, flat-profile case (Figure 20b) the figure of merit given by the product of fast density nα and probe beam density nbeam is significantly broader due to the more rapid decay of the beam density. In Figure 21 we show as illustration the predicted CXRS α particle spectra versus particle energy.
The noise limit corresponds to a chosen integration time of 500 ms and an energy binning of adjacent pixels of 50 keV. In the 9MA low-density case the detection limit reaches about 1.2 MeV, and in the high-density case with a poorer signal about 0.6 MeV. A boost of the signal integration time, for example, up to 5 s would lead to a further reduction of the noise level and hence, potentially to a higher energy limit.
2.10.2. Slowing-Down Beam Ions
The calculation of the Fast Ion Source Rate is straightforward for the case of fusion alpha particles, since one can assume toroidally symmetric profiles for nd, nt, and Ti, but in the case of neutral beam injection with its strongly anisotropic slowing-down velocity distribution function (cf. [28] and Figure 22c) requires a more refined procedure taking into account the exact injection geometry as well as observation geometry and magnetic field configuration. A crucial modeling input for the Fast Beam Ion CXRS case is also the beam-ion source rate which is defined by:
Here Pbeam is the beam power, e the elementary charge, Ebeam the beam energy, dζ the attenuation increment and dV the magnetic flux volume increment. The first step is the mapping of the entire beam path on magnetic flux coordinates and calculating along the path the beam attenuation steps. In a second step, a collecting rho-grid is established distributing the attenuation increments dζ in common or shared rho-shells. Each shell is associated with Jacobean Volume element dV of the toroidal flux geometry. In the case of ITER with its extended DNB or HNB ion sources it is essential to do this collection procedure for each of the 1280 beamlets assembling the total Source Rate (see Figure 22a). A successful demonstration of SOS Fast Beam Ion CX modeling for the EAST tokamak was published recently, where SOS is benchmarked against both experimental observation and also against a FIDASIM simulation (cf. [36]). In this paper, we show as an illustration the ITER case for a DNB based FICX simulation which demonstrates that in the best possible location as predicted by a figure of merit study (see Figure 22b) the signal is just barely visible. The HNB case is even worse with a significantly lower beam density and a FICX signal much below noise level.
2.11. Wall Reflection Issues
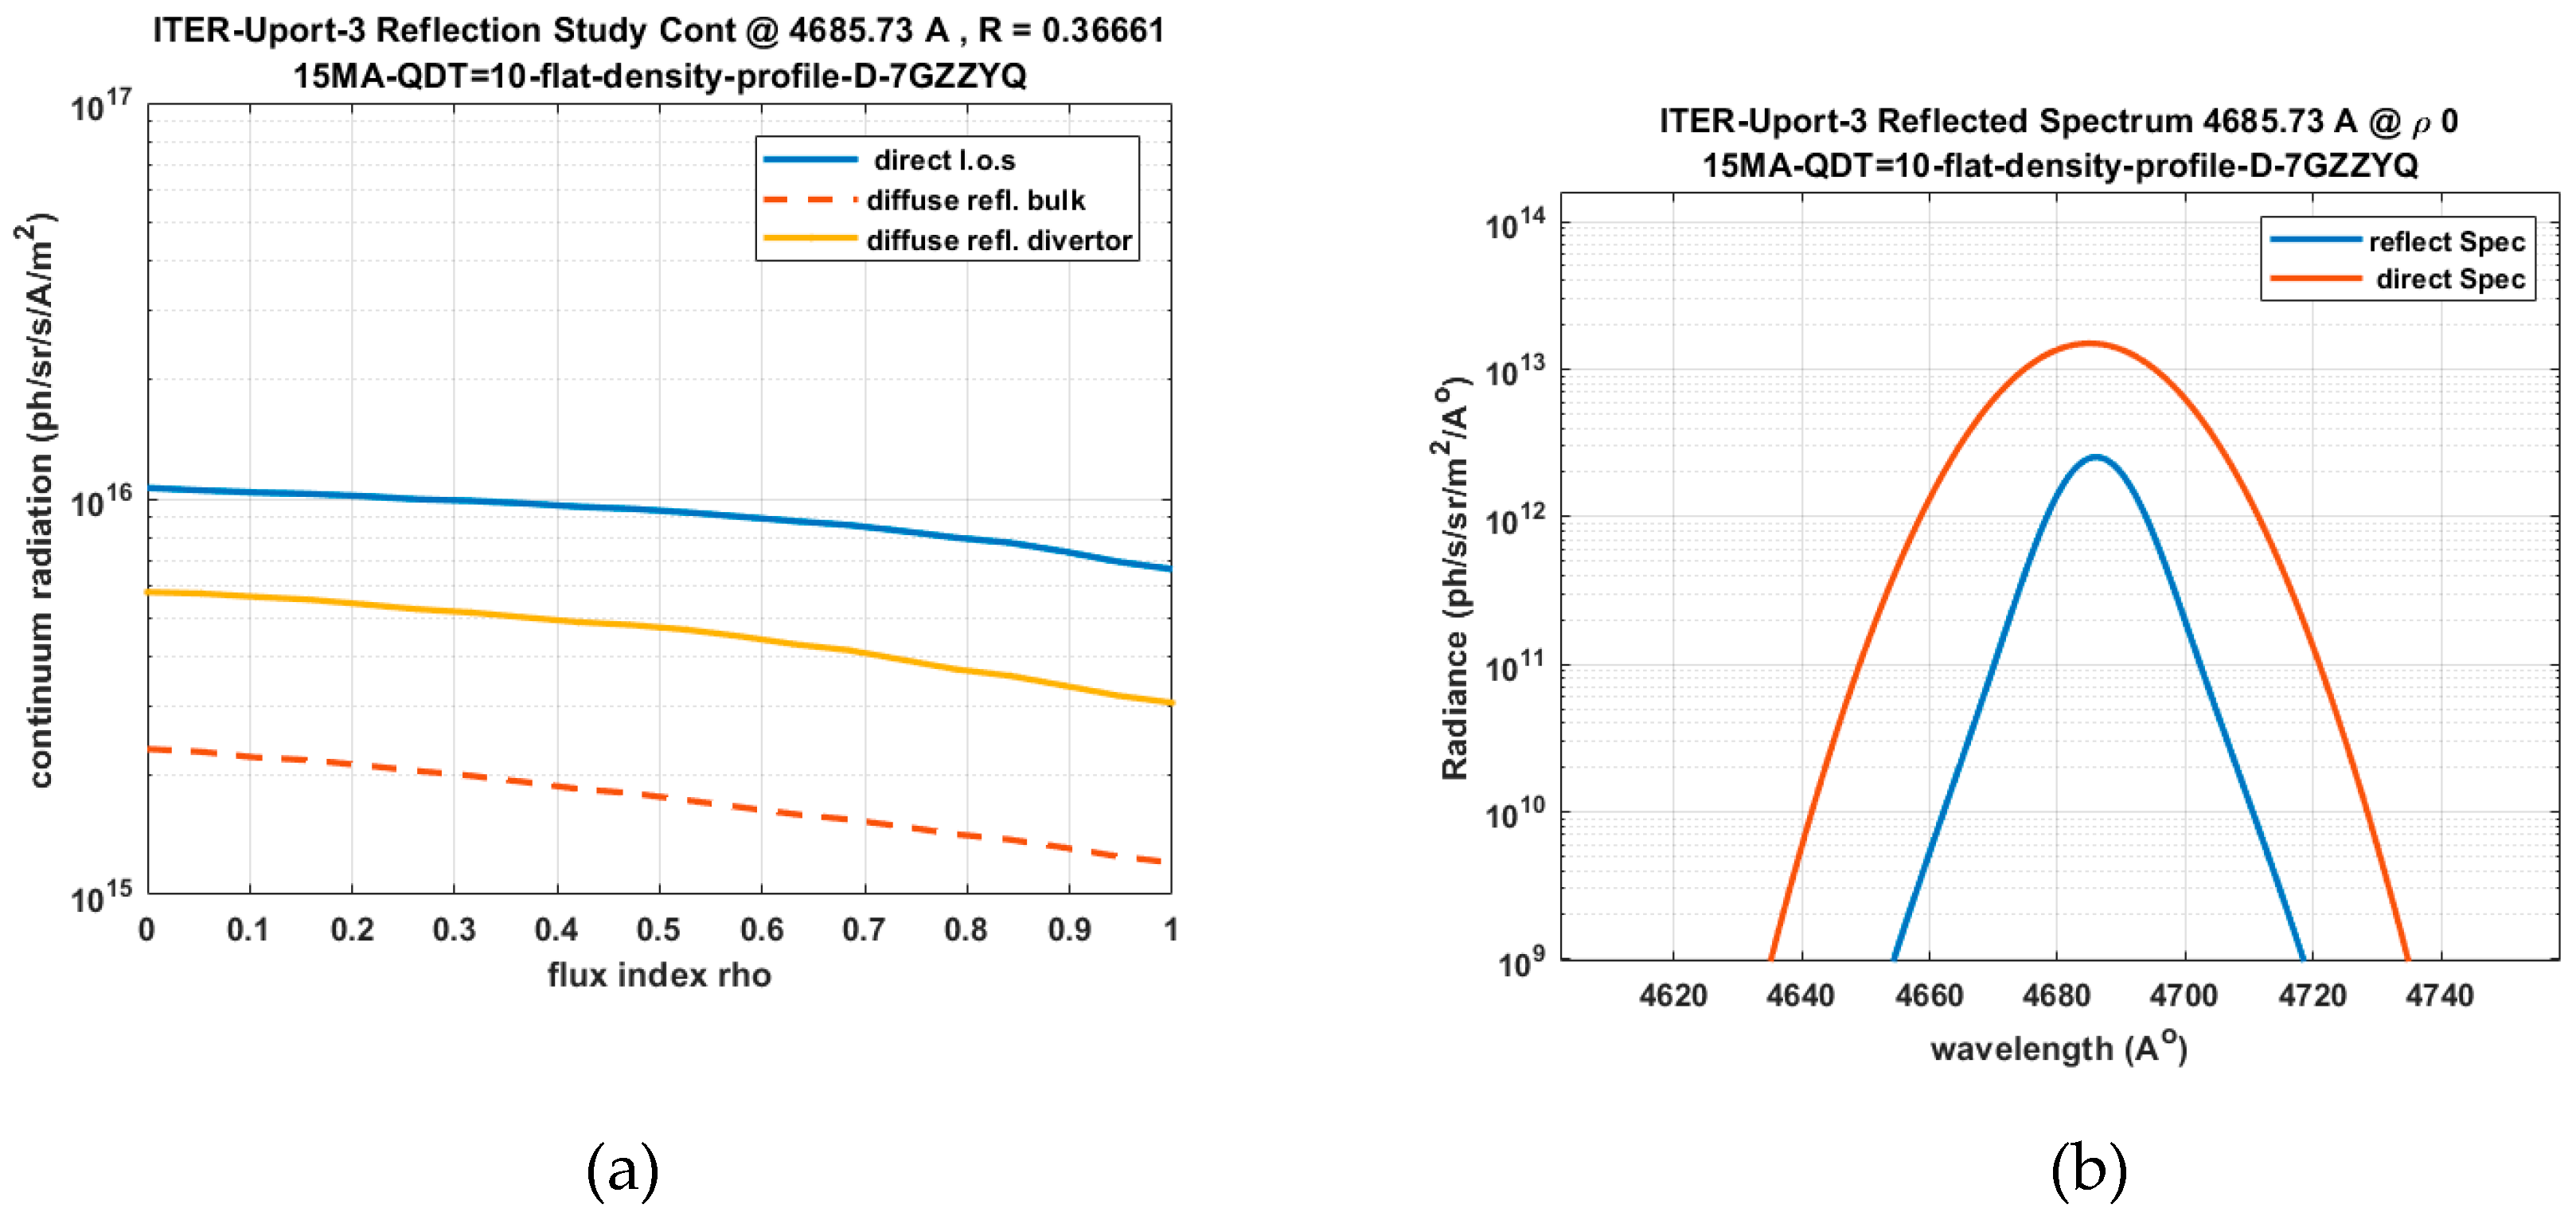
Contamination of optical signals by reflections from the tokamak vessel wall is a matter of great concern [52,53,54,55,56]. For machines like ITER and future reactors, where the vessel wall will be predominantly metallic, this is potentially a risk factor for quantitative optical emission spectroscopy. This is in particular the case when Bremsstrahlung continuum radiation from the bulk plasma is used as a common reference light source used for the cross-calibration of visible spectroscopy. In SOS a model assuming diffuse reflection has been developed for the Bremsstrahlung which is a broad extended source. In contrast, a complete bidirectional reflectance distribution function (BRDF) based model has been developed in order to estimate the reflections from more localized sources like the charge exchange (CX) emissions along the neutral beam path. In contrast to more advanced recent multiple diffuse reflection models, as for example, described in [55,56] SOS uses a rather crude single diffuse reflection model for a preliminary first assessment of the expected fraction of reflected light. The results are in the same order of magnitude, but are based on rather moderate reflection level (40% for a beryllium wall). Two illustrating examples for the high-density ITER scenario (‘worst case’) are shown for the case of diffuse reflection of continuum radiation from bulk plasma and diverter region (Figure 23a), and accumulated reflected ACX spectra emitted along the neutral beam path (Figure 23b). The reflected spectrum is about 11% of the direct ACX spectrum and is characterized by a non-Gaussian shape.
3. Outlook and Future Strategy
The main challenge of any spectral prediction code is the benchmarking against real spectra as observed on existing fusion devices. Any progress in operational regimes is typically accompanied by the need for revisions and updates in the modeling of associated spectra. For instance, in the recent JET experimental campaign with ITER-like wall conditions, previous prediction models had to take on-board a considerable amount of additional W-lines. And adding to the complexity, also a significantly enhanced role of metallic wall reflections has led to the visibility of intense spectral lines emitted in the diverter region and reaching via multiple reflections observation ports far away from the diverter.
For future experiments such as ITER, which are expected to become operational within the next decade, the tasks and challenges for prediction codes are multi fold. One obvious target is the preparation of real-time analysis tools to serve as a machine control option. As demonstrated at the JET experiment, real-time neural network structures can be effectively trained by the use of synthetic spectra building up the probability space of experimental parameters. The creation of a synthetic data base ahead of any future experimental campaign is indeed a very powerful argument for the progress in the development of prediction tools. This has not only a purely practical reason such as optimizing control tools, but equally it is a perfect training field for future generations operational teams and spectroscopic experts in charge of data analysis.
We underline that a considerable portion of the SOS modeling of the spectra from active beam diagnostics represents atomic physics. The accurate structure calculation of the spectral lines of plasma wall materials expected for ITER is one of the challenging tasks the atomic physics community currently experiences [1]. On the other hand, the first atomic models for the active beam spectroscopy operated by the charge-exchange provide cross sections resolved for the first two main quantum numbers, only the recent development of the atomic models goes far beyond this. The success of the description of the MSE spectra from JET in the beam eigenstates in the last decade is one of example of dynamics the active beam spectroscopy currently experiences. There is no doubt that the new generation of collisional radiative model operating with density matrix formalism will be applied in the near future not only for the beam emission spectra but also in the case of the CXRS signals. Recent advances in density dependent modeling of dielectronic recombination coefficients may become important for ionization balance models [57] and will possibly require SOS revisions.
A further outstanding issue is a review and parameter error assessment associated to modeling of spectra. SOS models the expected noise characteristics and hence measurability of spectra in a selected plasma scenario and for a given instrumentation and viewing geometry. The retrieval of plasma data from a noisy spectrum and associated parameter errors represents so far only statistical errors. Obviously, the number of co-existing spectral features in the same spectral region and their associated underlying atomic excitation processes demands also an assessment of error margins for atomic data. An extension of the present ADAS data base envisages the inclusion of associated error bars which is undoubtedly a demanding and difficult challenge. Any such development would also imply the need for updates and revisions of the SOS project.
The ultimate aim of Fast Ion CXRS is to provide measurement of fast ion populations that is their densities, and even more challenging, their velocity distribution function. The Fast Ion modules as implemented in SOS are based on available parametrized classic slowing-down functions and it remains an outstanding challenge to verify to which extent deviations from expected distribution functions can be validated from FICX observations. In this context, any developments in this field (e.g., the energetic particle community), would be a helpful input for future SOS revisions. For example, in the case of 3He2+ minority heating, parametrized velocity distribution functions are urgently needed.
Author Contributions
Conceptualization, M.G.v.H., M.d.B., M.W.; methodology, M.G.v.H.; software development, M.G.v.H., S.S., O.M.; atomic physics review, O.M.; neutral density modelling, R.R.; supervision, original draft, project administration, validation, writing, review and editing, M.G.v.H.
Funding
The research received no external funding.
Acknowledgments
The long-standing support of the SOS project by the Fusion Teams of FOM and TUE has been decisive for its progress and acceptance. However, it is almost impossible to create a complete list of acknowledgements since so many people have been involved in the project for so many years. First of all, the former and present JET teams have played a central role in the original initiatives, visions, fruitful discussions and numerous contributions. A similar role applies also to the teams of TEXTOR and AUG, and later on, the DIII-D and EAST serving as motivators, contributors and also data providers for vital bench-marking test-beds. Numerous stimulating and helpful discussions with the ITER diagnostic and physics teams in the last years are equally highly appreciated. A particular thank-you is due to Jakob Svensson whose ground-breaking work on neural network structures for fusion spectroscopy was the actual starting point for the need of comprehensive prediction tools for the creation of synthetic spectra and hence the development of SOS. Equally, without the ADAS project providing atomic data for fusion spectra represented by the long-standing and close collaboration with Hugh Summers and Martin O’Mullane neither the present SOS project or indeed many CXRS diagnostics around the world would probably exist. Thanks also to Ephrem Delabie who played a pivotal role in providing comprehensive data consistency checks and advanced modeling of beam emission processes.
Conflicts of Interest
The authors declare no conflict of interest.
Disclaimer
The views and opinions expressed herein do not necessarily reflect those of the ITER Organization.
References
- Atomic Data Base ADAS. Available online: http://adas.phys.ac.uk (accessed on 26 February 2019).
- Von Hellermann, M.G.; Biel, W.; Bertschinger, G.; Jupen, C.; O’Mullane, M.; Summers, H.; Whiteford, A. ComplexSpectra in Fusion Plasmas. Phys. Scr. 2005, 120, 19. [Google Scholar] [CrossRef]
- Svensson, J.; Werner, A. Large Scale Bayesian Data Analysis for Nuclear Fusion Experiments. In Proceedings of the 2007 IEEE International Symposium on Intelligent Signal Processing, Xiamen, China, 28 November–1 December 2007. [Google Scholar]
- Arshad, S.A.; Cordey, J.G.; McDonald, D.C.; Farthing, J.; Joffrin, E.; Von Hellermann, M.G.; Roach, C.M.; Svensson, J. Data Validation, Analysis, and Applications for Fusion Plasmas. Fus. Sci. Technol. 2008, 53, 667–669. [Google Scholar] [CrossRef]
- Tugarinov, S.; Krasilnikov, A.; Dokouka, V.; Khayrutdinov, R.; Beigman, I.; Tolstikhina, I.; Vainshtein, L.; Von Hellermann, M.G.; Malaquias, A. Conceptual design of the charge exchange recombination spectroscopy diagnostic for ITER. Rev. Sci. Instr. 2003, 74, 2075–2079. [Google Scholar] [CrossRef]
- Malaquias, A.; Von Hellermann, M.G.; Tugarinov, S.; Lotte, P.; Hawkes, N.; Kuldkepp, M.; Rachlew, E.; Gorshkov, A.; Walker, C.; Costley, A.; et al. Active beam spectroscopy diagnostics for ITER: Present status. Rev. Sci. Instr. 2004, 75, 3393–3398. [Google Scholar] [CrossRef]
- Von Hellermann, M.G.; Jaspers, R.; Biel, W.; Litnovsky, A.; Neubauer, O.; Pap, M.; Hawkes, N.C.; Marren, C.; Walton, B.; Kaschuck, Y.; et al. Status of the DNB based ITER CXRS and BES diagnostic. Rev. Sci. Instr. 2006, 77, 10F516. [Google Scholar] [CrossRef]
- Li, Y.Y.; Fu, J.; Lyu, B.; Du, X.W.; Li, C.Y.; Zhang, Y.; Yin, X.H.; Yu, Y.; Wang, Q.P.; Von Hellermann, M.G.; et al. Development of the charge exchange recombination spectroscopy and the beam emission spectroscopy on the EAST tokamak. Rev. Sci. Instr. 2014, 85, 11E428. [Google Scholar] [CrossRef] [PubMed]
- Huang, J.; Heidbrink, W.W.; Wan, B.; Von Hellermann, M.G.; Zhu, Y.; Gao, W.; Wu, C.; Li, Y.; Fu, J.; Lyu, B.; et al. Conceptual design of a fast-ion D-alpha diagnostic on experimental advanced superconducting tokamak. Rev. Sci. Instr. 2014, 85, 11E407. [Google Scholar] [CrossRef] [PubMed] [Green Version]
- Von Hellermann, M.G.; Mandl, W.; Summers, H.P.; Weisen, H.; Boileau, A.; Morgan, P.D.; Morsi, H.; Koenig, R.; Stamp, M.F.; Wolf, R. Visible charge exchange spectroscopy at JET. Rev. Sci. Instr. 1990, 61, 3479–3486. [Google Scholar] [CrossRef]
- Whiteford, A.; Von Hellermann, M.G.; Horton, L.D.; Zastrow, K.-D. “CXSFIT—User Manual”, November 2007. Available online: adas.phys.ac.uk/notes/adas_r07-01.pdf (accessed on 26 February 2019).
- Svensson, J.; Von Hellermann, M.G.; König, R. Analysis of Charge Exchange Spectra Using Neural Networks at the JET Tokamak. Plasma Phys. Controll. Fus. 1999, 41, 315. [Google Scholar] [CrossRef]
- Von Hellermann, M.G.; Summers, H.P. Atomic Modelling and Spectroscopic Diagnostics. In Proceedings of the 9th Topical Conference on High Temperature Plasma Diagnostics, Santa Fe, New Mexico, 15–19 March 1992. [Google Scholar]
- Von Hellermann, M.G. Quantitative Spectroscopy for Fusion Plasmas; Akademie Verlag: Berlin, Germany, 1994; pp. 117–130. [Google Scholar]
- Von Hellermann, M.G.; Delabie, E.; Jaspers, R.; Lotte, P.; Summers, H.P. Modelling and Evaluation of Spectra in Beam Aided Spectroscopy. In Proceedings of the 15–19th International Conference on Spectral Line Shapes, Valladolid, Spain, 15–20 June 2008; AIP Conference Proceedings. Volume 1058, pp. 187–194. [Google Scholar]
- Von Hellermann, M.G.; Breger, P.; Frieling, J.G.; König, R.W.T.; Mandl, W.; Maas, A.; Summers, H.P. Analytical Approximation of Cross-Section Effects on Observed CX Spectra in Hot Fusion Plasmas. Plasma Phys. Contr. Fus. 1995, 37, 71. [Google Scholar] [CrossRef]
- Tunklev, M.; Breger, P.; Günther, K.; Von Hellermann, M.G.; König, R.W.T.; O’Mullane, M.; Zastrow, K. Modelling of Passive Charge Exchange Emission and Neutral Background Density Deductions in JET. Plasma Phys. Contr. Fus. 1999, 41, 985–1024. [Google Scholar] [CrossRef]
- Reiter, D.; Baelmans, M.; Börner, P. The EIRENE and B2-EIRENE Codes. Fus. Sci. Technol. 2005, 47, 172–186. [Google Scholar] [CrossRef]
- Stratton, B.; Fonck, R.J.; Ramsay, A.T.; Synakowski, E.J.; Grek, B.; Hill, K.W.; Johnson, D.W.; Mansfield, D.K.; Park, H.; Taylor, G. Charge exchange recombination spectroscopy measurements in the extreme ultraviolet region of central carbon concentrations during high power neutral beam heating in TFTR. Nucl. Fusi. 1990, 30, 675. [Google Scholar] [CrossRef]
- Isler, R. An Overview of CX spectroscopy as plasma diagnostic tool. Plasma Phys. Contr. Fus. 1994, 36, 171. [Google Scholar] [CrossRef]
- Dux, R.; Geiger, B.; McDermott, R.M.; Puetterich, T.; Viezzer, E. Impurity density determination using charge exchange and beam emission spectroscopy. In Proceedings of the 39th EPS Conference on Plasma Physics, Stockholm, Sweden, 2–6 July 2012. [Google Scholar]
- Fonck, R.J.; Darrow, D.S.; Jaehnig, K.P. Determination of Plasma Ion Velocity Distribution via Charge Exchange Recombination Spectroscopy. Phys. Rev. A 1984, 29, 3288. [Google Scholar] [CrossRef]
- Finkenthal, D. The Measurement of Absolute Helium Ion Density Profiles on the DIII-D Tokamak Using Charge Exchange Recombination Spectroscopy. Ph.D. Thesis, University of California, Berkeley, CA, USA, 1994. [Google Scholar]
- Stotler, D. Atomic Physics in ITER. In Proceedings of the 5th International Conference on Atomic and Molecular Data and their Applications, Meudon, France, 15–19 October 2006. [Google Scholar]
- Kappatou, A.; McDermott, R.M.; Pütterich, T.; Dux, R.; Geiger, B.; Jaspers, R.J.; Donné, A.J.; Viezzer, E.; Cavedon, M. A forward model of the helium plume effect and the interpretation of helium charge exchange measurement at ASDEX Upgrade. Plasma Phys. Control Fus. 2018, 60, 055006. [Google Scholar] [CrossRef]
- Grisham, L.R.; Post, D.E.; Mikkelsen, D.R. Multi-MeV Li0 Beam as a Diagnostic for Fast Confined Alpha Particles. Nucl. Technol.-Fusion 1983, 3, 121–128. [Google Scholar] [CrossRef]
- Von Hellermann, M.G.; Mandl, W.; Summers, H.P. Investigation of Thermal and Slowing-down Alpha Particles on JET using Charge Exchange Spectroscopy. Plasma Phys. Control Fus. 1991, 33, 1805. [Google Scholar] [CrossRef]
- Von Hellermann, M.G.; Core, W.G.F.; Frieling, J.; Horton, L.D.; Koenig, R.W.T.; Summers, H.P. Observation of Alpha-Particle-Slowing-Down-Spectra in JET He Fuelling Experiments. Plasma Phys. Control Fus. 1993, 35, 799. [Google Scholar] [CrossRef]
- Stratton, B.C.; Fonck, R.J.; McKee, G.R.; Budny, R.V. Observation of sawtooth redistribution of non-thermal confined alpha particles in TFTR DT discharges. Nucl. Fus. 1996, 36, 1586. [Google Scholar] [CrossRef]
- Kappatou, A.; Delabie, E.; Jaspers, R.J.E.; Von Hellermann, M.G. Feasibility of non-thermal helium measurements with charge exchange spectroscopy on ITER. Nucl. Fus. 2012, 52, 043007. [Google Scholar] [CrossRef]
- Lauber, P. Linear Gyrokinetic Description of Fast Particle Effects on the MHD Stabilities in Tokamaks. Ph.D. Thesis, Technische Universität München, Munich, Germany, 2003. [Google Scholar]
- Heidbrink, W.W.; Sadler, G.J. The behaviour of fast ions in tokamak experiments. Nucl. Fus. 1994, 34, 535. [Google Scholar] [CrossRef]
- Heidbrink, W.W.; Burrell, K.H.; Lao, Y.; Pablant, N.A.; Ruskow, E. Hydrogenic fast-ion-diagnostic using Balmer Alpha light. Plasma Phys. Contr. Fus. 2004, 46, 1855. [Google Scholar] [CrossRef]
- Delabie, E.; Jaspers, R.J.E.; Von Hellermann, M.G.; Nielsen, S.K.; Marchuk, O. Charge exchange spectroscopy as a fast ion diagnostic on TEXTOR. Rev. Sci. Instr. 2008, 79, 10E522. [Google Scholar] [CrossRef] [PubMed]
- Geiger, B.; Garcia-Munoz, M.; Hobirk, J.; Tardini, G.; McDermott, R.; Dux, R. Fast-ion D-alpha measurements at ASDEX Upgrade. Plasma Phys. Control. Fus. 2011, 53, 065010. [Google Scholar] [CrossRef] [Green Version]
- Huang, J.; Heidbrink, W.W.; Von Hellermann, M.G.; Stagner, L.; Wu, C.R.; Hou, Y.M.; Chang, J.F.; Ding, S.Y.; Chen, Y.J.; Zhu, Y.B.; et al. Validation of fast-ion-D-alpha spectrum measurements during EAST neutral beam heated plasmas. Rev. Sci. Instr. 2016, 87, 11E542. [Google Scholar] [CrossRef] [PubMed]
- Marchuk, O.; Ralchenko, Y.; Janev, R.K.; Biel, W.; Delabie, E.; Urnov, A.M. Collisional excitation and emission of H- alpha Stark multiplet in fusion plasmas. J. Phys. B 2010, 43, 011002. [Google Scholar] [CrossRef]
- Marchuk, O.; Ralchenko, Y. Populations of Excited Parabolic States of Hydrogen Beam in Fusion Plasmas. In Atomic Processes in Basic and Applied Physics; Springer: Berlin/Heidelberg, Germany, 2012. [Google Scholar]
- Anderson, H.; Von Hellermann, M.G.; Horton, R.H.L.D.; Howman, A.C.; König, R.W.T.; Martin, R.; Olson, R.E.; Summers, H.P. Neutral beam stopping and emission in fusion plasmas I: Deuterium beams. Plasma Phys. Contr. Fus. 2000, 42, 781–806. [Google Scholar] [CrossRef]
- Delabie, E.; Brix, M.; Giroud, C.; Jaspers, R.J.; Marchuk, O.; O’Mullane, M.G.; Ralchenko, Y.; Surrey, E.; Von Hellermann, M.G.; Zastrow, K.D.; et al. Consistency of atomic data for the interpretation of beam emission spectra. Plasma Phys. Control. Fus. 2010, 52, 125008. [Google Scholar] [CrossRef]
- Von Hellermann, M.G.; Jaspers, R.J.E.; Zastrow, H.P. Recent Progress in Beam Emission and CX Spectroscopy. In Advanced Diagnostics for Magnetic and Inertial Fusion; Springer: Boston, MA, USA, 2005. [Google Scholar]
- Hutchinson, I. Principles of Plasma Diagnostics; Cambridge University Press: Cambridge, UK, 1987; p. 170. [Google Scholar]
- Carson, R.T. Coulomb Free-Free Gaunt Factor. Astron. Astrophys. 1988, 189, 319. [Google Scholar]
- Burgess, A.; Summers, H.P. Radiative Gaunt Factors. Mon. Not. R. astr. Soc. 1987, 226, 257–272. [Google Scholar] [CrossRef]
- Levinton, F.M. The multichannel motional stark effect diagnostic on TFTR. Rev. Sci. Instr. 1992, 63, 5157–5160. [Google Scholar] [CrossRef]
- Hawkes, N.C.; Stratton, B.C.; Tala, T.; Challis, C.D.; Conway, G.; DeAngelis, R.; Giroud, C.; Hobirk, J.; Joffrin, E.; Lomas, P.; et al. Observation of Zero Current Density in the Core of JET Discharges with Lower Hybrid Heating and Current Drive. Phys. Rev. Lett. 2001, 87, 115001. [Google Scholar] [CrossRef] [PubMed]
- Boileau, A.; Von Hellermann, M.G.; Mandl, W.; Summers, H.P.; Weisen, H.; Zinoviev, A. Observations of motional Stark features in the Balmer spectrum of deuterium in the JET plasma. J. Phys. B 1989, 22, L145. [Google Scholar] [CrossRef]
- De Bock, M.F.M.; Conway, N.J.; Walsh, M.J.; Carolan, P.G.; Hawkes, N.C. Ab initio modelling of motional Stark effect on MAST. Rev. Sci. Instr. 2008, 79, 10F524. [Google Scholar] [CrossRef] [PubMed]
- Reimer, R.; Marchuk, O.; Geiger, B.; Mc Carthy, P.J.; Dunne, M.; Hobirk, J.; Wolf, R. Influence of non-Local Thermodynamic Equlibrium and Zeeman Effects on magnetic equilibrium reconstruction using spectral Motional Stark Effect Diagnostic. Rev. Sci Inst. 2017, 88, 083509. [Google Scholar] [CrossRef] [PubMed]
- Abdurakhmanov, I.B.; Kadyrov, A.S.; Avazbaez, S.K.; Bray, I. Solution of proton-hydrogen scattering problem using a quantum-mechanical two-center convergent close-coupling method. J. Phys. B At. Mol. Opt. Phys. 2016, 49, 115203. [Google Scholar] [CrossRef]
- Heidbrink, W.W.; liu, D.; Luo, Y.; Ruskov, E.; Geiger, B. A Code that Simulates Fast-Ion Dα and neutral Particle Measurements. Commun. Comput. Phys. 2011, 10, 716. [Google Scholar] [CrossRef]
- Hollmann, E.M.; Pigarov, A.Y.; Denner, R.P. Effects of graphite and molybdenum wall tile reflections on visible light diagnostics in tokamak experiments. Rev. Sci. Instr. 2003, 74, 3984. [Google Scholar] [CrossRef]
- Zastrow, K.D.; Keatings, S.R.; Marot, L.; O’Mullane, M.G.; De Temmerman, G. Modelling the effect of reflection from metallic walls on spectroscopic measurements. Rev. Sci. Instr. 2008, 79, 10F527. [Google Scholar] [CrossRef]
- Banerjee, S.; Vasu, P.; Von Hellermann, M.G.; Jaspers, R.J.E. Wall reflecection modelling for charge exchange recombination spectroscopy (CXRS) measurements on TEXTOR and ITER. Plasma Phys. Contr. Fus. 2010, 52, 125006. [Google Scholar] [CrossRef]
- Lotte, P.; Aumenier, M.H.; Devynk, P.; Fenzi, C.; Martin, V.; Travere, J.M. Wall reflection issues for optical diagnostics in fusion devices. Rev. Sci. Instr. 2010, 81, 10E120. [Google Scholar] [CrossRef] [PubMed]
- Kajita, S.; de Bock, M.; Von Hellermann, M.G.; Kukushkin, A.; Barnsley, R. Ray tracing analysis of stray for charge exchange spectroscopy on ITER. Plasma Phys. Contr. Fus. 2015, 57, 045009. [Google Scholar] [CrossRef]
- Nikolic, D.; Gorczyca, T.W.; Korista, K.T.; Chatzikos, M.; Ferland, G.J.; Guzman, F.; van Hoof, P.A.M.; Williams, R.J.E.; Badnell, N.R. Suppression of Dielectronic Recombination Due to Finite Density Effects. II Analytical Refinement and Application to Density-dependent Ionization Balances and AGN Broad-line Emission. Astrophys. J. Suppl. Ser. 2018, 237, 41. [Google Scholar] [CrossRef]
| 1 | For a detailed description of the SOS modular structure and flow-charts see: https://git.iter.org/projects/DIAG/sos. |
Figure 1.
(a) ITER plasma profiles used for ADAS data 9MA_Steady_state_at_burn_D_2V3FDF; (b) High-density case: ITER plasma profiles 15MA_QDT=10_flat_density_profile_D_7GZZYQ.
Figure 1.
(a) ITER plasma profiles used for ADAS data 9MA_Steady_state_at_burn_D_2V3FDF; (b) High-density case: ITER plasma profiles 15MA_QDT=10_flat_density_profile_D_7GZZYQ.

Figure 2.
(a) Effective neutral beam beam emission spectroscopy (BES) Dα emission rate versus collisional energy, ADAS file ADF312(2003); (b) excited n = 2 population of injected neutral beam versus collisional energy, ADAS file ADF312(2003); (c) DI(3-2)-CX effective emission rate from ground (1s) and excited (n = 2) states, AFD315(1997); (d) NeX(10-9)-CX Effective emission rate from ground (1s) and excited (n = 2) states; (e) CVI(8-7)-CX Effective emission rate from ground (1s) and excited (n=2 )states; (f) BeIV(6-5)-CX effective emission rate from ground (1s) and excited (n = 2) states; (g) HeII(4-3)-CX Effective emission rate from ground (1s) and excited (n = 2 )states. The ADAS data base covers collisional rates up to 500 keV/am, see section on Fast Ion CXRS; (h) Photon emission coefficients for electron collisional excitation. PEC rates for HeII are about 250 times higher than those for CVI.


Figure 3.
(a) Effective beam stopping rate versus collisional energy, ADAS 312(2003). ITER test case, 9MA-steady-state-at-burn scenario, He (4%), C (0.2%), Be (2%), Ne (0.3%); (b) effective stopping cross-sections and contributions from individual impurities. ITER test case, 9MA-steady-state-at-burn-scenario, He (4%), C (0.2%), Be (2%), Ne (0.3%).

Figure 4.
(a) ITER diagnostics neutral beam (DNB) power density profile in vertical direction versus distance from duct position (plasma-entry); (b) ITER DNB power density profile in horizontal direction versus distance from duct position (plasma-entry).
Figure 4.
(a) ITER diagnostics neutral beam (DNB) power density profile in vertical direction versus distance from duct position (plasma-entry); (b) ITER DNB power density profile in horizontal direction versus distance from duct position (plasma-entry).

Figure 5.
(a) Exponential extrapolation of plasma profiles beyond separatrix (ρ = 1) to wall location assumed at (ρ = 1.05) ITER 15 MA-QDT-10-flat density scenario; (b) EIRENE neutral density modeling for atomic density (nH)). ITER 15 MA-QDT-10-flat density scenario.
Figure 5.
(a) Exponential extrapolation of plasma profiles beyond separatrix (ρ = 1) to wall location assumed at (ρ = 1.05) ITER 15 MA-QDT-10-flat density scenario; (b) EIRENE neutral density modeling for atomic density (nH)). ITER 15 MA-QDT-10-flat density scenario.

Figure 6.
(a) Schematic presentation of passive charge-exchange (PCX) model showing normalized radial profiles for neutral density (EIRENE) nd, impurity ion density nz, electron density ne, ion temperature Ti and CX emission rates QCX = < σv > CX. Note, for ITER, a flat concentration profile is assumed, hence the normalized radial shapes for nz and ne are the same; (b) Synthetic line-of-sight integrated NeX PCX spectrum. The non-Gaussian asymmetric shape can be approximated either by a sum of a “cold” (1.14 keV) and “hot” (3.46 keV) component, or, alternatively by a Single Gaussian shape and associated Doppler width and ion temperature (2.4 keV). This temperature corresponds to emission layer located at ρ = 0.98 (Figure 1b).

Figure 7.
(a) Collisional model for Motional Stark Effect (MSE) multiplet line ratios. Ebeam 100 keV/amu; (b) collisional model for MSE multiplet: Ratio of π/σ net emission and its deviation from statistical population versus density; (c) collisional model for MSE multiplet showing the ratio between π to σ emission and its deviation from statistical population versus energy. ne = 7.2·1019 m−3, Ti = Te = 20 keV.

Figure 8.
(a) asymmetric MSE spectrum, HNB 500 keV/amu, Finite Ion Grid presentation with 64 * 20 beamlets. ITER 9MA scenario, E-port-3, ρ = 0.4, dispersion is 0.85 nm/mm; (b) asymmetric MSE spectrum, HNB 500 keV/amu Single-Point Ion Grid presentation. ITER 9MA scenario, E-port-3, ρ = 0.4, dispersion is 0.85 nm/mm; (c) asymmetric MSE spectrum. DNB 100 keV/amu, Finite Ion Grid presentation with 64 * 20 beamlets with 5 mrad divergence. ITER 9MA steady state scenario, U-port-3, ρ = 0.3, disp = 0.55 nm/mm; (d) asymmetric MSE spectrum. DNB 100keV/amu. Single-Point Ion Grid presentation, DNB divergence 10 mrad. ITER 9MA steady-state scenario, U-port-3, ρ = 0.3, disp = 0.55 nm/mm.

Figure 9.
(a) Electron- and Ion-ionisation rates used for Halo model; (b) Halo and beam density profile, ITER, DNB 100keV/amu, 9MA scenario.
Figure 9.
(a) Electron- and Ion-ionisation rates used for Halo model; (b) Halo and beam density profile, ITER, DNB 100keV/amu, 9MA scenario.

Figure 10.
(a) Prompt HeII CX spectrum, synthetic line of sighted integrated halo spectrum and Gaussian prompt spectrum normalized to halo amplitude. Ratio Ihalo/(Iprompt+Ihalo) = 0.07for the 9 MA-steady-state-at-burn scenario; (b) Prompt HeII CX spectrum, synthetic line of sighted integrated halo spectrum and Gaussian prompt spectrum normalized to halo amplitude Ratio Ihalo/(Iprompt+Ihalo) = 0.16. for the 15 MA flat density scenario.

Figure 11.
(a) radial profile of halo fraction (Ihalo/(Iprompt+Ihalo), HeII 9MA-steady-state-at-burn scenario; (b) radial profile of halo fraction (Ihalo/(Iprompt+Ihalo), HeII 15MA-flat-density scenario.
Figure 11.
(a) radial profile of halo fraction (Ihalo/(Iprompt+Ihalo), HeII 9MA-steady-state-at-burn scenario; (b) radial profile of halo fraction (Ihalo/(Iprompt+Ihalo), HeII 15MA-flat-density scenario.

Figure 12.
(a) Radial resolution without halo effect and with halo effect; (b) radial resolution without halo effect and with halo effect.
Figure 12.
(a) Radial resolution without halo effect and with halo effect; (b) radial resolution without halo effect and with halo effect.

Figure 13.
(a) SOS halo-model spectrum for HeII/BeIV CX Spectra. The synthetic line-of-sight-integrated spectra for halo and PCX components is only shown for HeII. Halo fraction 13% 9MA_Steady_state_at_burn_D_2V3FDF; (b) SOS halo-model spectrum for HeII/BeIV CX Spectra. The synthetic line of sight integrated spectra for halo and PCX component is only shown for HeII. Halo fraction 23% 15MA-flat-density scenario.

Figure 14.
(a) Dα Spectrum with prompt signal and comparison of Gaussian-like halo shape and Synthetic l.o.s. integrated halo shape. 9MA_Steady_state_at_burn_D_2V3FDF; (b) Dα Spectrum with prompt signal and comparison of Gaussian-like halo shape and Synthetic l.o.s. integrated halo shape. 15MA_QDT=10_flat_density_profile_D_7GZZYQ.

Figure 15.
(a) Simulation of Spectra (SOS) halo-modeling of fraction Ihalo/(Iprompt+Ihalo) for Dα spectrum; (b) SOS halo-modeling of fraction Ihalo/(Iprompt+Ihalo) for Dα spectrum.
Figure 15.
(a) Simulation of Spectra (SOS) halo-modeling of fraction Ihalo/(Iprompt+Ihalo) for Dα spectrum; (b) SOS halo-modeling of fraction Ihalo/(Iprompt+Ihalo) for Dα spectrum.

Figure 16.
(a) Retrieval of plasma dilution nd/ne from from measured Dα spectrum. Blue rhombs, apparent values, without correction for halo effect. Red squares, applying halo effect leads to consistent and sensible dilution values <1; (b) Retrieval of plasma dilution nd/ne from from measured charge-exchange recombination spectroscopy (CXRS) Dα spectrum. Blue rhombs, apparent values, without correction for halo effect. Red squares, applying halo effect leads to consistent and sensible dilution values <1.

Figure 17.
Schematic presentation of Cross-section effects: Frist order gradients dσ/dv lead to apparent Doppler shift, second order gradients d2σ/dv2 lead to apparent Doppler width.
Figure 17.
Schematic presentation of Cross-section effects: Frist order gradients dσ/dv lead to apparent Doppler shift, second order gradients d2σ/dv2 lead to apparent Doppler width.

Figure 18.
(a) SOS cross-section-effect-modeling for HeII spectrum. 9MA_Steady_state_at_burn_D_2V3FDF; (b) SOS cross-section-effect-modeling for HeII spectrum. 15MA_QDT=10_flat_density_profile_D_7GZZYQ. (c) SOS cross-section-effect-modeling for NeX spectrum. 9MA_Steady_state_at_burn_D_2V3FDF (d) SOS cross-section-effect-modeling for NeX spectrum. 15MA_QDT=10_flat_density_profile_D_7GZZYQ.

Figure 19.
(a) Synthetic Non-Gaussian HeII plume spectrum for ‘worst plume case’ using E-port-Upper with lines of sight almost parallel to magnetic field lines. Halo/prompt 29%, plume/prompt 35%; (b) Synthetic HeII plume spectrum for ‘minimum plume case’ using U-port-3 with lines of sight 60° to magnetic field lines. Halo fraction 23%, plume/prompt 1.9%; (c) Synthetic non-Gaussian HeII plume spectrum and comparison to normalized Gaussian shape of prompt ACX spectrum for ‘worst plume case’ using E-port-Lower with lines of sight almost parallel to magnetic field lines. Plume/prompt 35% at r = 0.4; (d) Synthetic near Gaussian HeII plume spectrum and comparison to normalized Gaussian shape of prompt ACX spectrum for ‘minimum plume case’ using Uport-3 with lines of sight 60° to magnetic field lines. Plume/prompt 2% at r = 0.3; (e) Plume-over-Prompt ratio for ‘worst plume case’ using E-port-Upper with lines of sight almost parallel to magnetic field lines. (f)Plume-over-Prompt ratio for ‘minimum plume case’ using Uport-3 with lines of sight about 60° to magnetic field lines.

Figure 20.
(a) Figure of merit for Fast Ion CXRS on confined alpha particles. Solid line: nfast*nbeam (normalized). Dashed line: nfast (max. 2.8 × 10¹⁸ m−3). Dotted line: nbeam (max. 3.0 × 10¹⁴ m−3). E-port-3-Upper, DNB 100keV/amu, 36A, 9MA_Steady_state_at_burn_D_2V3FDF; (b) Figure of merit for Fast Ion CXRS on confined alpha particles. Solid line: nfast*nbeam (normalized). Dashed line: nfast (max. 2.2 × 10¹⁸ m−3). Dotted line: nbeam (max. 2.8 × 10¹⁴ m−3). E-port-3-Upper, DNB 100keV/amu, 36A, 15MA_QDT=10_flat_density_profile_D_7GZZYQ.

Figure 21.
(a)Predicted CXRS alpha particle energy spectrum. E-port-3-Upper, DNB, high-throughput broad-band spectrometer F1.8, disp 0.8 nm/mm, 0.5 s, slit 1 × 12 mm, energy binning 50 keV 9MA_Steady_state_at_burn_D_2V3FDF; (b) Predicted CXRS alpha particle energy spectrum. E-port-3-Upper, DNB, high-throughput broad-band spectrometer F1.8, disp 0.8 nm/mm, 0.5 s, slit 1 × 12 mm, energy binning 50 keV 15MA_QDT=10_flat_density_profile_D_7GZZYQ.

Figure 22.
(a) ITER DNB source rate, beam power 3.6MW, energy 100 keV, Finite-Grid model for 1280 beamlets, shine through 1.5%; (b) FICX on beam ions (FIDA), solid line: figure-of-merit, dashed line: fast ion density profile, dotted line: DNB density profile. All signals shown are normalized by their respective maxima. (c) 3-dim presentation of anisotropic beam-ion slowing-down velocity distribution function [28] versus vperp and vpar respectively (parallel and perpendicular to the magnetic field). Velocities are in m/s. (d) SOS simulation for FICX on DNB showing thermal, MSE and slowing-down features as well as continuum and associated noise level. The FICX signal is two orders of magnitude below the thermal feature and is even at the maximum figure of merit location, r = 0.8, barely visible.

Figure 23.
(a) Continuum radiation reflection study for ITER Uport-3 showing direct continuum radiation, blue line, reflected divertor continuum, green line and reflected bulk continuum, dashed red-line. The electron density in the divertor region is assumed to be 10 x on-axis electron density; (b) red line: Direct ACX (active charge exchange) HeII spectrum, blue line: Accumulated spectrum from reflected ACX spectra emitted along beam path. A semilogarithmic presentation is chosen to illustrate the non-Gaussian character of the accumulated sum spectrum. The peak amplitude of reflected spectrum is 11% of direct amplitude (Be wall reflection 40%).

© 2019 by the authors. Licensee MDPI, Basel, Switzerland. This article is an open access article distributed under the terms and conditions of the Creative Commons Attribution (CC BY) license (http://creativecommons.org/licenses/by/4.0/).
Share and Cite
MDPI and ACS Style
von Hellermann, M.; de Bock, M.; Marchuk, O.; Reiter, D.; Serov, S.; Walsh, M. Simulation of Spectra Code (SOS) for ITER Active Beam Spectroscopy. Atoms 2019, 7, 30. https://0-doi-org.brum.beds.ac.uk/10.3390/atoms7010030
AMA Style
von Hellermann M, de Bock M, Marchuk O, Reiter D, Serov S, Walsh M. Simulation of Spectra Code (SOS) for ITER Active Beam Spectroscopy. Atoms. 2019; 7(1):30. https://0-doi-org.brum.beds.ac.uk/10.3390/atoms7010030
Chicago/Turabian Stylevon Hellermann, Manfred, Maarten de Bock, Oleksandr Marchuk, Detlev Reiter, Stanislav Serov, and Michael Walsh. 2019. "Simulation of Spectra Code (SOS) for ITER Active Beam Spectroscopy" Atoms 7, no. 1: 30. https://0-doi-org.brum.beds.ac.uk/10.3390/atoms7010030
Note that from the first issue of 2016, this journal uses article numbers instead of page numbers. See further details here.