Laser-Induced Breakdown Spectroscopy Assisted by Machine Learning for Plastics/Polymers Identification


1
Department of Physics, University of Patras, 26 504 Patras, Greece
2
Institute of Chemical Engineering Sciences (ICE-HT), Foundation for Research and Technology-Hellas (FORTH), Stadiou Str., 26 504 Patras, Greece
*
Author to whom correspondence should be addressed.
Atoms 2019, 7(3), 79; https://0-doi-org.brum.beds.ac.uk/10.3390/atoms7030079
Submission received: 26 July 2019
/
Revised: 12 August 2019
/
Accepted: 13 August 2019
/
Published: 19 August 2019
(This article belongs to the Special Issue Laser Plasma Spectroscopy Applications)
Abstract
:In the present work, Laser-Induced Breakdown Spectroscopy (LIBS) is used for the discrimination/identification of different plastic/polymeric samples having the same polymeric matrix but containing different additives (as e.g., fillers, flame retardants, etc.). For the classification of the different plastic samples, some machine learning algorithms were employed for the analysis of the LIBS spectroscopic data, such as the Principal Component Analysis (PCA) and the Linear Discriminant Analysis (LDA). The combination of LIBS technique with these machine learning algorithmic approaches, in particular the latter, provided excellent classification results, achieving identification accuracies as high as 100%. It seems that machine learning paves the way towards the application of LIBS technique for identification/discrimination issues of plastics and polymers and eventually of other classes of organic materials. Machine learning assisted LIBS can be a simple to use, efficient and powerful tool for sorting and recycling purposes.
1. Introduction
The recycling of plastics and polymeric materials has become an emerging need during the last years, being of great importance for modern societies because of its environmental impact. Plastics can be recycled by various methods, as e.g., thermal depolymerization, heat compression, etc. However, independently of the method employed, a major issue in plastic’s recycling is the identification of the different types of polymers and their separation prior to the recycling process. Otherwise, if the plastics with different types of polymers are recycled together, then the resulting material is usually of very low value—its initial properties being usually degraded and in most of the cases, inappropriate for further use. In addition to this issue, the different plastics may contain a large variety of different and non-standard added substances, such as synergists, coloring additives (which could be organics and/or inorganics), flame-retardants (used for safety considerations, smoke reduction in case of fire etc.) and several other additives aiming to improve some property of the plastic and/or add some functionality related to the use of the plastic objects. Some of these additives can be toxic, as for instance the halogen containing flame-retardants (e.g., the brominated ones, usually refer as BFRs) while besides of their toxicity they have the tendency to downgrade the recycling process’s results.
It becomes obvious from the above, that in order to support and make economically viable the recycling activities, it is necessary, among other measures, to develop methods which can operate automated while providing a high degree of accuracy and reliability in the sorting of the various types of plastics and polymers, in order to replace the manual sorting, which, unfortunately, is still a common practice. A rapid sorting/identification of these polymers is important, so that they are removed and recycled separately.
In order to facilitate identification of the different types of plastics, the Plastic Identification Code (PIC) has been introduced by the Society of the Plastics Industry, Inc. PIC is a codename which follows each type of plastic, being printed, as a stamp, on every piece of produced plastic material [1]. However, this type of identification is not yet universally accepted, and many countries do not oblige the various producers of plastic items to apply it. In addition, often, during the recycling processes, fragments of plastic, without the PIC identification, can be collected, making identification task impossible. In that view, analytical techniques constitute an alternative and are employed for the determination and classification of the different types of plastics. In fact, classical analytical techniques are widely used, with more prominent among them the chromatographic, thermal and spectroscopic techniques. Among the many spectroscopic techniques used in polymer sorting are the infrared spectroscopy (IR), the UV–Vis absorption spectroscopy, the NMR, the Inductively Coupled Plasmas combined with Atomic Absorption Spectroscopy (ICP-AAS) or Mass Spectroscopy (ICP-MS), the X-ray fluorescence (XRF) and the Raman spectroscopy. These techniques are in general quite sensitive, while they can provide accurate information regarding the structure of the polymer of the plastic item and the qualitative and quantitative (this latter under certain conditions) analysis of the various additives present in. However, these techniques require time-consuming and careful pre-treatment of the sample, which vary for the different kinds of plastics. Furthermore, these techniques are either expensive, or cannot be used in situ and on-line in the waste stream. For example, depending on the crystallinity of the plastic, different types of solvent must be used in UV–Vis absorption spectroscopy and NMR, implying long experimental procedures prior to obtain some results, which is an undesired situation for on-line applications. Furthermore, Raman, ICP-AAS and ICP-MS spectroscopy setups are rather expensive, while IR spectroscopy is not effective on dark colored samples. Also, these techniques do not necessarily detect atomic or molecular species connected to flame retardants, so many of them need to be used cooperatively.
Laser-Induced Breakdown Spectroscopy (LIBS), is a laser based analytical technique which has been proposed for numerous applications, as for instance for the detection of metals in several kinds of matrices (i.e., minerals, environmental, metallurgical, etc.) [2,3,4,5,6,7], for combustion related diagnostics [8,9,10], for cultural heritage and artwork restoration and conservation [11,12,13], while it has also been proposed for the sorting of plastics for recycling purposes [14,15,16,17,18,19,20]. The simplest LIBS setup requires an ns pulsed laser and a spectrograph. The pulsed laser beam is focused on the surface of the sample inducing a micro-plasma (i.e., a spark), while the radiation emitted from the plasma after it has been collected, is spectrally analyzed by a monochromator/spectrograph. The emission spectra acquired can be further analyzed on a computer, and can provide, in principle, valuable information about the qualitative and quantitative composition of the sample. The spectra acquisition and treatment are usually performed very quickly, lasting typically few milliseconds time only. The attractive experimental simplicity of LIBS technique combined with the non-required time-consuming sample preparation procedures, have made LIBS very popular among the various laser based analytical techniques.
More recently, LIBS has been combined with chemometrics and machine learning approaches, extending its capabilities considerably by allowing for the identification/discrimination between samples having very similar chemical composition. Some of the most common and efficient machine learning algorithms proposed, which are suitable for handling LIBS spectroscopic data as well, are the Principal Components Analysis (PCA), the Discriminant Function Analysis (DFA), the Partial Least Squares Regression (PLS-R), the Support Vector Machines (SVMs) and the Artificial Neural Networks (ANNs) [21].
A problem concerning the identification/discrimination of plastics by LIBS is their content in flame retardants [22,23,24]. The limited success of LIBS technique in that matter is most probably due to the fact that the bromine (Br) content of the brominated chemical substances which are often used as flame retardants is difficult to be detected by LIBS because the principal bromine spectral emissions are lying either in the VUV spectral region (which requires special vacuum equipment) or in the NIR where the most common CCD detectors employed in LIBS setups present relatively lower efficiency [25,26,27]. According to NIST spectral database [25], the more intense spectral lines of bromine lie in the NIR region (i.e., 790–940 nm). However, these lines are not observed here. This could be due to the lower response of the detectors in this spectral region. In fact, both detectors, i.e., the CCD and the ICCD have much lower sensitivity in the NIR that in the UV–VIS. Some other spectral lines, e.g., lying at 447 and 452 nm, having however lower intensity that the NIR lines, were also not observed. This could probably be due to the strong neighboring CN and C2 bands lying nearby and/or to the relatively important continuum observed in this spectral region. These difficulties met in Br detection affect both the portability and the cost of the LIBS setup making it less appropriate for in situ and on-line analysis on the waste stream.
Concerning the application of LIBS for the identification/discrimination of plastics and polymers for recycling purposes, LIBS technique has been shown to provide successful identification of several common plastic materials, such as polyethylene terephthalate (PET), high-density polyethylene (HDPE), polyvinyl chloride (PVC), low-density polyethylene (LDPE), polyethylene (PE), polypropylene (PP) and polystyrene (PS) [14,15,16,17,18,19,20]. However, the color of the samples can affect the percentage of correct identifications, as the differences of the reflectivity of the samples lead to different degree of absorption of the laser beam and thus different plasma excitation, complicating the comparison between the LIBS spectra [17,18,20]. So, for example, in dark-colored samples, which absorb more efficiently the IR laser beams (or have lower reflectivity at the laser wavelength), the resulting plasma is usually characterized by higher plasma temperature than, e.g., samples exhibiting less absorption (or higher reflectivity at the laser wavelength). A direct consequence of this is the different degree of excitation, which in its turn results in different plasma emission.
In the present investigation, LIBS technique assisted by some machine learning algorithms is used for the identification/discrimination of plastic samples consisting of Acrylonitrile Butadiene Styrene (ABS) containing various types of additives (e.g., fillers, etc.) and brominated flame retardants (BFRs). This category of plastic samples has been chosen because it represents a common class of plastic wastes, as they are found in the wastes of electrical and electronic equipment (WEEE). The WEEEs are of high interest regarding their recycling, because they contain hazardous substances while their production requires the use of scarce and expensive resources, making the recovery process a viable and interesting activity from the economic point of view as well. Additionally, because of the great importance of the WEEEs’ management, it has led to new legislations in the EU [28,29] about their treatment.
2. Materials and Methods
2.1. Experimental Setup
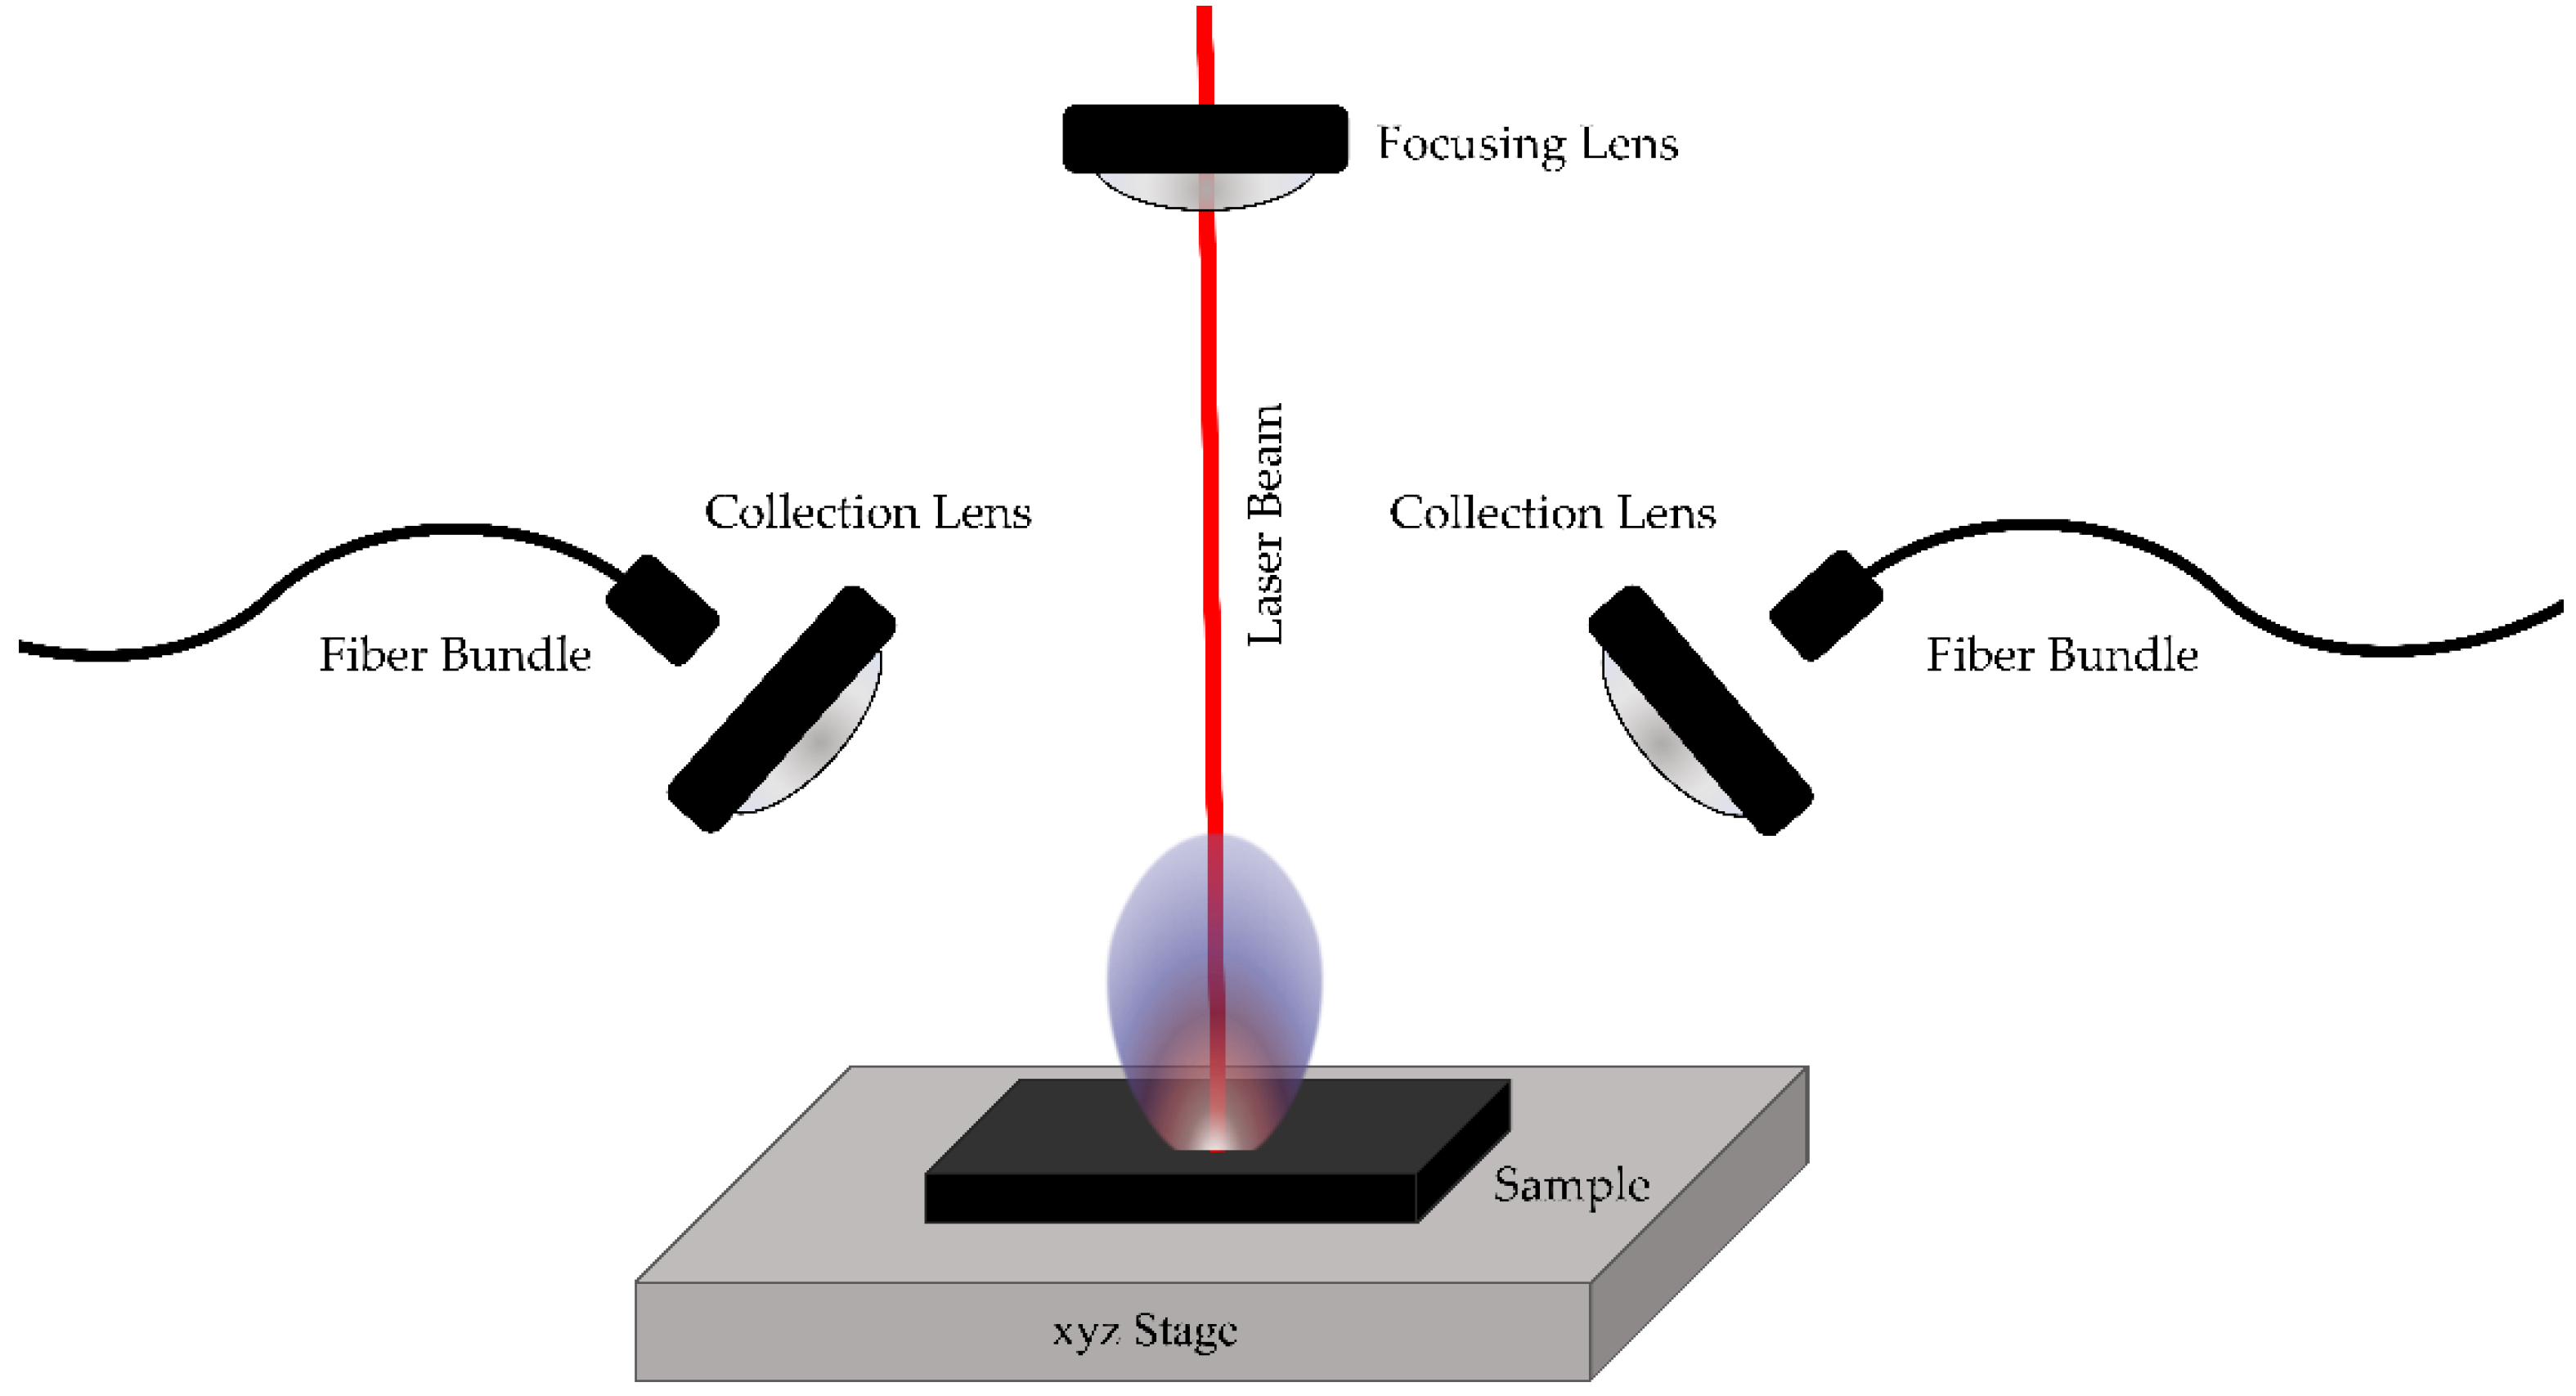
For the creation of the plasma on the surface of the plastic samples, a 5 ns Q-Switched Nd:YAG laser (Quanta-Ray INDI, Spectra Physics), operating at a repetition rate up to 10 Hz or at single-shot mode was used. The energy of the laser beam was measured using a calibrated joule meter and was kept constant at 100 mJ, while the diameter of the beam at the focus was measured by a CCD and was determined to be 38 μm. This energy was chosen and maintained for the rest of the measurements in order to obtain a good signal to noise ratio while reducing the formation of large craters. The laser beam was focused at the samples’ surface by a 2-inch diameter, 50 mm focal length quartz lens as shown schematically in Figure 1. The radiation emitted from the plasma was collected by two similar quartz lenses, which were focusing the collected radiation to the inputs of two quartz optical fiber bundles as shown in Figure 1. The two fiber bundles were coupled to a portable spectrograph and to a monochromator. The portable spectrometer (Avantes AvaSpec-2048-USB2, 75 mm focal length, equipped with a 300 lines/mm diffraction grating) was equipped with a 2048-pixel CCD detector array and was covering the spectral range from 200 to 1100 nm. Its CCD (and its associated electronics) had a minimum time delay of 1.28 μs and a minimum temporal gate width of 1.05 ms. The monochromator employed was a 0.46 m focal length Czerny–Turner one (Jobin–Yvon HR460, with a 1200 lines/mm holographic diffraction grating) and equipped with an ICCD camera (Andor iStar DH712). The ICCD camera allowed for variable time delay, from 0 to several ms after its triggering, while the minimum temporal gate width was 5 ns. The width of the entrance slit of the monochromator was set at 50 μm. Under this configuration, the ICCD of the monochromator had a spectral window of 21 nm. In order to minimize crater formation at the samples’ surfaces, the samples were placed on an xyz linear translation stage to be displaced easily (see Figure 1).
2.2. Samples
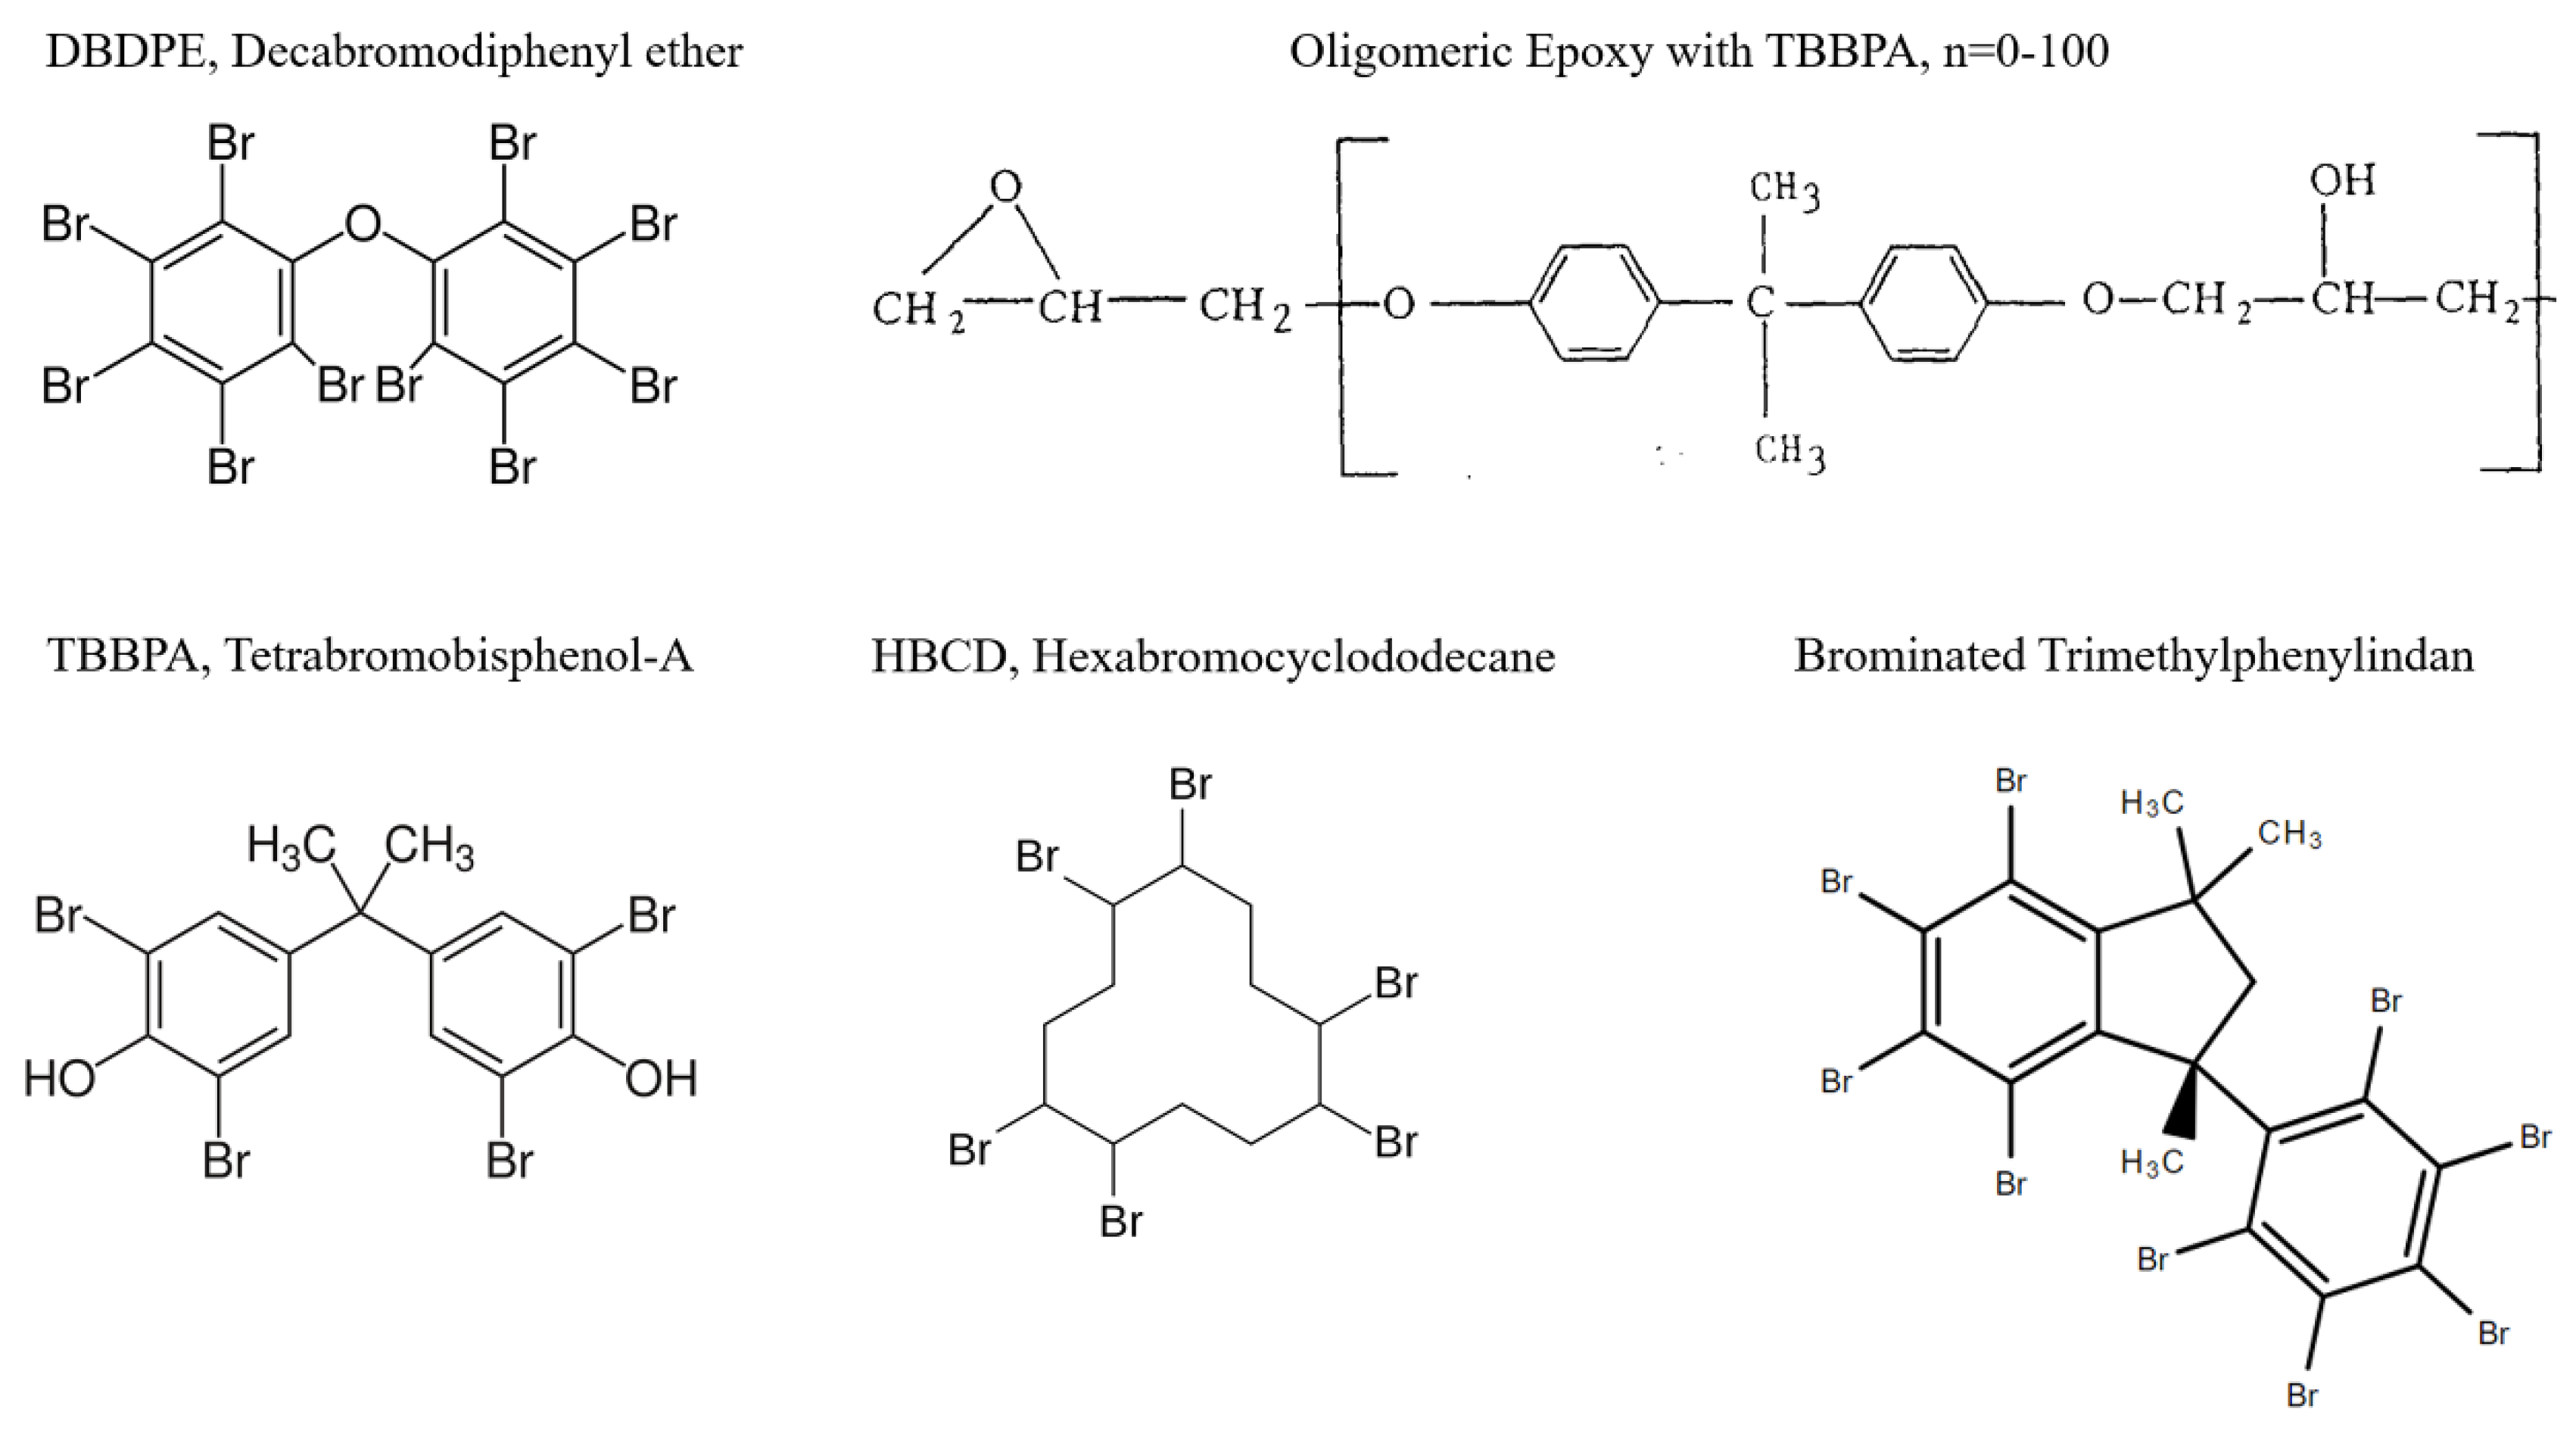
The samples used were industrial grade Acrylonitrile Butadiene Styrene polymers (chemical formula: ((C8H8)x(C4H6)y(C3H3N)z), short named as ABS) with dimensions 5 cm × 3 cm. They contained 1% black masterbatch as a color pigment. Black masterbatch is a mixture of 50% carbon black and 50% ethylene vinyl acetate (EVA) copolymer carrier. Carbon black is usually added to polymers as a UV absorber and EVA is an elastomeric polymer that is also used as a UV absorber, as well as to enhance the elastic properties of the final product. The samples contained either fillers or BFRs along with 5% Sb2O3 as a synergist, as shown on Table 1. The brominated compounds are illustrated in Figure 2. The choice of the samples was made in order to have a variety of the most common additives (including the most common BFRs) found in WEEE.
Barite and silica are usually added as binders to lower the consumption of more expensive materials and they are both used to improve the plastics’ mechanical properties. In fact, barite improves the chemical corrosion resistance, and the heat tolerance and the product appearance of the plastic products while silica improves their tear strength and increases their viscosity. Magnesium hydroxide is added in polymers as a halogen-free flame retardant and smoke suppressor.
Decabromodiphenyl ether (DBDPE), Tetrabromobisphenol-A (TBBPA), Tetrabromobisphenol-A with Oligomeric Epoxy (OE-TBBPA), Hexabromocyclododecane (HBCD) and Brominated Trimethylphenylindan are brominated flame retardants (BFRs) commonly found in WEEE, especially in ABS. Moreover, antimony trioxide (Sb2O3) is a common synergist that amplifies the effectiveness of flame retardants.
2.3. Data Collection and Treatment
The data collected during the present investigation were LIBS spectra extended from 200 to 1100 nm, corresponding the emission of the plasma plume, and emission spectra of some specific spectral features of interest, e.g., the C2 Swan Band system (Δv = 0) (lying between 495.3 and 518.8 nm) [30]. The spectra were simultaneously collected by both spectroscopic systems (i.e., the portable spectrograph and the monochromator). An average of 5 single shots on the same spot on each sample’s surface was considered as one measurement. Before each 5-shots cycle, three laser shots were used to clean up the samples’ surface. Then, 20 such spectra, from different locations over the sample surface, were acquired for each sample. This procedure was chosen in order to take into account any possible inhomogeneity of the samples and to ensure the reproducibility of the LIBS spectra as well. The most suitable temporal parameters for both experimental setups were determined to be a delay time of 1.28 μs and a temporal gate width of 1.05 ms.
For the analysis of the LIBS spectroscopic data two algorithms were used, the Principal Component Analysis (PCA) and the Linear Discriminant Analysis (LDA). Since the former is an unsupervised algorithm, only the obtained LIBS spectra were used as inputs in order to search for similarities and differences between the samples’, stemming from the various additives they contained. PCA is used for the reduction of the dimensionality of the original data set, allowing for the visualization of a high dimension space to a lower dimension one. Thus, LIBS spectra were exposed to PCA in order to visualize the distribution of the samples, detect outliers and for dimension reduction.
Next, Linear Discriminant Analysis was employed to classify the different types of plastic samples. Since it is a supervised algorithm, along with the obtained LIBS spectra, the corresponding label for each type of sample was also used as input. LDA is used for dimensionality reduction of the data set while retaining the information that discriminates output classes. It is also used to find a decision boundary around each cluster of a class. It then projects the data points to new dimensions in a way that the clusters are as separate as possible from each other, and the individual elements within a cluster are as close to the centroid of the cluster. The new dimensions are ranked on the basis of their ability to maximize the distance between the clusters and minimize the distance between the data points within a cluster and their centroids. The new dimensions form the linear discriminants of the feature data set. These algorithms were trained using the in-built routines contained in the open-source machine learning Python library Scikit-learn [31].
The prediction accuracy of the models created with the LDA algorithm was computed using a 10-fold cross-validation technique. Also, confusion matrices were computed for each model. These matrices were produced using the train–test split method, where the LIBS dataset was randomly split in two parts, the training set consisting of 70% of the data and the test set making use of the remaining 30% of the data.
3. Results
3.1. Investigation of the Acquired Spectra
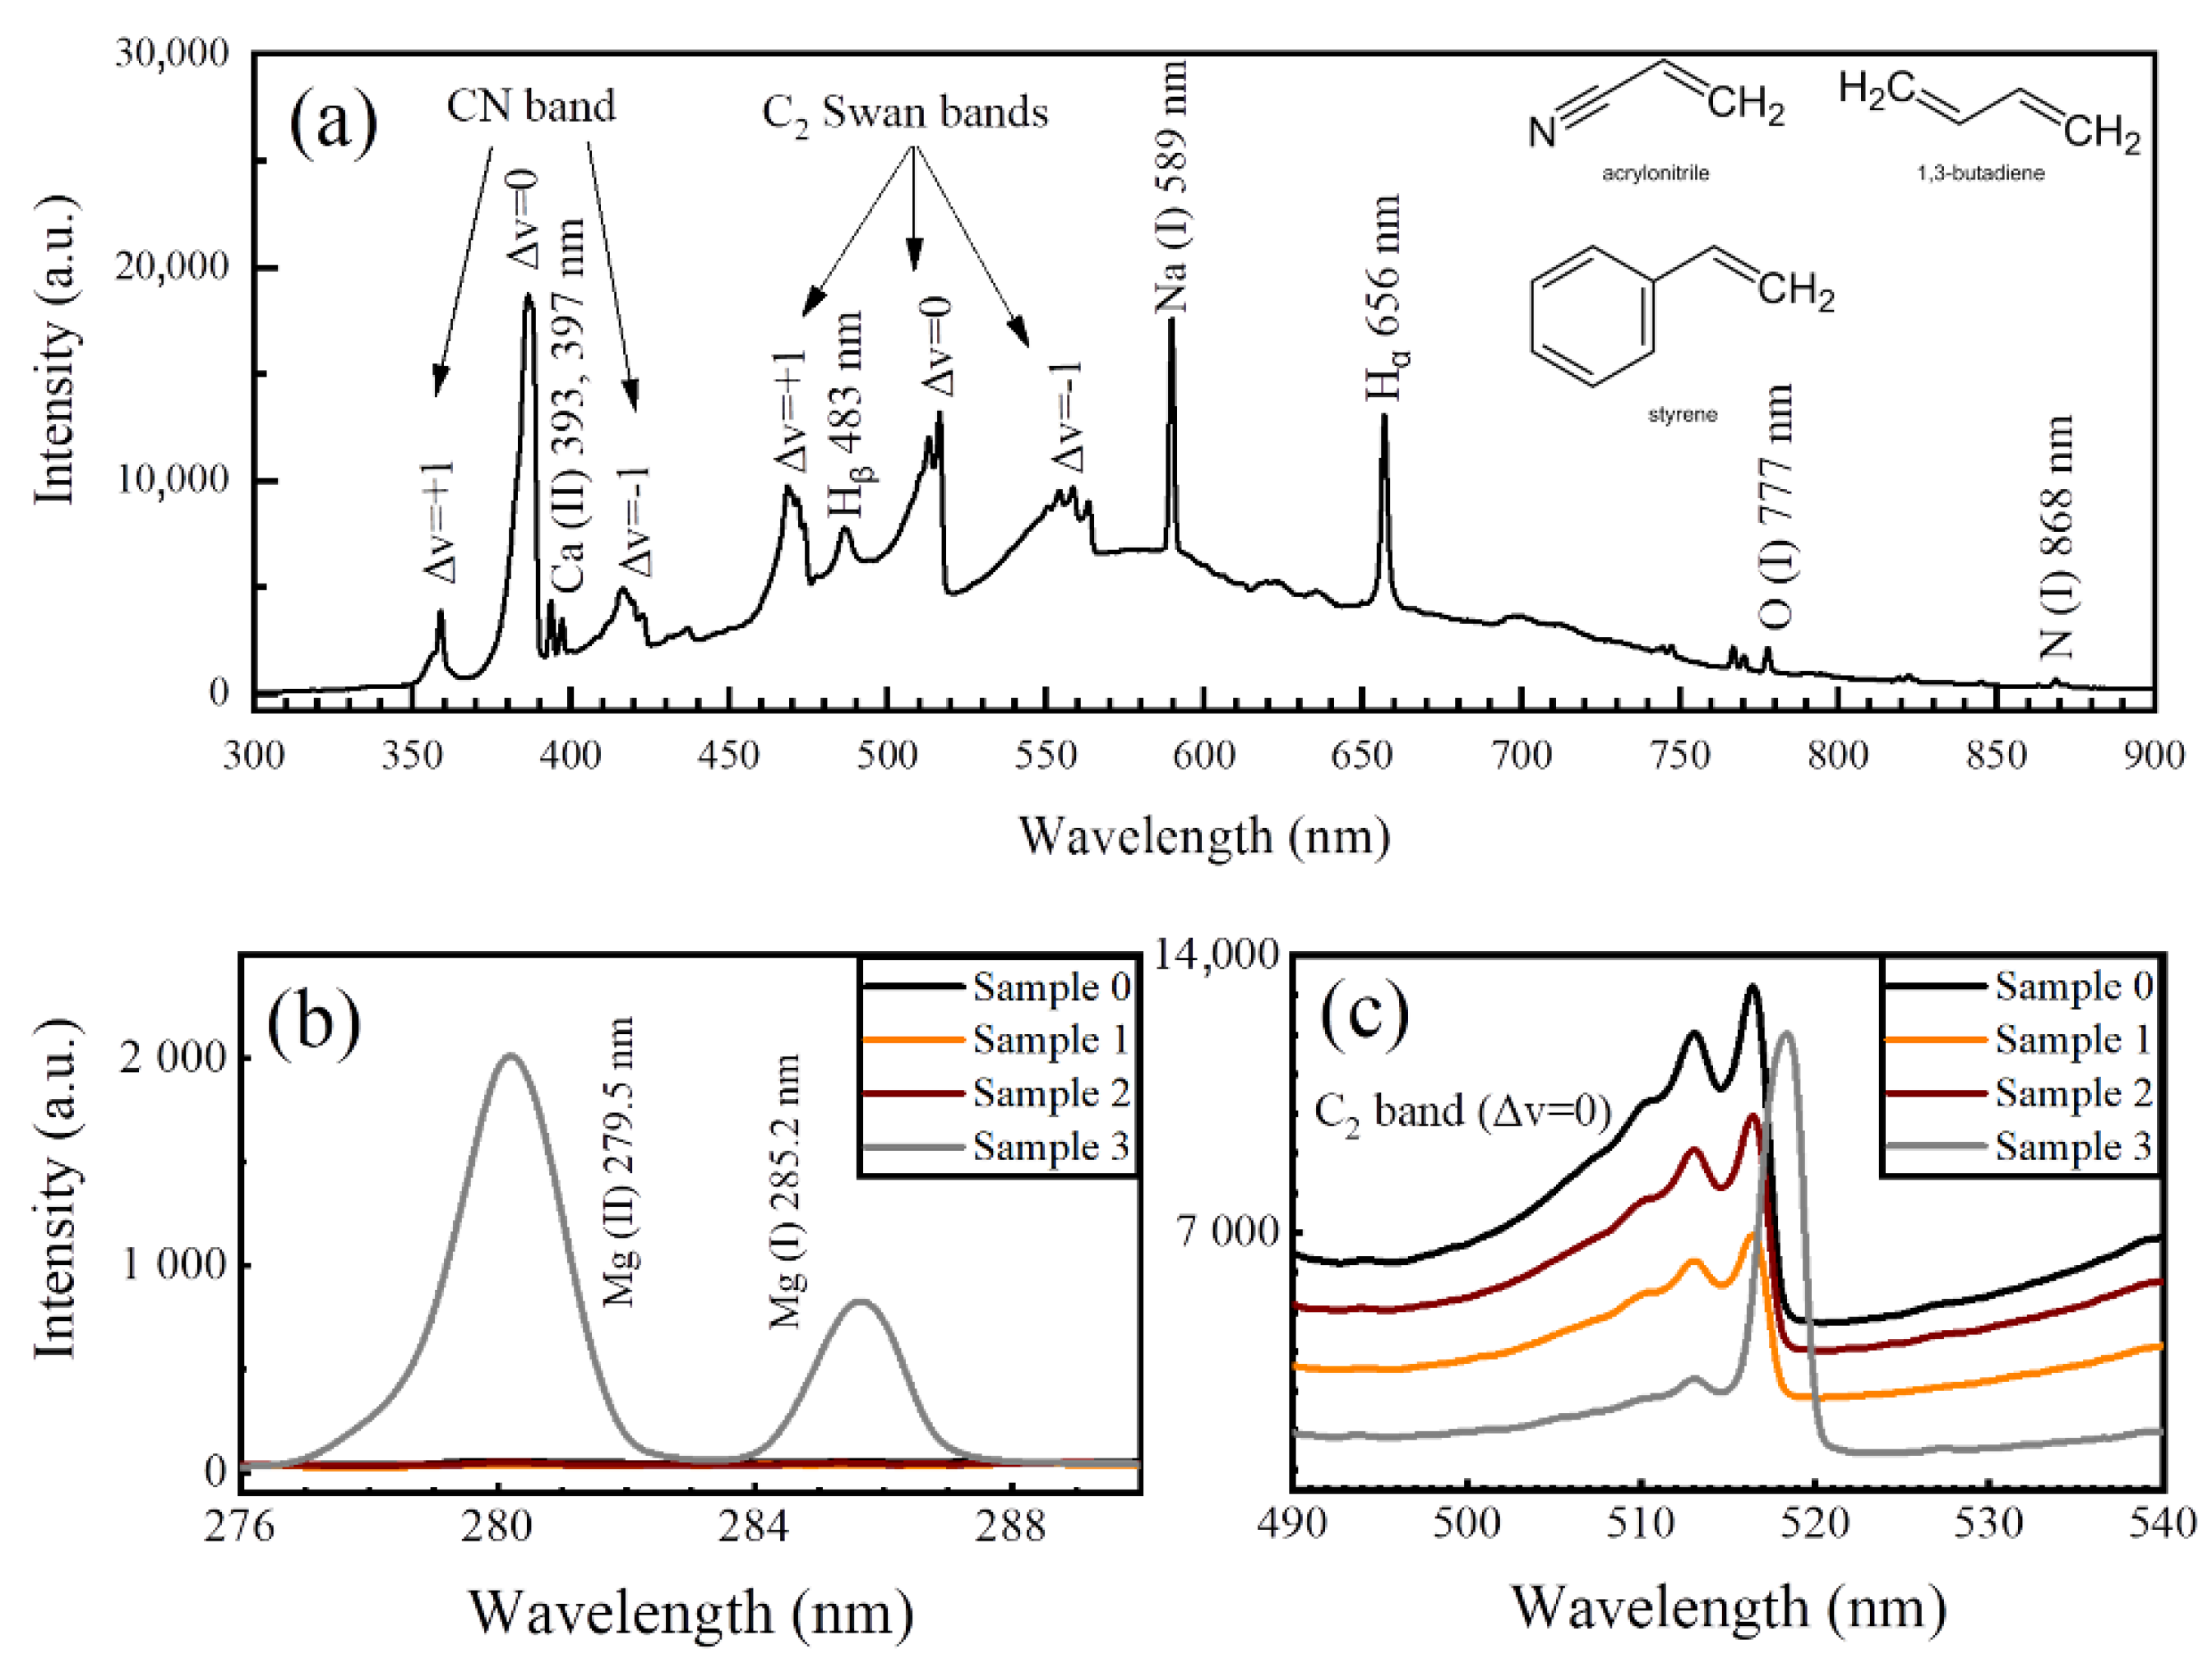
In Figure 3a some representative LIBS spectra are presented, obtained with the portable spectrograph. As can be seen, they were all found exhibiting a similar structure, despite the different types of additives they contain, due to their similar composition. Specifically, they were all found dominated by the molecular bands of C2 and CN, which had led us and other research groups to use these spectral features for qualitative and quantitative analysis for plastic/polymer sorting [32,33,34,35,36]. The molecular bands at about 360 nm, 388 nm and 422 nm are attributed to the vibrational sequences Δv = +1, Δv = 0 and Δv = −1, respectively, of the CN system [33,37,38]. The bands at about 470 nm, 516 nm and 559 nm are attributed to the vibrational sequences Δv = +1, Δv = 0 and Δv = −1, respectively, of the C2 Swan system [33,39]. The most important atomic emissions appearing in these LIBS spectra were the hydrogen’s Balmer series lines, with the Hα line, located at about 656 nm, being the most prominent. Some other atomic emissions which were also apparent in these spectra, and often observed in the LIBS spectra of organic matter, are some oxygen and nitrogen spectral lines located at about 777 nm and 868 nm respectively, arising from the de-excitation of oxygen and nitrogen atoms, resulting from the decomposition either of the corresponding molecules or of O- and N- bearing groups under the plasma conditions. In addition to the above spectral features, some calcium lines observed at about 393 and 397 nm, and the sodium spectral line at 589 nm, are attributed to the presence of Ca- and Na-containing compounds which are widely used in the manufacturing of plastics.
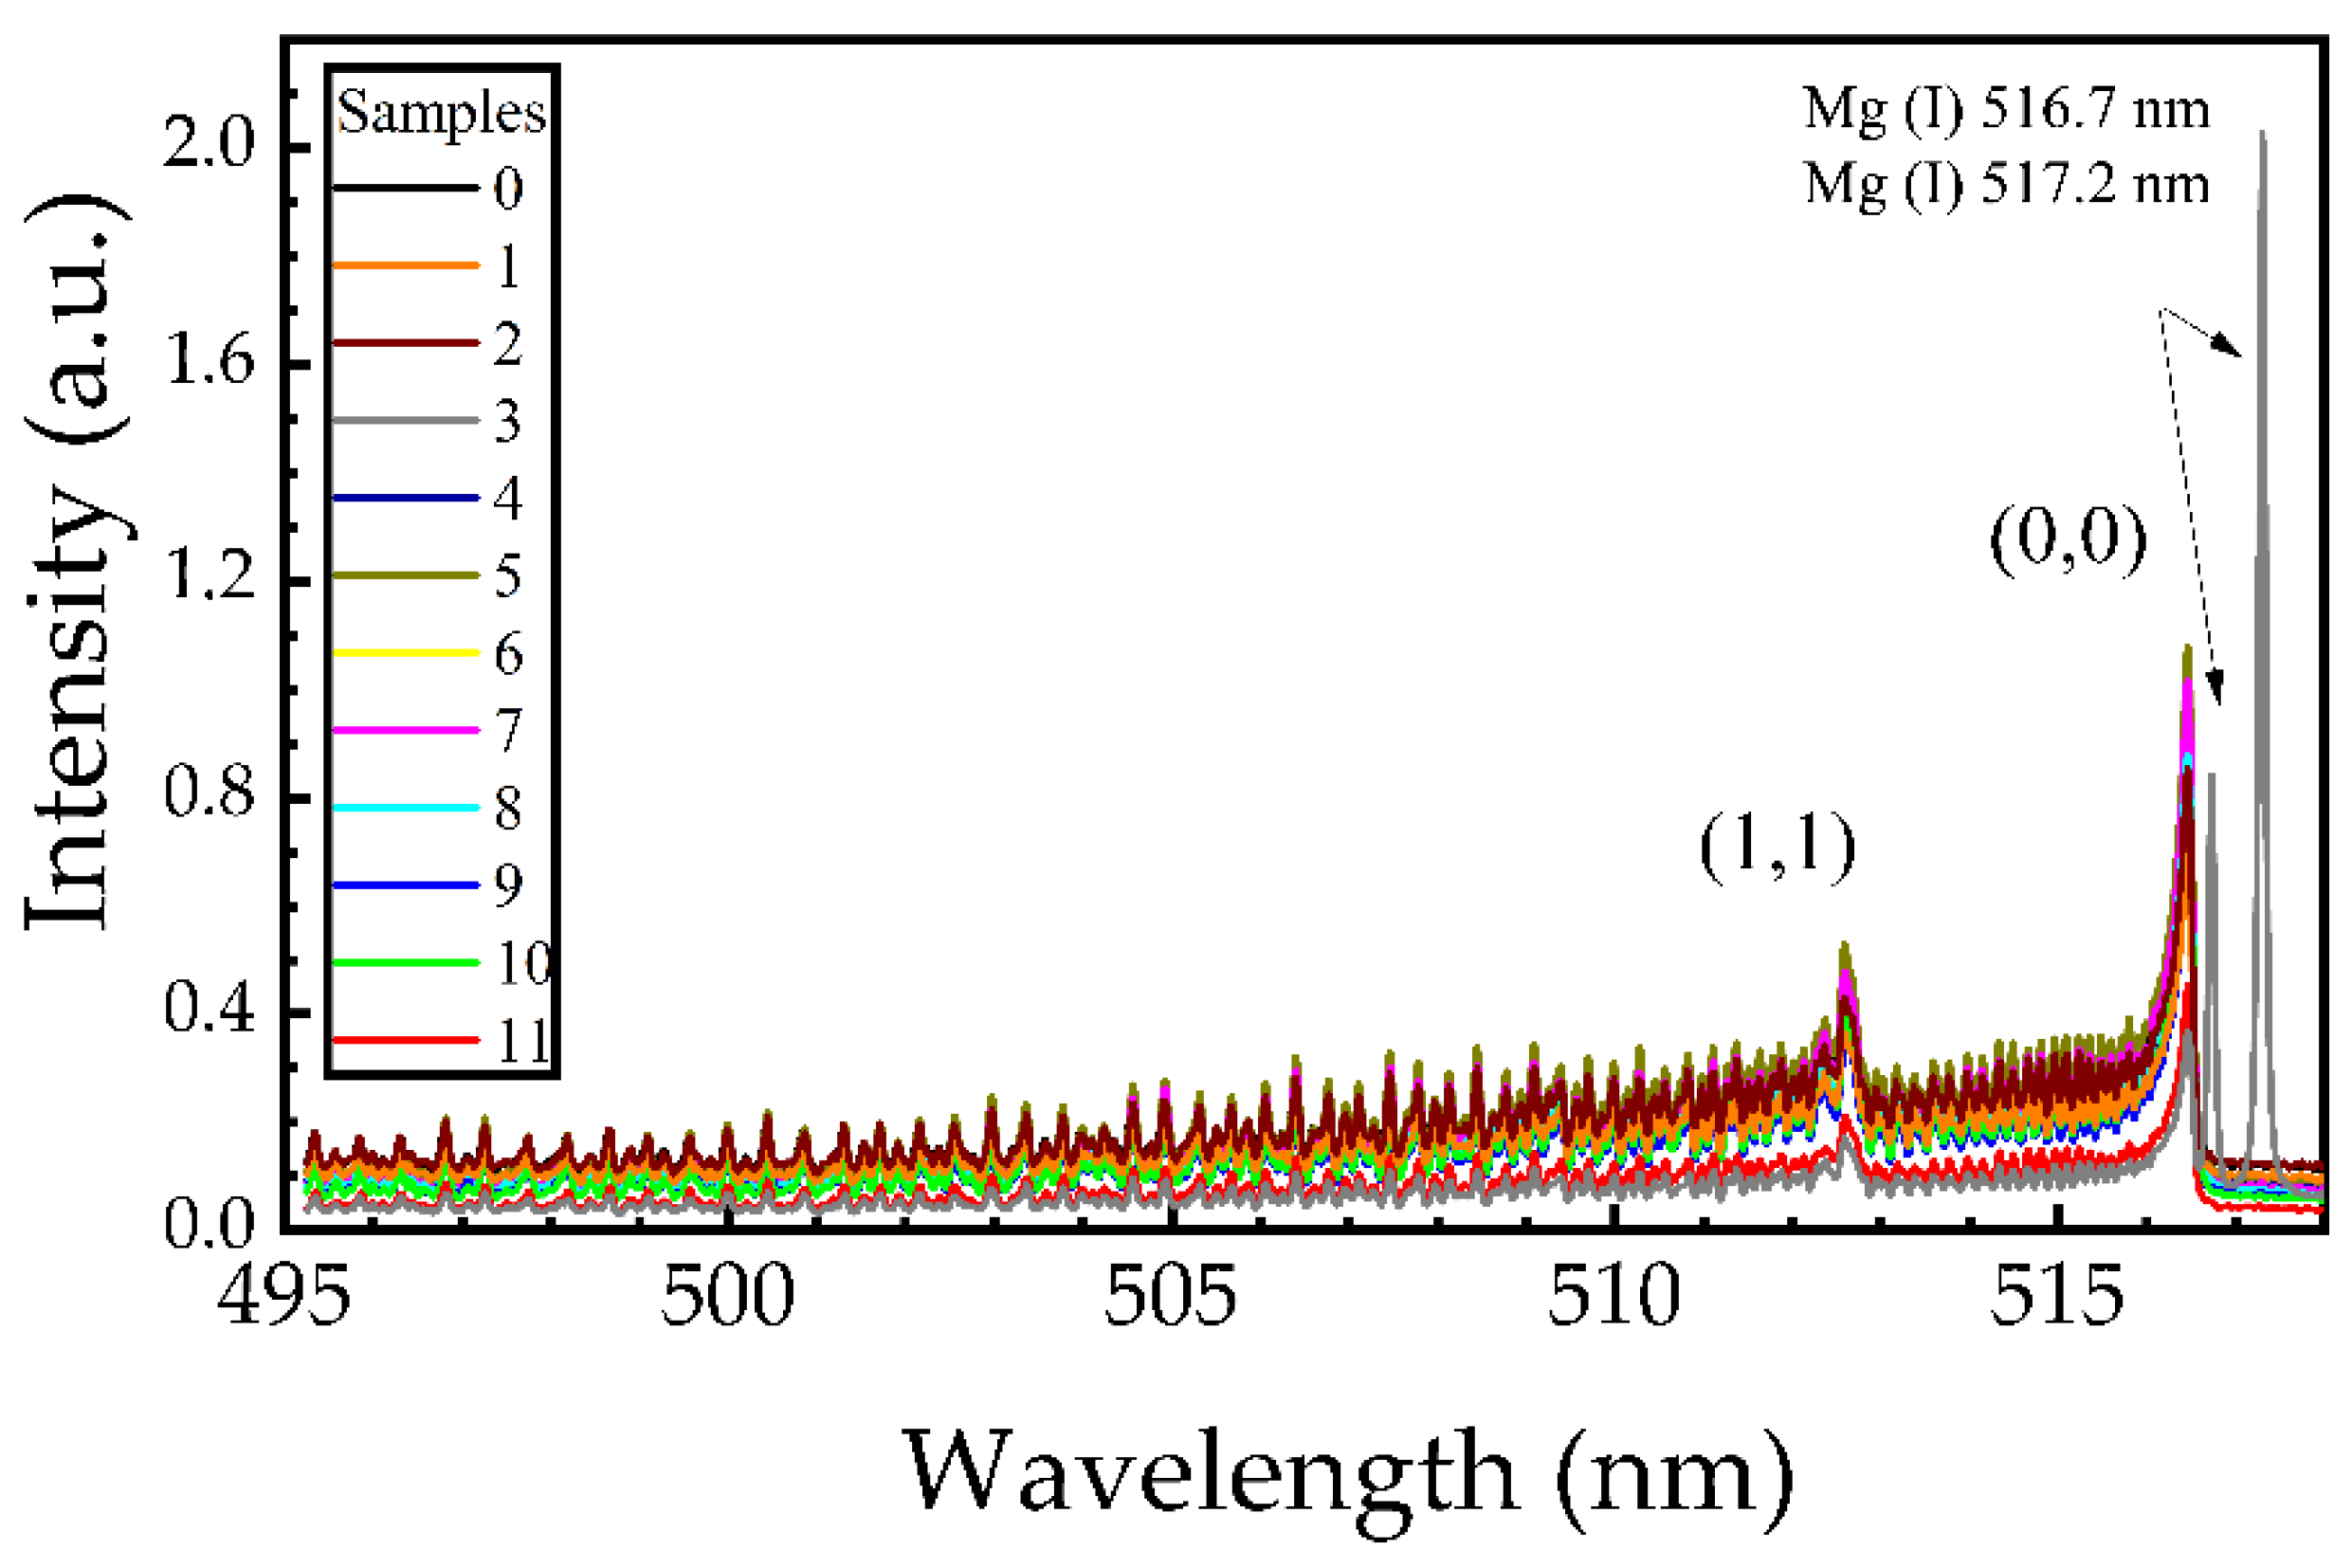
The addition of the different additives in the plastics’ matrix has certainly some effects on the LIBS spectra. So, the spectral lines of the atom(s) contained in the additives can appear in the spectra while changes on the spectral intensities of the different emission lines can occur as well. So, for instance, in Figure 3b the presence of Mg is signaled by the appearance of the 279.5 nm and 285.2 nm Mg spectral lines present in the spectra of sample 3 which contains Mg(OH)2. Also, the presence of Mg(OH)2 seems importantly to affect the C2 band emission profile as can be seen in Figure 3c where the presence of Mg of sample 3 seems to seriously perturb the C2 bands otherwise clearly observable in the other LIBS spectra. Actually, to further investigate this perturbation of the C2 band, higher resolution spectra of the spectral region extended from 495.3 to 518.8 nm were acquired with the monochromator. As shown in the spectra of Figure 4, the atomic lines of Mg at 517.2 and 518.3 nm, which lie very close to the C2 band, and for the case of sample 3 are overlapping with the latter, thus modifying the shape of the spectrum at this spectral region.
According to a recent investigation [40], the polymeric matrix and the additives behave as two independent systems with respect to the ablation laser pulse. This is because they present different absorption properties for the laser beam and because they are only weakly linked between them. In fact, the presence of additives introduces some additional absorptions for the laser light and, as a result, its penetration depth in the polymer matrix is decreased. However, this reduces the amount of ablated mass of the polymer matrix but does not change the mechanism of the ablation and, thus, the acquired spectra present different relative intensities of the spectral features.
3.2. Plastics Identification Using the Principal Component Analysis (PCA)
The spectra obtained from both the high-resolution monochromator and the portable spectrograph were separately treated using the Principal Component Analysis prior to any classification analysis. Following this approach, the spectra can be visualized in a more simplified form retaining most of their originally contained information.
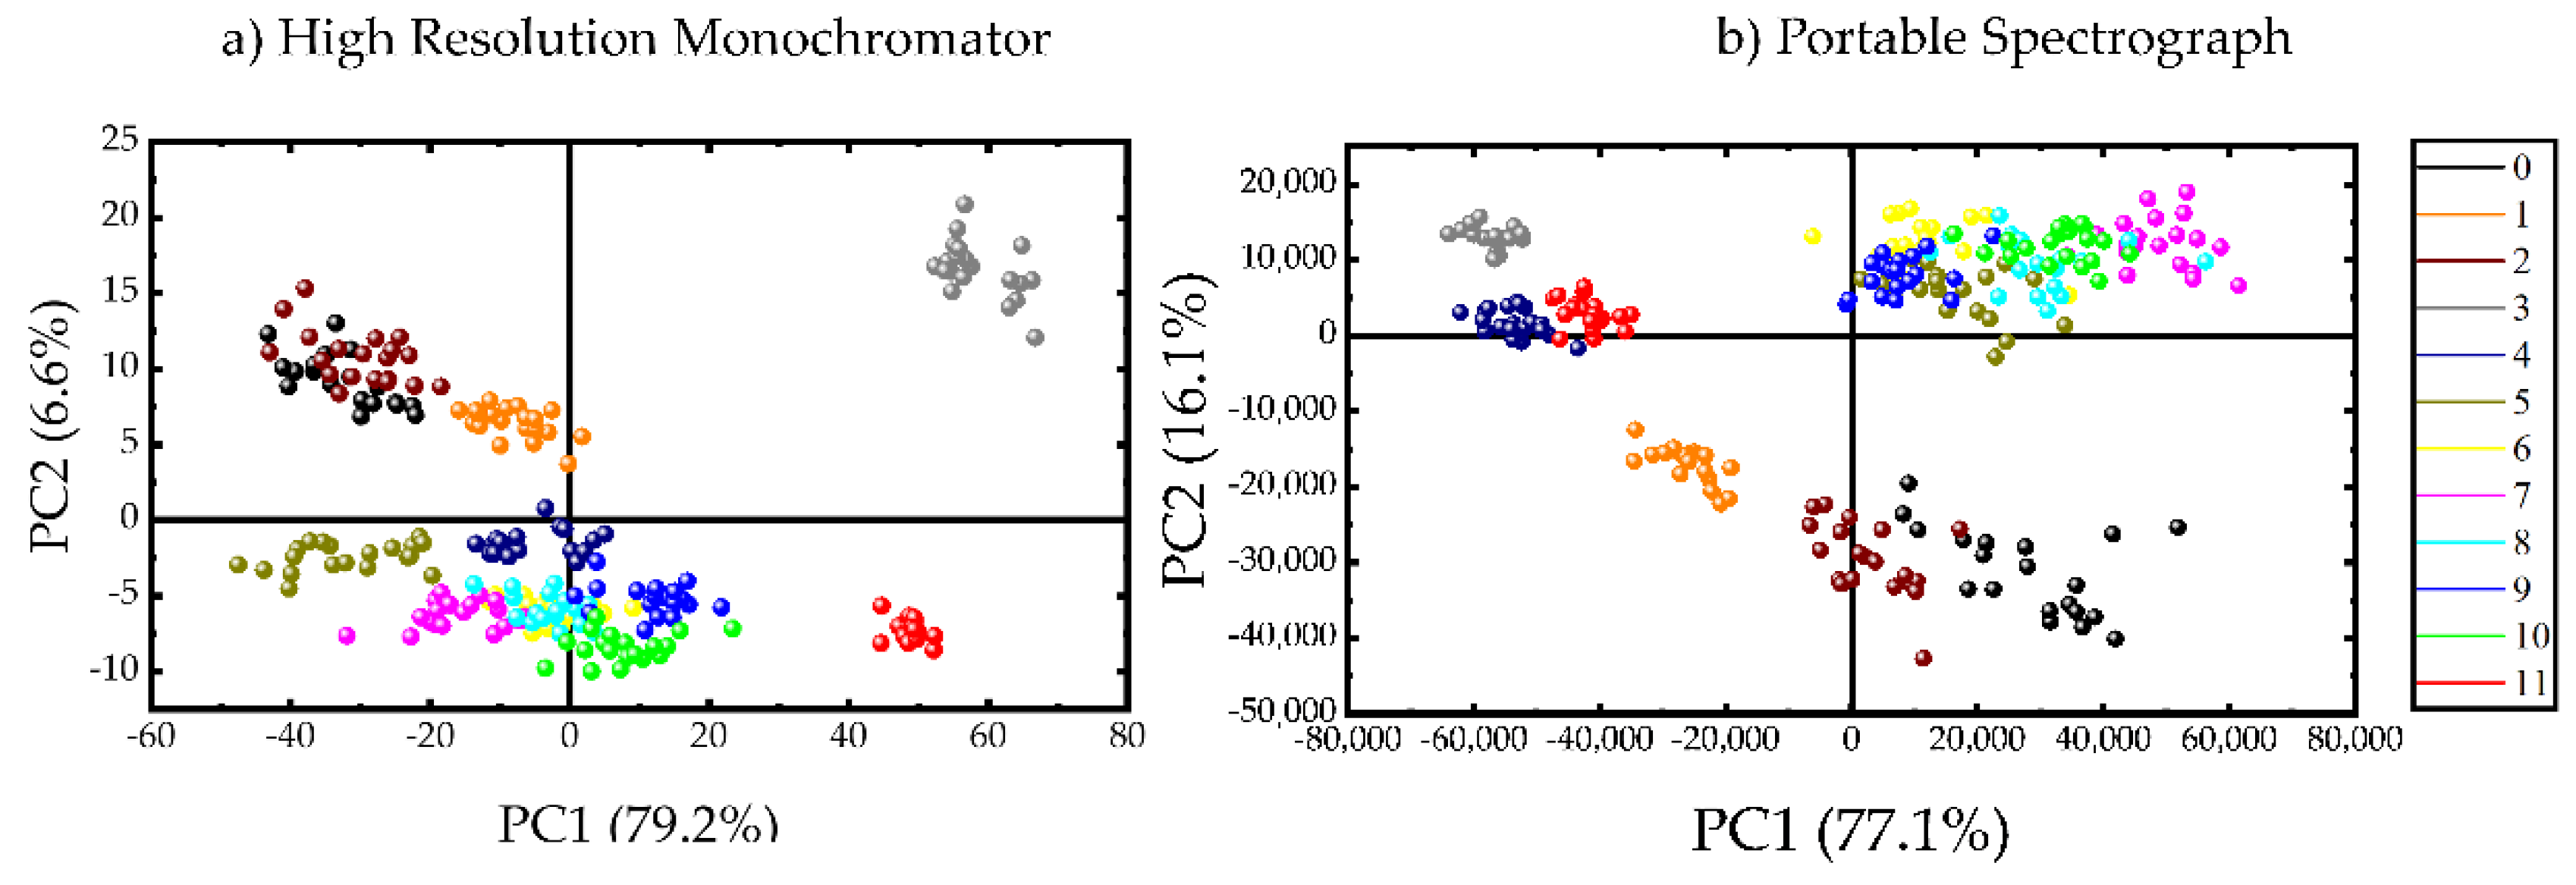
So, in the first case, the high-resolution spectra of the C2 Swan band system (Δv = 0) were used as inputs for the PCA algorithm. This choice was based on the results of several studies where this molecular emission is directly correlated with the polymeric structure of the samples [23,30,33,34]. The explained variance of the first two Principal Components (PCs) was found to be 85.8%. As can be seen in Figure 5a, the scores for sample 0 (matrix), and the non-brominated samples (e.g., samples 1, 2 and 3) are separated from the other samples. In particular, sample 3 (which contains the Mg(OH)2) is distinguished much better from the rest of the samples because of the Mg lines (see also Figure 4). However, the BFR samples are overlapping, as can be seen in the scores plot, constituting a cluster with negative PC2 values.
Next, the lower resolution spectra, ranging from 200 nm to 1100 nm, from the portable spectrograph were used as inputs for the PCA algorithm. In this case, the explained variance of the first two Principal Components (PCs) was 93.2%. The corresponding scores plot, shown in Figure 5b, indicates that again the samples 0, 1, 2 and 3 are well separated from the other samples, while BFR samples exhibit some overlapping in the scores plot, constituting a cluster at the upper right quarter, having positive PC2 values. Again, sample 3 (i.e., containing the Mg(OH)2) was found to be well separated from the others.
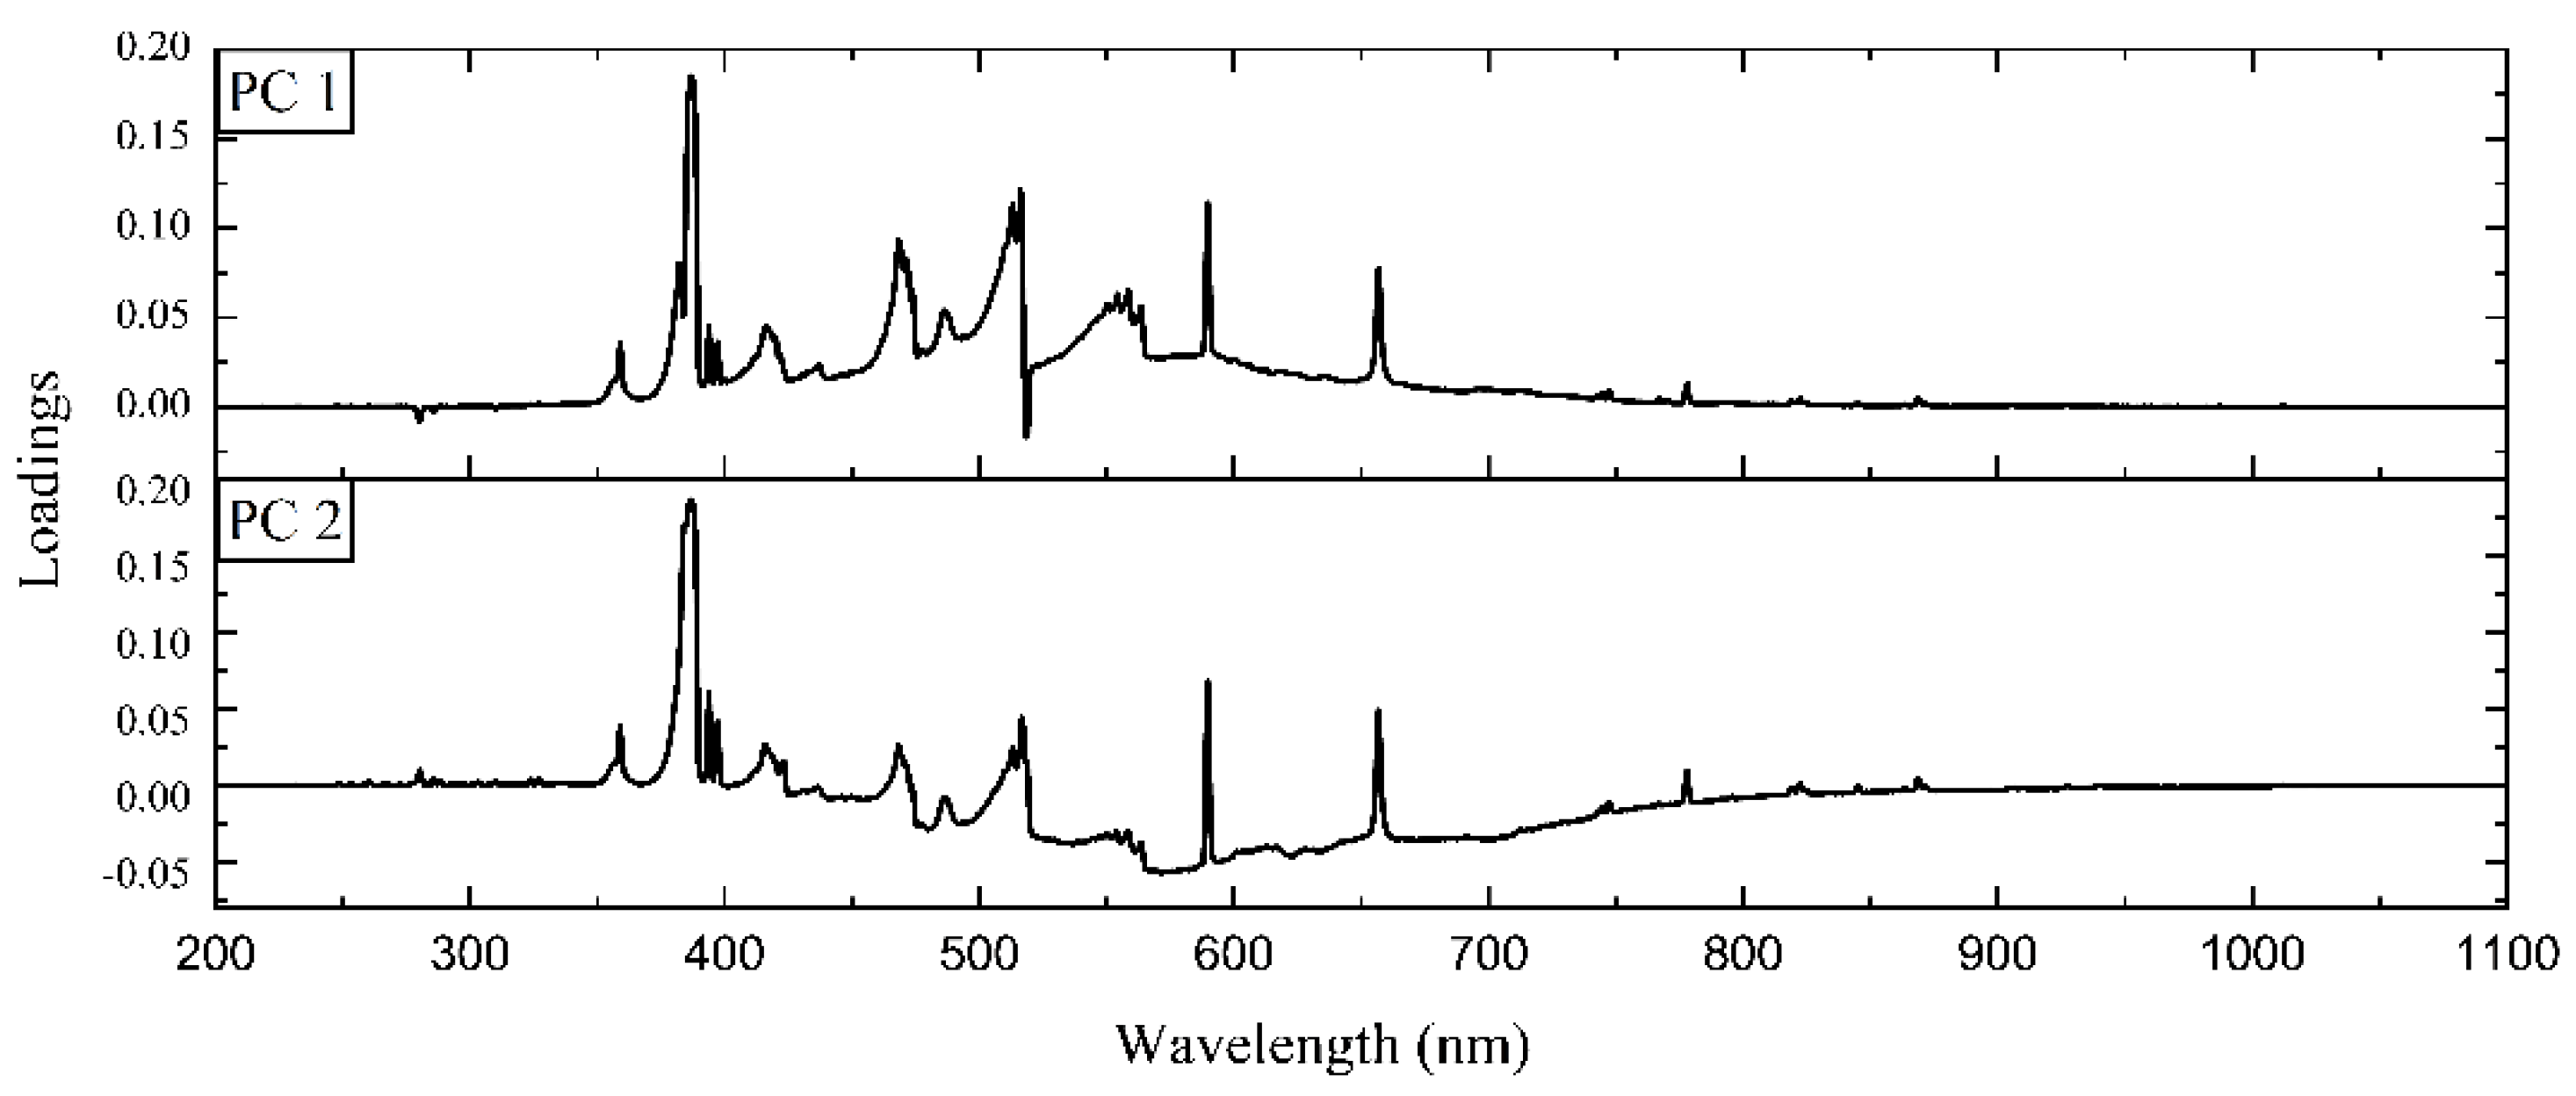
In Figure 6, the loadings plots for the first two PCs are presented. The PC1 loadings plot indicates that the overall spectral structure contributes to the identification of the plastic samples. Correspondingly, in the case of the PC2 loadings plot, the molecular and atomic emissions seem to counterbalance effectively the underlying spectral background. Thus, spectra with a higher background tend to separate from others.
3.3. Plastics Identification Using Linear Discriminant Analysis (LDA)
In this case, the obtained spectra from both the high-resolution monochromator and the portable spectrograph were separately used as inputs for the Linear Discriminant Analysis algorithm in order to classify the different samples. In that view, two LDA models were trained, one including every sample as an individual input and another one for discriminating between brominated and non-brominated samples. The first model was trained with 11 canonical variables and the second with 1 canonical variable. The corresponding accuracies were evaluated with the 10-fold Cross-Validation technique.
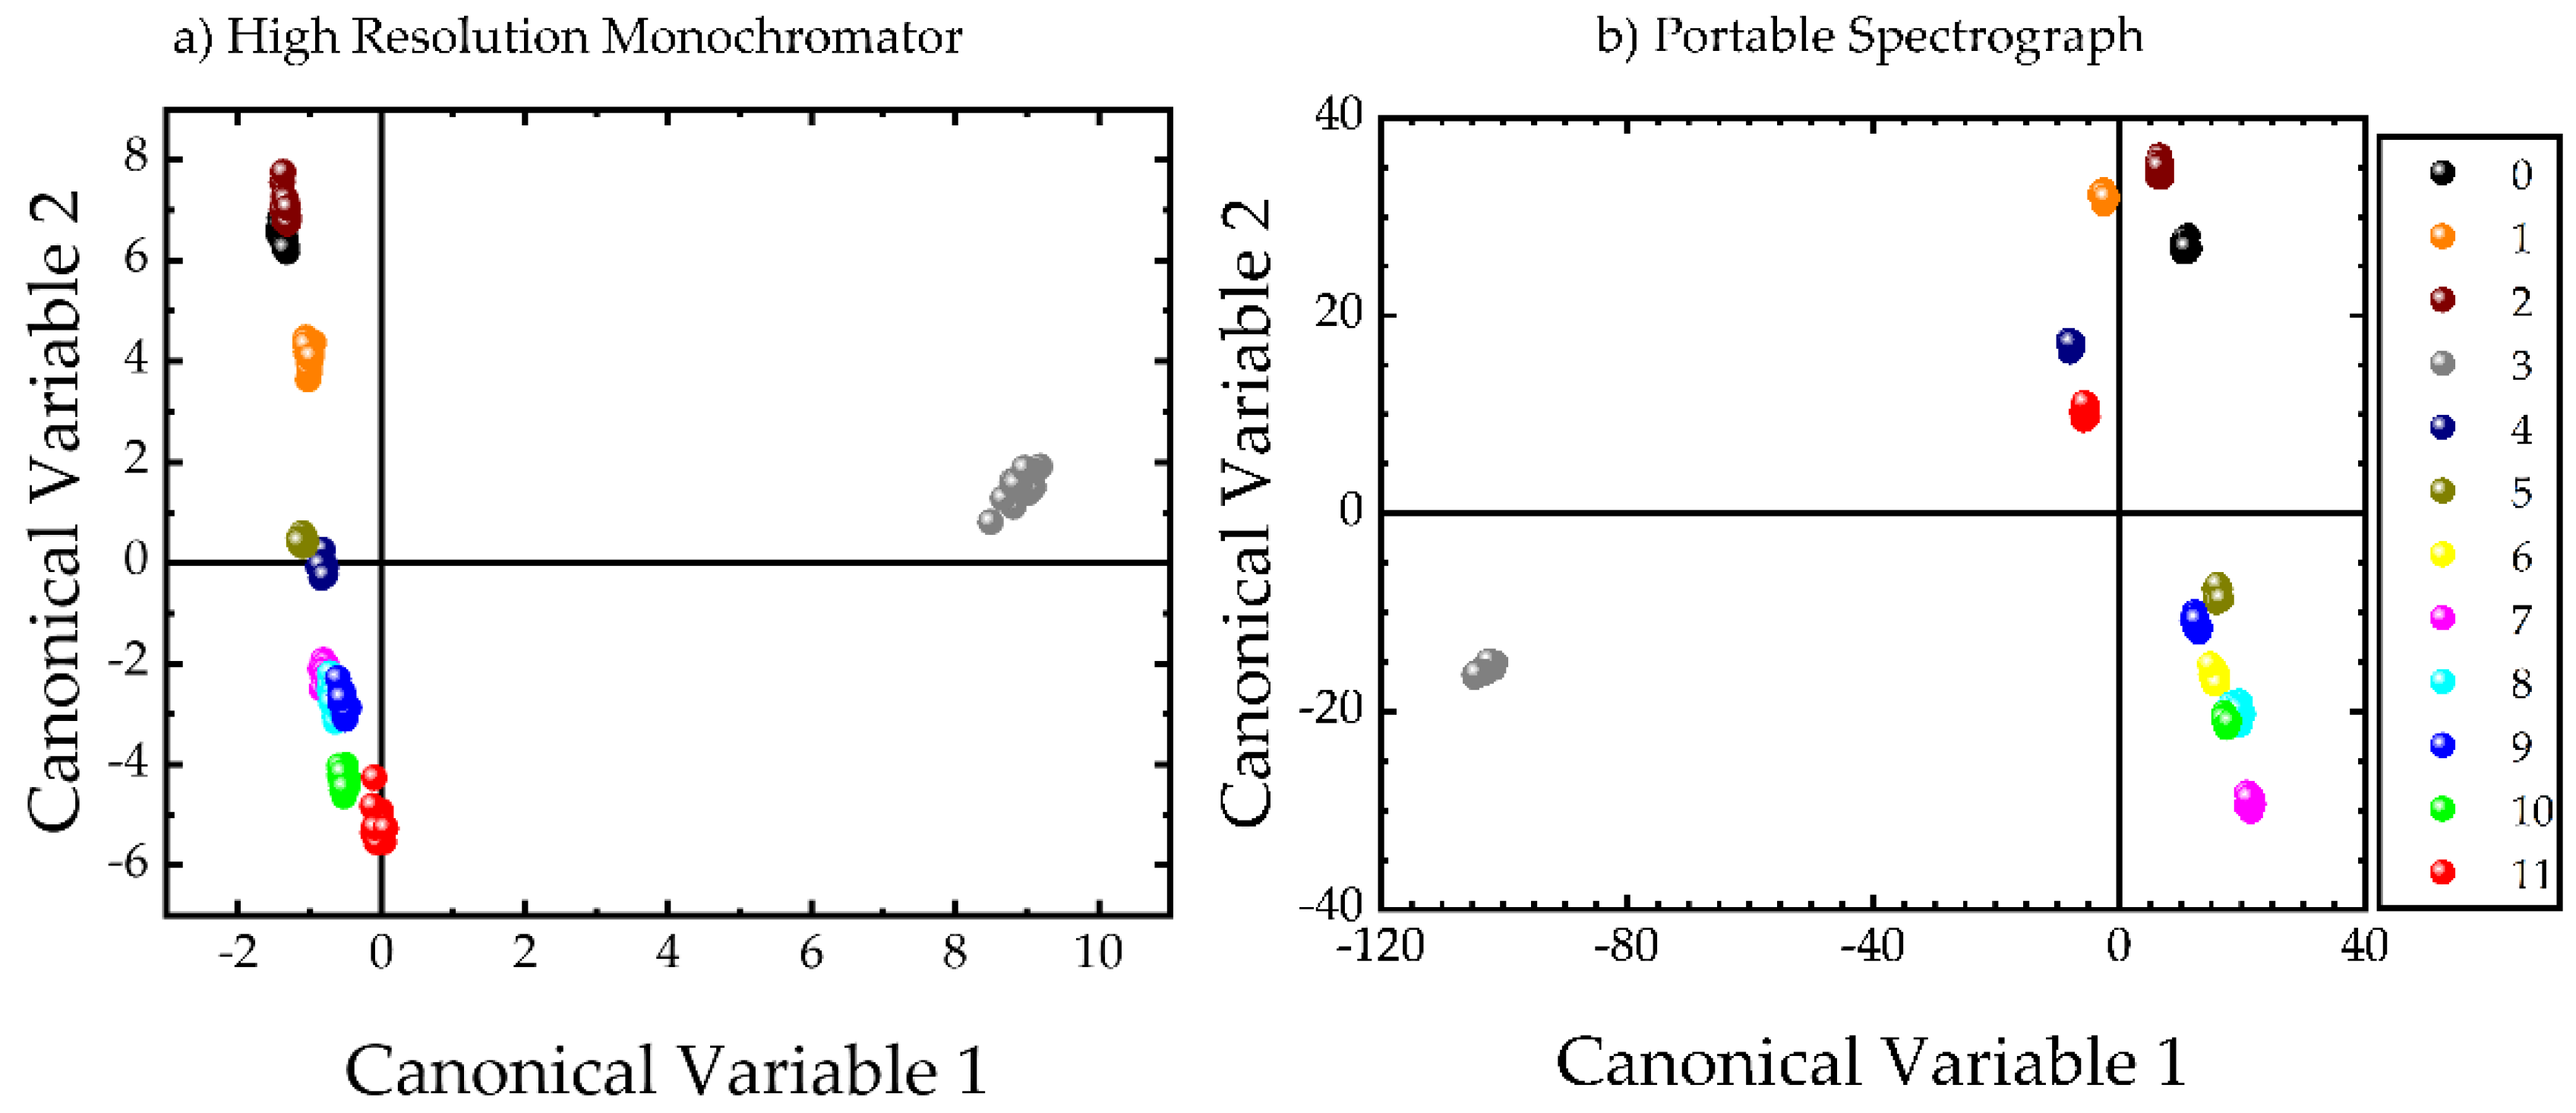
The obtained classification results are shown in Figure 7, where the graphs are scatter diagrams of all the samples. The axes of these graphs represent the scores of the first and second canonical variables. The classification results show that the distribution of each class is concentrated in a different region of the plot. So, in Figure 7a, all the bromine containing samples (i.e., samples 4–11), are well separated from the non-brominated ones. Similarly, in Figure 7b, presenting the classification results using the entire spectra of the sample, the brominated ones, from sample 5 to sample 10, are also well separated from the non-brominated ones. In addition, samples 4 and 11, containing 10% DBDPE and 12% brominated trimethylphenyl indane respectively, are separated from the others and are grouped together. In both cases, the Mg-containing sample 3 was found to be well separated from the other samples.
The obtained classification accuracies were determined to be as high as 100% for both models, denoting that efficiency of the LDA algorithm for classifying the plastics in terms of their different types of additives. As an example, a representative confusion matrix, which indicates the success of the prediction of the results, using the current algorithms is presented in Table 2. In order to construct the confusion matrix, a random number of spectra from each sample was chosen and used in order to evaluate the trained algorithm efficiency. The diagonal elements of the matrix are representing the correctly predicted spectra for each sample while the non-diagonal elements represent the false prediction. As shown in Table 2, all the spectra were predicted correctly.
Finally, an LDA model was constructed for binary classification between the brominated and the non-brominated samples. The employed model resulted in 100% accuracy of classification between brominated and non-brominated samples. The results are summarized in Table 3 in the form of a confusion matrix.
It becomes evident from the confusion matrices of the LDA model shown in Table 2 and Table 3 that 100% accuracies are obtained using the LDA algorithm for classification of the plastics based on their additives and their bromine content. It is important to be emphasized that LDA algorithm provided excellent discrimination results using the spectroscopic data either of the whole LIBS spectrum obtained using a (relatively low resolution) portable spectrograph or the high-resolution spectra of the C2 bands obtained using a high-resolution monochromator. This demonstrates in our opinion the power of such algorithmic approaches in efficiently handling and classifying LIBS spectroscopic data.
Similar LIBS studies which have appeared previously in the literature have used ratios of spectral lines [13] and calibration curves [15] in order to differentiate between different plastics. In more detail, in the former study, LIBS has been applied on some plastic/polymer samples, namely high- and low-density polyethylene (HDPE and LDPE), polyvinyl chloride (PVC), polyethylene terephthalate (PET), and polypropylene (PP). There the intensity ratio of the carbon C(I)-247.86 nm line versus the Hβ-486.13 nm line was used for discrimination purposes. Moreover, for the identification of the PVC based samples from the other polymeric matrices, the spectral line of Cl (I)-725.7 nm was used, since chlorine is present only in PVC polymers. In addition, some neural networks which have been employed for the identification of the different samples have obtained accuracies lying between 90% and 100%. However, each of these approaches suffers for some inconvenience. So, the ratios of the spectral lines depend strongly on the degree of plasma excitation while the efficiency of this classification criterion was found to be greatly affected by the presence of self-absorption, not always easily detected. Then, concerning the neural networks, they are more complicated in principle that the LDA algorithms, with their implementation being less straightforward, while they demand more sophisticated hardware for the training of the algorithms than that employed by the PCA and LDA algorithms used in the present work. For that reason, the Linear Discriminant Analysis technique, which is more versatile than neural networks, maintaining its efficiency, has been used here, attaining accuracies of the predictive models for identification purposes as high as 100%.
In the latter study [15], the on-line detection of heavy metals and brominated flame retardants has been attempted through the detection of the characteristic emission lines of the elements of interest (i.e., Br, Cd, Cr, Hg, Pb, and Sb) and the construction of calibration curves. However, the accuracy of such calibration curves is also greatly influenced by the different experimental conditions (as e.g., laser power density, self-absorption, etc.).
In contrast to the previous works, here, the entire LIBS spectra were used for identification issues, while the whole approach was based on pattern recognition of these spectra rather than seeking sensitive variations of spectral features which often suffer from fluctuations (e.g., due to laser energy fluctuations, overlapping with neighboring spectral features, color issues, etc.). The choice of the pattern recognition approach makes the model employed more stable and more efficient than the previous approaches.
From the above findings, it becomes evident that the implementation of the machine learning algorithms has greatly assisted LIBS technique to achieve successful discrimination between plastics containing different types of additives (as e.g., different fillers, flame retardants, etc.). In fact, the application of PCA and LDA algorithms on the LIBS spectroscopic data have made possible the extraction of valuable information regarding hidden differences and similarities between the samples which otherwise would not have been identified by the simple comparison of the LIBS spectra. The achievement of classification accuracies of the order of 100% by using, e.g., the LDA algorithm indicates the importance of the synergistic action between a laser based analytical technique and machine learning techniques.
4. Conclusions
In the present work, the application of LIBS technique combined with some well-established and widely used machine learning algorithms was shown to be an efficient tool for identification/discrimination of ABS based plastics/polymers containing different additives such as fillers, brominated-flame retardants, etc. The use of PCA and LDA algorithms has been proven to be highly efficient for the sorting of plastics, reaching accuracies of identification of 100% for the samples tested in this work. Further work is in progress using many more plastic samples of other types as well and employing also a variety of different machine learning techniques. The widening of the data samples is expected to allow further validation and extension of the above findings.
Author Contributions
D.S. performed the experiments. N.G. analyzed the data. E.B. assisted the data analysis. S.C. conceived the idea. D.S., N.G. and S.C. contributed to the writing of the article.
Funding
We acknowledge support from the project “HELLAS-CH” (MIS 5002735) in the frame of Synergistic Action “ELI—LASERLAB Europe, HiPER & IPERION-CH.gr”, which is implemented under the Action “Reinforcement of the Research and Innovation Infrastructure”, funded by the Operational Program “Competitiveness, Entrepreneurship and Innovation” (NSRF 2014-2020) and co-financed by Greece and the European Union (European Regional Development Fund).
Conflicts of Interest
The authors declare no conflict of interest.
References
- Lex Access to European Union law. Available online: https://eur-lex.europa.eu/eli/dec/1997/129/oj (accessed on 17 July 2019).
- Palagas, C.; Stavropoulos, P.; Couris, S.; Angelopoulos, G.N.; Kolm, I. Investigation of the Parameters Influencing the Accuracy of Rapid Steelmaking Slag Analysis with Laser-Induced Breakdown Spectroscopy. Steel Res. Int. 2007, 78, 693–703. [Google Scholar] [CrossRef]
- Noll, R.; Bette, H.; Brysch, A.; Kraushaar, M.; Mönch, I.; Peter, L.; Sturm, V. Laser-induced breakdown spectrometry—Applications for production control and quality assurance in the steel industry. Spectrochim. Acta Part B At. Spectrosc. 2001, 56, 637–649. [Google Scholar] [CrossRef]
- Hermann, J.; Lorusso, A.; Perrone, A.; Strafella, F.; Dutouquet, C.; Torralba, B. Simulation of emission spectra from nonuniform reactive laser-induced plasmas. Phys. Rev. E 2015, 92, 053103. [Google Scholar] [CrossRef] [PubMed]
- Couris, S.; Hatziapostolou, A.; Anglos, D.; Mavromanolakis, A.; Fotakis, C. Laser-induced breakdown spectroscopy (LIBS) Applications in environmental issues. In Proceedings of the ALT 96 International Symposium on Laser Methods for Biomedical Applications, Heraklion, Crete, Greece, 8 November 1996; Volume 2965. [Google Scholar]
- Gaudiuso, R.; Dell’Aglio, M.; Pascale, O.D.; Senesi, G.S.; Giacomo, A.D. Laser induced breakdown spectroscopy for elemental analysis in environmental, cultural heritage and space applications: A review of methods and results. Sensors 2010, 10, 7434–7468. [Google Scholar] [CrossRef] [PubMed]
- Stavropoulos, P.; Palagas, C.; Angelopoulos, G.; Papamantellos, D.; Couris, S. Calibration measurements in laser-induced breakdown spectroscopy using nanosecond and picosecond lasers. Spectrochim. Acta Part B At. Spectrosc. 2004, 59, 1885–1892. [Google Scholar] [CrossRef]
- Michalakou, A.; Stavropoulos, P.; Couris, S. Laser-induced breakdown spectroscopy in reactive flows of hydrocarbon-air mixtures. Appl. Phys. Lett. 2008, 92, 081501. [Google Scholar] [CrossRef]
- Kotzagianni, M.; Couris, S. Femtosecond laser induced breakdown for combustion diagnostics. Appl. Phys. Lett. 2012, 100, 264104. [Google Scholar] [CrossRef]
- Stavropoulos, P.; Michalakou, A.; Skevis, G.; Couris, S. Laser-induced breakdown spectroscopy as an analytical tool for equivalence ratio measurement in methane–air premixed flames. Spectrochim. Acta Part B At. Spectrosc. 2005, 60, 1092–1097. [Google Scholar] [CrossRef]
- Anglos, D.; Couris, S.; Fotakis, C. Laser diagnostics of painted artworks: Laser-induced breakdown spectroscopy in pigment identification. Appl. Spectrosc. 1997, 51, 1025–1030. [Google Scholar] [CrossRef]
- Ciupiński, Ł.; Fortuna-Zaleśna, E.; Garbacz, H.; Koss, A.; Kurzydłowski, K.; Marczak, J.; Mróz, J.; Onyszczuk, T.; Rycyk, A.; Sarzyński, A.; et al. Comparative laser spectroscopy diagnostics for ancient metallic artefacts exposed to environmental pollution. Sensors 2010, 10, 4926–4949. [Google Scholar] [CrossRef]
- Fotakis, C.; Anglos, D.; Couris, S.; Georgiou, S.; Zafiropulos, V.; Zergioti, I. Laser technology in art conservation. AIP Conf. Proc. 1997, 388, 183–190. [Google Scholar]
- Sattmann, R.; Mönch, I.; Krause, H.; Noll, R.; Couris, S.; Hatziapostolou, A.; Mavromanolakis, A.; Fotakis, C.; Larrauri, E.; Miguel, R. Laser-induced breakdown spectroscopy for polymer identification. Appl. Spectrosc. 1998, 52, 456–461. [Google Scholar] [CrossRef]
- Anzano, J.; Casanova, M.; Bermúdez, M.; Lasheras, R. Rapid characterization of plastics using laser-induced plasma spectroscopy (LIPS). Polym. Test. 2006, 25, 623–627. [Google Scholar] [CrossRef]
- Gondal, M.; Siddiqui, M. Identification of different kinds of plastics using laser-induced breakdown spectroscopy for waste management. J. Environ. Sci. Health Part A 2007, 42, 1989–1997. [Google Scholar] [CrossRef]
- Guo, Y.; Tang, Y.; Du, Y.; Tang, S.; Guo, L.; Li, X.; Lu, Y.; Zeng, X. Cluster analysis of polymers using laser-induced breakdown spectroscopy with K-means. Plasma Sci. Technol. 2018, 20, 065505. [Google Scholar] [CrossRef] [Green Version]
- Boueri, M.; Motto-Ros, V.; Lei, W.; Ma, Q.; Zheng, L.; Zeng, H.; Yu, J. Identification of polymer materials using laser-induced breakdown spectroscopy combined with Artificial Neural Networks. Appl. Spectrosc. 2011, 65, 307–314. [Google Scholar] [CrossRef]
- Lasheras, R.; Bello-Gálvez, C.; Anzano, J. Identification of polymers by libs using methods of correlation and normalized coordinates. Polym. Test. 2010, 29, 1057–1064. [Google Scholar] [CrossRef]
- Tang, Y.; Guo, Y.; Sun, Q.; Tang, S.; Li, J.; Guo, L.; Duan, J. Industrial polymers classification using laser-induced breakdown spectroscopy combined with self-organizing maps and K-means algorithm. Optik 2018, 165, 179–185. [Google Scholar] [CrossRef]
- Zhang, T.; Tang, H.; Li, H. Chemometrics in laser-induced breakdown spectroscopy. J. Chemom. 2018, 32, e2983. [Google Scholar] [CrossRef]
- Stepputat, M.; Noll, R. On-line detection of heavy metals and brominated flame retardants in technical polymers with laser-induced breakdown spectrometry. Appl. Optics 2003, 42, 6210. [Google Scholar] [CrossRef]
- Radivojevic, I.; Niessner, R.; Haisch, C.; Florek, S.; Becker-Ross, H.; Panne, U. Detection of bromine in thermoplasts from consumer electronics by laser-induced plasma spectroscopy. Spectrochim. Acta Part B At. Spectrosc. 2004, 59, 335–343. [Google Scholar] [CrossRef]
- Barbier, S.; Perrier, S.; Freyermuth, P.; Perrin, D.; Gallard, B.; Gilon, N. Plastic identification based on molecular and elemental information from laser induced breakdown spectra: A comparison of plasma conditions in view of efficient sorting. Spectrochim. Acta Part B At. Spectrosc. 2013, 88, 167–173. [Google Scholar] [CrossRef]
- Suplee, C. Atomic Spectra Database. Available online: https://www.nist.gov/pml/atomic-spectra-database (accessed on 17 July 2019).
- Asimellis, G.; Giannoudakos, A.; Kompitsas, M. Near-IR bromine laser induced breakdown spectroscopy detection and ambient gas effects on emission line asymmetric Stark broadening and shift. Spectrochim. Acta Part B At. Spectrosc. 2006, 61, 1270–1278. [Google Scholar] [CrossRef]
- Radziemski, L.; Cremers, D.A.; Benelli, K.; Khoo, C.; Harris, R.D. Use of the vacuum ultraviolet spectral region for laser-induced breakdown spectroscopy-based Martian geology and exploration. Spectrochim. Acta Part B At. Spectrosc. 2005, 60, 237–248. [Google Scholar] [CrossRef]
- Lex Access to European Union law. Available online: https://eur-lex.europa.eu/legal-content/EN/TXT/?uri=CELEX:32011L0065 (accessed on 17 July 2019).
- Lex Access to European Union law. Available online: http://data.europa.eu/eli/dir/2012/19/oj (accessed on 17 July 2019).
- Acquaviva, S.; Giorgi, M.D. Temporal and spatial analysis of plasmas during graphite laser ablation in low-pressure N2. Appl. Surf. Sci. 2002, 197–198, 21–26. [Google Scholar] [CrossRef]
- Pedregosa, F.; Varoquaux, G.; Gramfort, A.; Michel, V.; Thirion, B.; Grisel, O.; Blondel, M.; Müller, A.; Nothman, J.; Louppe, G.; et al. Scikit-learn: Machine Learning in Python. ArXiv, 2019; arXiv:1201.0490. Available online: https://arxiv.org/abs/1201.0490(accessed on 17 July 2019).
- Trautner, S.; Jasik, J.; Parigger, C.G.; Pedarnig, J.D.; Spendelhofer, W.; Lackner, J.; Veis, P.; Heitz, J. Laser-induced optical breakdown spectroscopy of polymer materials based on evaluation of molecular emission bands. Spectrochim. Acta Part B At. Spectrosc. 2017, 174, 331–338. [Google Scholar] [CrossRef]
- Mousavi, S.J.; Farsani, M.H.; Darbani, S.M.R.; Mousaviazar, A.; Soltanolkotabi, M.; Majd, A.E. CN and C2 vibrational spectra analysis in molecular LIBS of organic materials. Appl. Phys. B 2016, 122, 106. [Google Scholar] [CrossRef]
- Noll, R. Bulk analysis of nonconducting materials. In Laser-Induced Breakdown Spectroscopy; Springer: Berlin/Heidelberg, Germany, 2012; pp. 275–386. [Google Scholar]
- Grégoire, S.; Boudinet, M.; Pelascini, F.; Surma, F.; Detalle, V.; Holl, Y. Laser-induced breakdown spectroscopy for polymer identification. Anal. Bioanal. Chem. 2011, 400, 3331–3340. [Google Scholar] [CrossRef]
- De Giacomo, A.; Hermann, J. Laser-induced plasma emission: From atomic to molecular spectra. J. Phys. D Appl. Phys. 2017, 50, 183002. [Google Scholar] [CrossRef]
- Fernández-Bravo, Á.; Delgado, T.; Lucena, P.; Laserna, J.J. Vibrational emission analysis of the CN molecules in laser-induced breakdown spectroscopy of organic compounds. Spectrochim. Acta Part B At. Spectrosc. 2013, 89, 77–83. [Google Scholar] [CrossRef]
- Aldea, E.; Caricato, A.P.; Dinescu, G.; Luches, A.; Perrone, A. Optical emission diagnostic of laser-induced plasma during CNX film deposition. Japanese J. Appl. Phys. 1997, 36, 4686–4689. [Google Scholar] [CrossRef]
- Witte, M.J.; Parigger, C.G. Laser-induced spectroscopy of graphene ablation in air. J. Phys. Conf. Ser. 2014, 548, 012052. [Google Scholar] [CrossRef]
- Negre, E.; Motto-Ros, V.; Pelascini, F.; Yu, J. Classification of plastic materials by imaging laser-induced ablation plumes. Spectrochim. Acta Part B At. Spectrosc. 2016, 122, 132–141. [Google Scholar] [CrossRef]
Figure 1.
Laser-Induced Breakdown Spectroscopy (LIBS) experimental setup.

Figure 2.
Brominated compounds contained in the Acrylonitrile Butadiene Styrene (ABS) samples.

Figure 3.
(a) LIBS spectrum of the matrix (i.e., sample 0). (b) Mg spectral lines of the sample 3, containing Mg(OH)2. (c) Interference of the Mg spectral lines with the C2 band emission.
Figure 3.
(a) LIBS spectrum of the matrix (i.e., sample 0). (b) Mg spectral lines of the sample 3, containing Mg(OH)2. (c) Interference of the Mg spectral lines with the C2 band emission.

Figure 4.
C2 Swan band (Δv = 0) spectra of the polymers.

Figure 5.
Scores plots of the spectra obtained from (a) the high-resolution monochromator and (b) the portable spectrograph.
Figure 5.
Scores plots of the spectra obtained from (a) the high-resolution monochromator and (b) the portable spectrograph.

Figure 6.
Loadings plots for the first two Principal Components (PCs).

Figure 7.
Canonical Variable plots obtained from the Linear Discriminant Analysis (LDA) model for the spectra obtained from (a) the high-resolution monochromator and (b) the portable spectrograph.
Figure 7.
Canonical Variable plots obtained from the Linear Discriminant Analysis (LDA) model for the spectra obtained from (a) the high-resolution monochromator and (b) the portable spectrograph.


Table 1.
Studied samples along with their code names.
| Code | Contents |
|---|---|
| 0 | Matrix |
| 1 | 2% Barite |
| 2 | 2% Silica |
| 3 | 25% Mg(OH)2 |
| 4 | 10% DBDPE |
| 5 | 20% DBDPE |
| 6 | 10% Oligomeric Epoxy with TBBPA |
| 7 | 20% Oligomeric Epoxy with TBBPA |
| 8 | 10% TBBPA |
| 9 | 20% TBBPA |
| 10 | 5% HBCD |
| 11 | 12% Brominated Trimethylphenyl Indane |
Table 2.
Confusion matrix of the LDA model for all the samples.
| Predicted Class | |||||||||||||
|---|---|---|---|---|---|---|---|---|---|---|---|---|---|
| 0 | 1 | 2 | 3 | 4 | 5 | 6 | 7 | 8 | 9 | 10 | 11 | ||
| Actual Class | 0 | 9 | 0 | 0 | 0 | 0 | 0 | 0 | 0 | 0 | 0 | 0 | 0 |
| 1 | 0 | 8 | 0 | 0 | 0 | 0 | 0 | 0 | 0 | 0 | 0 | 0 | |
| 2 | 0 | 0 | 4 | 0 | 0 | 0 | 0 | 0 | 0 | 0 | 0 | 0 | |
| 3 | 0 | 0 | 0 | 5 | 0 | 0 | 0 | 0 | 0 | 0 | 0 | 0 | |
| 4 | 0 | 0 | 0 | 0 | 6 | 0 | 0 | 0 | 0 | 0 | 0 | 0 | |
| 5 | 0 | 0 | 0 | 0 | 0 | 4 | 0 | 0 | 0 | 0 | 0 | 0 | |
| 6 | 0 | 0 | 0 | 0 | 0 | 0 | 5 | 0 | 0 | 0 | 0 | 0 | |
| 7 | 0 | 0 | 0 | 0 | 0 | 0 | 0 | 5 | 0 | 0 | 0 | 0 | |
| 8 | 0 | 0 | 0 | 0 | 0 | 0 | 0 | 0 | 8 | 0 | 0 | 0 | |
| 9 | 0 | 0 | 0 | 0 | 0 | 0 | 0 | 0 | 0 | 6 | 0 | 0 | |
| 10 | 0 | 0 | 0 | 0 | 0 | 0 | 0 | 0 | 0 | 0 | 6 | 0 | |
| 11 | 0 | 0 | 0 | 0 | 0 | 0 | 0 | 0 | 0 | 0 | 0 | 6 | |
Table 3.
Confusion matrix of the LDA model for the brominated and non-brominated samples.
| Predicted Class | |||
|---|---|---|---|
| Non-Brominated | Brominated | ||
| Actual Class | Non-Brominated | 26 | 0 |
| Brominated | 0 | 46 | |
© 2019 by the authors. Licensee MDPI, Basel, Switzerland. This article is an open access article distributed under the terms and conditions of the Creative Commons Attribution (CC BY) license (http://creativecommons.org/licenses/by/4.0/).
Share and Cite
MDPI and ACS Style
Stefas, D.; Gyftokostas, N.; Bellou, E.; Couris, S. Laser-Induced Breakdown Spectroscopy Assisted by Machine Learning for Plastics/Polymers Identification. Atoms 2019, 7, 79. https://0-doi-org.brum.beds.ac.uk/10.3390/atoms7030079
AMA Style
Stefas D, Gyftokostas N, Bellou E, Couris S. Laser-Induced Breakdown Spectroscopy Assisted by Machine Learning for Plastics/Polymers Identification. Atoms. 2019; 7(3):79. https://0-doi-org.brum.beds.ac.uk/10.3390/atoms7030079
Chicago/Turabian StyleStefas, Dimitrios, Nikolaos Gyftokostas, Elli Bellou, and Stelios Couris. 2019. "Laser-Induced Breakdown Spectroscopy Assisted by Machine Learning for Plastics/Polymers Identification" Atoms 7, no. 3: 79. https://0-doi-org.brum.beds.ac.uk/10.3390/atoms7030079
Note that from the first issue of 2016, this journal uses article numbers instead of page numbers. See further details here.