Article

Resonant Charge-Transfer in Grazing Collisions of H with Vicinal Nanosurfaces on Cu(111), Au(100) and Pd(111) Substrates: A Comparative Study

by
John Shaw
1,*,†,
David Monismith
2,†,
Yixiao Zhang
1,†,‡,
Danielle Doerr
1,† and
Himadri S. Chakraborty
1,†
1
Department of Natural Sciences, D.L. Hubbard Center for Innovation, Northwest Missouri State University, Maryville, MO 64468, USA
2
76th Software Engineering Group, Tinker AFB, OK 73145, USA
*
Author to whom correspondence should be addressed.
These authors contributed equally to this work.
Current address: School of Electrical and Computer Engineering, Cornell University, New York, NY, USA.
Submission received: 17 July 2019 / Revised: 3 September 2019 / Accepted: 3 September 2019 / Published: 9 September 2019
(This article belongs to the Section Atomic, Molecular and Nuclear Spectroscopy and Collisions)

Abstract

:
We compare the electron dynamics at monocrystalline Cu(111), Au(100) and Pd(111) precursor substrates with vicinal nanosteps. The unoccupied bands of a surface superlattice are populated via the resonant charge transfer (RCT) between the surface and a H ion that flies by at grazing angles. A quantum mechanical wave packet propagation approach is used to simulate the motion of the active electron, and time-evolved wave packet densities are used to visualize the dynamics through the superlattice. The survived ion fraction in the reflected beam generally exhibits modulations as a function of the vicinal terrace size and shows peaks at those energies that access the image state subband dispersions. Differences in magnitudes of the ion-survival as a function of the particular substrate selection and the ion-surface interaction time, based on the choice of two ion-trajectories, are examined. A square well model, producing standing waves between the steps on the surface, explains the energies of the maxima in the ion survival probability for all the metals considered. This indicates that the primary process of confinement induced subband formation is robust. The work may motivate measurements and applications of shallow-angle ion-scattering spectroscopy to access electronic substructures in periodically nanostructured surfaces.

1. Introduction

Vicinal surfaces are the simplest prototypes of lateral nanostructures. They are thought to closely mimic rough regions of industrial surfaces. A vicinal surface is obtained by cutting a monocrystalline surface along a direction that somewhat deviates from a major crystallographic axis. These repeated “miscuts”, followed by subsequent recoveries, form regular and uniform arrays of linear steps that can be polished by suitable ultra-high vacuum methods. Such high Miller index surfaces can be critical for their catalytic properties, especially if the lattice periodicity is retained [1]. The electronic motions in these surfaces are of particular fascination because the scattering of electrons at step edges may induce confinements that result in subband dispersions. Vicinal steps provide nano-pockets to nucleate low-dimensional structure, and the inclination angle can tune structure-substrate coupling. This is important in controlling their chemical properties [2]. Additionally, photoelectron spectroscopy measured Ag nanostripes on step edges of the Cu vicinal to induce surface state splitting into bimetallic subbands from step-scattering and size quantization [3]. Therefore, to better understand the dynamics and transport phenomena in such functionalized and designed vicinals, knowledge of electron dispersions of the naked vicinal is important.
Due to superlattice effects, the vicinal nano-stepping should modify the electronic dispersions of the surface and image states of the metal. This has been observed experimentally for Cu and Au vicinal surfaces using scanning electron microscopy in the real space [4,5,6] and, in momentum space, using angle-resolved photoemission [7,8,9]. For the (332) and (221) vicinal surfaces of Cu, ultraviolet photoelectron spectroscopy indicates that the Shockley surface states are two-dimensional [10,11]. Investigating the image states of a metal surface can be a powerful probe of physical and chemical properties on the nanometer scale. For instance, theoretical modeling predicts that confinement and superlattice effects can cause splitting of the image-bands and anticrossings from lateral back scatterings at the step edges [12]. It is therefore necessary to employ theoretical methods that simulate the band structure processes of modified surfaces in order to gain insight into the electronic properties of these nano-materials. One simple and computationally tractable method to accomplish this is by simulating the motion of the electrons transferred from a scattered negative ion, as accomplished in our recent publication [13]. These results may likely be probed experimentally and used as a guide for future theoretical studies.
When an ion transfers charge to a surface, the dynamics of this charge transfer is highly sensitive to the electronic band structure of the surface. This process in ion-surface interaction is valuable to understand because it directly affects the dynamics in processes of scattering, sputtering, adsorption, and molecular dissociation [14]. From the applied interests, this mechanism is an important middle step in analyzing, characterizing and manipulating surfaces [15]. It is also important in the miniaturization of semiconductors and producing self-assembled nanodevices [16] as well as micro-fabrication using reactive ion etching and ion lithography [17]. Recently, to determine the electronic structures of nanosystems within surfaces, the effects of the nanosystem’s size and shape are probed [18].
Resonant charge transfer (RCT) occurs when a near-degeneracy is achieved between a shifted ion affinity-level and various surface localized states. The resulting wavefunction overlaps allow for the transfer of an electron between the ion and the surface, in either direction, such that energy is conserved. A number of ion-scattering experiments have been performed on mono- and polycrystalline metal surfaces to explore the RCT process [19,20,21,22,23]. The scattering of negative ions from nanoisland films has been recently studied [24]. The RCT interactions of excited states of Na nanoislands on Cu(111) were studied using wave packet propagation methods [25]. Treating vicinal steps within a jellium model, H neutralization was studied in a wave packet propagation approach, in which steeper-angle scatterings were considered to study the dependence of ion-impact direction vis-a-vis the slope of a local step [26].
During past years, a full quantum mechanical wave packet propagation approach was employed by our group to conduct detailed RCT studies in ion-scattering from low Miller index flat surfaces [27,28,29,30]; the results had success in describing some available measurements [28]. For vicinal surfaces with equally spaced terraces, ion scattering from steps can enrich the RCT process. We recently applied these techniques to study RCT between the H ion and vicinally stepped Pd(111) surfaces and computed the ion survival probability [13]. The natural next step, therefore, is to extend the method to other metallic vicinals. This will allow us to explore general similarities and detailed differences as a function of altering surface band structures.
In the present study, we accomplish this goal by investigating vicinally stepped Cu(111) and Au(100). The detailed results are presented as a comparative account against the results of the Pd(111) vicinal. Though our model for the vicinal steps is rather simple, this model has been successful in describing the results of photoemission measurements on vicinally stepped surfaces [7,8]. This provided us some confidence in applying the model in our quantum mechanical simulation of RCT between an ion and a vicinal surface. We calculate the electron wave packet probability densities at all points in space at each time interval. At shallow incident angles of the ion trajectory these calculations are performed as a function of various inter-step distances on the surface as well as for a range of the projectile velocity. Animations produced from calculated probability densities indicate that, when the electron transfers to the metal from the ion, the most probable destinations are the surface and image surperlattice states. Two schemes of ion trajectory resulting in different ion-surface interaction times were employed in the simulation. This allowed us to capture the role of the ion “hangout” time in the close proximity of the surface. A robust feature for all three surfaces is that the ion survival probability peaks at certain velocities for each distance between vicinal steps. We show that these peaks are produced whenever the electron’s kinetic energy transferred to an image state equals the subband dispersions for a given distance between steps. As expected, the magnitude of the ion survival is found to sensitively depend on the particular surface band properties. The result suggests that anion-scattering experiments may be a good way of studying superlattice band structures. Unless mentioned otherwise, atomic units (a.u.) are used in the description of the work.

2. Description of the Method

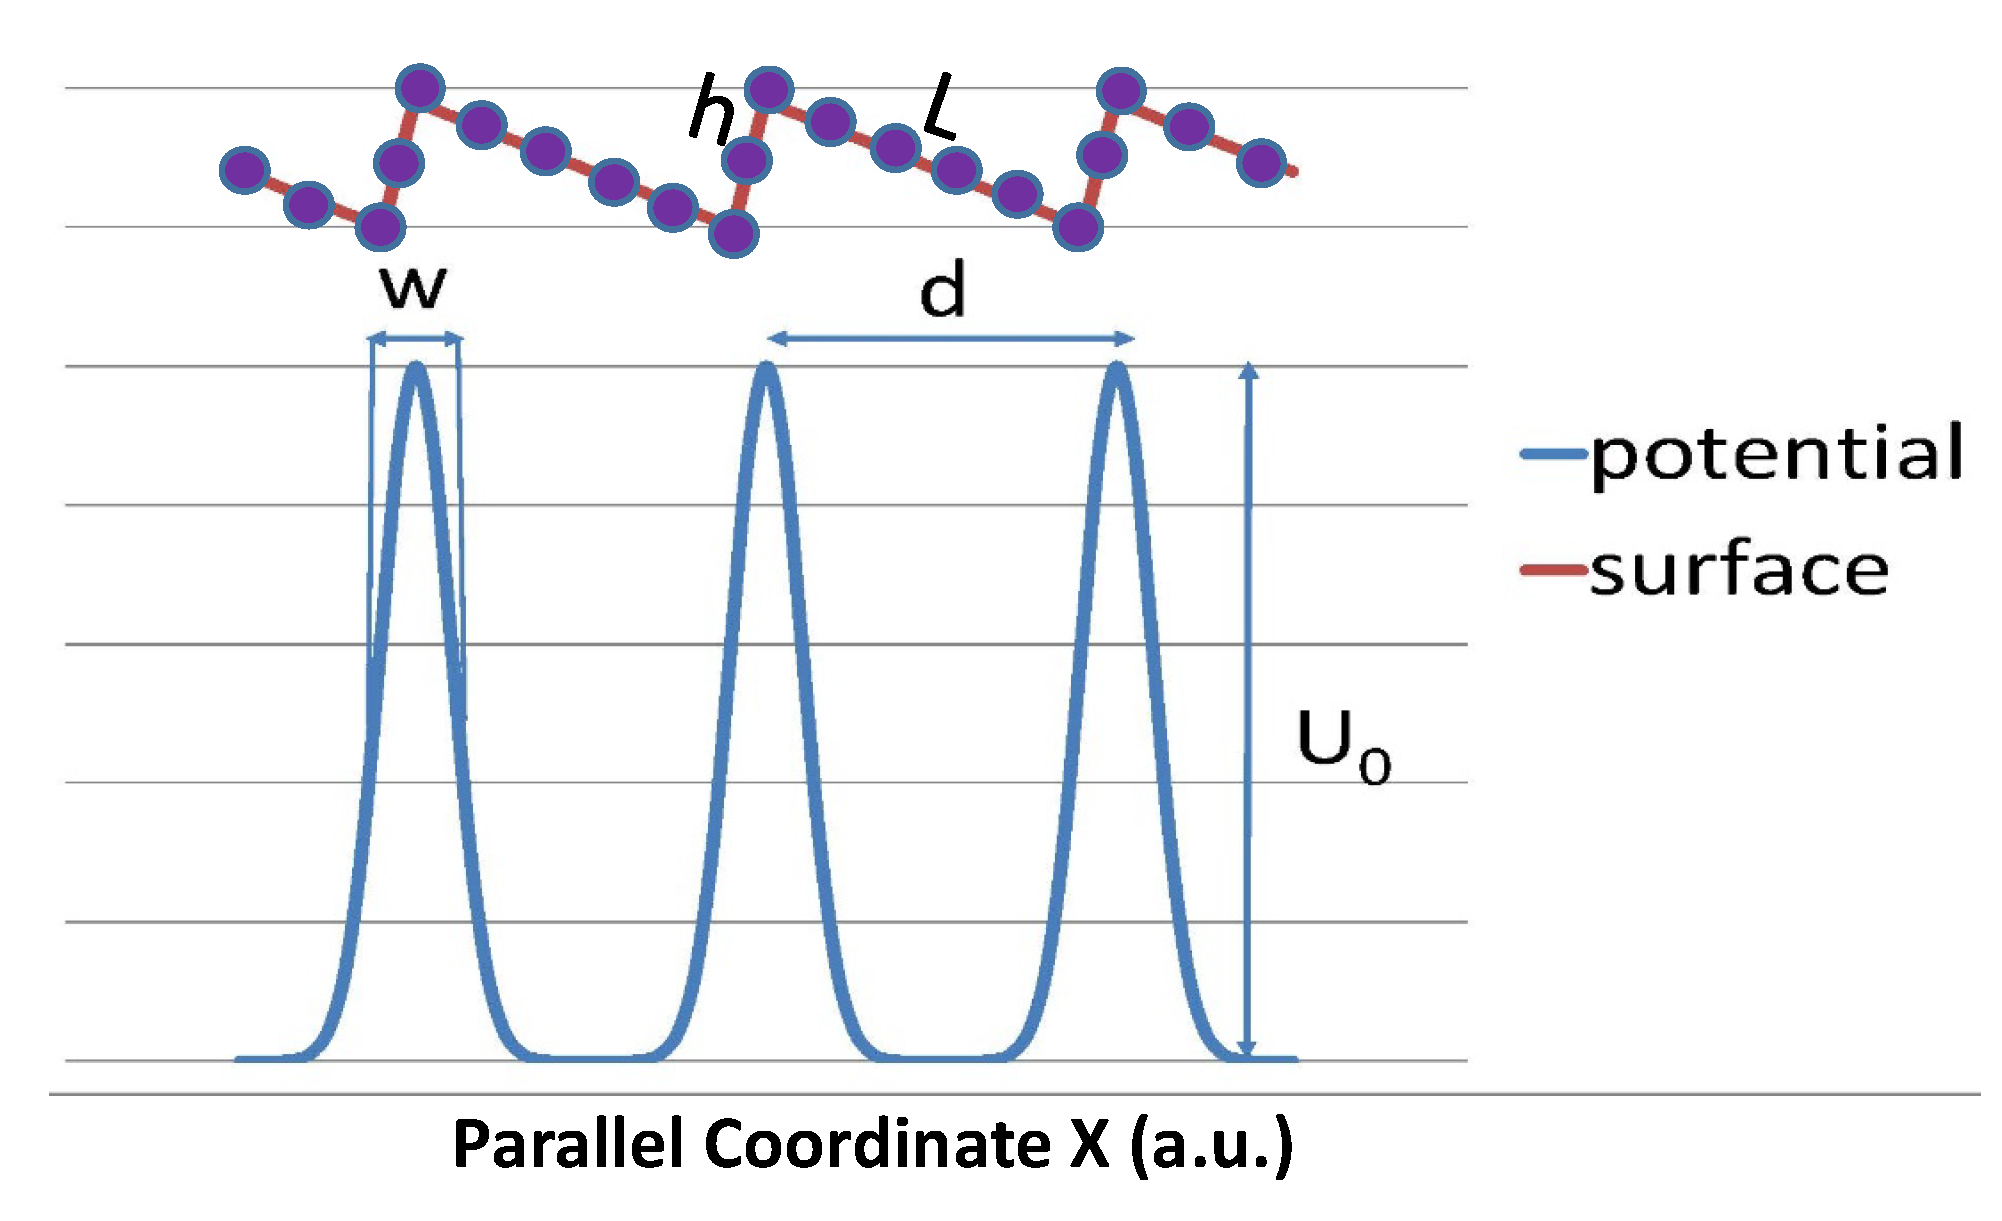
2.1. Surface Model in Vicinal Direction

Because of the repulsive forces between steps in vicinal corrugations, the steps are generally equally spaced [31]. The size of the terrace is given by the height h of the step and the terrace width (vicinal miscut) L. A two-dimensional model was used for the metal surface. The axis along the primal flat surface is x and the normal to the surface is z. The ion approaches the surface with velocity components in the negative z direction and in the positive x direction. The Kronig-Penny (KP) potential is used to mimic the periodic potential array due to the vicinal steps along the x-direction shown in Figure 1. It is the peaks in the KP potential that mimic the steps in the metal surface. These peaks have height U 0 , width w, and step separation d (distance between adjacent steps). We used this model since it successfully described the photoemmission spectra in experiments with stepped vicinal metal surfaces [7]. The step height of the vicinal surfaces used in these experiments was a single atomic layer. When the data was fit to the KP model, the product U 0 w had a maximum value of 0.054 a.u. [7]. We thus chose U 0 = 0.054 a.u. with w = 1 a.u. for the results presented in this article. It may be noted that there is no exact correlation between U 0 and h since vicinal steps at the atomistic level are not represented in our model. This would require a full 3D structure model. Rather, we mimic the effects of vicinal steps with a model that uses a flat surface with a potential array following Ref. [7]. In this potential array, the strength U 0 w correlates with the electrostatic strength of a vicinal step. Note that using the Dirac δ -array n U 0 w δ ( x n d ) to approximate the periodic potential does not change the results [7]. Similarly, any combination of U 0 and w, that gives the same strength U 0 w , will practically give the same results. For instance, using U 0 = 0.027 a.u. and w = 2 a.u. we were able to obtain the same results in our calculations. On the other hand, when the product, U 0 w , was half as great, i.e, 0.027 a.u., the survival was halved due to the fact that a weaker barrier increased transmission to the next well and reduced the capture rate. We will use this one-dimensional array potential in combination with a parametric potential derived from a first principle method that represents the atomic layers of the flat substrate in the z direction, as discussed below.

2.2. Wave Packet Propagation

The details of the propagation methodology are given in Ref. [27] and were recently applied to the study of Pd(111) vicinal surface [13]. The time-dependent electronic wave packet Φ r , t ; D for the ion-surface combined system is a solution of the time-dependent Schrödinger equation
i t Φ r , t ; D = H Φ r , t ; D ,
with the general form of the Hamiltonian as
H = 1 2 d 2 d z 2 1 2 d 2 d x 2 + V vi - surf ( x , z ) + V ion ( x , z )
where D ( t ) is the dynamically changing perpendicular distance between the z = 0 line (see below) of the fixed-in-space metal surface and the ion moving along a trajectory. The potential, V vi - surf , of the vicinal surface has two components. The first component is a parametric potential in z that represents the atomic layers of the metal in this direction. The second component is the previously discussed KP potential. The former is obtained from a pseudopotential local-density-approximation method for simple and noble metal surfaces [32,33]. This potential represents the flat surface that the KP potential is superimposed on. This was also the model used in our earlier work with flat surfaces [27,28,29,30] and in our recent work with a vicinal Pd(111) surface [13]. This potential is graphed in Figure 2 for each of the three metals. The topmost atomic layer of the metal is taken at z = 0 . This was done so that the centers of the atomic layers, for z < 0 , are given by the peaks in the potential, going into the bulk. The KP potential is exponentially attenuated in the positive and negative directions from its’ peak at z = 0 . This will limit the effect of the steps going far from the surface. Curves representing a section of V vi - surf along z-direction through a vicinal peak for each metal are also included in Figure 2. Detailed differences among these curves, based on the variation in their flat surface potential properties, suggest that the flat-surface dispersions also influence corresponding vicinal dispersions.
The full 2D V vi - surf that is used in our simulation is shown in Figure 3 for Pd(111). The KP potential, as seen in both Figure 2 and Figure 3, is at its maximum at z = 0 so that the positions of the atomic layers would not be changed by the vicinal potential. This means that z = 0 is the position of the topmost atomic layer for the flat metal potentials. In Figure 3, due to the applied attenuation, one can barely see smaller peaks inside the surface and the peaks are extremely difficult to identify outside the surface as well. The 2D potential versions for Cu(111) and Au(100) are qualitatively close to Figure 3 and are hence not shown.
The flat substrate potential shown by the solid line for each metal in Figure 2 requires five parameters to define it [32,33]. One of these is the lattice spacing ( a s ) between atomic planes in the metal. The other four are related to the top and bottom energies of the projected band gap, the surface state energy and the first image state energy [33]. Therefore, differences of H RCT dynamics between the flat surfaces must be explained by differences between these five quantities for the different metals. Similarly, the surface potential in the vicinal direction is defined by the three parameters shown in Figure 1. Results for a particular vicinally stepped surface should, therefore, vary based on these three parameters as was shown in Ref. [13]. Nevertheless, the comparison of vicinal RCT among various metals, which is the focus of the present study, will partly borrow from their flat-substrate properties.
The H ion is described by a single-electron model potential, V ion , which includes the interaction of a polarizable hydrogen core with the active electron [34]. A re-parametrized version [27] of this potential is used in the present calculations—a version that was also employed in our previous publications [13,28,29,30]. This re-parameterized ion potential is consistent with our 2D propagation scheme and gives the correct energy E ion = 0.0275 a.u. (0.75 eV) of the ion affinity level.
The propagation by one time step Δ t will yield
Φ ( r , t + Δ t ; D ) = e x p [ i H ( D ) Δ t ] Φ ( r , t ; D )
where the asymptotic initial packet Φ ion ( r , t = 0 , D = ) is the unperturbed H wave function Φ ion ( r , D ) . The ion-survival amplitude, or autocorrelation, is then calculated by the overlap
A ( t ) = Φ ( r , t ) | Φ ion ( r ) .
We employ the split-operator Crank-Nicholson propagation method in conjunction with the unitary and unconditionally stable Cayley scheme to evaluate Φ ( r , t ; D ) in successive time steps [27,35]. Obviously, the propagation limits the motion of the active electron to the scattering plane of the ion.

2.3. Ion Trajectories

It is assumed that the ion reflects at the same angle to the flat substrate plane as it impinges at, that is in a specular pattern. These angles are very small to allow for greater interaction with the vicinal steps. The ion velocity is broken into two components: the parallel component, v par , in the x-direction and the perpendicular component, v nor , in the y-direction. In the computer program, the ion is aimed at the midpoint between adjacent steps and also directly onto a step. Two models of the trajectory were used in the simulation. The classical Biersack-Ziegler (BZ) interatomic potentials were used to model one trajectory [27,36]. This potential describes the average repulsion that occurs between the ion core and the surface atoms. The model does not affect v par but owing to the repulsion v nor is smoothly reduced to zero at the turning point, which is the point of closest approach to the surface. The ion subsequently and gradually regains its initial speed which results in a somewhat parabolic shape of the trajectory. In order to identify features of the results that depend on the trajectory, we also employed a basic trajectory that we call a broken straight line (BSL) trajectory. In this trajectory the ion approaches along a straight line with constant velocity (zero repulsion) and reflects back along a straight line with the same constant velocity at the same angle to the surface. For BSL, the same distance ( D c l ) of closest approach is used as in the BZ trajectory. Obviously, in the absence of slowing down, the ion on a BSL trajectory will have shorter time of interaction with the surface than on a BZ trajectory.
The ionic motion on each trajectory is then incorporated in the propagation by adding the translational phase ( v nor z + v par x + v 2 t / 2 ) [27]. The center of the ion potential is also shifted in Equation (2) so the ion will follow the trajectory corresponding to evolving D ( t ) . The BZ potential was calculated as if the surface was flat at z = 0 to obtain the trajectory. This simplification, as though the trajectory is insensitive to vicinal steps, should not qualitatively affect the main results. The RCT process should be the principal factor in determining the primary effects of the interaction.
In the grazing scattering, ion neutralization on metal surfaces can cause a shift of the Fermi sphere [37] over a range of v par . This is called the “parallel velocity effect.” For cation neutralization it produces a strong capture rate from the metal’s Fermi sea. However, the processes we are studying involve the neutralization of anions for which the effect is far less significant. As estimated in Ref. [13], the Pd Fermi energy ( E f ), measured from the bottom of the valence band, is roughly 0.262 a.u. [38]. This gives k f = 0.72 a.u. for the magnitude of the Fermi wave vector. Taking into account a 41% rise in the effective mass of the electron for Pd [38] gives k f = 0.85 a.u. for the Fermi wave vector. The situation for Cu ( E f = 0.257 a.u.) and Au ( E f = 0.203 a.u.) will be largely similar. The Fermi energy as observed from the frame of reference of the moving ion is given by E f = ( k f v par ) 2 / 2 [39]. This suggests that the energy range of the current RCT process might not be influenced much by this observed Fermi Energy. As discussed in the following section, this energy range is quite close to the image state energies of the metal. As shown in Figure 4, Figure 5 and Figure 6, the largest peaks in the ion survival typically occur when v par < 0.6 a.u.
In our simulations, v nor = 0.03 a.u. when z = 20 a.u. Since v nor is held constant at the initial and final values of z, the results of our simulations will vary little as a function of v nor . It is reasonable, therefore, to keep the D c l constant. Our particular interest is in how the ion survival probability will vary both as a function of v par and as a function of the vicinal structure. When the ion has returned to z = 20 a.u. the final ion survival probability is obtained by
P = lim t A t 2 .
Our calculated ion survival probabilities are the fractions of the incoming ions that survive and can be measured by experiment [22].

2.4. Simulations

The computer program we have written finds the electron wave packet density at each point in a bounded space for each step of time. Animations were produced from this data showing how the electron wave packet density time-evolves over the passage of the ion. In the perpendicular projection the ion started and finished at z = 20 a.u. whereas the initial and final values of x depended on v par . Using a small v nor value and sweeping across many values of relatively fast v par , the ion scattered at very small angles to the metal surface. Consequently, the length of the surface, | x final x initial | , was large, which resulted in very long execution times for each run of the computer program. To reduce runtimes, the program was parallelized with OpenMP, which allows for multi-threaded execution. This allowed us to perform parameter sweeps varying the parallel velocity, trajectory type, and stepped metal surface. These parameter sweeps were executed on the Stampede supercomputer at the Texas Advanced Computing Center at the University of Texas at Austin. More than 500 survival probabilities were calculated over these parameter sweeps for each of the stepped metal surfaces considered in this paper. These calculations were done in the 2D model described above, and all figures present 2D model results.

3. Results and Discussions
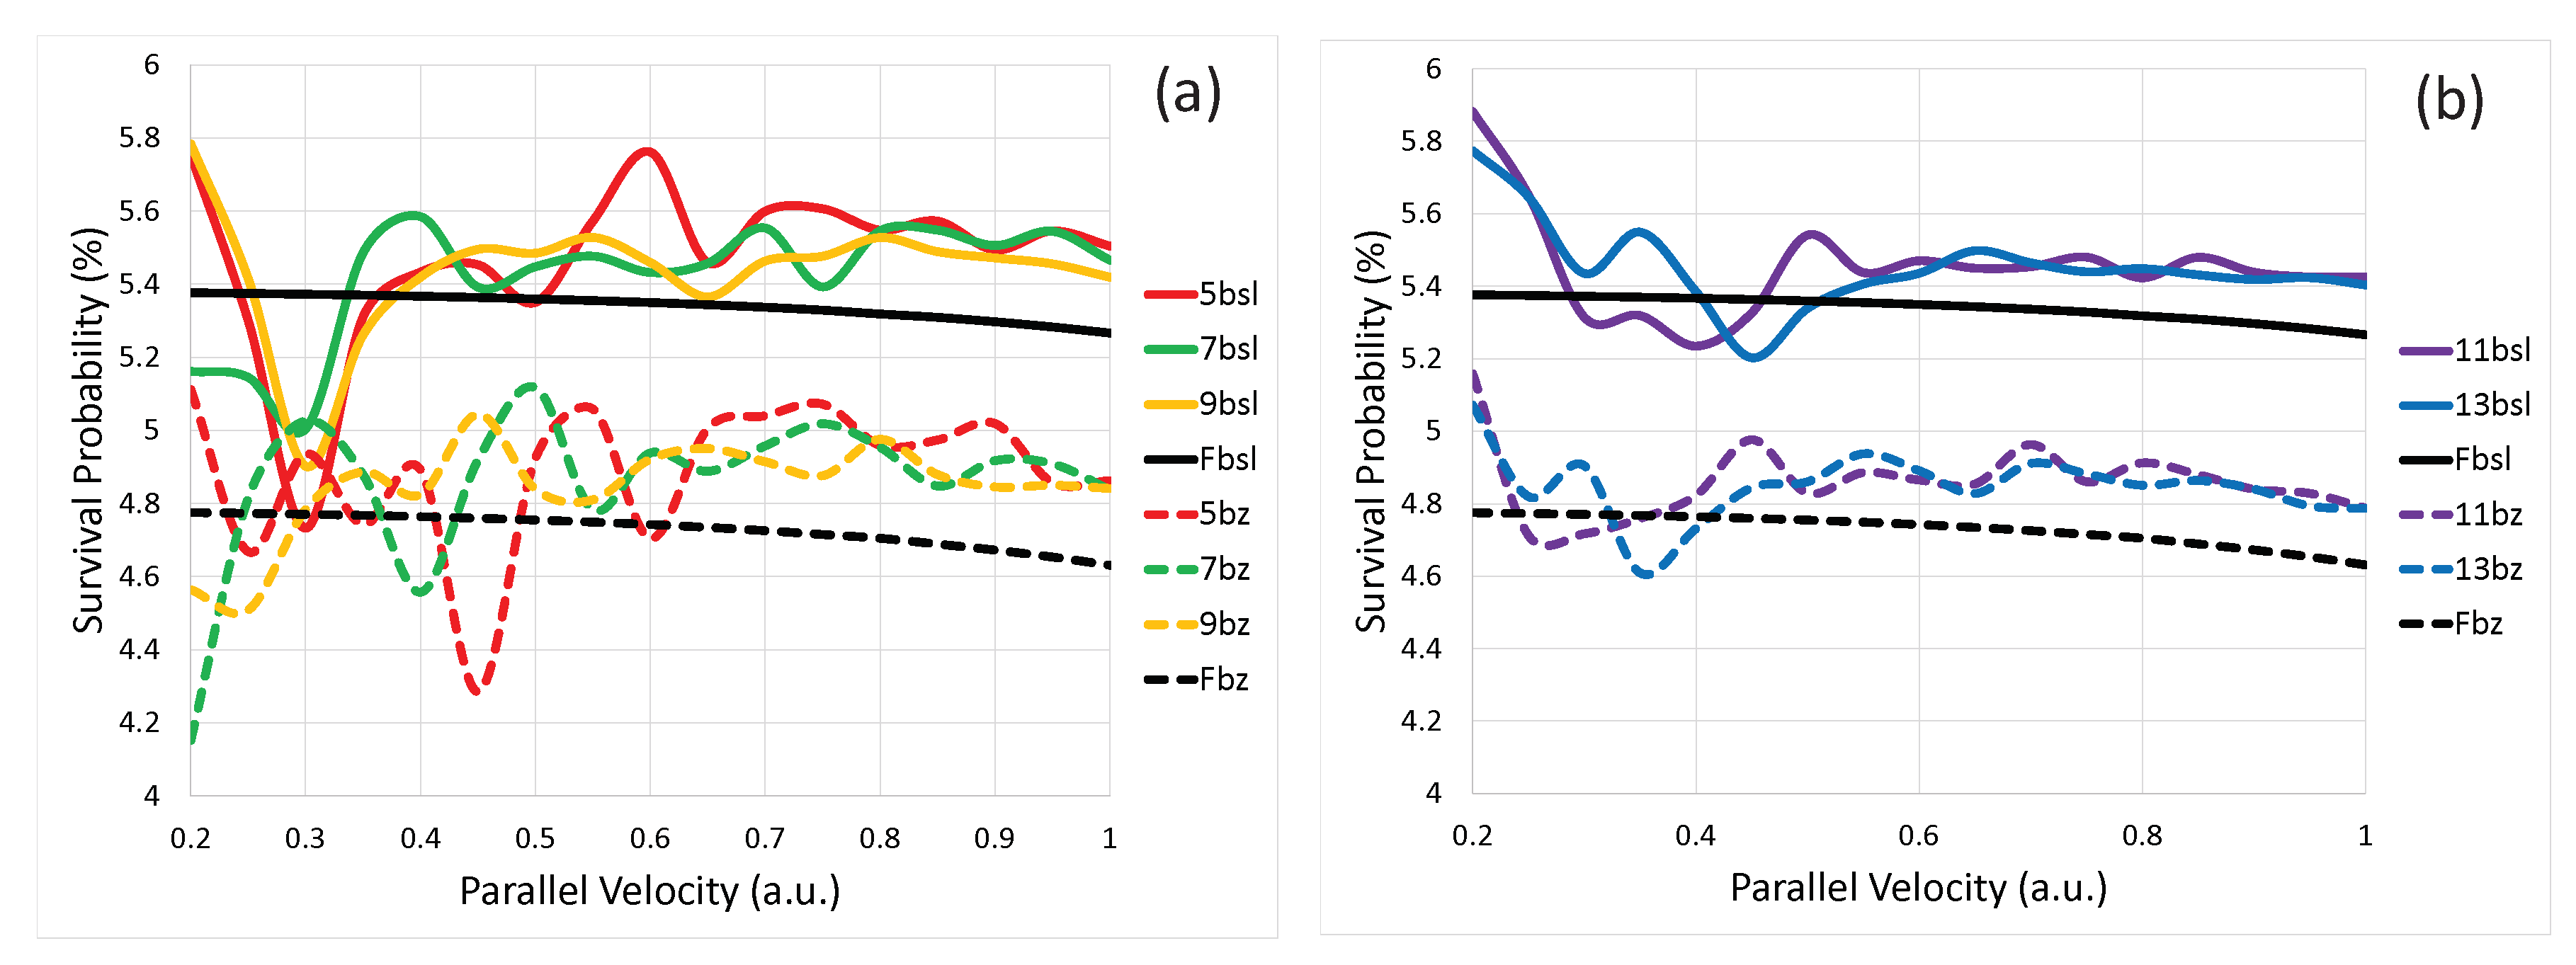
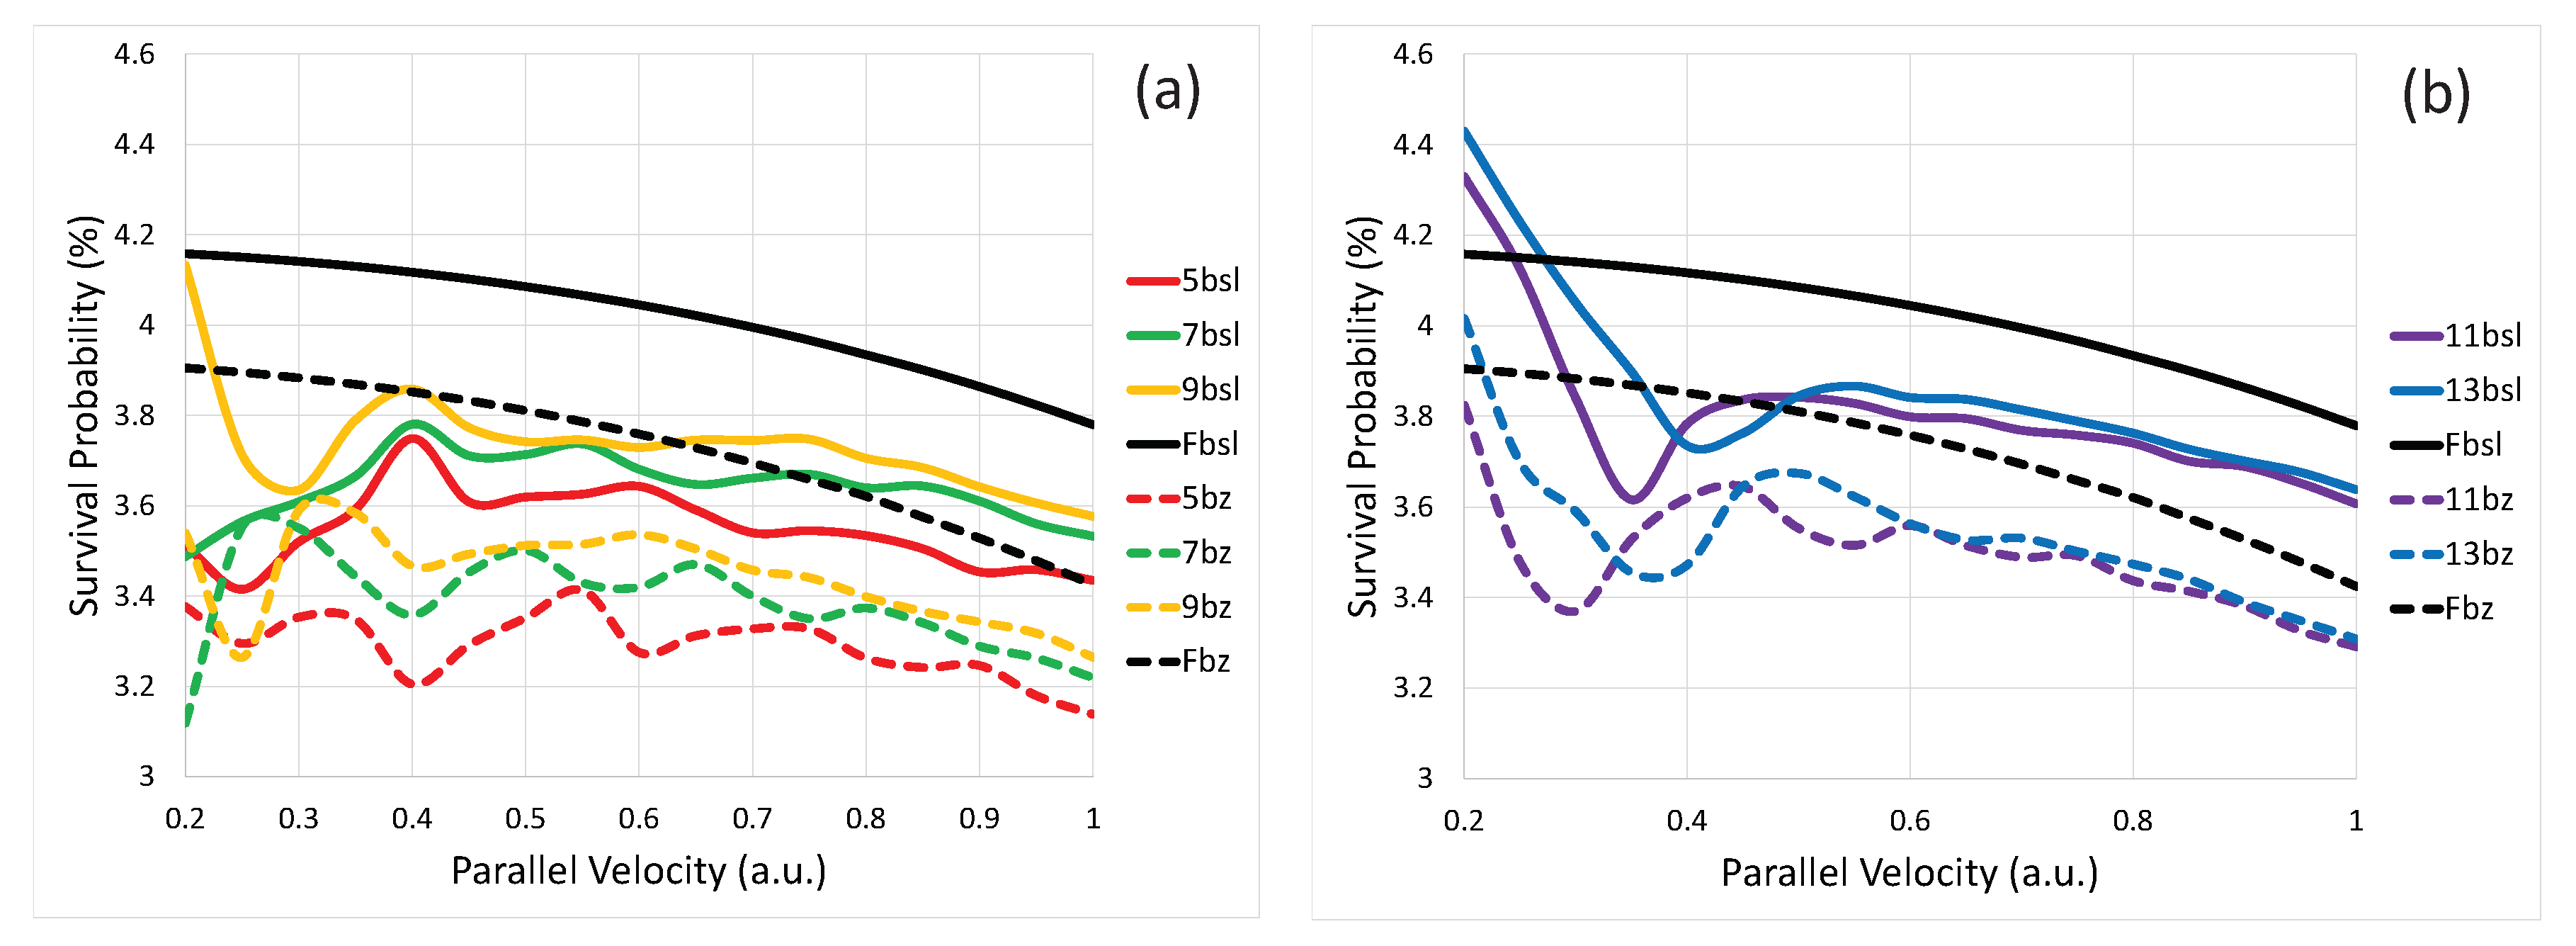
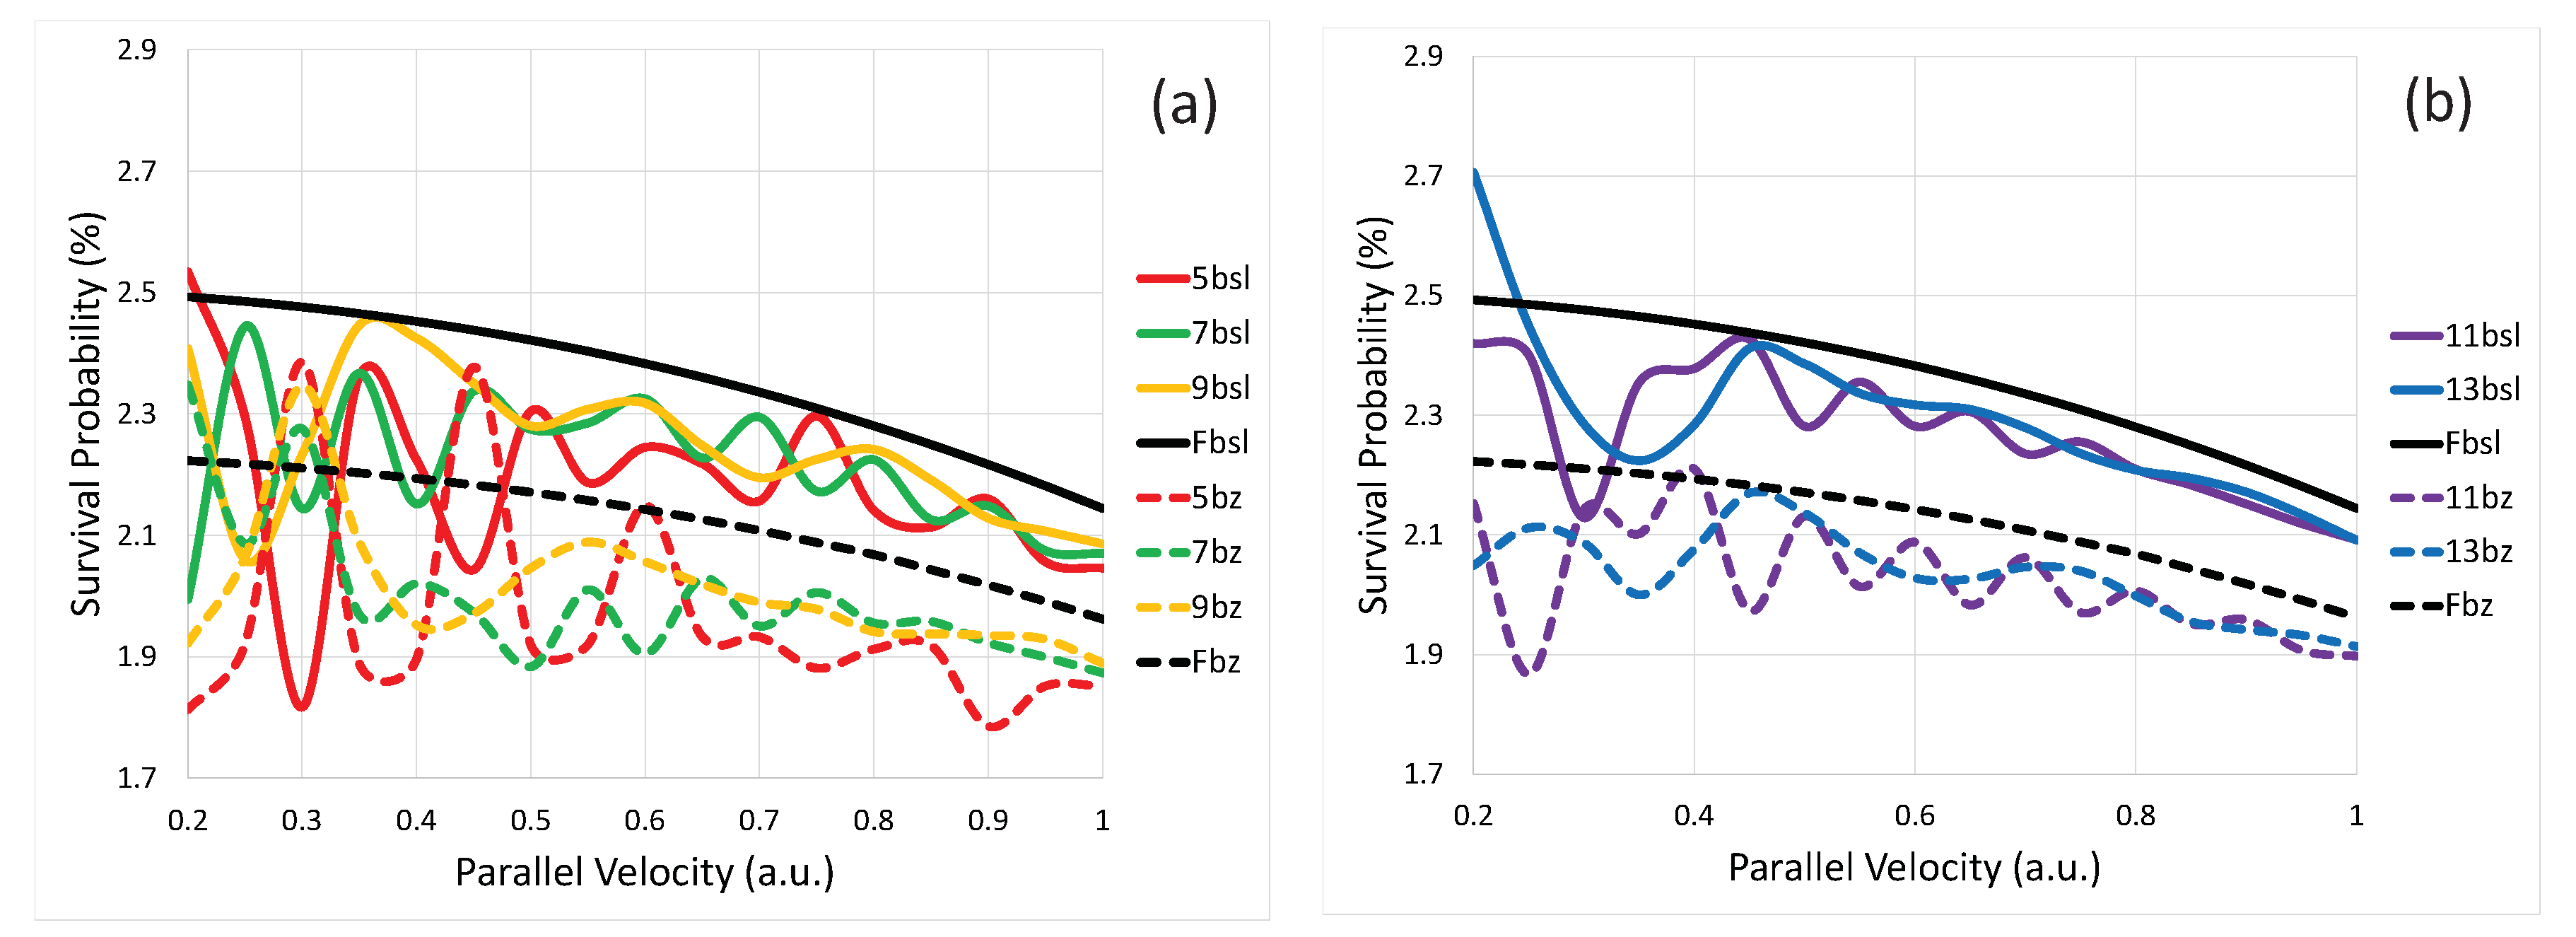
3.1. Ion Survival

H survival probabilities were calculated for three different metals: Cu(111), Au(100) and Pd(111). The probabilities were calculated for both flat and vicinally stepped surfaces. The parallel velocity, v par ranged from 0.2 to 1.0 a.u. in steps of 0.05 a.u. in our calculations which corresponds to scattering angles of 8.53 to 1.72 degrees. The distance (d) between the steps was chosen to be 5, 7, 9, 11, and 13 lattice spacings ( a s ). These lattice spacings were a s = 3.94 a.u. for Cu(111), a s = 3.853 a.u. for Au(100) and a s = 4.25 a.u. for Pd(111). The results of the hydrogen ion survival probability when the ion returns to z = 20 a.u. are given in Figure 4, Figure 5 and Figure 6 for two different trajectories: BZ (solid line) and BSL (dashed line). A cubic spline was used in fitting the graphs to the data points. The flat surface results, which are labeled “F” in the legend, are shown for comparison. The ion survival probabilities show significant variations for the vicinal surfaces while the flat surface result is smooth.
Due to the parabolic free electron dispersion of a flat surface, the graph of the survival probabilities of ions reflected off a flat surface should be a smooth function of v par for fixed v nor . Furthermore, the graph should be almost steady for those flat surfaces that possess a projected band gap in the z-direction which resists decay in that direction [32]. Our results of flat surfaces in Figure 4, Figure 5 and Figure 6 are slowly decreasing, however. This is probably caused by imperfect absorbers at the boundary built into our computer program to approximate an infinite surface. It may also partly be due to slow “evaporation” of the electron probability along the image state Rydberg series to the vacuum. It is observed that the results for the vicinal surfaces similarly have an overall decreasing trend with increasing v par . This, however, does not change the modulations in the survival probability which arise from the RCT process causing the electron to drop into a subband state. This is because any error caused by the boundary absorbers is a systematic error. It effects all results the same. The position of the peaks, however, will not be altered, only their relative amplitudes. It can be seen in Figure 4, Figure 5 and Figure 6 that the flat surface survival probability is generally greater than the vicinal surface survival probability for Au(100) and Pd(111) but smaller for Cu(111)—a trend true for both the BZ and BSL trajectories. This may be due to the fact that the textured surfaces are modifying the energies of the band gap, the surface state, and the image states, which are represented by the parameters of the substrate potential we are using in our model.
It was found in our previous publication [13] that the distance d between vicinal steps is one important surface structure property that affects the position of the modulation peaks. As mentioned earlier, D c l = 1 a.u. in all results presented here. For larger D c l to a given surface (results not shown) the variations in survival probability became smaller, which is simply due to the fact that a distant ion feels the vicinal steps weakly. The location of the peaks also slightly changed with different D c l , which is connected to the altering ion-surface effective interaction time—the time of being close enough to the surface. The shorter the D c l , the longer is the interaction time. A longer interaction time will allow the ion affinity level to adiabatically shift more in energy [27], causing the electron to land in a KP potential well with a slightly different speed than that for a shorter interaction time. This can slightly offset the peak positions between different D c l values. We discuss this offset further in Section 3.4. The interaction time effect also governs the differences between the results from BZ versus BSL trajectories in Figure 4, Figure 5 and Figure 6. The same D c l = 1 a.u. for both trajectories enables the ion to sense the steps almost equally resulting in roughly the same strength of modulation irrespective of the trajectory. Note that, in all the results, a slowing ion on the BZ trajectory with a longer interaction time produces consistently lower survival rates than that of an ion on a BSL track, since longer times facilitate higher decays. On the other hand, on a BSL path, the affinity level has slightly less time to shift, causing small mismatches in peak positions between BSL versus BZ; we will return to this point again in Section 3.4.
The lattice spacings a s of 3.94 for Cu(111) and 3.853 for Au(100) are very close, indicating that the true lengths of d are effectively the same for these surfaces. In spite of this, as seen in Figure 4 and Figure 5, details of the ion survival, even for a given ion trajectory, are very different for these two metals. This suggests that the structures are dependent on metal type and not just on d. Approximating the wave packet Φ ( r , t ) on a vicinal surface, to consist of a flat substrate and a vicinal step component, we can write the autocorrelation as,
A ( t ) = Φ flat ( r , t ) + Φ step ( r , t ) | Φ ion ( r ) = A flat ( t ) + A step ( t ) .
Upon inserting Equation (6) in the definition of survival probability Equation (5) we can write
P = lim t A flat 2 + A step 2 + A flat A step * + A flat * A step
to approximate the ion survival on a vicinal surface. Obviously, the first term on the right side of Equation (7) suggests that the non-modulating average of the survival is a direct substrate property. The leading contribution to the modulations derives from the second term that determines the peak positions from confinements between vicinal steps. It will be shown in Section 3.4 that these positions depend on image state energies that are slightly different from one metal to another. The last two terms together, however, embody a pure interference between the substrate and steps and are responsible for the detailed shape and magnitude differences in survival structures for vicinals among various metals. Evidently, the dispersion energetics of the precursor flat surface are important.

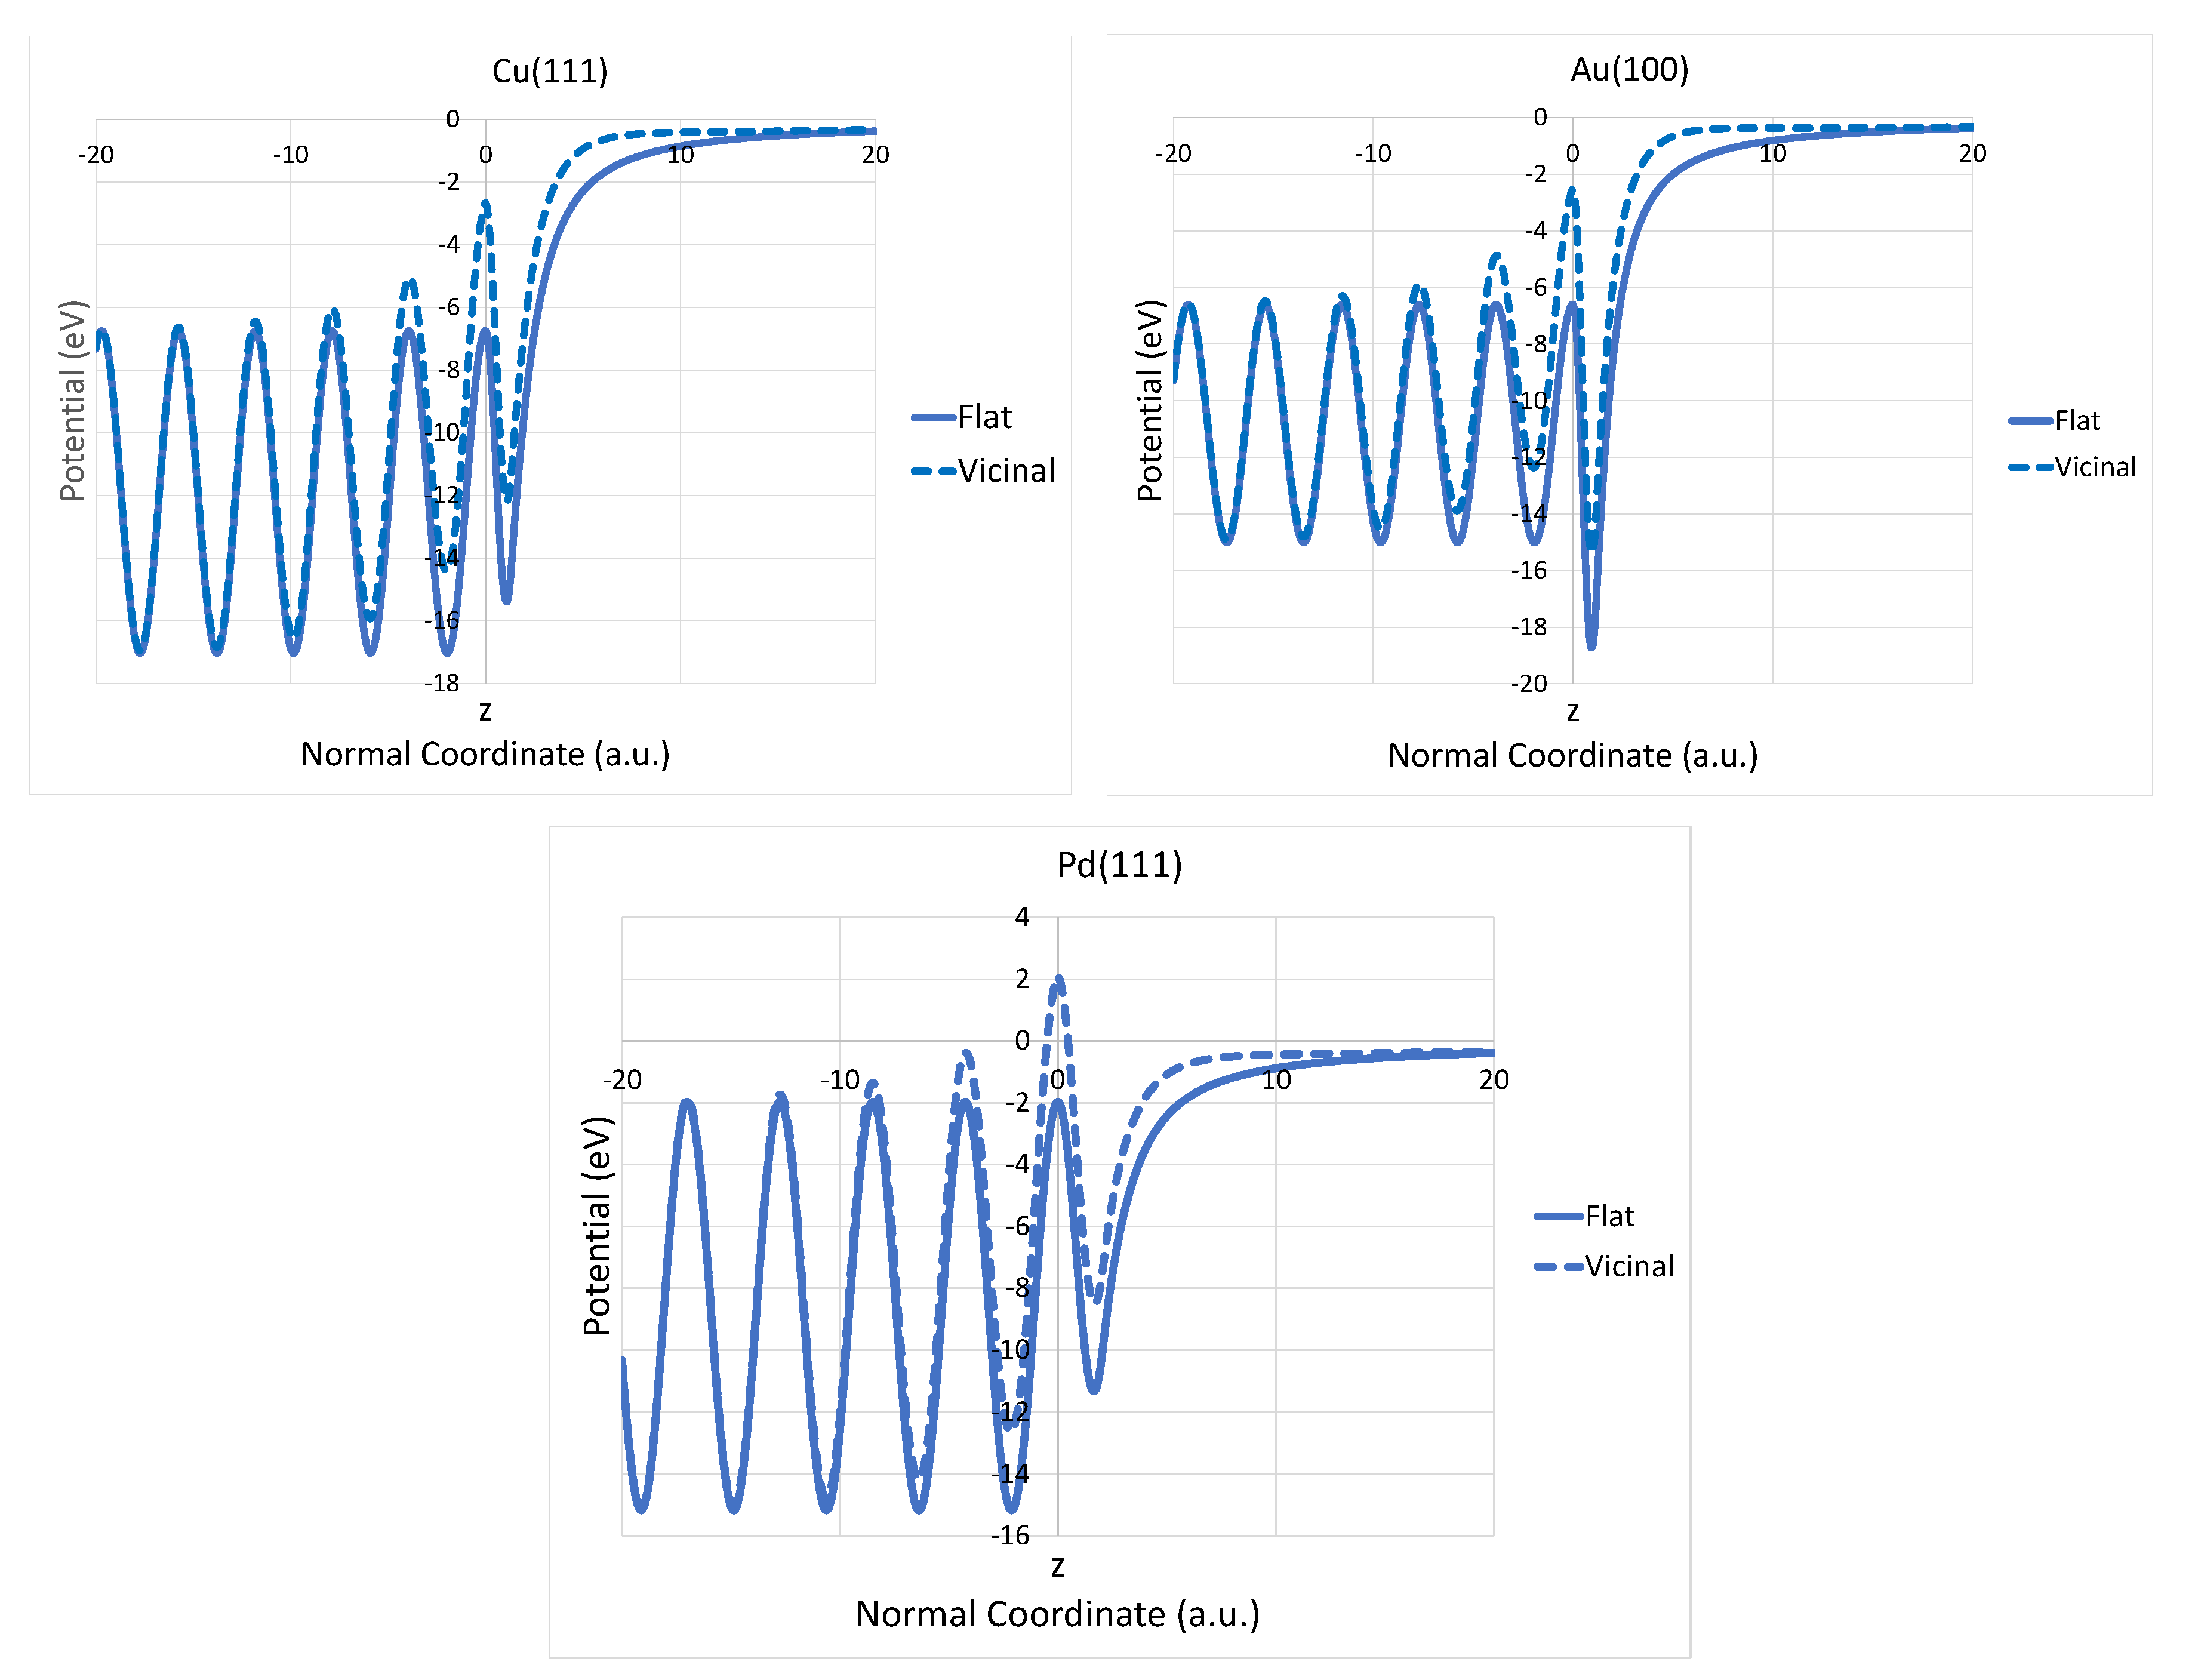
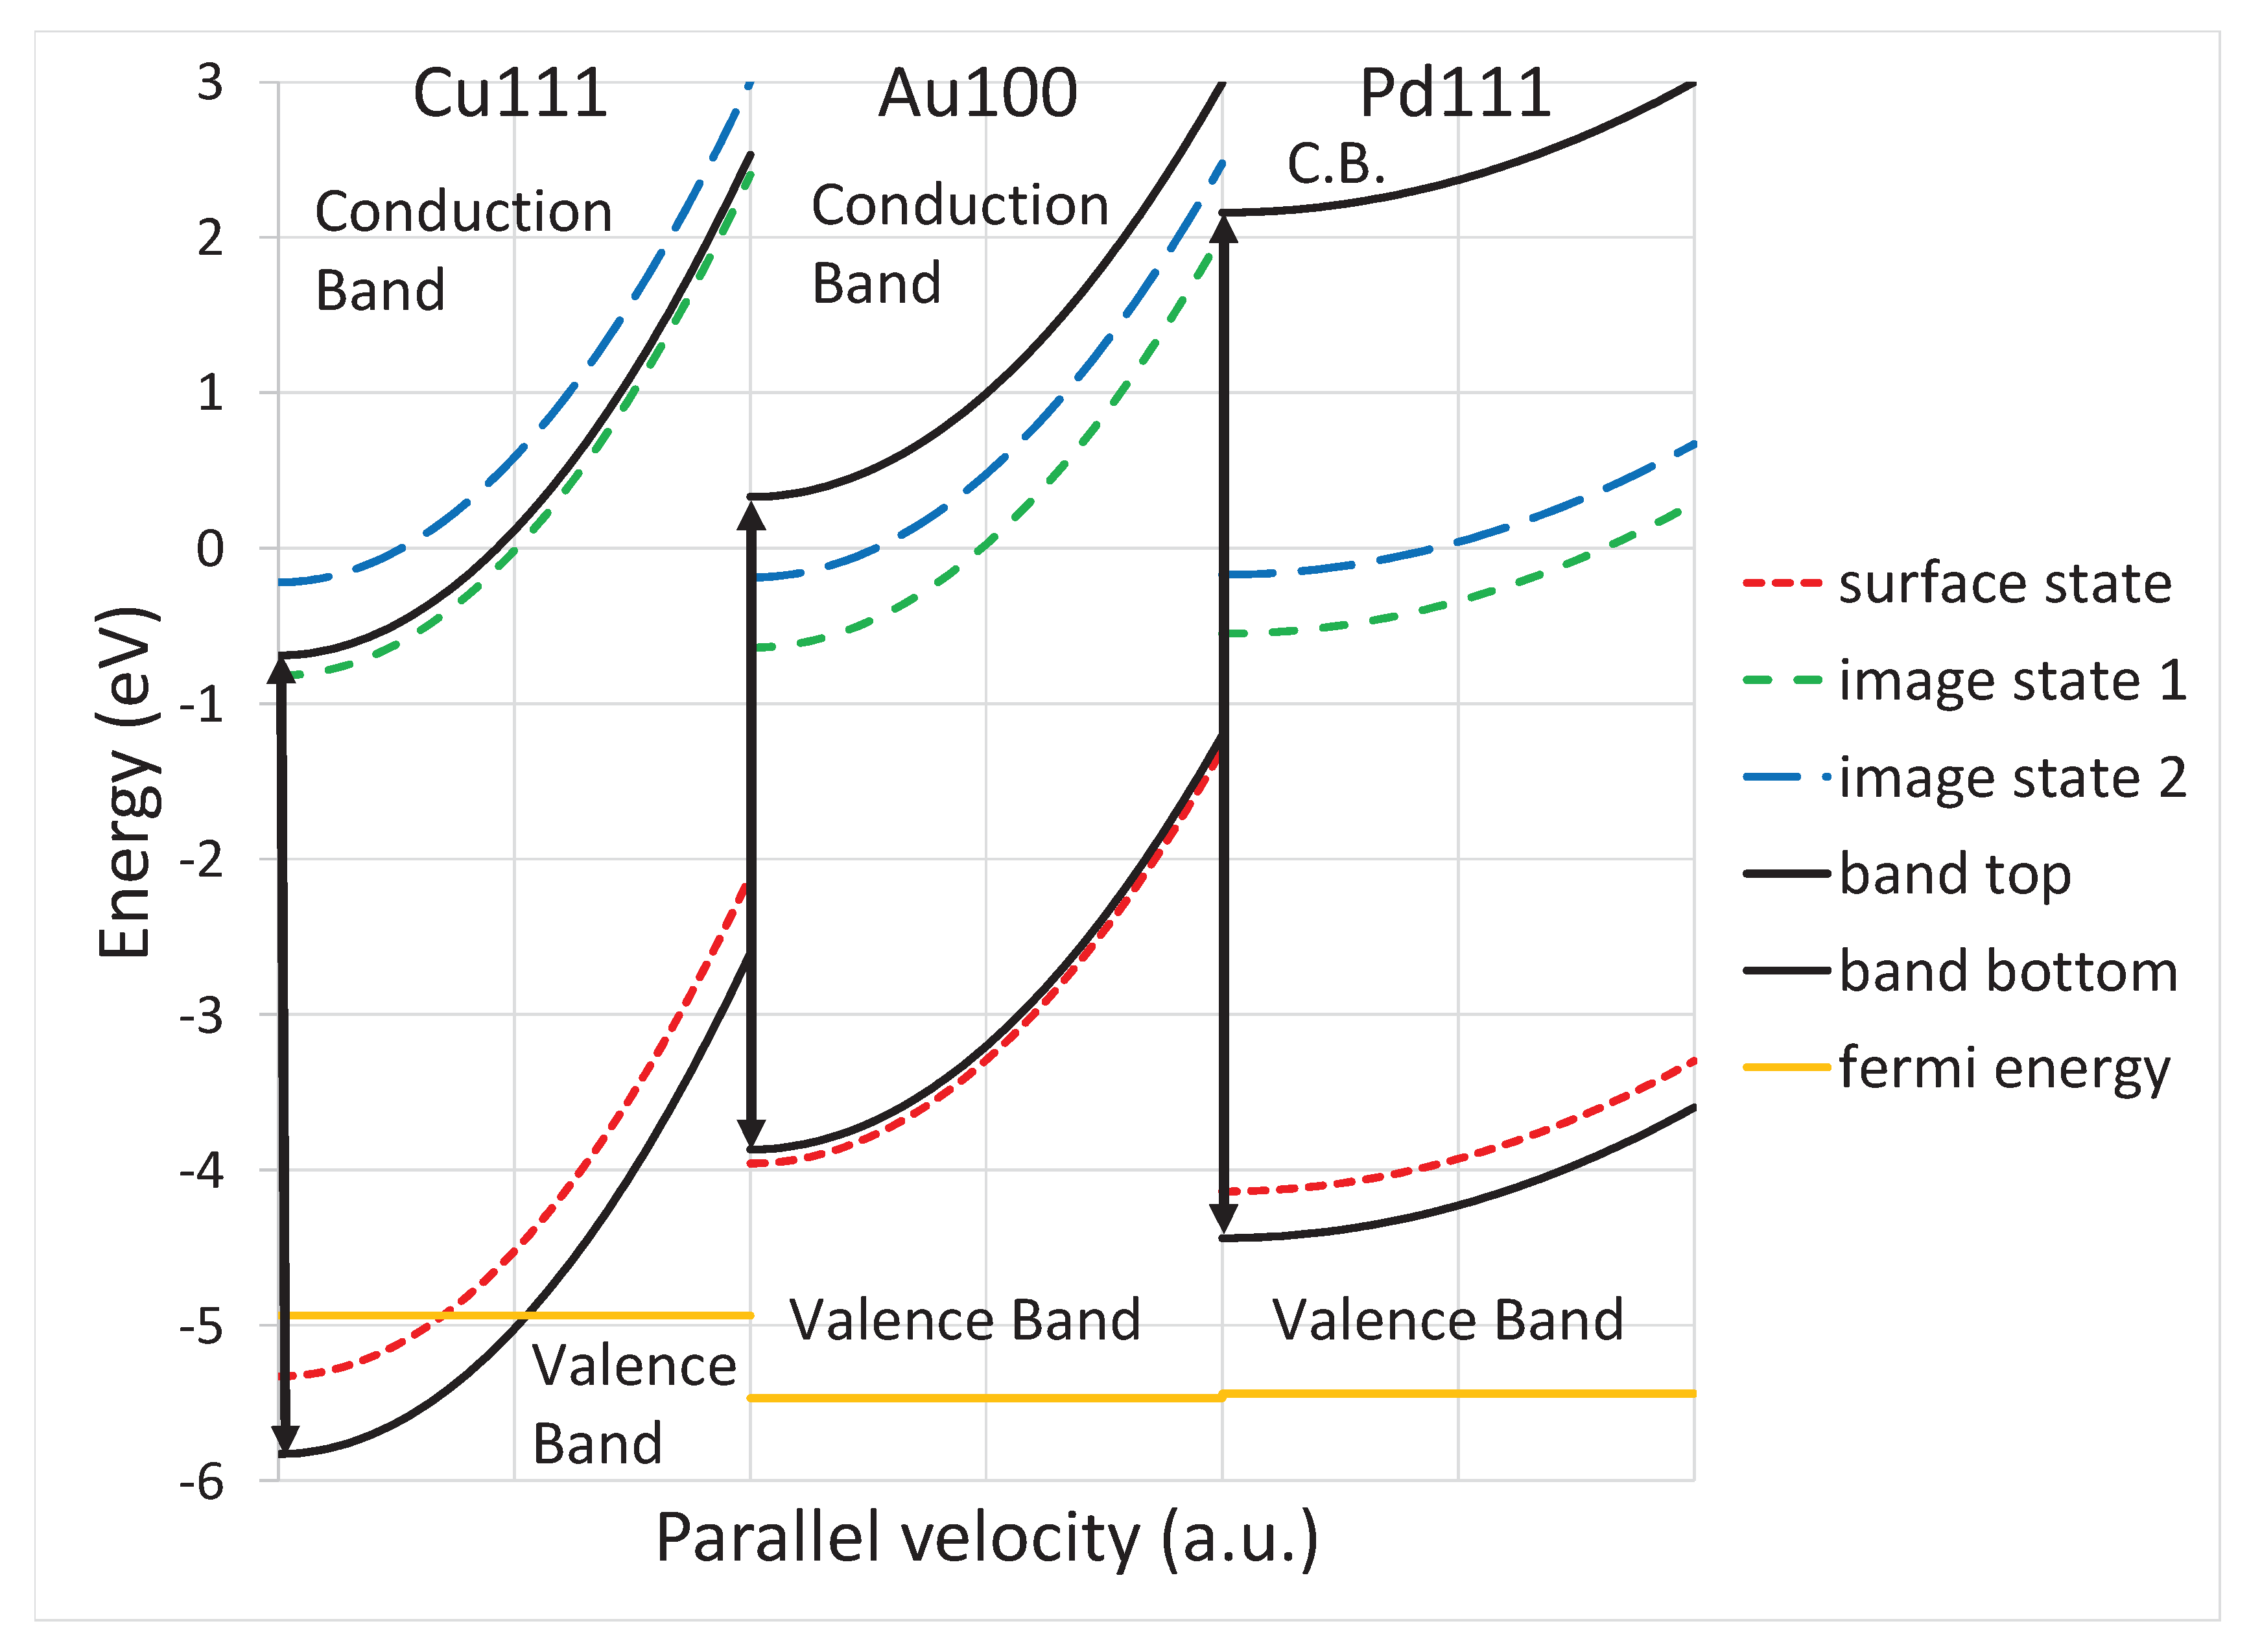
3.2. Effects of Dispersion Energetics of Substrates

Figure 7 shows the parabolic dispersions for flat substrates featuring the upper and lower edges of the projected band gap, the Shockley surface state, and the first and second image states [32]. It is expected that the incoming ion at its closest approach will resonantly populate both the surface and image state bands [30,40,41]. Comparing Figure 4, Figure 5 and Figure 6 it is seen that the metals with the greatest and smallest survival probabilities are respectively Cu(111) and Pd(111) with Au(100) being between them. This result can be understood from the relative dispersions in Figure 7. As we discussed earlier for Pd(111) [13], the electron transferred to the surface state moves away too quickly to be recaptured by the ion, while the ion can primarily recapture from the image states. The question is, what is the probability that the electron in an image state will transfer back to the ion rather than decay to the metal? This will depend on: (i) Number of available metal states for the electron to transfer to and (ii) the relative transition probability for electron transfer to each of these states versus the ion state. The energy of the electron in the ion is −0.75 eV, which is very close to the energy of the first image state −0.82 eV for Cu(111), −0.64 eV for Au(100) and −0.55 eV for Pd(111). As a result, there is a substantial probability for the electron to transition from an image state back to the ion. The large phase space of metal states (collectively the surface state, and valence and conduction band states) results in survival probabilities of 5% or less for the ion, as seen in Figure 4, Figure 5 and Figure 6.
The size of this phase space for the valence band and conduction band will depend on the location of the band-gap edges. The lower the bottom of the gap, the smaller is the phase space in the valence band. Likewise, the higher the top of the band gap, the smaller is the phase space in the conduction band. The valence band states are of lower energy than the first image state, whereas the conduction band is higher in energy than the first image state. Therefore, the transition probability for the electron in an image state to drop to the lower states, which are the valence band and surface states, is greater than the probability to transfer to the conduction band states. The conduction band phase space is further limited by the kinetic energy of the electron since the conduction electron cannot transition to an energy higher than it’s kinetic energy. In general, the larger the energy difference between the image state and the gap bottom, the smaller is the phase space of the valence band, and the smaller is the transition probability from the image state to the valence band.
Let us now get more specific. Cu(111) on Figure 7, having the largest difference between the first image state energy and the bottom of the band gap, has the highest average H ion survival (Figure 4). Comparing Au(100) to Pd(111) in Figure 7, we see that Pd(111) has a slightly larger difference between the first image state and the gap bottom. Furthermore, the overall band gap is larger for Pd(111) than for Au(100). This means that the phase space of metal states is larger for Au(100) than Pd(111). Thus one may expect the electron to decay to the bulk more often for Au(100) than Pd(111), since the greater the total number of states there are in the metal, the greater the probability that the metal will win the tug-of-war for the electron in the image state [32,42]. However, we find Au(100) has the larger average ion survival, comparing Figure 5 with Figure 6! This is due to the fact that the surface energy is in the valence band for Au(100) and in the band gap for Pd(111). If the surface state is in the valence band, then it is degenerate with the bulk states of the metal. This can be seen in the images of Figure 8c. If the surface state is in the band gap, then it adds to the available metal states and, as seen in Figure 8a,b,d, is a preferred energy state. The presence of the surface state in the band gap for Pd(111) gives the metal the edge in its tug-of war for the electron as compared to Au(100). The surface state is also in the band gap for Cu(111), but this does not overcome the effect of the extremely low bottom of the gap. In any case, this account must be combined with the picture of vicinal confinement to fully understand the results.

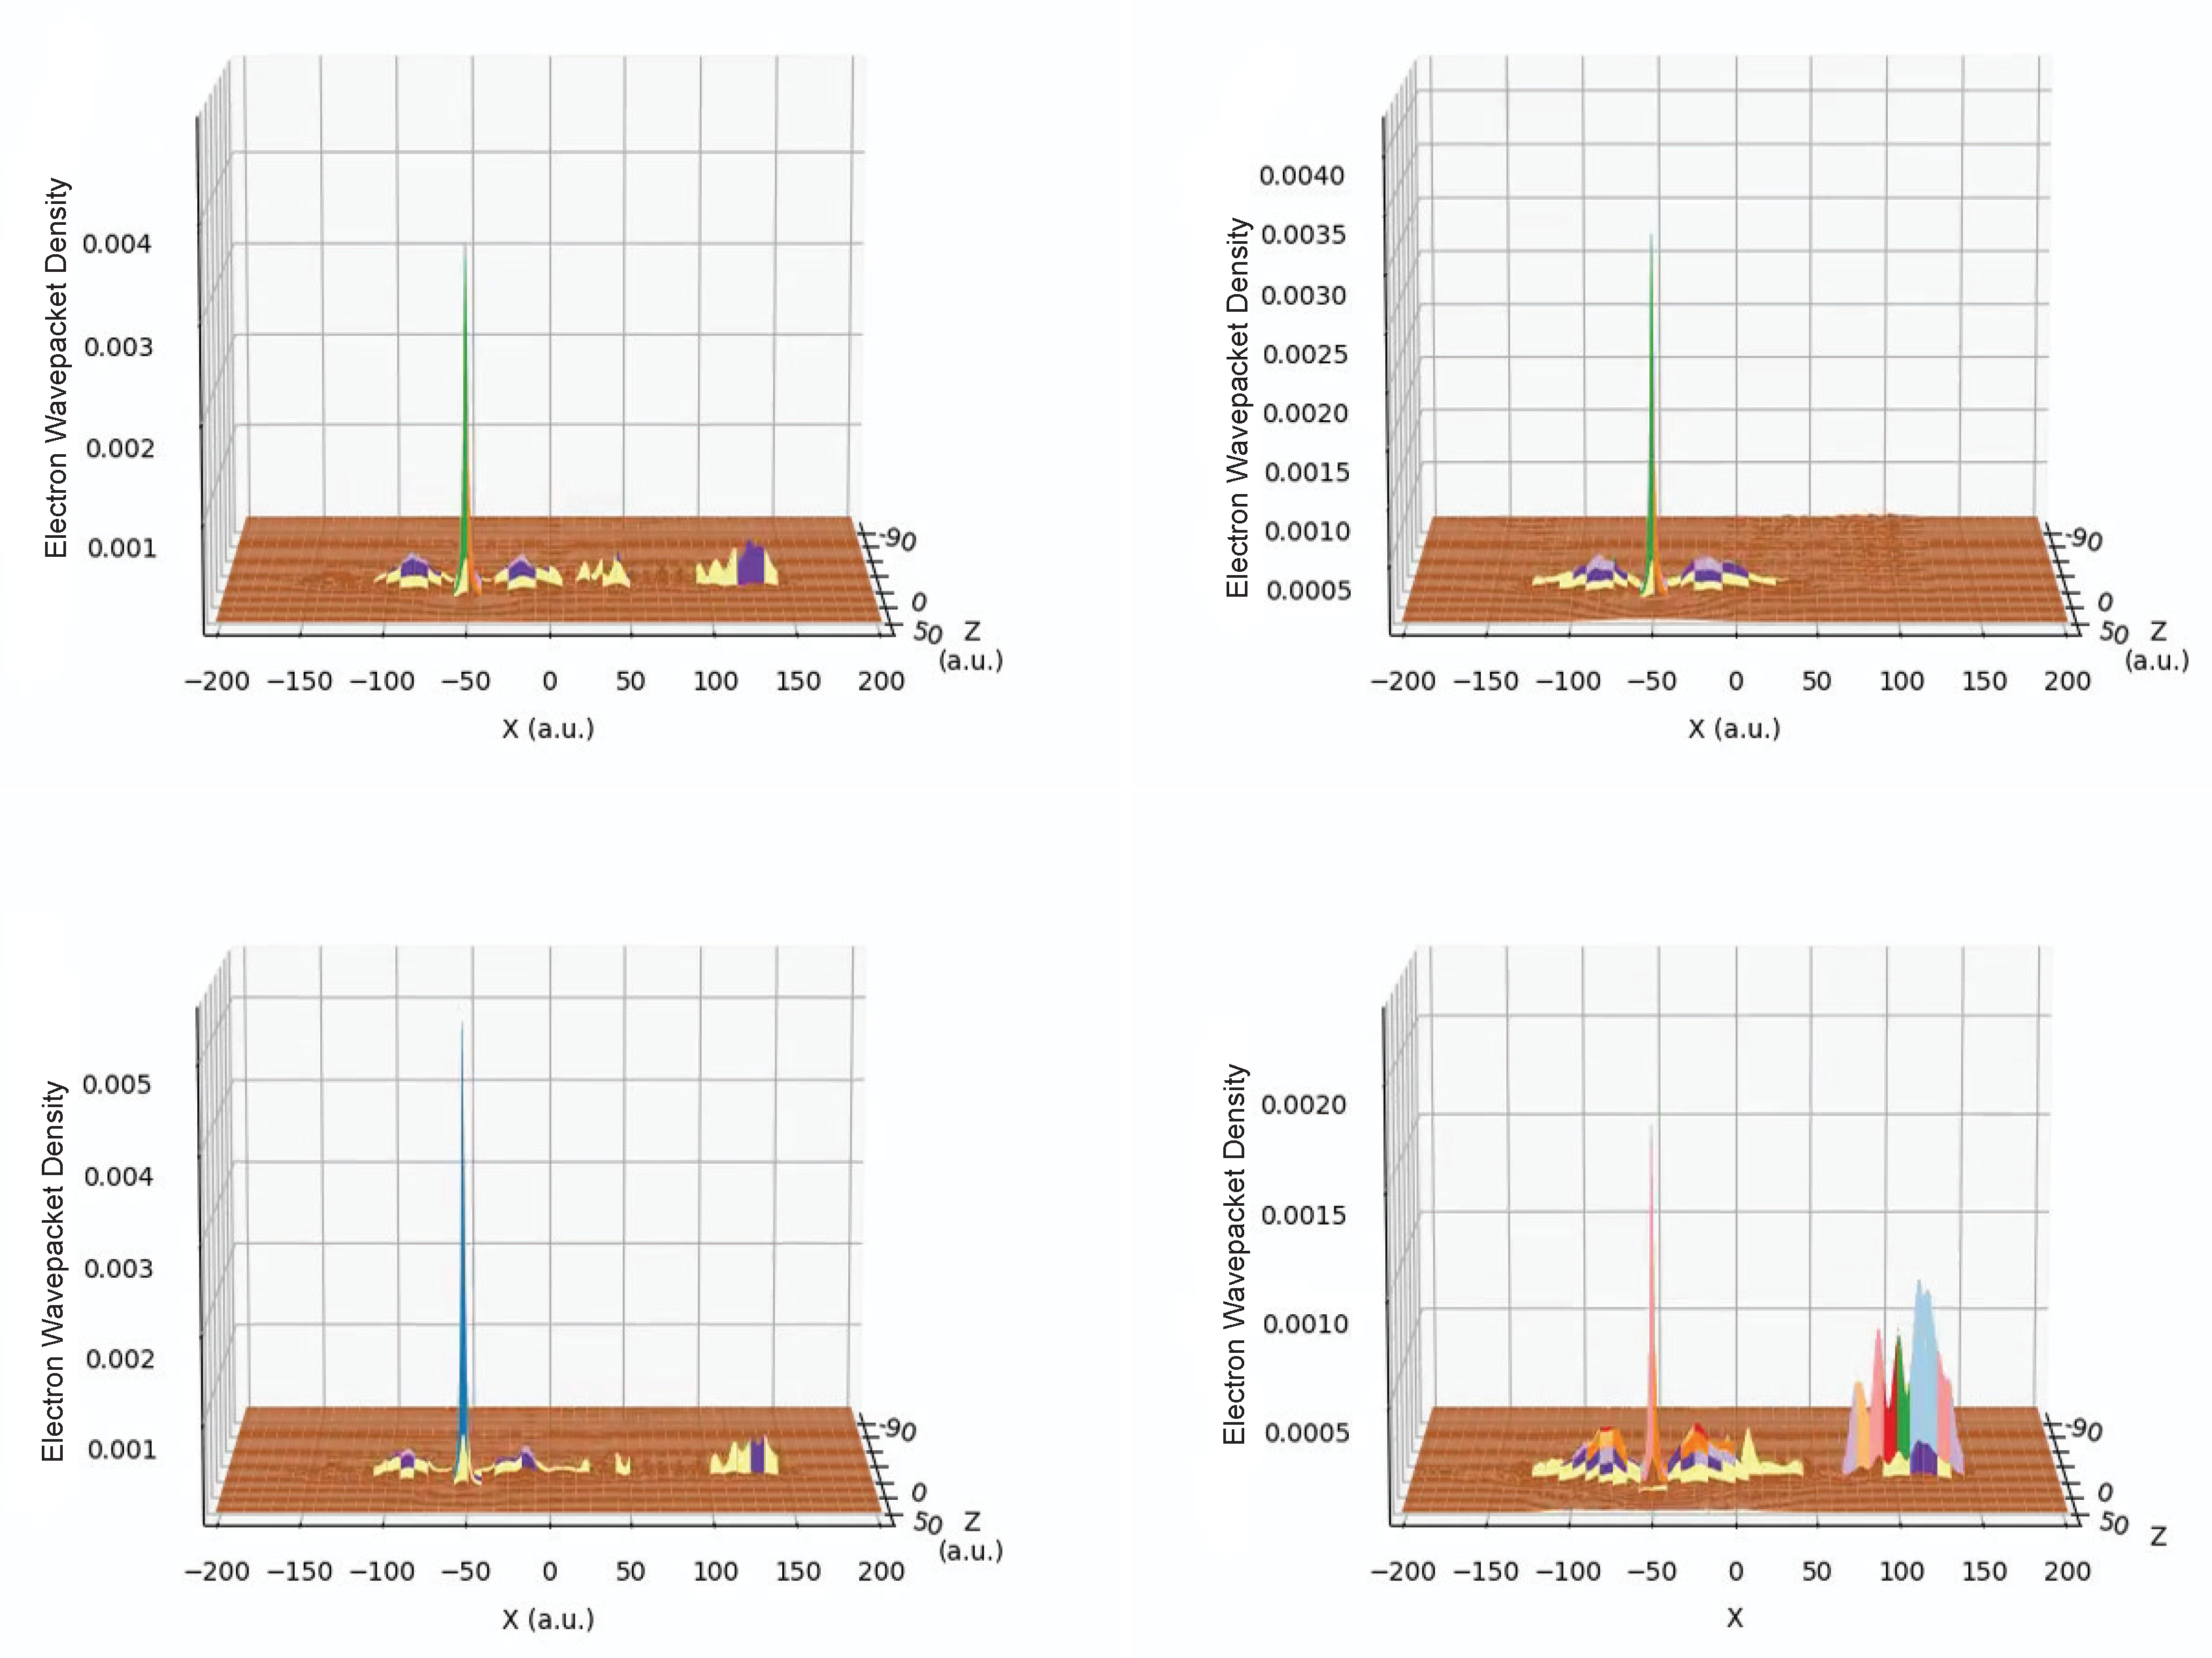
3.3. Wave Packet Density Dynamics

As the hydrogen ion moves toward the surface, the ion survival amplitude given by Equation (4) evolves in time. When the ion gets close to the surface, the probability amplitude Equation (5) can be zero at one or more locations. The electron is therefore transferring back and forth between the metal and the ion at the close vicinity of the surface. Therefore, it is important to understand the RCT process by which the electron populates the states of the metal. This was done by a detailed analysis of the wave packet probability density in our previous publication [13]. Superimposed subband modulations due to vicinal texture on flat substrates are found to form peaks and valleys in Figure 4, Figure 5 and Figure 6 of the survival probability. The effect originates from an interference pattern formed from the probability waves reflecting back and forth between the vicinal steps of the surface. These interference patterns can be seen in the surface and image state pulses (labeled 0 and 1 respectively) shown in the panels of Figure 8 for the different metals. Figure 8 shows snapshots, all at the same instant and for d = 5 a s , from animations of the wave packet probability density as a function of time. In Figure 8, the ion moves from the right to the left heading toward the surface. The surface of the metal is at z = 0 and the ion is closest to the surface at x = 0 . For Cu(111), Figure 8b is included for when the ion is aimed at the step. In the other snapshots, the ion is aimed at a point midway between the steps. Note that for Au(100), Figure 8c, the surface state peaks are decaying into the bulk of the metal, whereas the surface state peaks for Cu(111) and Pd(111), Figure 8a,b,d, remain at the surface of the metal. This can be understood from the dispersions shown in Figure 7. For Au(100) the surface state energy is in the valence band, so the electron decays from the surface state into the bulk of the metal. For Cu(111) and Pd(111) the surface state energy is in the band gap so the electron stays in this surface state much longer. The image state stays just outside the surface for all three metals as the image state energies are all within the band gap with the exception of the second image state for Cu(111) which is in the conduction band. Therefore, an electron captured in the second image state would quickly decay into the bulk of the metal via the conduction band.

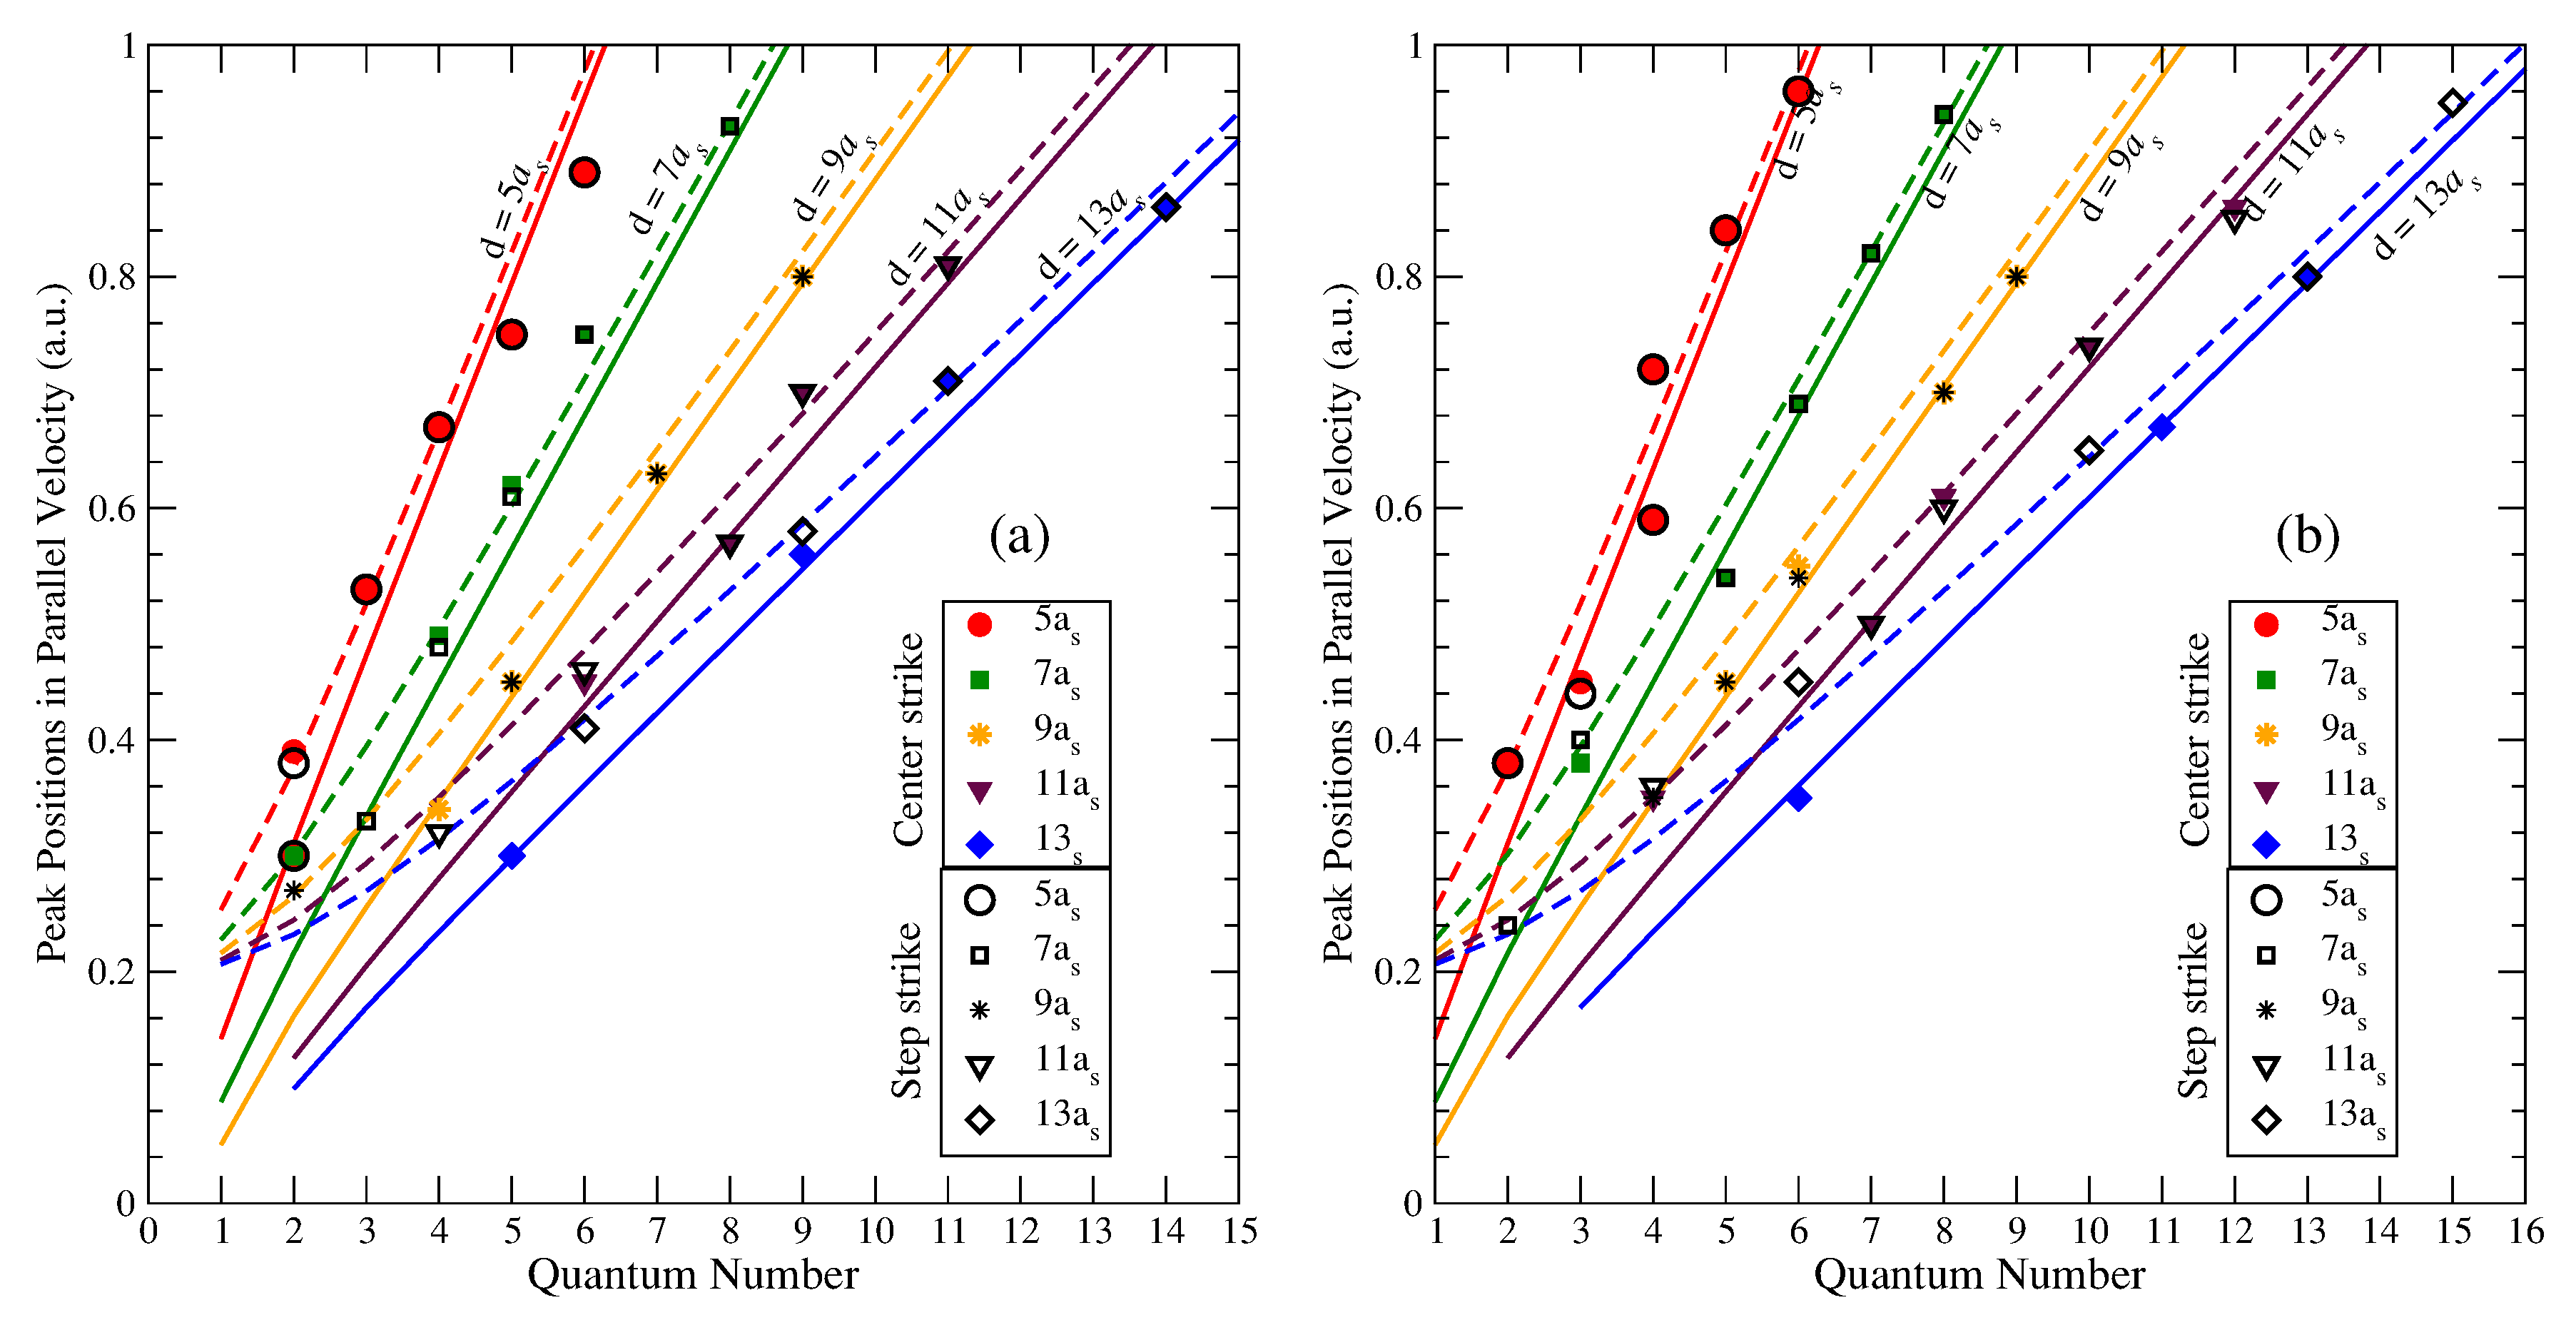
3.4. Superlattice States from Lateral Confinement

As discussed in Ref. [13], when electrons move along a vicinal surface, the probability wave will both transmit through the steps and reflect from the steps producing interference. This will cause subbands in the x-direction, with the reciprocal vector 2 π / d , which zone-folds [7,13] the surface and image states subbands, which are populated. We demonstrated earlier [13] and also noted in the current discussion that the depleted ion has the greatest likelihood to recapture electron probability from the lowest image state bands. When the parallel energy of the ion intersects a subband image state dispersion, a resonance-like condition is reached. We expect this to cause the recapture rate of the ion to increase. This will, in turn, cause peaks in the survival probability, as shown in Figure 4, Figure 5 and Figure 6.
One basic way to show that the peaks in survival probability are due to such interference effects from parallel confinements described above is to compare our results with predictions of an infinite square well potential. When the barrier becomes infinite, the subband dispersions become flat quantum levels as shown in our previous publication [13]. Therefore, this can still qualitatively guide us in predicting the positions of the peaks in survival probability as we will now show. The standing wave wavelengths allowed in the infinite square well model are given by λ n = 2 d / n , where d is the width of the square well and n is a positive, non-zero, integer that we shall call the quantum number. For an electron in the square well, the quantized kinetic energy is therefore given by n π / d 2 2 . By energy conservation in the RCT process, this kinetic energy is equal to the ion’s parallel kinetic energy, ( v par ) 2 / 2 , plus the transition energy from the ion level to an image level. Solving for v par gives
v par = 2 ( n π / d 2 ) 2 + E ion E
where E is the energy of the image state for a flat surface. This is the predicted parallel velocity that will give a peak in the survival probability. In Equation (8), we entirely neglected the ion kinetic energy in the normal direction since the v nor value chosen is miniscule, and also disregarded the shift of the ion level.
Plots of Equation (8) are shown in Figure 9, Figure 10 and Figure 11. The plots are done for d = 5, 7, 9, 11 and 13 a.u. and for two different values of the energy E: the first image state (solid line) and the second image state (dashed line). The values of v par that give peaks in Figure 4, Figure 5 and Figure 6 are also shown in the graphs as symbols: solid symbols for the ion striking the midpoint between two steps and dashed symbols for the ion striking the top of a step. As can be seen in these plots, most all of the symbols are fairly close to the lines graphed for our square well model. This is remarkable, given the simplicity of our model. After all, in reality, the ion is not interacting with an infinite square well but with a subband due to periodic wells, and there are other image states in the Rydberg series of of states that we have ignored. As for the other image states, the parallel velocities associated with these states via Equation (8) are extremely close to the value for the second image state.
Some detailed observations can be made in Figure 9, Figure 10 and Figure 11. We expect the quantum number of standing probability waves associated with a particular distance between steps, d, to increase with increasing d. This is what is observed. We further expect that the wavelength will not change for a particular velocity. Furthermore, as the parallel velocity, v par , increases, the quantum number of the corresponding standing wave should also increase since the wavelength decreases. Such expected patterns are generally evidenced in the results as well. There is one feature in the comparison between the results and the model for all three systems which is unexpected: There are intermittently missing bands for d = 9 a s and 13 a s . We think that this is probably due to forbidden gaps in the subband structure for corresponding vicinal terrace widths. Furthermore, note that the resonance peak positions for the two different strikes quickly merge into the same graph for d = 5 but they merge more slowly as d increases. In fact, for d = 5 the step strike and midpoint strike peaks occur at the same points, whereas for d = 13 they occur at the same points only for higher values of v par . This is also the trend the model curves indicate.
We may further note that, owing to the slightly different image state energies E among the substrate surfaces considered (see Figure 7), the model Equation (8) plots slightly different curves from one metal to the other even for a given image state. As already pointed out in Section 3.1, this is likely the prime reason why the peak positions in ion survival for a given step size d suffer a small offset from one vicinal surface to the other. Furthermore, small differences between the peak positions for the choice of BZ versus BSL trajectory for a given vicinal surface, as noted in Section 3.1, are clearly evident by noting the positions of the symbols with respect to the model lines which are independent of a trajectory.

4. Conclusions

Using a fully quantum mechanical wave packet propagation methodology we computed the electron wave packet density as a function of position and time when a hydrogen anion is scattered at small angles from a metal surface. This was done for vicinal surfaces that can be prepared by miscutting substrates Cu(111), Au(100), and Pd(111) along the terrace of selected sizes. Lacking a completely ab initio potential we mimicked a vicinal surface with a Kronig-Penny potential model mounted on a parametrized flat surface potential based on ab initio calculations. The results of our simulations allowed us to produce video animations of the electron wave packet density as the ion scatters from the surface. The animations allowed us to identify the surface state and first two image states as the most likely subband states for the electron to undergo resonant charge transfer to. We also calculated the ion survival probability and found series of maxima in the results as a function of the parallel velocity and the distance between adjacent vicinal steps. This proves the aptness of our propagation methodology to study RCT tunneling between anions and surfaces with superperiodicity in the nanoscale range. The interpretation of the detailed differences in the RCT dynamics, in general, and the subband resonance signals, in particular, for the choices of substrate surfaces are motivated by the interference between substrate and vicinal step dispersions. The role of ion-surface effective time of interaction by selecting two different classical trajectories is unveiled. Though a single-active-electron model was used in the calculations, the recapture rate can only be enhanced by effects of electron correlations impeding decay into the bulk from the Pauli blockade. The results of our calculations can be observed in grazing electron spectroscopy experiments using current laboratory technology. A full 3D simulation would be required, however, to observe the effects of an azimuthal rotation of the scattering surface which may form a part of the future research. We further observed that the results do not depend on where the ion strikes the vicinal surface when the parallel velocity is in the higher part of it’s range (results not shown here, but was demonstrated previously [13]). This provides some welcoming experimental freedom.
As a final remark, RCT studies of negative ions in grazing scattering off vicinally stepped metal surfaces provides an excellent means of probing subband dispersions in the vicinal superlattice. The simplest way to do this is to use a small, constant ion velocity component normal to the surface while varying the ion velocity component parallel to the surface. This will eliminate the effects of the band structure normal to the surface. It is true that the results in Figure 4, Figure 5 and Figure 6 show variations in the range of ±0.2% to ±0.4% for an ion survival probability of about 2.5%. But experimentally though, an ion fraction as small as 0.1% has been measured for flat surfaces with an error of about ±0.1% [22] using similar ion velocities used in our work. Therefore, we believe that features of the predictions in our study should be experimentally observable.

Author Contributions

Conceptualization, H.S.C.; Methodology, J.S. and H.S.C.; Software, D.M.; Validation, J.S. and H.S.C.; Formal Analysis, J.S., Y.Z. and D.D.; Investigation, J.S., Y.Z. and D.D.; Resources, J.S., D.M. and H.S.C.; Data Curation, J.S. and D.M.; Writing—Original Draft Preparation, J.S.; Writing—Review & Editing, H.S.C.; Visualization, J.S. and D.M.; Supervision, J.S.; Project Administration, J.S. and H.S.C.; Funding Acquisition, J.S., D.M. and H.S.C.

Funding

This research was funded by an Extreme Science and Engineering Discovery Environment (XSEDE) allocation Grant for high performance computation, which is supported by National Science Foundation (NSF) grant number ACI-1053575. The research was also supported in part by NSF Grant Number PHY-1806206.

Acknowledgments

The authors acknowledge the Texas Advanced Computing Center (TACC) at the University of Texas at Austin for providing HPC resources that have contributed to the research results reported within this paper. URL: http://www.tacc.utexas.edu.

Conflicts of Interest

The authors declare no conflict of interest. The founding sponsors had no role in the design of the study; in the collection, analysis, or interpretation of data; in the writing of the manuscript, and in the decision to publish the results.

Abbreviations

The following abbreviations are used in this manuscript:
RCTResonant charge transfer
KPKronig-Penney
BZBiersack-Ziegler
BSLBroken straight line
C.B.Conduction band

References

  1. Pratt, S.J.; Jenkins, S.J. Beyond the surface atlas: A roadmap and gazetteer for surface symmetry and structure. Surf. Sci. Rep. 2007, 62, 373. [Google Scholar]
  2. Tegenkamp, C. Vicinal surfaces for functional nanostructures. J. Phys. Condens. Matter 2009, 21, 013002. [Google Scholar] [CrossRef]
  3. Schiller, F.; Ruiz-Osés, M.; Cordón, J.; Ortega, J.E. Scattering of Surface States at Step Edges in Nanostripe Arrays. Phys. Rev. Lett. 2005, 95, 066805. [Google Scholar] [CrossRef] [Green Version]
  4. Didiot, C.; Pons, S.; Kierren, B.; Fagot-Revurat, Y.; Malterre, D. Nanopatterning the electronic properties of gold surfaces with self-organized superlattices of metallic nanostructures. Nat. Nanotechnol. 2007, 2, 617. [Google Scholar] [CrossRef]
  5. Suzuki, K.; Kanisawa, K.; Janer, C.; Perraud, S.; Takashina, K.; Fujisawa, T.; Hirayama, Y. Spatial imaging of two-dimensional electronic states in semiconductor quantum wells. Phys. Rev. Lett. 2007, 98, 136802. [Google Scholar] [CrossRef]
  6. Bolz, A.; Meyer, C.; Heyn, C.; Hansen, W.; Morgenstern, M.; Wiesendanger, R. Wave-function mapping of InAs quantum dots by scanning tunneling spectroscopy. Phys. Rev. Lett. 2007, 98, 196804. [Google Scholar]
  7. Mugarza, A.; Ortega, J.E. Electronic sta tes at vicinal surfaces. J. Phys. Condens. Matter 2003, 15, S3281. [Google Scholar] [CrossRef]
  8. Mugarza, A.; Mascaraque, A.; Pérez-Dieste, V.; Repain, V.; Rousset, S.; García de Abajo, F.J.; Ortega, J.E. Electronic Confinement in Surface States on a Stepped Gold Surface Revealed by Angle-Resolved Photoemission. Phys. Rev. Lett. 2001, 87, 107601. [Google Scholar] [CrossRef]
  9. Ortega, J.E.; Speller, S.; Bachmann, A.R.; Mascaraque, A.; Michel, E.G.; Narmann, A.; Mugarza, A.; Rubio, A.; Himpsel, F.J. Electronic wave function at vicinal surfaces: Switch from terrace to step modulation. Phys. Rev. Lett. 2000, 84, 6110. [Google Scholar] [CrossRef]
  10. Baumberger, F.; Greber, T.; Osterwalder, J. Fermi surfaces of the two-dimensional surface states on vicinal Cu(111). Phys. Rev. B 2001, 64, 195411. [Google Scholar] [CrossRef]
  11. Baumberger, F.; Greber, T.; Osterwalder, J. Step-induced one-dimensional surface state on Cu(332). Phys. Rev. B 2000, 62, 15431. [Google Scholar] [CrossRef]
  12. Lei, J.; Sun, H.; Yu, K.W.; Louie, S.G.; Cohen, M.L. Image potential states on periodically corrugated metal surfaces. Phys. Rev. B 2001, 63, 045408. [Google Scholar] [CrossRef]
  13. Shaw, J.; Monismith, D.; Zhang, Y.; Doerr, D.; Chakraborty, H.S. Ion Survival in grazing collisions of H with vicinal nanosurfaces as a probe for subband electronic structures. Phys. Rev. A 2018, 98, 052705. [Google Scholar] [CrossRef]
  14. Rabalais, J.W. Principles and Applications of Ion Scattering Spectrometry: Surface Chemical and Structural Analysis; Wiley-Interscience: Hoboken, NJ, USA, 2003. [Google Scholar]
  15. Stout, K.J.; Blunt, L. Three-Dimensional Surface Topography; Penton Press: London, UK, 2000. [Google Scholar]
  16. Korkin, A.; Labanowski, J.; Gusev, E.; Luryi, S. (Eds.) Nanotechnology for Electronic Materials and Devices; Springer: New York, NY, USA, 2007. [Google Scholar]
  17. Campbell, S.A. The Science and Engineering of Microelectronic Fabrication; Oxford University Press: New York, NY, USA, 2001. [Google Scholar]
  18. Canario, A.R.; Sanchez, E.A.; Bandurin, Y.; Esaulov, V.A. Growth of Ag nanostructures on TiO2(110). Surf. Sci. Lett. 2003, 547, L887. [Google Scholar] [CrossRef]
  19. Bahrim, B.; Makarenko, B.; Rabalais, J.W. Band gap effect on H ion survival near Cu surfaces. Surf. Sci. 2005, 594, 62. [Google Scholar] [CrossRef]
  20. Yang, Y.; Yarmoff, J.A. Charge exchange in Li scattering in Si surfaces. Phys. Rev. Lett. 2002, 89, 196102. [Google Scholar] [CrossRef]
  21. Hecht, T.; Winter, H.; Borisov, A.G.; Gauyacq, J.P.; Kazansky, A.K. Role of the 2D surface state continuum and projected band gap in charge transfer in front of Cu(111) surface. Phys. Rev. Lett. 2000, 84, 2517. [Google Scholar] [CrossRef]
  22. Guillemot, L.; Esaulov, V.A. Interaction time dependence of electron tunneling processes between an atom and a surface. Phys. Rev. Lett. 1999, 82, 4552. [Google Scholar] [CrossRef]
  23. Sanchez, E.; Guillemot, L.; Esaulov, V.A. Electron transfer in the interaction of Flourine and Hydrogen with Pd(100). Phys. Rev. Lett. 1999, 83, 428. [Google Scholar] [CrossRef]
  24. Gainullin, I.K.; Sonkin, M.A. Three-dimensional effects in resonant charge transfer between atomic particles and nanosystems. Phys. Rev. A 2015, 92, 022710. [Google Scholar] [CrossRef]
  25. Hakala, T.; Puska, M.J.; Borisov, A.G.; Silkin, V.M.; Zabala, N.; Chulkov, E.V. Excited states of Na nanoislands on the Cu(111) surface. Phys. Rev. B 2007, 75, 165419. [Google Scholar] [CrossRef] [Green Version]
  26. Obreshkov, B.; Thumm, U. Neutralization of H near vicinal metal surfaces. Phys. Rev. A 2006, 74, 012901. [Google Scholar] [CrossRef]
  27. Chakraborty, H.S.; Niederhausen, T.; Thumm, U. Resonant neutralization of H near Cu surfaces: Effects of the surface symmetry and ion trajectory. Phys. Rev. A 2004, 70, 052903. [Google Scholar] [CrossRef]
  28. Chakraborty, H.S.; Niederhausen, T.; Thumm, U. Effects of the surface Miller index on the resonant neutralization of hydrogen anions near Ag surfaces. Phys. Rev. A 2004, 69, 052901. [Google Scholar] [CrossRef] [Green Version]
  29. Chakraborty, H.S.; Niederhausen, T.; Thumm, U. On the effect of image states on resonant neutralization of hydrogen anions near metal surfaces. Nucl. Instrum. Methods B 2005, 241, 43. [Google Scholar] [CrossRef]
  30. Schmitz, A.; Shaw, J.; Chakraborty, H.S.; Thumm, U. Band-gap-confinement and image-state-recapture effects in the survival of anions scattered from metal surfaces. Phys. Rev. A 2010, 81, 042901. [Google Scholar] [CrossRef]
  31. Swamy, K.; Bertel, E.; Vilfan, I. Step interaction and relaxation at steps: Pt(110). Surf. Sci. 1999, 425, 369. [Google Scholar] [CrossRef]
  32. Chulkov, E.V.; Silkin, V.M.; Echenique, P.M. Image potential states of metal surfaces: Binding energies and wave functions. Surf. Sci. 1999, 437, 330. [Google Scholar] [CrossRef]
  33. Chulkov, E.V.; Silkin, V.M.; Echenique, P.M. Image potential states on lithium, copper and silver surface. Surf. Sci. 1997, 391, L1217. [Google Scholar] [CrossRef]
  34. Ermoshin, V.A.; Kazansky, A.K. Wave packet study of H decay in front of a metal surface. Phys. Lett. A 1996, 218, 99. [Google Scholar] [CrossRef]
  35. Press, W.H.; Teukolsky, S.A.; Vetterling, W.T.; Flannery, B.P. Numerical Recipes: The Art of Scientific Computing; Cambridge University Press: Cambridge, UK, 2007. [Google Scholar]
  36. Biersack, J.P.; Ziegler, J.F. Refined universal potentials in atomic collisions. Nucl. Instrum. Methods 1982, 194, 93. [Google Scholar] [CrossRef]
  37. Borisov, A.G.; Teillet-Billy, D.; Gauyacq, J.P.; Winter, H.; Dierkes, G. Resonant charge transfer in grazing scattering of alkali-metal ions from an Al(111) surface. Phys. Rev. B 1996, 54, 17166. [Google Scholar] [CrossRef]
  38. Mueller, F.M.; Freemant, A.J.; Dimmock, J.O.; Furdyna, A.M. Electronic structure of palladium. Phys. Rev. B 1970, 1, 4617. [Google Scholar] [CrossRef]
  39. Winter, H. Charge transfer in grazing ion-surface scattering. Commts. At. Mol. Phys. 1970, 26, 287. [Google Scholar]
  40. Osma, J.; Sarria, I.; Chulkov, E.V.; Pitarke, J.M.; Echenique, P.M. Role of the intrinsic surface state in the decay of image states at a metal surface. Phys. Rev. B 1999, 59, 10591. [Google Scholar] [CrossRef]
  41. Gao, S.; Langreth, D.C. Image state mediated electron transfer at surfaces. Surf. Sci. Lett. 1998, 398, L314. [Google Scholar] [CrossRef]
  42. Chulkov, E.V.; Sarria, I.; Silkin, V.M.; Pitarke, J.M.; Echenique, P.M. Lifetimes of Image-Potential States On Copper Surfaces. Phys. Rev. Lett. 1998, 80, 4947. [Google Scholar] [CrossRef]
Figure 1. The one-dimensional Kronig-Penney potential [7] and the vicinal surface it models with terrace width (L) and step height (h).
Atoms 07 00089 g001
Figure 2. The potentials in one-dimension for the metals Cu(111) (top left), Au(100) (top right) and Pd(111) (bottom). The solid lines are the one-dimensional (z) parametric potentials of the flat surface [32], while the dashed lines show the addition of the potential, as in Figure 1, in the vicinal direction at one of its peaks, scaled by a factor of 2.8 and duly attenuated (see text). The dashed curve for Pd(111) is a z-section of Figure 3.
Atoms 07 00089 g002
Figure 3. Schematic of two-dimensional vicinal stepped potential on flat Pd(111) with d being five atomic layers developed using the Kroenig-Penny (KP) potential in Figure 1 which is super-imposed on the one-dimensional parametric potential of Pd(111) [32,33] in Figure 2 (bottom panel). The KP potential is attenuated going far from the precursor flat surface both towards the bulk and the vacuum. To aid visualization, the peaks of the KP potential are scaled by a factor of 2.8 in the figure. Note that the maximum vicinal peaks occur at z = 0 .
Atoms 07 00089 g003
Figure 4. H survival probability for one atomic-layer high vicinally stepped Cu(111) as a function of ion parallel velocity ( v par ) as H approaches the center of a terrace for the BZ trajectory (solid line) and the BSL trajectory (dashed line) for inter-step distance (d) of 5, 7, and 9 lattice spacings (a) and for d of 11 and 13 lattice spacings (b).
Atoms 07 00089 g004
Figure 5. Same as Figure 4, but for vicinally stepped Au(100).
Atoms 07 00089 g005
Figure 6. Same as Figure 4, but for vicinally stepped Pd(111).
Atoms 07 00089 g006
Figure 7. Dispersion relations for flat Cu(111), Au(100) and Pd(111) substrates assuming a translationally invariant surface and an electron velocity component in the surface plane. We show the Fermi energies only for completeness.
Atoms 07 00089 g007
Figure 8. Time-snapshots of the electron wave packet density: (a) for the vicinal Cu(111) of d = 5 a s at the time t where the ion strikes the center of the step; (b) for the vicinal Cu(111) of d = 5 a s at the same instant of (a) but where the ion strikes the peak of the step; (c) for the vicinal Au(100) of d = 5 a s at the same instant of (a) where the ion strikes the center of the step; (d) for the vicinal Pd(111) of d = 5 a s at the same instant of (a) where the ion strikes the center of the step. The electron wave packet density is a dimensionless fraction which is normalized to unity over all space.
Atoms 07 00089 g008
Figure 9. Comparison of the ion survival peak positions in the parallel velocity scale for various values of vicinal step separation d on Cu(111) with an analytic square well potential model, using the energy of the first (solid line) and second (dashed line) image state, and for the BZ trajectory (a) and the BSL trajectory (b).
Atoms 07 00089 g009
Figure 10. Same as Figure 9, but for Au(100) vicinal surface.
Atoms 07 00089 g010
Figure 11. Same as Figure 9, but for Pd(111) vicinal surface.
Atoms 07 00089 g011

