The Optogalvanic Spectrum of Neutral Lanthanum between 5610 and 6110 Å

Institute of Experimental Physics, Graz University of Technology, Petersgasse 16, A-8010 Graz, Austria
*
Author to whom correspondence should be addressed.
Atoms 2020, 8(2), 23; https://0-doi-org.brum.beds.ac.uk/10.3390/atoms8020023
Submission received: 22 April 2020
/
Revised: 11 May 2020
/
Accepted: 15 May 2020
/
Published: 19 May 2020
(This article belongs to the Section Atomic, Molecular and Nuclear Spectroscopy and Collisions)
Abstract
:We report on a complete optogalvanic spectrum of a discharge burning in a La-Ar gas mixture, in the spectral range 5610–6110 Å (17,851 to 16,364 cm−1). About 1900 overlapping laser scans, each between 1 and 1.5 cm−1 wide, were necessary to cover this range. The resolution of the spectra is limited by the Doppler width of the spectral features to about 0.03 cm−1 (or ca. 0.01 Å) and is comparable with a Fourier-transform spectrum, but the sensitivity is much higher. Indeed, we could find more than 1800 lines, from which about 800 could be classified as transitions between known energy levels. The main focus of the investigations was to discover previously unknown energy levels by means of excitation of unclassified spectral features.
1. Introduction
Lanthanum (La, Z = 57) has the electron ground state configuration [Xe]5d6s2 and an empty 4f shell, while for the elements with Z = 58 to 71 (called “lanthanides”) this 4f shell is partially filled, but the 6s2 shell is kept. The electronic structure and the spectrum of lanthanum are of special interest, not only for practical reasons but also for the theoretical description of it.
La in its natural composition consists mainly of one stable isotope (99.91%), with mass number 139, and a nuclear spin quantum number I = 7/2. Magnetic dipole moment and electric quadrupole moment of this isotope are well known: µI = 2.7830455(9) µN and Q = 0.20 (1) × 10−28 m2 [1].
LS-coupling designation of the ground level is 2D3/2. In the present investigation the second, long-living radioactive isotope with mass number 138 (0.09%) is not visible in the spectra and neglected.
A list of La spectral lines can be found, for example, in the MIT wavelength tables [2]. In the spectral range treated in this work (5610–6110 Å), 96 spectral lines belonging to the spectra of La I (neutral atom) or La II (first ion) are listed in those tables. The analysis of the spectra led to the list of energy levels summarized by Martin et al. in 1978 [3], where 80 even-parity and 156 odd-parity levels are given.
Since that time, more and more energy levels were discovered by various groups using laser spectroscopic methods, and their hyperfine (hf) structure constants A and B were in most cases also determined. The main focus of the present investigation was a search for previously unknown energy levels of La. Thus, we restrict the references mentioned here to those in which new levels were reported. The number of reported levels is given in parentheses: [4] (23), [5] (51), [6] (4), [7] (18), [8] (38), [9] (37), [10] (2), [11] (12), [12] (17), [13] (26), [14] (3), [15] (1), [16] (1), altogether 233 levels. Out of these new levels, only four have odd parity. In some recent studies also the Zeeman effect of La lines was studied by laser spectroscopic methods [17,18,19,20,21].
However, the list of energy levels is by far not complete. Limited by the scan range of the used source of tunable laser light (between 5610 and 6100 Å, corresponding to transition wave numbers between 17,851 and 16,364 cm−1), a complete optogalvanic spectrum was recorded in the present work in order to perform systematic investigations. About 1900 overlapping laser scans, each between 1 and 1.5 cm−1 wide, were necessary to cover this range. A small part of this spectrum was already treated in [16]. In the spectrum, more than 1800 spectral lines could be found, many more than listed in wavelength tables (e.g., [2]). Around 800 of these lines could be explained as transitions between already known energy levels due to their wavelength and their hf pattern. Additional information from a wavenumber calibrated Fourier-transform (FT) spectrum (see [22,23,24]) is also used.
A closer investigation of lines that could not be classified lead to the discovery of new energy levels. In this paper we report on 13 previously unknown energy levels. Further analysis of the spectrum is in progress.
2. Experiment
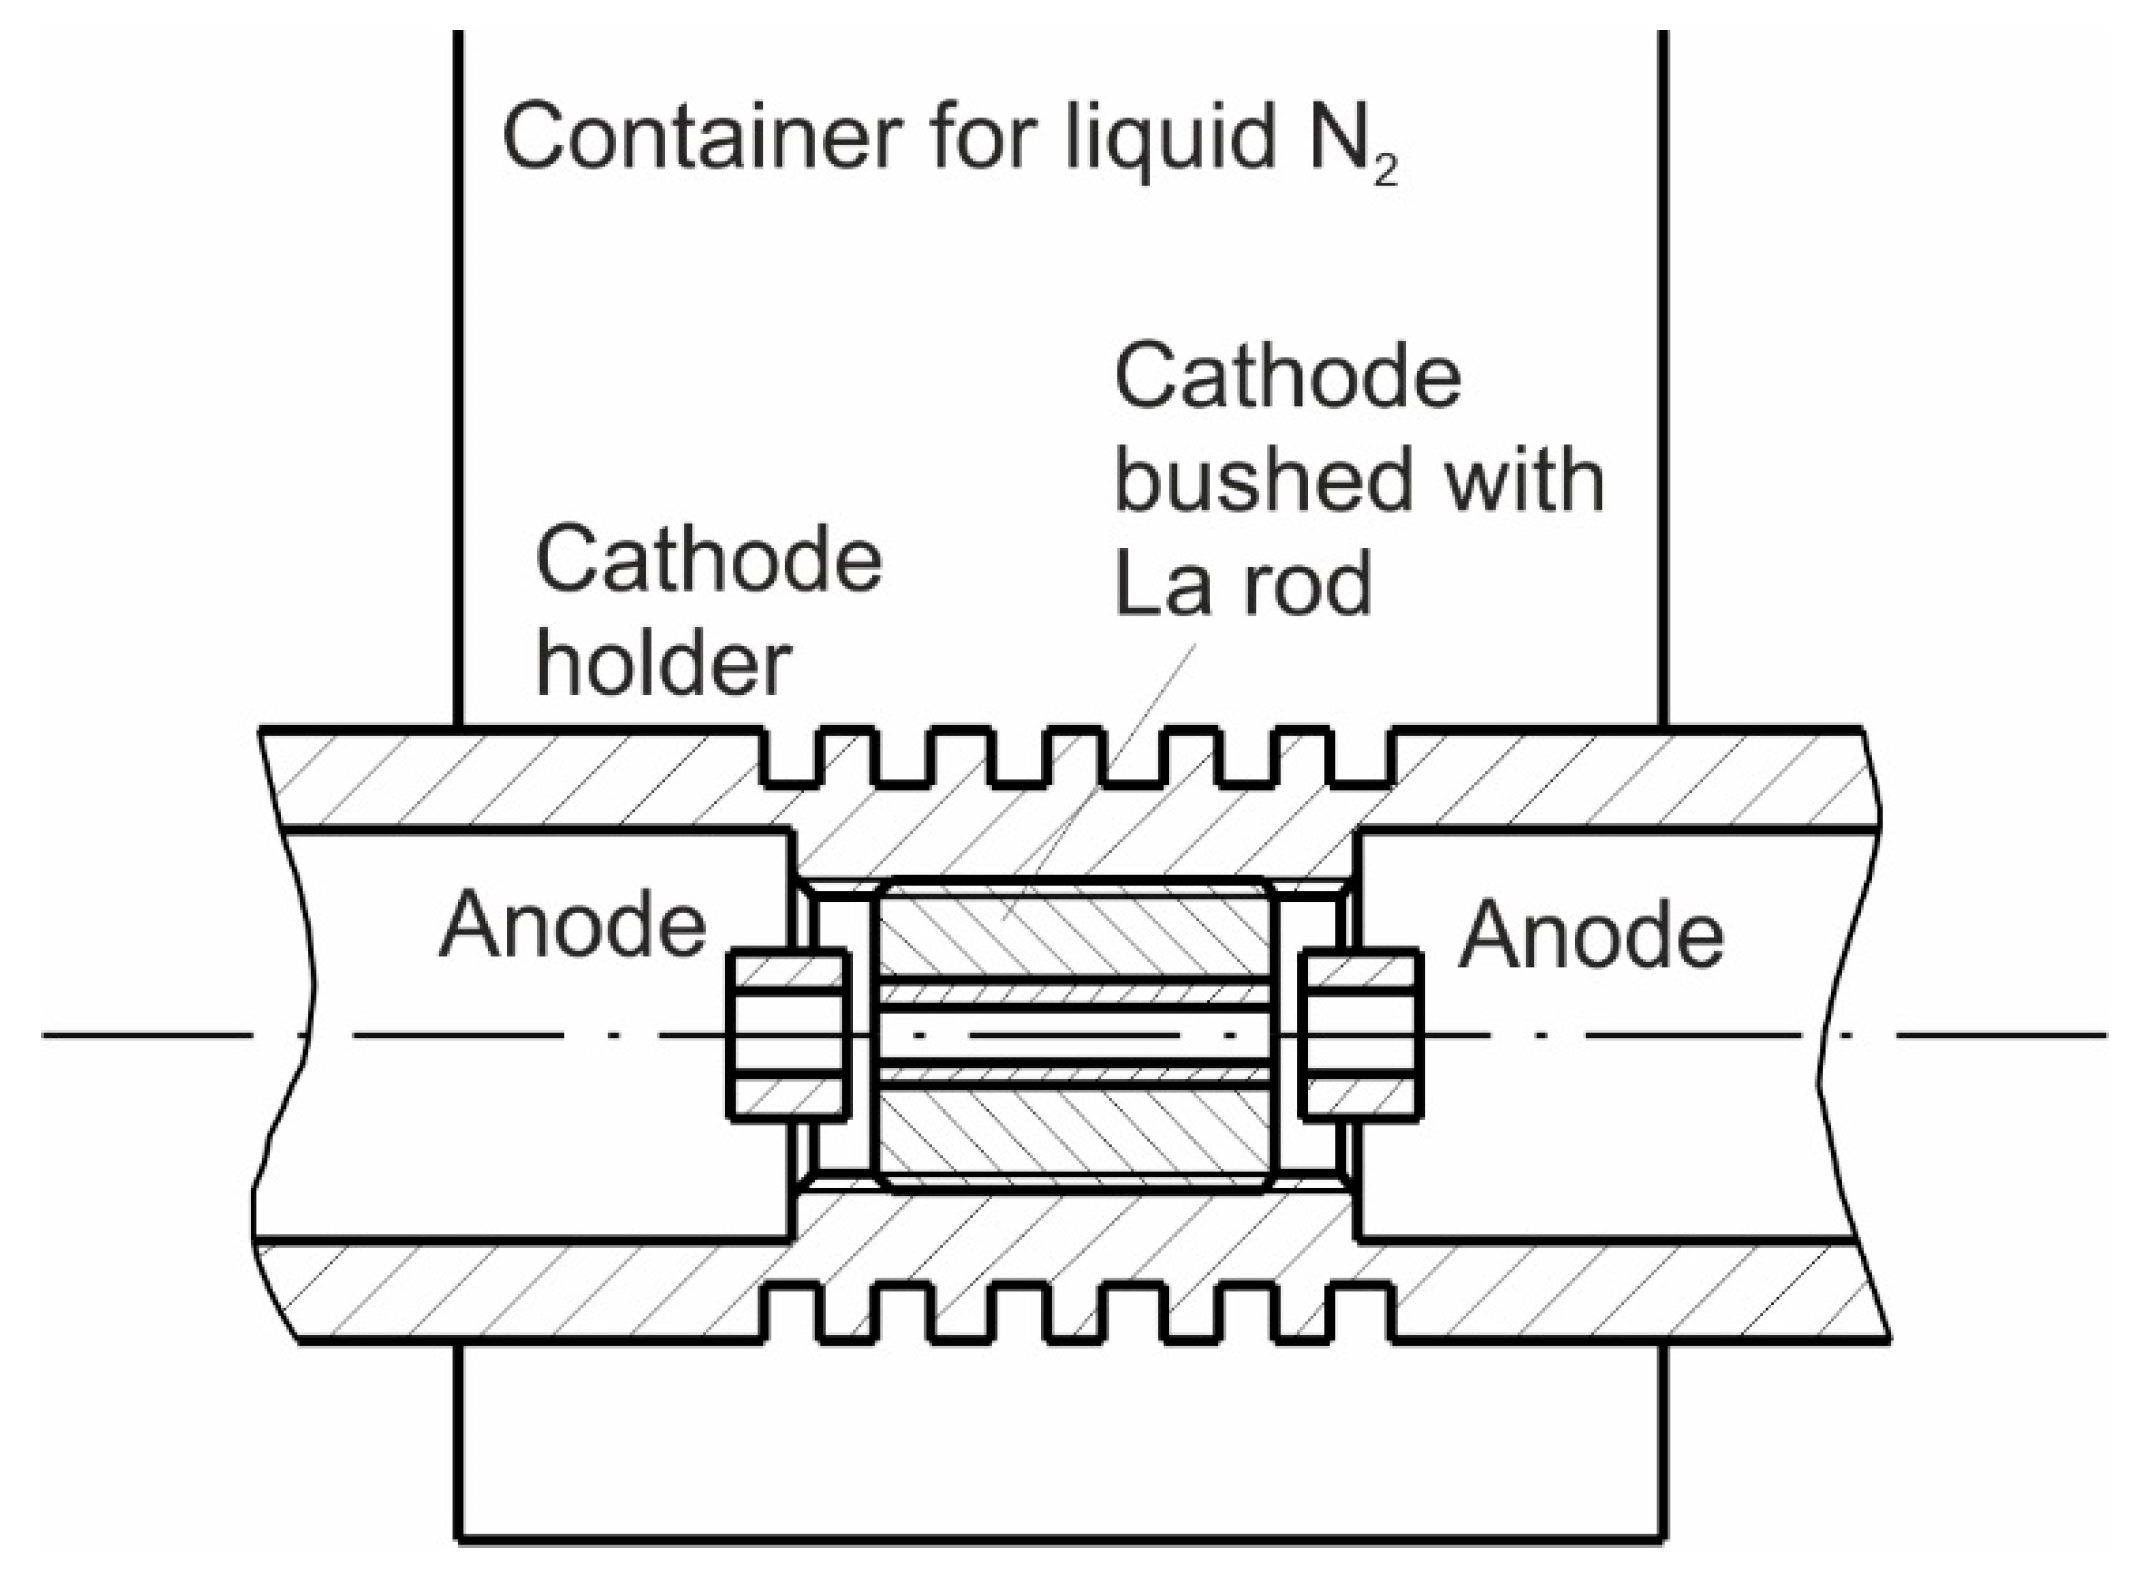
The source of free La atoms was a discharge, burning in an La-Ar-plasma. We used, as in several works before (e.g., [6]), a see-through hollow cathode discharge (Figure 1). The cylindric cathode had a length of 20 mm and was made of copper. The inner part of this cylinder was bushed out with a La rod of 6 mm in diameter, and in this La rod we drilled a hole of 3 mm in diameter. Two anode rings, made of aluminum, were mounted on both sides of the cathode, at a distance of ca. 0.8 mm from the La inset, by means of ceramic holders.
First the discharge housing was evacuated to approximately 10−3 mbar, then we filled in Ar with a pressure of ca. 0.2 mbar. After applying voltage, the discharge started in Ar (weak gray-blue light), but after some minutes a sputtering process set on and the discharge emitted bright white light, indicating that now the discharge was burning mainly in metal vapor. Ar was chosen since (i) heavier noble gases support more the sputtering process, and (ii) the appearance of Ar lines in the OG spectrum can be used for precise wavelength determination of La lines within the same record.
The power supply was operated in constant current mode at 90 mA. The discharge region was cooled by a bath of liquid nitrogen in order to (i) decrease the Doppler width of the spectral lines, (ii) to increase the sputtering efficiency, and (iii) to lower the electrical noise of the discharge.
Tunable laser light was generated by a homemade ring dye laser, using a Coherent “Verdi” laser (frequency-doubled Nd-based laser, 532 nm, 5–8 W) as pump laser. The scan range of the dye laser was increased to 1.5 cm−1 by an active regulation of the angle of the thin etalon. We used the R6G dye, and we were able to operate the laser between 5600 and 6110 Å. The output power was ca. 100 mW at the edges of the wavelength range and 500 mW at the center. Before entering the discharge region, the laser light was intensity-modulated by means of a mechanical chopper. For confirmation of newly found levels later also the dyes R110 and DCM were used, covering in total the range 5500–6800 Å.
Detected was either the optogalvanic (OG) signal (change of the power supply voltage in dependence of the laser wavelength) or the laser-induced fluorescence (LIF) light intensity, recorded by means of a lock-in amplifier, synchronized with the mechanical chopper. The light emitted from the discharge is focused by means of quartz lenses onto the entrance slit of a monochromator and the transmitted light is detected by a photo multiplier. The lock-in amplifier signal is different from zero only for lines which intensity is modulated with the chopper frequency, thus we did not notice the strong background emission of the discharge. In this way, a LIF signal was observed only if the population of the upper level of the LIF line was influenced by the laser excitation. By tuning the monochromator, we could find LIF lines and were able to determine their wavelengths. Moreover, when the monochromator was then set to a LIF wavelength, a laser scan showed the dependency of the LIF intensity versus laser frequency and mirrored the hf structure of the laser-driven transition.
The combination of all data (LIF and laser wavelengths and hf pattern of the investigated transition) allowed finding new energy levels as described in [15,16]. A sketch of the apparatus used can be found, for example, [12]. Besides lines of La I, we also find lines belonging to La II and to the carrier gas of the discharge (Ar I, Ar II). No lines belonging to cathode materials other than La (e.g., copper, aluminum) were found.
3. Optogalvanic Spectra
For taking OG spectra, the fact is used that laser excitation of a transition of a chemical element, participating on a gas discharge, changes the detailed equilibrium in the plasma. If the discharge is operated in constant current mode, the change of the voltage versus laser frequency mirrors the probability of excited transitions. We tried also to operate the discharge in constant voltage mode. In this mode, the voltage drop on a ballast resistor is proportional to the OG signal. There was no difference in the SNR of the OG records, and we worked in constant current mode. Usually, the voltage change is quite small, thus one needs very sensitive detection methods, such as phase-sensitive amplification, performed by a mechanical chopper modulating the laser light intensity and a lock-in amplifier.
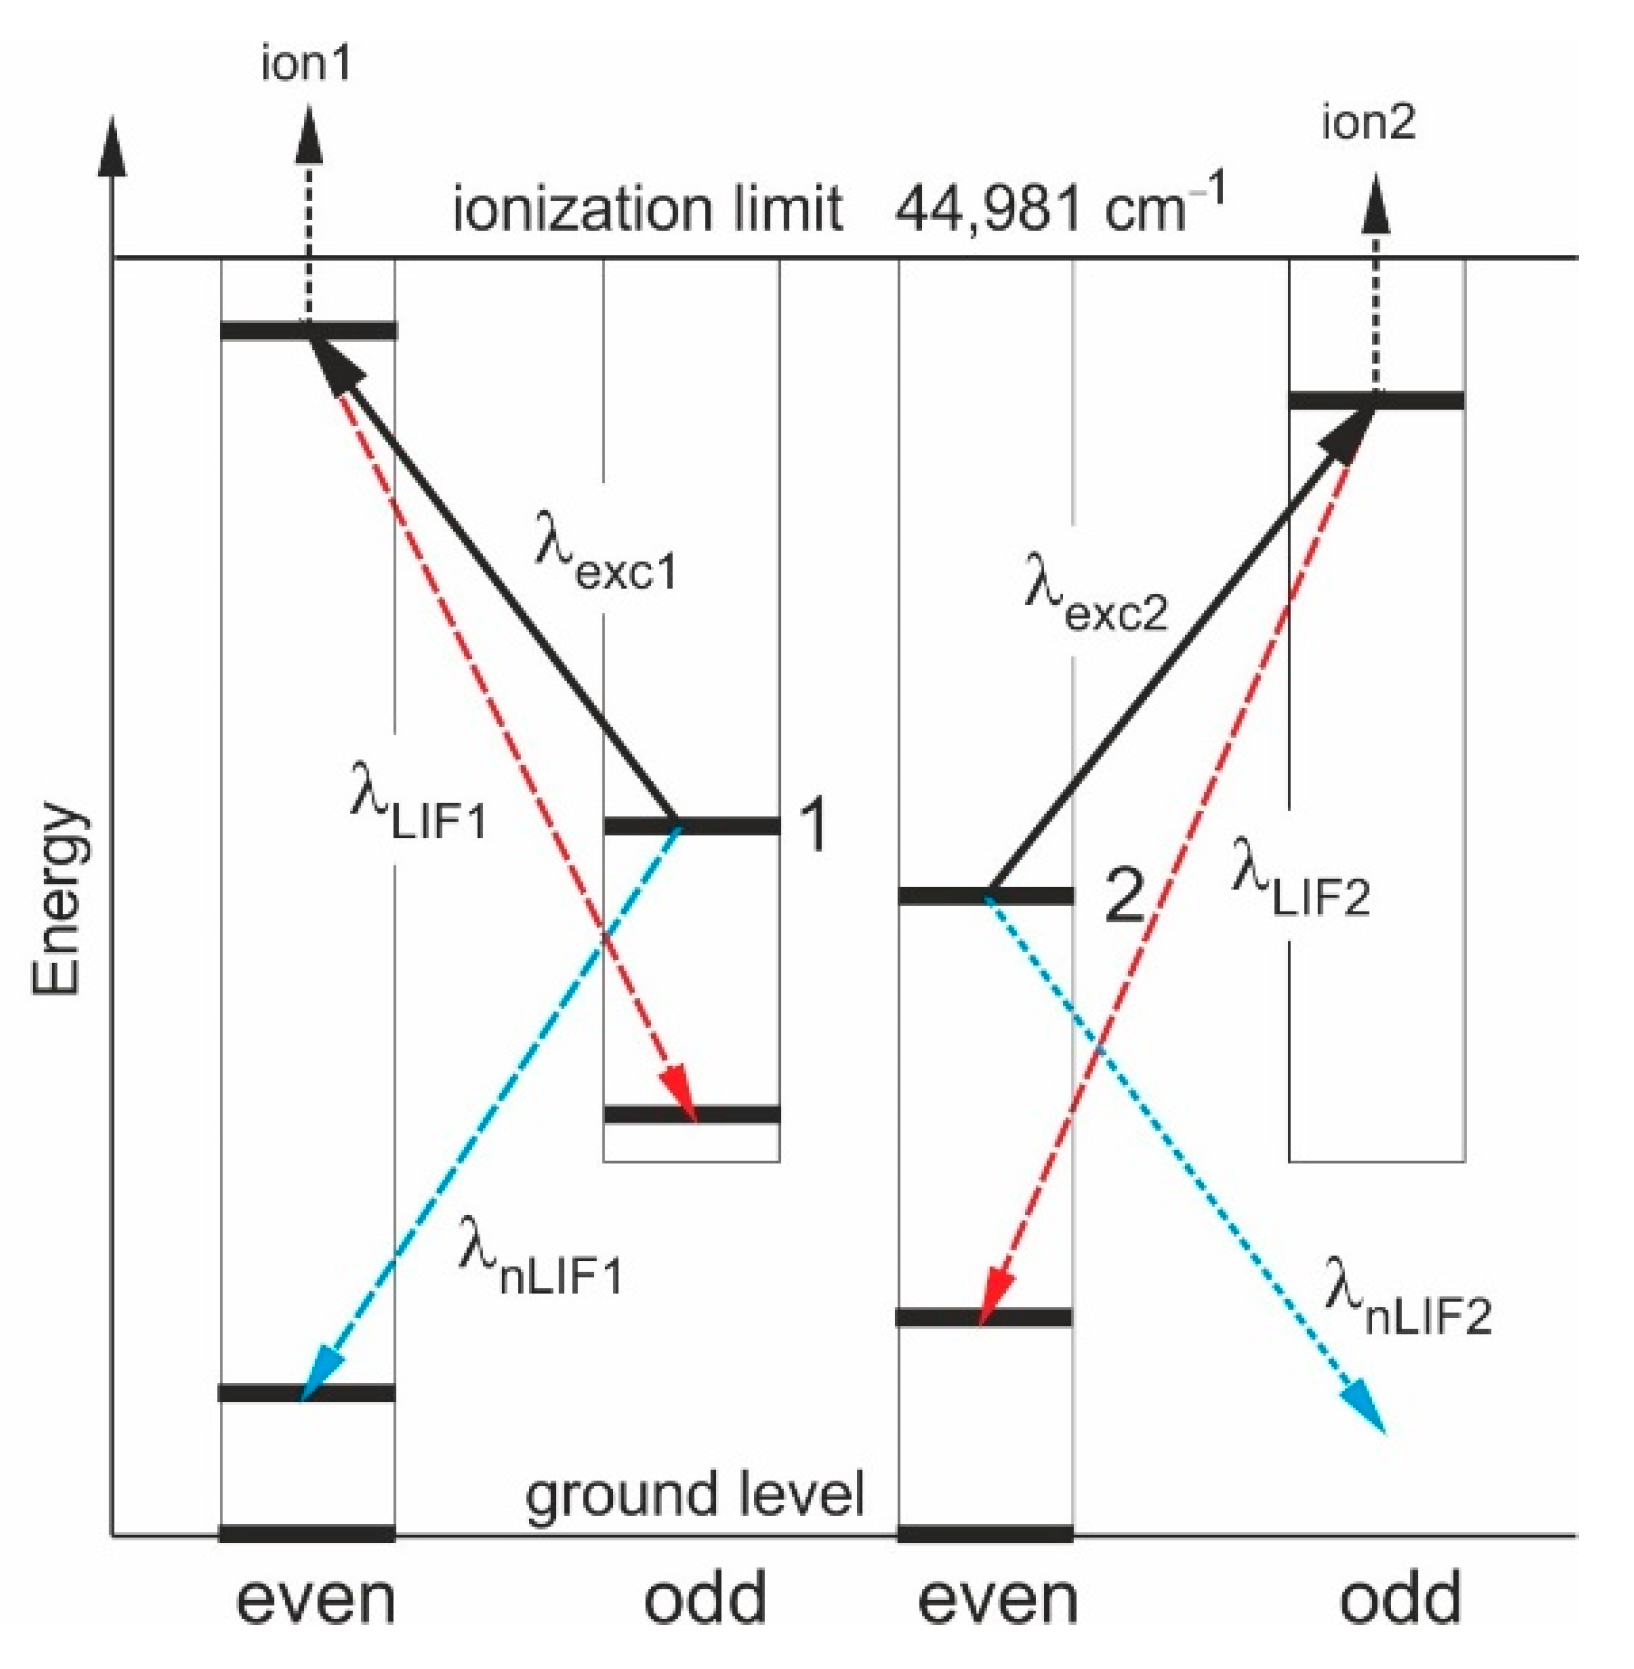
Let us consider the general level structure of La atoms shown in Figure 2 (given in more detail in [4]). Even-parity levels are distributed between the ground state and the ionization limit, while the lowest odd-parity level has an energy of 13,260 cm−1. All strong emission lines are transitions between odd-parity levels (level 1 in the left part of Figure 2) and low-lying even-parity levels (λnLIF1, blue dashed line).
In our experiments we could learn that most sensitive, with regard to the OG effect, are transitions between odd-parity levels (level 1) and high-lying even-parity levels (λexc1) or—as shown in the right part of Figure 2—even-parity levels (level 2) and high-lying odd-parity levels (λexc2). For all such transitions we can expect a high OG signal. The excitation of the high-lying levels can, in principle, be detected via their decay (λLIF1, λLIF2, red dashed lines). But for levels close to the ionization limit (energies above approximately 40,000 cm−1), such fluorescence lines are not detected (not distinguished from the noise), and we have to conclude that the ionization probabilities due to collisions in the plasma (arrows “ion1” and “ion2”) are much higher than the radiative decay rates.
Laser excitation influences the detailed equilibrium of the population of all energy levels, and the OG signal is proportional to the change of the resistivity of the plasma. Excitation of transitions between metastable low-lying levels and upper levels in the medium energy range (blue dashed in the left part of Figure 2), even their probability is high, does not change the detailed equilibrium in the discharge substantially. Thus the signal is comparable in strength to the OG signal observed when exciting from medium levels to high-lying levels (λexc1). For such transitions, the laser excitation populates levels close to the ionization limit (for La, it is 44,980 cm−1 [25]), changing the detailed equilibrium in the discharge much more.
This observation can be supported by the spectrum displayed in Figure 3. In trace (c) a part of the FT spectrum [22,23] is given, showing the hf pattern of line at 6108.4821(3) Å (transition between 24,046.093 cm−1, odd parity, and 7679.944 cm−1, even parity), allowing to determine its center of gravity (cg) wavelength with low uncertainty. In the OG signal (trace (a)) this line is also visible, but in the high-frequency part of this trace we see two additionally lines: 6108.319 and 6108.435 Å, classified as transitions between medium-energy odd-parity levels and high-lying even-parity levels (see Table 1). The signal of these lines is of comparable strength. In the FT emission spectrum the line intensity is determined by the population of the upper levels and the transition probability, and the latter lines are not noticeable. In contrary, in the OG absorption spectrum the change of the discharge resistivity is displayed (proportional to the population of the lower level and the transition probability), and we observe high sensitivity with respect to transitions to high-lying levels. Trace (b) shows a fit of trace (a).
The OG signal (e.g., Figure 3, trace (a)) does not tell us between which levels the observed transition takes place. While scanning the laser frequency, all possible transitions having suitable frequency are excited. Due to the high-level density of the La atom, several transitions are usually displayed within one laser scan of 1.5 cm−1. Sometimes they are partly or completely overlapping (blend situations) with other La I transitions, as well as transitions in Ar I or Ar II. La II transitions may also be detected.
Fortunately, all the La lines show a characteristic hf pattern, caused by the hf splitting of the involved levels. For classification of the observed lines, we use a computer program called “Elements” [15,26], which calculates transitions possible for a certain observed wavelength and shows predicted hf patterns (within the spectra of La I, La II, Ar I and Ar II). A comparison between observed and predicted hf pattern usually allows the classification. The hf constants of unclassified lines were determined from a fit of the observed pattern by means of the program “Fitter” [27]. Since the value of Q is quite small, the hf constants B of La levels are small and hard to be determined. Within this study, only the constants A could be determined.
If an observed structure cannot be explained as transition between already known energies, we have to conclude that at least one of the involved energy levels is unknown. For finding such unknown levels, we need to identify a known level involved. Since in the mid-energy range of the level scheme most of the levels are known, we expect that most of the unknown levels have high energies above 40,000 cm−1. As mentioned before, LIF lines from such levels (red dashed arrows in Figure 2) are usually not observed.
If the lower level of the excited transition has odd parity (level 1 in Figure 2), this level can decay to a low-lying even-parity level (λnLIF1, blue dashed arrow in Figure 2). Laser excitation lowers the population of level 1, thus the intensity of λnLIF1 is lowered when the laser light is on. This lowering is detected by the lock-in amplifier as a signal having an opposite phase compared to the decay of an upper excited level. We define such LIF lines as having “negative” LIF intensity. The laser wavelength is set to the highest peak of the hf pattern of the unclassified line, and the monochromator detecting LIF lines is tuned in a wide range until we find lines showing a “negative” LIF signal.
During our investigations it turned out that observation of such “negative” LIF lines is a very efficient method to identify the lower level of the excited transition, if the observed line can be explained as transition between a medium-energy odd-parity level and a previously unknown high-lying even-parity level. The energy of the new level is simply given by addition of the transition wave number to the energy of the mid-energy level. Once a new level is found in this way, its existence has to be confirmed by excitation from other lower odd-parity levels.
A short summary of how we found the new even-parity energy levels is as follows:
- (1)
- We selected an unclassified structure in the OG record (preferable having high SNR and well-resolved hf pattern).
- (2)
- The laser light was set to the highest peak of the structure.
- (3)
- The monochromator was tuned in order to find at least one “negative” LIF line.
- (4)
- We identified the upper level of the observed LIF line; this must be the lower level σlow of the laser-excited transition.
- (5)
- Then we tried to simulate the observed hf pattern using Jlow and the hf constants Alow, Blow.
- (6)
- If the simulation is possible, we added the transition wavenumber to σlow and got the energy σup of the new level. From the simulation, we got estimated values of Jup and Aup (Bup was assumed to be zero.
- (7)
- The new level added to our databank. Possible transition wavelengths from the new level to other levels were calculated.
- (8)
- The final confirmation that the level really exists is done by laser-excitation of calculated transitions.
Unfortunately, we observe sometimes quite strong structures in the OG signal for which we cannot find “negative” LIF lines. We suppose that these structures are caused by excitations of medium-energy even-parity levels (level 2 in Figure 2). From the excited high-lying odd-parity levels we do not expect LIF lines (λLIF2, red dashed) due to the high ionization probability. The “negative” LIF lines (λnLIF2, blue dotted arrow) also cannot be observed, since there are no odd-parity levels below 13,260 cm−1. Thus it is usually not possible to classify such transitions, but some exceptions are possible (see the discovery of the level at 35,233.558 cm−1, discussed further below). This may explain the fact that only four of the 233 new levels, found by laser spectroscopy, have odd parity; all others have even parity.
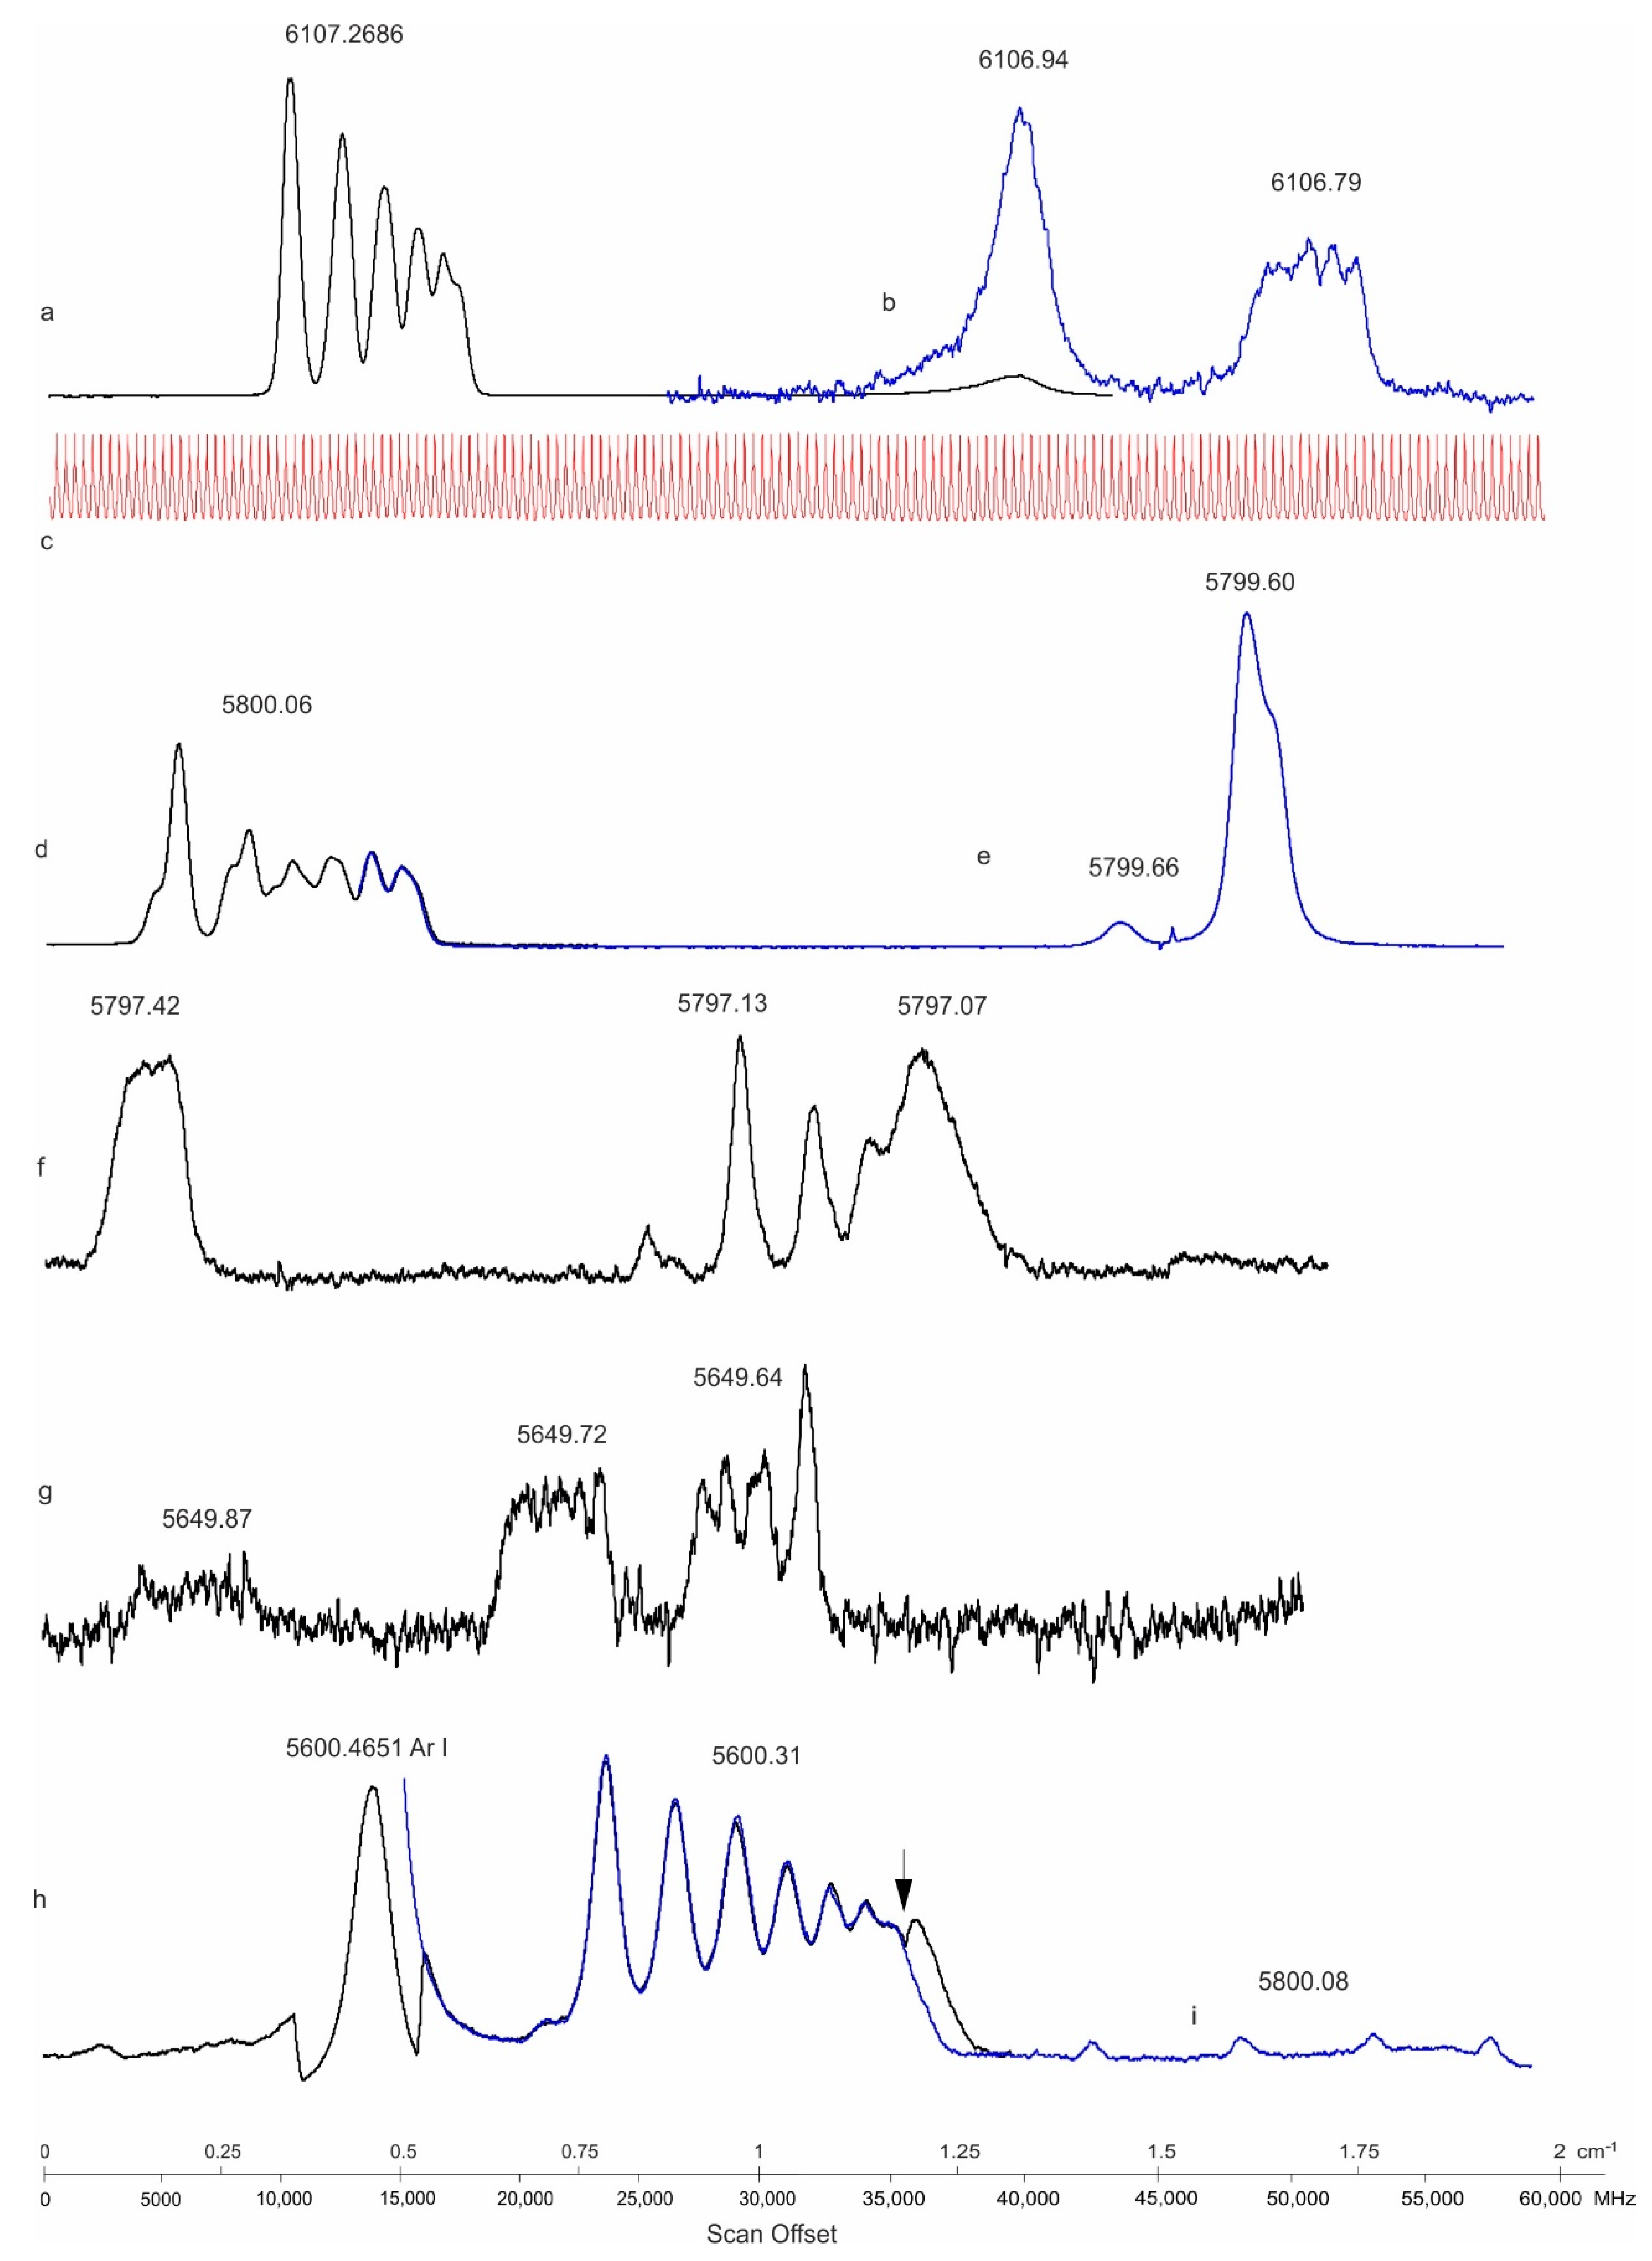
In Figure 4 we show some characteristic parts of the OG spectrum discussed in this paper, before we present some newly found levels. As can be noticed, only very rarely in an interval of 1 cm−1 no lines are detected (e.g., in trace (e)). Data for the classified lines (with the center of gravity (cg) wavelengths for all lines) showing up in the sample spectra of Figure 3 and Figure 4 are given in Table 1. Energy values used in this paper are determined in a global fit from more than 2200 lines with wave numbers determined from a wavenumber-calibrated Fourier-transform spectrum [23].
4. New Even-Parity Energy Levels
In this paper we report the discovery of 12 energy levels having even parity and one level having odd parity. In all cases of even-parity levels we observed significant unclassified hf patterns in the OG spectra, tuned the laser wavelength to the highest peak of a pattern, and searched for LIF. Due to the observed “negative” LIF lines we were able to identify the lower energy level of the excited transition and could calculate the energy of the unknown even-parity level. All levels found were then introduced to our database and we calculated possible transitions to lower-lying odd-parity levels. Some lines in the FT spectra could be classified in this way. We tried to excite all transitions at the calculated wavelengths in the range of our dye lasers, and successful excitations confirmed the existence of the newly introduced levels.
The parameters of the new levels with even parity, together with the classified transitions, are listed in Table 2. A new line is treated as classified as a transition of a new level if (i) the observed and predicted hf patterns agree and (ii) the difference between the observed and the calculated transition wavenumbers is smaller than ±0.02 cm−1.
In columns 1 to 3 the properties of the new levels are given. We could determine only the hf constant A; the value of B was assumed to be zero. In column 4 the wavelengths of the classified lines are given. Wavelengths given with four digits after decimal point correspond to lines observed in the wavenumber-calibrated FT spectrum (uncertainty ±0.0003 Å); those with three digits were determined from wavenumber differences (uncertainty ±0.003 Å); wavelengths with two digits are readings of our lambdameter, accuracy ±0.01 Å. The next five columns contain properties of the combining levels, including a reference to the used hf constants. In the last column, the remark “blend” is given, if the observed hf pattern overlaps with the pattern of another, classified line. “nf” followed by a wavelength means an observation of a “negative” LIF line, “nf+” marks a very strong LIF line, “nf-” a very weak one. “wl” means wavelength, “SNR” the signal-to-noise ratio in the FT spectrum. The value of SNR < = 10 of the FT lines mentioned in Table 2 and Table 3 indicates that these lines are quite weak (e.g., in comparison with the lines at 6107.2686 Å, shown in Figure 3, trace (c) and 6108.4821 Å, OG recording shown in Figure 4, trace (a)).
The level energies in Table 2 and Table 3 were determined in the following way. First we determined—whenever possible—wavelengths more precise than the reading of our lambdameter, either from the available FT spectrum [22,23] or from wavenumber differences to well-known lines, contained in the same OG recording (e.g., Figure 4, trace (g)). As mentioned above, these wavelengths are given in Table 2 and Table 3 with four or three digits after the decimal point. The energies of the combining levels were taken from preliminary results of [24] and were assumed to have a total uncertainty of ±0.004 cm−1. For these lines, the transition wavenumbers were calculated and in a fit, by fixing the energies of the combining lower levels, the energies of the new levels were determined. We obtained statistical uncertainties between 0.002 and 0.004 cm−1. Taking into account a possible systematic error in the calibration of the FT spectrum, the 2-sigma uncertainty of the level energies was assumed to be 0.010 cm−1.
Sometimes it is not easy to find lines classified by a newly introduced level. We demonstrate this on the example of the line at 6108.345 Å, classified as transition from the new level at 41,350.809 cm−1. The OG record is shown in Figure 3, trace (a). It has a large signal-to-noise ratio (greater than 100:1). The observed structure is composed of two strong lines (green and red hf pattern) and a weak third line (arrow, blue pattern) between two hf components of the second line. Both strong lines are classified. Below the structures the hf components (with theoretical intensity ratios) are drawn, as well as the centers of gravity. The difference between the cg wavenumbers of the strong lines (0.435 cm−1, corresponding to 13046 MHz) agrees well with the wavenumber difference of 0.436 cm−1 calculated from the level energies. Trace (b): Fit of the structure taking into account saturation effects for the strong line at 6108.4821(3) Å. Trace (c): Part of the FT spectrum [22,23]. As can be seen, the resolution of the FT spectrum is only marginally lower than that of the OG spectrum, but the sensitivity is different (see Section 3). Lines 2 and 3 are not noticeable in the FT spectrum, while line 1 has a very high signal-to-noise ratio. The cg wavelength of this line can be determined from the FT spectrum to be 6108.4821(3) Å. The classification of line 2 as transition from the level 41350.809 cm−1 is based on two observations: (i) The observed structure can be fitted well assuming the predicted hf pattern of line 2 and (ii) the cg wavelength 6108.345(3) Å (determined from the wavelength of line 1 and the cg frequency difference in trace (a), and the transition wavelength calculated from the level energies, 6108.3448 Å, are practically the same (wavenumber deviation less than 0.001 cm−1).
5. New Odd-Parity Energy Level
Data and lines for the discovered odd-parity level are listed in Table 3, having the same layout as Table 2. Figure 5a shows the OG spectrum between 6075.11 and 6074.65 Å. Hyperfine patterns of two overlapping lines can be distinguished. The low-frequency line, cg wavelength 6074.914 (3) Å, could be identified as a transition involving the new level at 41,545.894 cm−1. The stronger, high-frequency line remained unclassified. Setting the laser wavelength to its highest component, we observed strong “negative” LIF signals at 5158 and 5455 Å, indicating that the well-known odd-parity level at 19,379.395 cm−1, J = 5/2, A = −58 MHz, is the lower level of the excited transition (corresponding to level 1 in Figure 2). Adding the cg wavenumber of the line, we got a new even-parity level at 35836.34 cm−1. The structure could be fitted quite well assuming J = 7/2 and A = 455 MHz for the new level. Surprisingly, this level did not explain any other line from the FT spectrum or our OG spectrum, thus its existence seemed to be questionable. Additionally, a preliminary semi-empirical fit of the even level structure of La did not leave space for a level with J = 7/2 in the vicinity of 35,800 cm−1 [34].
Since the OG signal of the unclassified line is quite strong, and since the two observed LIF lines have quite high intensity in the emission spectrum, we thought that we had observed indirect LIF, which can be explained using Figure 2. If the transition between the even-parity level 2 and a new high-lying odd-parity level has a high probability, level 2 is depopulated by the laser light, and the laser light burns a “hole” into the equilibrium distribution of the populations. The plasma tries to fill this “hole” by population transfer from neighboring levels, and the population from the odd-parity level 1 may be transferred to level 2 via collisions, causing a decrease of the intensity of decay lines (“negative” LIF signals) of level 1.
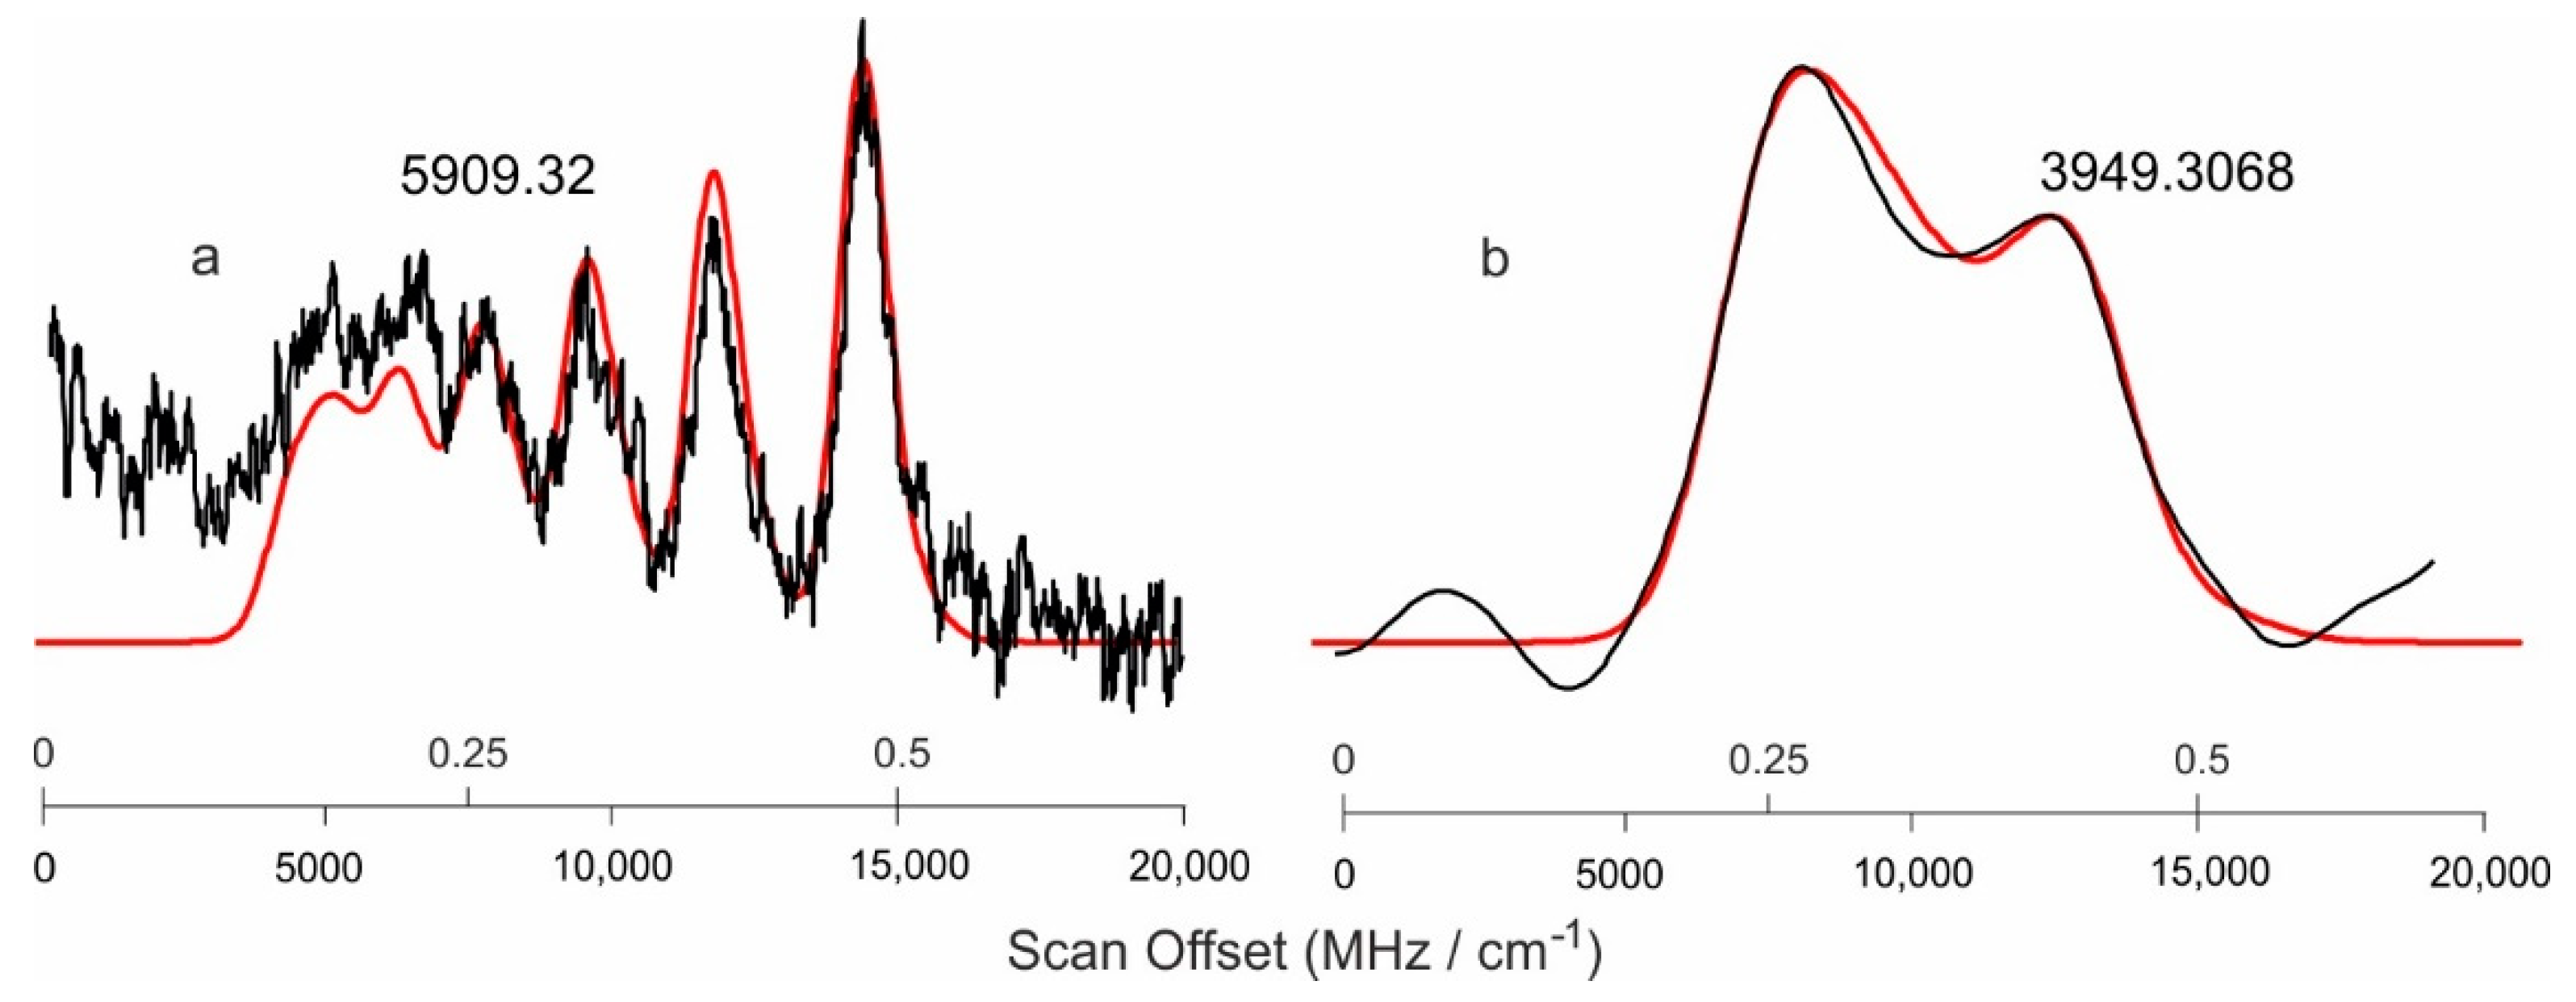
Now we had to find the level 2 excited by laser light, and we looked for even-parity levels close in energy to 19,379.395 cm−1. Additionally, the level should have J = 5/2 and a small value of A (concluded from the possible fit). The only even-parity level (level 2 in Figure 2) that fulfills these conditions is the well-known level at 18,776.615 cm−1, J = 5/2, A = 9.9 MHz. A fit of the structure, shown in Figure 5b, with these values fixed gave A = 503.6 MHz for the new odd-parity level, and its energy was calculated to be 35,223.558 cm−1. J must be 7/2. Calculated decay lines of this level did agree—with respect to wavelength and hf pattern—with two observations; at 5909.32Å (line in the OG spectrum with low SNR) and at 3949.3868 Å (line in the FT spectrum, SNR 10). The hf patterns of these lines are shown in Figure 6. Thus we think that the existence of the new odd-parity level is confirmed.
6. Conclusions
The paper reports an OG spectrum of La over the full wavelength range between 6110 and 5610 Å (over 1458 cm−1), composed of more than 1900 laser scans, each between 1 and 1.5 cm−1 wide. Circa 800 previously unknown spectral lines could be classified as transitions between already known energy levels, but more than 1000 hf patterns, which could not be classified so far, indicate the existence of a large number of hitherto unknown energy levels. The first treatment of some unclassified lines led to the identification of 12 levels having even parity and one level having odd parity, explaining altogether 87 spectral lines. Further work on finding new energy levels is in progress.
Author Contributions
T.B.: Experimental work, discovery of some levels. L.W.: Experimental work, discovery of some levels, determination of hf constants, paper writing. All authors have read and agreed to the published version of the manuscript.
Funding
This research received no external funding.
Acknowledgments
The authors are thankful to the group of R. Ferber, Laser Centre, The University of Latvia, Riga, Latvia (R.Ferber, A.Jarmola and M.Tamanis) for providing the FT spectrum of lanthanum.
Conflicts of Interest
The authors declare no conflict of interest.
References
- Stone, N.J. Table of Nuclear Magnetic Dipole and Electric Quadrupole Moments. At. Data Nucl. Data Tables 2005, 90, 75–176. Available online: https://www-nds.iaea.org/publications/indc/indc-nds-0658/ (accessed on 17 March 2020). [CrossRef]
- Wavelength Tables; Harrison, G.R. (Ed.) Massachusetts Institute of Technology, The MIT Press: Cambridge, MA, USA; London, England, 1969. [Google Scholar]
- Martin, W.C.; Zalubas, R.; Hagan, L. Atomic Energy Levels—The Rare-Earth Elements. Natl. Bur. Stand. 1978, 60, 27–35. [Google Scholar]
- Furmann, B.; Stefańska, D.; Dembczyński, J. Experimental investigations of the hyperfine structure in neutral La: I. Odd parity levels. J. Phys. B 2009, 42, 175005. [Google Scholar] [CrossRef]
- Furmann, B.; Stefańska, D.; Dembczyński, J. Experimental investigations of the hyperfine structure in neutral La: II. Even parity levels. J. Phys. B 2010, 43, 015001. [Google Scholar] [CrossRef]
- Nighat, Y.; Raith, M.; Manzoor, H.; Windholz, L. Investigation of the hyperfine structure of lanthanum lines by a laser-induced fluorescence technique. J. Phys. B 2010, 43, 125001. [Google Scholar] [CrossRef]
- Güzelçimen, F.; Siddiqui, I.; Başar, B.; Kröger, S.; Windholz, L. New energy levels and hyperfine structure measurements of neutral lanthanum by laser-induced fluorescence spectroscopy. J. Phys. B 2012, 45, 135005. [Google Scholar] [CrossRef]
- Siddiqui, I.; Shamim, K.; Gamper, B.; Dembczyński, J.; Windholz, L. Optogalvanic spectroscopy of the hyperfine structure of weak La I lines: Discovery of new even parity fine structure levels. J. Phys. B 2013, 46, 065002. [Google Scholar] [CrossRef]
- Gamper, B.; Głowacki, P.; Siddiqui, I.; Dembczyński, J.; Windholz, L. New even-parity fine structure levels of the Lanthanum atom discovered by means of optogalvanic spectroscopy. J. Phys. B 2014, 47, 165001. [Google Scholar] [CrossRef]
- Windholz, L.; Gamper, B.; Głowacki, P.; Dembczyński, J. The Puzzle of the La I Lines 6520.644 Å and 6519.869 Å. Spectr. Anal. Rev. 2014, 2, 10–18. [Google Scholar] [CrossRef] [Green Version]
- Başar, G.; Gamper, B.; Güzelçimen, F.; Öztürk, I.K.; Binder, T.; Başar, G.; Kröger, S.; Windholz, L. New even and odd parity fine structure levels of La I discovered by means of laser-induced fluorescence spectroscopy. J. Quant. Spectrosc. Radiat. Transf. 2016, 187, 505–510. [Google Scholar] [CrossRef]
- Windholz, L.; Gamper, B.; Binder, T. Variation of the observed widths of La I lines with the energy of the upper excited levels, demonstrated on previously unknown energy levels. Spectr. Anal. Rev. 2016, 4, 23–40. [Google Scholar] [CrossRef] [Green Version]
- Sobolewski, L.M.; Binder, T.; Güney, C.; Gamper, B.; Windholz, L. Laser induced fluorescence and optogalvanic spectroscopy applied to find previously unknown energy levels of La I and studies of their Zeeman structure. J. Quant. Spectrosc. Radiat. Transf. 2017, 200, 108–112. [Google Scholar] [CrossRef]
- Öztürk, I.K.; Basar, G.; Başar, G.; Özdalgic, B.; Bingöl, D.; Güzelçimen, F.; Windholz, L.; Kröger, S. New energy levels of atomic lanthanum with small total angular momentum quantum number discovered by laser spectroscopic methods in the near IR. J. Quant. Spectrosc. Radiat. Transf. 2020, in press. [Google Scholar] [CrossRef]
- Windholz, L. Finding of previously unknown energy levels using Fourier-transform and laser spectroscopy. Phys. Scr. 2016, 91, 114003. [Google Scholar] [CrossRef]
- Windholz, L. Progress in Finding New Energy Levels Using Laser Spectroscopy. Atoms 2018, 6, 54. [Google Scholar] [CrossRef] [Green Version]
- Werbowy, S.; Günay, C.; Windholz, L. Experimental investigations of the Zeeman effect of new fine structure levels of Lanthanum and Praseodymium. Spectrochim. Acta Part B 2016, 116, 16–20. [Google Scholar] [CrossRef]
- Sobolewski, L.M.; Windholz, L.; Kwela, J. Zeeman effect of weak La I lines investigated by the use of optogalvanic spectroscopy. J. Quant. Spectrosc. Radiat. Transf. 2017, 189, 221–227. [Google Scholar] [CrossRef]
- Sobolewski, L.M.; Windholz, L.; Kwela, J. Determination of Lande gJ-factors of La I levels using laser spectroscopic methods: Complementary investigations. J. Quant. Spectrosc. Radiat. Transf. 2017, 201, 30–34. [Google Scholar] [CrossRef]
- Sobolewski, L.M.; Windholz, L.; Kwela, J. Zeeman structure of red lines of lanthanum observed by laser spectroscopic methods. J. Quant. Spectrosc. Radiat. Transf. 2017, 201, 180–183. [Google Scholar] [CrossRef]
- Sobolewski, L.M.; Windholz, L.; Kwela, J. Magnetic splitting of La I lines studied by means of fluorescence depletion spectroscopy. J. Quant. Spectrosc. Radiat. Transf. 2019, 227, 185–189. [Google Scholar] [CrossRef]
- Güzelçimen, F.; Tonka, M.; Uddin, Z.; Bhatti, N.A.; Windholz, L.; Kröger, S.; Başar, G. Revised energy levels of singly ionized lanthanum. J. Quant. Spectrosc. Radiat. Transf. 2018, 211, 188–199. [Google Scholar] [CrossRef]
- Güzelçimen, F.; Başar, G.; Tamanis, M.; Kruzins, A.; Ferber, R.; Windholz, L.; Kröger, S. High resolution Fourier transform spectroscopy of lanthanum in Ar discharge in the near-infrared. Astrophys. J. Suppl. Ser. 2013, 208, 18. [Google Scholar] [CrossRef]
- Güzelçimen, F.; Başar, G.; Kröger, S.; Windholz, L. Revised energy levels of atomic lanthanum. Astrophys. J. Suppl. Ser. 2020, in press. [Google Scholar]
- Garton, W.R.S.; Wilson, M. Autoionization broadened Rydberg Series in the Spectrum of La I. Astrophys. J. 1966, 145, 333. [Google Scholar] [CrossRef]
- Windholz, L.; Guthöhrlein, G.H. Classification of Spectral Lines by Means of their Hyperfine Structure. Application to Ta I and Ta II Levels. Phys. Scr. 2003, 2003, 55–60. [Google Scholar] [CrossRef]
- Program package “Fitter”, developed by Guthöhrlein, G.H. Helmut-Schmidt-Universität, Universität der Bundeswehr: Hamburg, Germany, 1998; unpublished.
- Furmann, B.; Stefańska, D.; Dembczyński, J. Hyperfine structure analysis odd configurations levels in neutral lanthanum: I. Experimental. Phys. Scr. 2007, 76, 264. [Google Scholar] [CrossRef]
- Childs, W.J.; Nielsen, U. Hyperfine structure of the (5d+6s)3 configuration of 139La I: New measurements and ab initio multiconfigurational Dirac-Fock calculations. Phys. Rev. A 1988, 37, 6. [Google Scholar] [CrossRef]
- Childs, W.J.; Goodman, L.S. Hyperfine and Zeeman Studies of Low-Lying Atomic Levels of La139 and the Nuclear Electric-Quadrupole Moment. Phys. Rev. A 1971, 3, 25. [Google Scholar] [CrossRef]
- Başar, G.; Başar, G.; Kröger, S. High resolution measurements of the hyperfine structure of atomic Lanthanum for energetically low lying levels of odd parity. Opt. Commun. 2009, 282, 562–567. [Google Scholar] [CrossRef]
- Kajoch, A.; Krzykowski, A.; Stefańska, D.; Furmann, B.; Jarosz, A. Studies of hyperfine structure of La I by laser spectroscopy on atomic beam. Acta Phys. Pol. A 1996, 89, 517. [Google Scholar] [CrossRef]
- Başar, G.; Başar, G.; Er, A.; Kröger, S. Experimental hyperfine structure investigation of atomic La. Phys. Scr. 2007, 75, 572–576. [Google Scholar] [CrossRef]
- Dembczyński, J.; Poznan Univ. of Technology, Poznan, Poland. Private communication, 2019.
Figure 1.
Sketch of the hollow cathode lamp. The ceramic anode holders and the connecting pins are not shown. The cathode holder is grounded. Length of the cathode is 20 mm.
Figure 1.
Sketch of the hollow cathode lamp. The ceramic anode holders and the connecting pins are not shown. The cathode holder is grounded. Length of the cathode is 20 mm.

Figure 2.
Schematically excitation scheme of La I. See text for description.

Figure 3.
Part of the spectrum between 6108.60 and 6108.21 Å showing the lines at 6108.4821, 6108.319, and 6108.435 Å. (a) Optogalvanic (OG) record. (b) Fit. (c) Corresponding part of the Fourier-transform (FT) spectrum. See text for description.
Figure 3.
Part of the spectrum between 6108.60 and 6108.21 Å showing the lines at 6108.4821, 6108.319, and 6108.435 Å. (a) Optogalvanic (OG) record. (b) Fit. (c) Corresponding part of the Fourier-transform (FT) spectrum. See text for description.

Figure 4.
Examples of optogalvanic (OG) scans. Start wavelengths: (a) 6107.43Å, (b) 6107.12 Å (blue), (d) 5800.14 Å, (e) 5800.02 Å (blue), (f) 5797.45 Å, (g) 5649.92 Å, (h) 5600.60 Å, (i) 5600.45 Å (blue). Trace (c) shows the transmission signal of a marker etalon (free spectral range 367.3 MHz). Description of the lines can be found in Table 1. Wavelengths given in this graph with two figures after decimal point are readings of our lambdameter (accuracy ± 0.01 Å).

Figure 5.
Blend situation around 6074.8 Å. (a) OG record. (b) Fit. See text for description.

Figure 6.
Confirmation of the existence of the new odd-parity level at 35,233.558 cm−1. Black line—experiment, red line—simulation. (a) Line 5909.32 Å. The signal-to-noise-ratio of the OG signal is not very good, and a drift of the background signal occurred. Nevertheless, the hf pattern fits well to the one predicted from the hf constants of the combining levels. Full width at half maximum (FWHM) of the simulated pattern 900 MHz. (b) Line 3949.3068 Å as observed in the FT spectrum [22,23]. FWHM of the simulated pattern 2200 MHz.


Table 1.
Data for the lines shown in Figure 3 and Figure 4. All lines were previously unknown, with exception of the line at 6107.2686 Å (trace 4a). * wavelength from the Fourier-transform (FT) spectrum [22,23]. ** wavelength calculated from level energies. The other wavelengths were determined from wavenumber differences with respect to classified lines. wl—wavelength in standard air. tw—this work. SNR—signal-to-noise ratio in the FT spectrum. cont—continuation. ampl—amplification of the used lock-in amplifier. In column “Ref.” the source of the hf constants A and B of the levels is given.
| Fig. Trace | wl (Å) | Upper/Lower Level (cm−1) | J | P | A (MHz) | B (MHz) | Ref. | Remark |
|---|---|---|---|---|---|---|---|---|
| 3a, 3c | 6108.4821 * | 24,046.093 7679.944 | 5/2 5/2 | o e | 325.8 (17) 802.172 | −44 (15) −34.186 | [28] [29] | wl from FT, SNR 325 |
| 3a | 6108.345 | 41,350.809 24,984.291 | 5/2 5/2 | e o | 278 (2) 284.5 (17) | - 22 (20) | tw [28] | |
| 3a | 6108.319 | 41,207.990 24,841.405 | 13/2 11/2 | e o | 91.6 (5) 422 (5) | 170 (50) 200 (20) | [10] [8] | |
| 4a | 6107.2686 * | 19,379.395 3009.993 | 5/2 5/2 | o e | −58.1 (6) 300.563 (1) | - 10.873 (25) | [28] [30] | wl from FT, SNR 190 |
| 4a, 4b | 6106.936 | 40,878.175 24,507.870 | 7/2 5/2 | e o | 140.3 (30) 188 (2) | - −15(5) | [5] [6] | cont. of scan with higher ampl. |
| 4b | 6106.788 | 39,673.946 23,303.253 | 9/2 7/2 | e o | 98.5 (20) −28.1(5) | - 49 (20) | [5] [28] | |
| 4d, 4e | 5800.055 ** | 35,393.393 18,156.957 | 5/2 5/2 | e o | 164 (2) 633.3 (12) | - −18(10) | [6] [28] | |
| 4e | 5799.666 | 35,275.211 18,037.617 | 5/2 3/2 | o e | 103 (9) 226.5 (60) | - - | [4] [28] | cont. of scan with same ampl. |
| 4e | 5799.604 | 39,523.537 22,285.762 | 7/2 9/2 | e o | 176.7 (30) 181.9 (4) | - 56 (7) | [5] [31] | |
| 4f | 5797.419 | 40,949.088 23,704.813 | 5/2 3/2 | e o | 185.3 (15) 105.1 (20) | - −21 (15) | [5] [28] | |
| 4f | 5797.133 ** | 35,042.424 17,797.298 | 5/2 3/2 | e o | 620 (2) 1335.0 (10) | - - | [6] tw a | |
| 4f | 5797.067 | 42,229.620 24,984.291 | 5/2 5/2 | e o | 280 (5) 284.5 (17) | - 22 (20) | [9] [28] | |
| 4g | 5649.877 | 42,457.185 24,762.601 | 3/2 3/2 | e o | 70 (30) 418.0 (10) | - 10 (6) | tw [28] | |
| 4g | 5649.722 ** | 39,079.063 21,383.990 | 11/2 9/2 | e o | 172 (3) 94.9 (10) | - −20 (15) | [7] [28] | |
| 4g | 5649.635 | 42,605.720 24,910.373 | 1/2 3/2 | e o | 150 (20) −301.3 (5) | - 14(5) | tw [28] | |
| 4h | 5600.4651 ** | 123,467.9733 105,617.2700 | 1 2 | e o | 0 0 | 0 0 | Ar I b | |
| 4i | 5600.310 | 42,100.194 24,248.989 | 9/2 9/2 | e o | 60.3 (20) 405 (2) | - 8 (4) | [4] [6] | cont. of scan with same ampl. |
| 4i | 5600.08 c | - - | - - | - - | - - | - - |
a Given as 1328.6(29) by [25]. b Ampl. switched to a lower value in the range of the Ar line, the arrow indicates a mode hop of the laser. c Unclassified and unexplained structure (molecules?).
Table 2.
Properties of the new even-parity levels and classified lines. Uncertainty of the energies of the new levels ±0.010 cm−1. wl—wavelength. SNR—signal-to noise ratio in the FT spectrum. In column “Ref.” the source of the hf constants A and B of the combining levels is given. The value of B could not be determined for the new levels and was assumed to be zero. Uncertainties of A-values determined in this work to 2-sigma.
| New Even-Parity Level | Line | Combining Odd-Parity Level | |||||||
|---|---|---|---|---|---|---|---|---|---|
| Energy (cm−1) | J | A (MHz) | wl (Å) | Energy (cm−1) | J | A (MHz) | B (MHz) | Ref. | Comment |
| 40,136.158 | 5/2 | 243.8 (10) | 5649.168 | 22,439.346 | 3/2 | 149.5 (32) | −45 (35) | [28] | blend |
| 5768.11 | 22,804.246 | 5/2 | 45.4 (65) | 0 (20) | [28] | blend nf+ 5177 nf 5050 | |||
| 5910.26 | 23,221.093 | 7/2 | −76.4 (3) | 59 (4) | [28] | ||||
| 5939.093 | 23,303.253 | 7/2 | −28.1 (05) | 49 (20) | [28] | nf 5211 | |||
| 6147.90 | 23,874.944 | 5/2 | 241.7 (23) | 0 (15) | [28] | ||||
| 6213.30 | 24,046.093 | 5/2 | 325.8 (17) | −44 (15) | [28] | ||||
| 6229.734 | 24,088.538 | 7/2 | −134.1 (40) | 72 (30) | [28] | blend | |||
| 40,273.667 | 5/2 | 17.0(10) | 3910.5272 | 14,708.912 | 3/2 | 586.2 (4) | 41(3) | [31] | wl from FT, SNR 6 |
| 4447.8684 | 17,797.298 | 3/2 | 1335.0 (10) | - | tw a | wl from FT, SNR 5 | |||
| 5605.61 | 22,439.346 | 3/2 | 149.5 (32) | −45 (35) | [28] | nf+ 5145 | |||
| 5862.594 | 23,221.093 | 7/2 | −76.4 (3) | 59 (4) | [31] | nf 5234 nf 5067 | |||
| 5890.978 | 23,303.253 | 7/2 | −28.1 (5) | 49 (20) | [28] | nf 5046 nf 4493 nf+ 5211 | |||
| 6096.35 | 23,874.944 | 5/2 | 241.7 (23) | 0(15) | [28] | nf- 4187 | |||
| 6176.805 | 24,088.538 | 7/2 | −134.1 (40) | 72 (30) | [28] | blend | |||
| 40,800.791 | 5/2 | 201 (3) | 4175.2310 | 16,856.792 | 5/2 | 262.5 (5) | 60 (10) | [28] | wl from FT, SNR 3 |
| 5686.802 | 23,221.093 | 7/2 | −76.4 (3) | 59 (4) | [31] | ||||
| 5966.823 | 24,046.093 | 5/2 | 325.8 (17) | −44 (15) | [28] | nf+ 4157 nf+ 6108 | |||
| 5981.975 | 24,088.538 | 7/2 | −134.1 (40) | 72 (30) | [28] | blend nf+ 4339 | |||
| 6099.18 | 24,409.675 | 7/2 | 188.4 (17) | 17 (15) | [28] | blend nf 4280 | |||
| 6320.76 | 24,984.291 | 5/2 | 284.5 (17) | 22 (20) | [28] | nf 4549 | |||
| 41,052.945 | 5/2 | 131.8 (15) | 5762.71 | 23,704.813 | 3/2 | 105.1 (20) | −21 (15) | [28] | |
| 5819.80 | 23,874.944 | 5/2 | 241.7 (23) | 0 (15) | [28] | ||||
| 5878.353 | 24,046.093 | 5/2 | 325.8 (17) | −44 (15) | [28] | nf+ 6108 | |||
| 5893.06 | 24,088.538 | 7/2 | −134.1 (40) | 72 (30) | [28] | nf+ 4339 | |||
| 5922.838 | 24,173.826 | 3/2 | −228.9 (22) | 30 (11) | [28] | nf+ 4648 | |||
| 6042.42 | 24,507.870 | 5/2 | 188 (2) | 15 (5) | [6] | nf+ 5874 nf+ 5714 nf 4650 nf+ 4079 | |||
| 6221.576 | 24,984.291 | 5/2 | 284.5 (17) | 22 (20) | [28] | nf 4549 nf 4177 nf 4652 | |||
| 41,059.207 | 5/2 | 41(2) | 5876.19 | 24,046.093 | 5/2 | 325.8 (17) | −44 (15) | [28] | nf- 4157 |
| 6040.14 | 24,507.870 | 5/2 | 188 (2) | 15 (5) | [6] | nf 4650 nf 4262 nf+ 4079 | |||
| 6088.46 | 24,639.258 | 3/2 | −200.0 (10) | 3 (2) | [32] | nf+ 4550 nf+ 5829 nf+ 5894 | |||
| 6190.684 | 24,910.373 | 3/2 | −301.3 (5) | 14 (5) | [28] | ||||
| 6219.152 | 24,984.291 | 5/2 | 284.5 (17) | 22 (20) | [28] | ||||
| 6791.47 | 26,338.932 | 5/2 | 103.2 (22) | −29 (20) | [28] | nf+ 5304 nf+ 5357 nf+ 5466 nf 5827 | |||
| 41,350.809 | 5/2 | 278(2) | 5720.591 | 23,874.944 | 5/2 | 241.7(23) | 0(15) | [28] | nf 4187 |
| 5901.16 | 24,409.675 | 7/2 | 188.4(17) | 17(15) | [28] | blend nf 4280 | |||
| 5935.561 | 24,507.870 | 5/2 | 188(2) | 15(5) | [6] | nf 4079 | |||
| 6026.71 | 24,762.601 | 3/2 | 418.0(10) | 10(6) | [28] | ||||
| 6080.88 | 24,910.373 | 3/2 | −301.3(5) | 14(5) | [28] | ||||
| 6108.345 | 24,984.291 | 5/2 | 284.5(17) | 22(20) | [28] | blend | |||
| 6145.54 | 25,083.354 | 7/2 | 70.8(5) | 25(15) | [33] | blend | |||
| 6196.94 | 25,218.264 | 5/2 | 101(5) | - | [8] | ||||
| 6259.80 | 25,380.277 | 7/2 | 389.0(10) | - | tw b | ||||
| 6491.51 | 25,950.319 | 3/2 | 478.5(19) | 18(16) | [28] | nf+ 5962 nf+ 5415 nf+ 5340 nf+ 4015 | |||
| 41,510.464 | 3/2 | 257 (3) | 5614.64 | 23,704.813 | 3/2 | 105.1 (20) | −21 (15) | [28] | |
| 5668.80 | 23,874.944 | 5/2 | 241.7 (23) | 0 (15) | [28] | ||||
| 5724.35 | 24,046.093 | 5/2 | 325.8 (17) | −44 (15) | [28] | nf 4157 | |||
| 5879.828 | 24,507.870 | 5/2 | 188 (2) | 15 (5) | [6] | nf 4079 nf 4650 | |||
| 5925.61 | 24,639.258 | 3/2 | −200.0 (10) | 3 (2) | [32] | ||||
| 5969.26 | 24,762.601 | 3/2 | 418.0(10) | 10 (6) | [28] | nf 4037 | |||
| 6022.397 | 24,910.373 | 3/2 | −301.3 (5) | 14 (5) | [28] | ||||
| 6049.337 | 24,984.291 | 5/2 | 284.5 (17) | 22 (20) | [28] | nf 4177 nf 4479 nf 4549 nf 4652 | |||
| 6136.207 | 25,218.264 | 5/2 | 101 (5) | - | [8] | ||||
| 41,545.894 | 11/2 | 460.3 (20) | 3951.0242 | 16,243.163 | 9/2 | 614.2 (5) | 161 (4) | [30] | wl from FT, SNR 28 |
| 5984.760 | 24,841.405 | 5.5 | 422 (5) | 200 (20) | [8] | nf+ 6699 f 3951 | |||
| 6074.91 | 25,089.311 | 9/2 | 0.0 (10) | 140 (20) | tw c | nf 6608 | |||
| 6338.558 | 25,773.802 | 6.5 | 373.5 (5) | 165 (20) | tw e | ||||
| 6379.29 | 25,874.498 | 5.5 | 44.0 (5) | 168 (10) | tw d | nf 6266 | |||
| 41,578.214 | 9/2 | 38 (6) | 5973.20 | 24,841.405 | 5.5 | 422 (5) | 200 (20) | [8] | nf+ 6699 |
| 6060.818 | 25,083.354 | 7/2 | 70.8 (5) | 25 (15) | [33] | nf+ 4160 | |||
| 6063.00 | 25,089.311 | 9/2 | 0 (1) | 140 (20) | tw c | nf+ 6608 | |||
| 6171.92 | 25,380.277 | 7/2 | 389.0 (10) | - | tw b | ||||
| 6366.05 | 25,874.498 | 5.5 | 44.0 (5) | 168 (10) | tw d | ||||
| 6416.282 | 25,997.176 | 9/2 | 414.3 (20) | 40 (20) | [28] | blend with Ar I nf 4570 | |||
| 41,582.536 | 5/2 | 56 (3) | 5592.01 | 23,704.813 | 3/2 | 105.1 (20) | −21 (15) | [28] | nf 6068 nf 6165 |
| 5645.727 | 23,874.944 | 5/2 | 241.7 (23) | 0 (15) | [28] | nf 4187 | |||
| 5714.660 | 24,088.538 | 7/2 | 134.1 (40) | 72 (30) | [28] | nf+ 4339 | |||
| 5742.657 | 24173.826 | 3/2 | 228.9 (22) | 30 (11) | [28] | nf 4648 | |||
| 5855.01 | 24,507.870 | 5/2 | 188 (2) | 15 (5) | [6] | nf 4262 nf+ 4650 | |||
| 5900.412 | 24,639.258 | 3/2 | 200.0 (10) | 3 (2) | [32] | ||||
| 5943.679 | 24,762.601 | 3/2 | 418.0 (10) | 10 (6) | [28] | ||||
| 5996.36 | 24,910.373 | 3/2 | −301.3 (5) | 14 (5) | [28] | ||||
| 6109.184 | 25,218.264 | 5/2 | 101 (5) | - | [8] | ||||
| 42,457.183 | 3/2 | 84.0 (15) | 5569.70 | 24,507.870 | 5/2 | 188 (2) | 15 (5) | [6] | nf 4079 |
| 5649.878 | 24,762.601 | 3/2 | 418.0 (10) | 10 (6) | [28] | ||||
| 5879.605 | 25,453.947 | 1/2 | −386.5 (20) | 0 | tw f | blend nf+ 3927 nf- 4387 | |||
| 5936.510 | 25,616.935 | 1/2 | −297.3 (15) | 0 | [28] | ||||
| 5945.711 | 25,642.997 | 3/2 | 273.3 (2) | 4 (4) | [32] | ||||
| 42,605.720 | 1/2 | 148 (3) | 5564.380 | 24,639.258 | 3/2 | −200.0 (10) | 3 (2) | [32] | |
| 5602.846 | 24,762.601 | 3/2 | 418.0 (10) | 10 (6) | [28] | nf+ 4037 | |||
| 5649.635 | 24,910.373 | 3/2 | −301.3 (5) | 14 (5) | [28] | nf 4494 nf 4564 nf 6356 | |||
| 5828.684 | 25,453.947 | 1/2 | −386.5 (20) | 0 | tw f | ||||
| 5884.607 | 25,616.935 | 1/2 | −297.3 (15) | 0 | [28] | ||||
| 5893.65 | 25,642.997 | 3/2 | 273.3 (2) | 4 (4) | [32] | ||||
| 6002.39 | 25,950.319 | 3/2 | 478.5 (19) | 18 (16) | [28] | ||||
Table 3.
Properties of the new odd-parity level and classified lines. Uncertainty of the energy of the new level ±0.010 cm−1. wl—wavelength. SNR—signal-to-noise ratio in the FT spectrum. In column “Ref.” the source of the hf constants A and B of the combining levels is given. The value of B could not be determined for the new level and was assumed to be zero. Uncertainties of A-values determined in this work to 2-sigma.
| New Odd-Parity Level | Line | Combining Even-Parity Level | |||||||
|---|---|---|---|---|---|---|---|---|---|
| Energy (cm−1) | J | A (MHz) | wl (Å) | Energy (cm−1) | J | A (MHz) | B (MHz) | Ref. | Comment |
| 35,233.558 | 7/2 | 503.6 (20) | 3949.3068 | 9919.824 | 9/2 | 559.812 * | 202.638 * | [29] | wl from FT, SNR 10 |
| 5909.32 | 18,315.821 | 9/2 | 111.6(26) | - | [28] | ||||
| 6074.781 | 18,776.615 | 5/2 | 9.9 (20) | - | [28] | ||||
* no uncertainties given in ref. [29].
© 2020 by the authors. Licensee MDPI, Basel, Switzerland. This article is an open access article distributed under the terms and conditions of the Creative Commons Attribution (CC BY) license (http://creativecommons.org/licenses/by/4.0/).
Share and Cite
MDPI and ACS Style
Windholz, L.; Binder, T. The Optogalvanic Spectrum of Neutral Lanthanum between 5610 and 6110 Å. Atoms 2020, 8, 23. https://0-doi-org.brum.beds.ac.uk/10.3390/atoms8020023
AMA Style
Windholz L, Binder T. The Optogalvanic Spectrum of Neutral Lanthanum between 5610 and 6110 Å. Atoms. 2020; 8(2):23. https://0-doi-org.brum.beds.ac.uk/10.3390/atoms8020023
Chicago/Turabian StyleWindholz, Laurentius, and Tobias Binder. 2020. "The Optogalvanic Spectrum of Neutral Lanthanum between 5610 and 6110 Å" Atoms 8, no. 2: 23. https://0-doi-org.brum.beds.ac.uk/10.3390/atoms8020023
Note that from the first issue of 2016, this journal uses article numbers instead of page numbers. See further details here.