Article

Impact Energy and Angular Dependence of L X-ray Emission from a Thick Polycrystalline Tungsten Element Induced by 15–25 keV Electrons

1
Department of Physics, Central University of Jharkhand, Ranchi 835205, India
2
Atomic Physics Laboratory, Department of Physics, Banaras Hindu University, Varanasi 221005, India
*
Author to whom correspondence should be addressed.
Submission received: 20 September 2020 / Revised: 15 October 2020 / Accepted: 27 October 2020 / Published: 17 November 2020
(This article belongs to the Section Atomic, Molecular and Nuclear Spectroscopy and Collisions)

Abstract

:
The impact energy and angular dependence of L X-rays of a thick polycrystalline tungsten (W; atomic number, Z = 74) target induced by 15–25 keV electrons has been measured at different angles varying from 15° to 75° at intervals of 5° using a Si PIN photodiode detector. The variation of measured relative intensity of Ll, Lα, Lβ and Lγ characteristic lines as a function of incidence angle is found to be anisotropic and the measured variation compares well with the PENELOPE simulation results. The angular variation of intensity ratio of Ll/Lα and Lβ/Lα shows anisotropic distribution, whereas the angular variation of the Lγ/Lα ratio exhibits almost isotropic distribution within the uncertainty of measurements. These measured ratios are found to be in good agreement with Monte Carlo (MC) calculations. The measured intensity ratios of Lβ/Lα and Lγ/Lα at a given incidence angle show a linear dependence with impact energy and exhibit good agreement with simulation results; however, the measured intensity ratio of Ll/Lα shows a non-linear variation with the impact energy and yields poor agreement with theoretical calculations.

1. Introduction

Theoretical and experimental investigations of electron-atom ionizing collisions have occupied physicists for many decades, and this topic is still the subject of intense research. When the collision involves excitation of a tightly bound shell electron, the atom may emit, in the course of subsequent relaxation, not only the characteristic (CS) X-ray lines but also a continuous radiation called bremsstrahlung (BS) associated with X-ray lines. The energy corresponding to the emitted X-ray line constitutes a fingerprint of the ionized shell of the atom. In a solid target consisting of a large number of atoms, there are two significant ionization mechanisms, namely, direct electron impact and an indirect process involving the photoelectric absorption of radiation. The theoretical estimates of total and partial ionization cross-sections from different models can be compared with measurements of characteristic X-rays emitted after electron impact. To do so, ionization cross-sections can be converted into X-ray emission cross-sections using atomic relaxation parameters. At electron impact energies near the atomic binding energies (a few eV to tens of keV), ionization and subsequent rearrangement of atomic electrons take place, resulting in emission of photons. In this process, the presence of multiple electrons both bound and continuous complicates the dynamics of collision processes and therefore the subsequent observable effects are not fully understood in all the experiments. Electron-impact ionization cross-sections of atoms and molecules, on one hand, are of great importance in many branches of physics including atomic physics, plasma physics and radiation physics, apart from their several applications, for instance, in electron-probe microanalysis (EPMA), surface analysis by Auger-electron spectroscopy (AES), electron energy loss spectroscopy (EELS) and in structure and characterization of matter. Tungsten is an important material to be studied in plasma physics research, and the investigation on angular distribution of X-rays can offer a useful basic database for the project of International Thermonuclear Experimental Reactor (ITER) [1].
Earlier experiments on electron-impact ionization studies focused primarily on the K-shell ionization cross-sections, while L- and M-shell ionization data were seldom reported [2]. Recently, many authors have reported L X-ray production cross-sections for a few elements, and validation of various theoretical models are done using their corresponding data. Shima et al. [3] performed experiments near the ionization threshold and reported L-group lines production of cross-sections and L3 ionization cross-section by electron impact. Schneider et al. [4] have reported L3 ionization cross-section by electron impact near the ionization threshold. The comparisons between theory and various experiments on L-shell production cross-sections in a few heavy elements, for instance, Z = 72–83, were made by Fernandez et al. [5]. L-subshell ionization cross-sections of gold induced by 15–40 keV electrons were measured and compared with calculations using distorted wave Born approximation formalism as well as the modified relativistic binary encounter Bethe model by Rahangdale et al. [6]. The recent experiments done by Campos et al. [7] provided improved results for Lα and Lβ production cross-sections. An exhaustive review on measurements and calculations of L-shell ionization cross-sections of a large number of elements (Z = 1–99) by electrons and positrons having kinetic energy up to 1 GeV has been reported recently by Llovet et al. [8]. All experiments in the above comparisons were mostly carried out using thin foils of the considered targets. Considerably, a lower number of experimental studies on the angular distributions of characteristic L-group X-ray lines produced by electron impact have been reported in the literature, and most of such studies were done using photon sources with thin foils of pure elements, see, for example, Wang et al. [9] and references therein. In their studies, the angular distributions of Lα and Lβ2 X-rays of W induced by 0–20 keV bremsstrahlung photons at different angles varying from 100° to 260° at intervals of 10° were measured and shown to be anisotropic. The angular distributions of Lα, Lβ, and Ll X-rays of Au (Z = 79) using a thin foil at forward angles of 0° to 25° emitted following 15 keV electron impact were measured by Sestric et al. [10] for investigating the degree of induced alignment of the L3-subshell vacancies. Their results suggested that the angular distributions of Lα and Lβ X-rays are essentially isotropic; however, they further suggested that the angular distribution of the Au Ll X-rays may be weakly anisotropic. Their results were, however, not compared with prediction of any theoretical model.
Apart from the experimental work of Sestric et al. [10], no other experimental results on the angular distributions of relative-intensity ratios of L-group X-ray lines (Ll, Lα, Lβ, Lγ) induced by electron impact with a thick target of high Z elements are reported in the literature. It was therefore considered worthwhile to provide further experimental and theoretical information on the angular dependence of relative-intensity ratios of different L X-ray lines of a thick tungsten (Z = 74) pure element produced by bombardment of 15–25 keV electrons. In this study, we have compared the measured results on impact energy and angular dependence of the relative-intensity ratios of a pair of specified L X-ray lines with those predicted by PENELOPE general purpose Monte Carlo (MC) calculations [11,12]. The comparison shows a satisfactory agreement between experiment and theory within the uncertainty of measurements, suggesting that some L X-ray lines are isotropic while others are anisotropic in nature. A more detailed discussion in this aspect is given in Section 4.

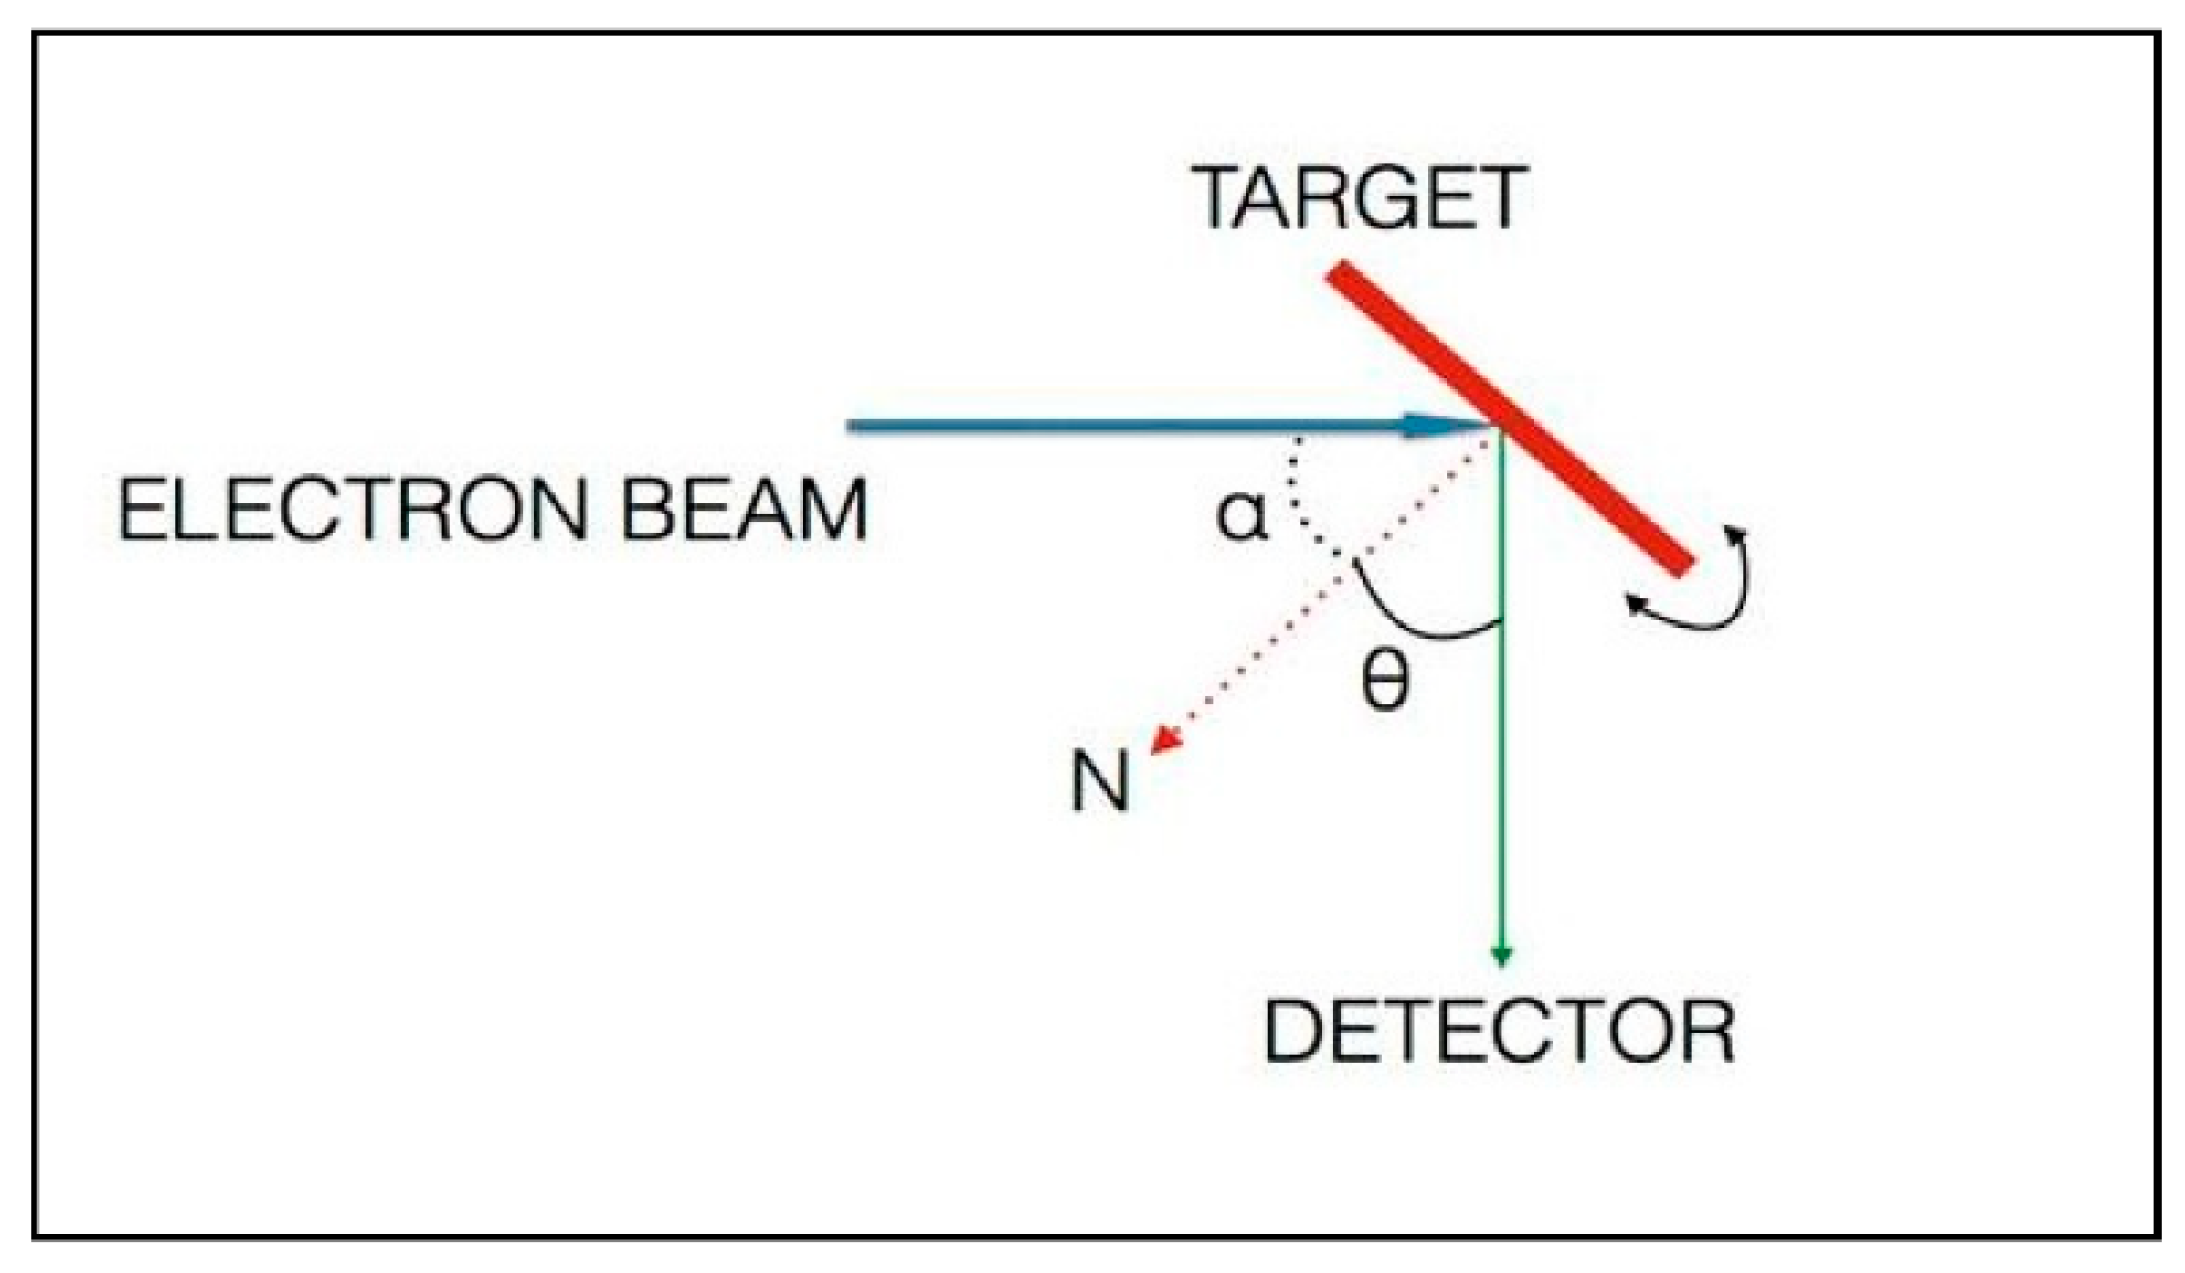
2. Experimental Details

Measurements were carried out on an experimental set up which has been described in detail in our recent publications [13,14]. Briefly, a beam of mono-energetic electrons (beam diameter = 1–3 mm) was obtained from an electron gun operative in the energy range 2–50 keV. The electrons were bombarded on a high-purity (99.9%) thick polycrystalline target of W (Z = 74) with dimensions 10 × 10 mm, having thickness of 0.25 mm. Impact energy of electrons was varied in the range 15–25 keV. The electron beam-target-detector geometry of the experiment is shown in Figure 1. The X-ray detector was fixed at 90° with respect to the electron beam direction. According to the employed geometry, the incidence angle α subtended between electron beam direction and target normal varied in the angular range between 0° to 90°, while the photon detection angle θ is measured to be (90°−α) (see, Figure 1). The total number of electrons incident on the target was determined by using a current integrator (ORTEC model 419). The target was biased at +28 V using dry batteries for preventing the secondary electrons to escape from the target during the electron–target collisions. The electron beam current used in the present experiments ranged from 0.2 to 1.5 nA depending on the beam energy and the pulse pile-up rejection requirements, and the dead time of the detector was always kept in the range 2–3%.
Measurements of impact energy and angular dependence of CS radiation were performed by rotating the target about an axis set perpendicular to both the electron beam and the detector axis. The X-ray photons emerging from the target surface were detected by an energy-dispersive Si PIN photodiode detector (M/s Amptek Inc., Bedford, MA, USA), and the resolution full width and half maxima (FWHM) of the detector was measured to be 165 eV at 5.9 keV. As the detector efficiency for different CS X-ray lines is not exactly the same in terms of their corresponding energies, hence, in determination of their relative-intensity ratios, it has to be accounted for. This aspect has been appropriately considered in the model calculations of PENELOPE by including the exact experimental conditions with regard to detector efficiency, energy-loss, transport of electrons and photons in the target and backscattering of electrons, etc. However, few parameters, for instance, total number of electrons incident on the target, solid angle subtended by the detector onto the target and target density, were considered to remain nearly constant and the same in determining the considered ratios. The solid angle subtended by the detector to the target at a given emission angle was estimated to be 1.26 × 10⁻³ sr. The X-ray photons were also recorded with beam-on without target in place for each run—this data was needed for the background subtraction later in the data analysis. The contribution of background counts that arise due to residual gases present in the scattering chamber and that due to thick target bremsstrahlung (TTB) produced from chamber walls was found to be much less than a percent of the true CS X-ray lines. Furthermore, for a chosen photon energy, the normalization of background-subtracted experimental relative-intensity ratios of given CS X-ray lines with the corresponding theoretical ratios, the detector’s response does not influence the normalized angular distributions. The amplified signals from the photodiode detector were transferred to a computer-based multi-channel analyzer (MCA-3. FAST ComTech GmbH, Oberhaching, Germany) and spectra of X-ray photons were recorded in a pulse-height analysis (PHA) mode for all impact energy range of electrons. The data acquisition time for X-ray spectra recorded at different angles ranged from 3 to 4 h depending on the impact energy of electrons as well as on the requirement of reasonable statistics of the accumulated counts.
The uncertainty in measurements of the relative-intensity ratios of characteristic X-ray lines originates mainly from the counting statistics of individual L X-rays lines: they are found to vary in the range (0.9–5.0%), the uncertainty in detector efficiency є(k) (5%) and total background subtraction (2–3%). Taking these errors in account, the upper limit of relative uncertainty in the measurement of intensity ratios of characteristic L X-rays is found to be about 7.5%.

3. Data Analysis

A typical photon energy spectrum consisting of Ll, Lα, Lβ and Lγ characteristic X-ray lines of W produced in collisions of 25 keV electrons with a pure polycrystalline thick W target at α = 45° is displayed in Figure 2. The Ll, Lα, Lβ and Lγ characteristic X-ray lines are clearly seen. They are superimposed on a continuous bremsstrahlung spectrum that extends up to the incident energy of electrons, that is, the end point of the spectrum. In order to obtain the relative intensity of individual characteristic L X-ray lines, firstly, we fitted the continuous background by a linear interpolation method taking all data points, excluding the characteristic X-ray peaks. Then, we fitted different X-ray peaks using a Gaussian multiple-peak fitting procedure. In this way, the area of continuum background underneath the peaks was obtained by integrating the whole region of the peaks, including the associated BS underneath the peaks, and subtracted the fitted area of the peaks from the total integrated area, as shown in Figure 2.
Following the above fitting procedures, we have determined the variation of relative-intensity and intensity ratios of Ll, Lα, Lβ and Lγ X-ray lines of W produced by electrons of different impact energy in the range of 10–25 keV as a function of incidence angle α varying in the range of 0°–90°. Resulting nature of the angular variation of intensity of different X-ray lines, intensity ratios and impact energy dependence has been presented and discussed in detail in Section 5.

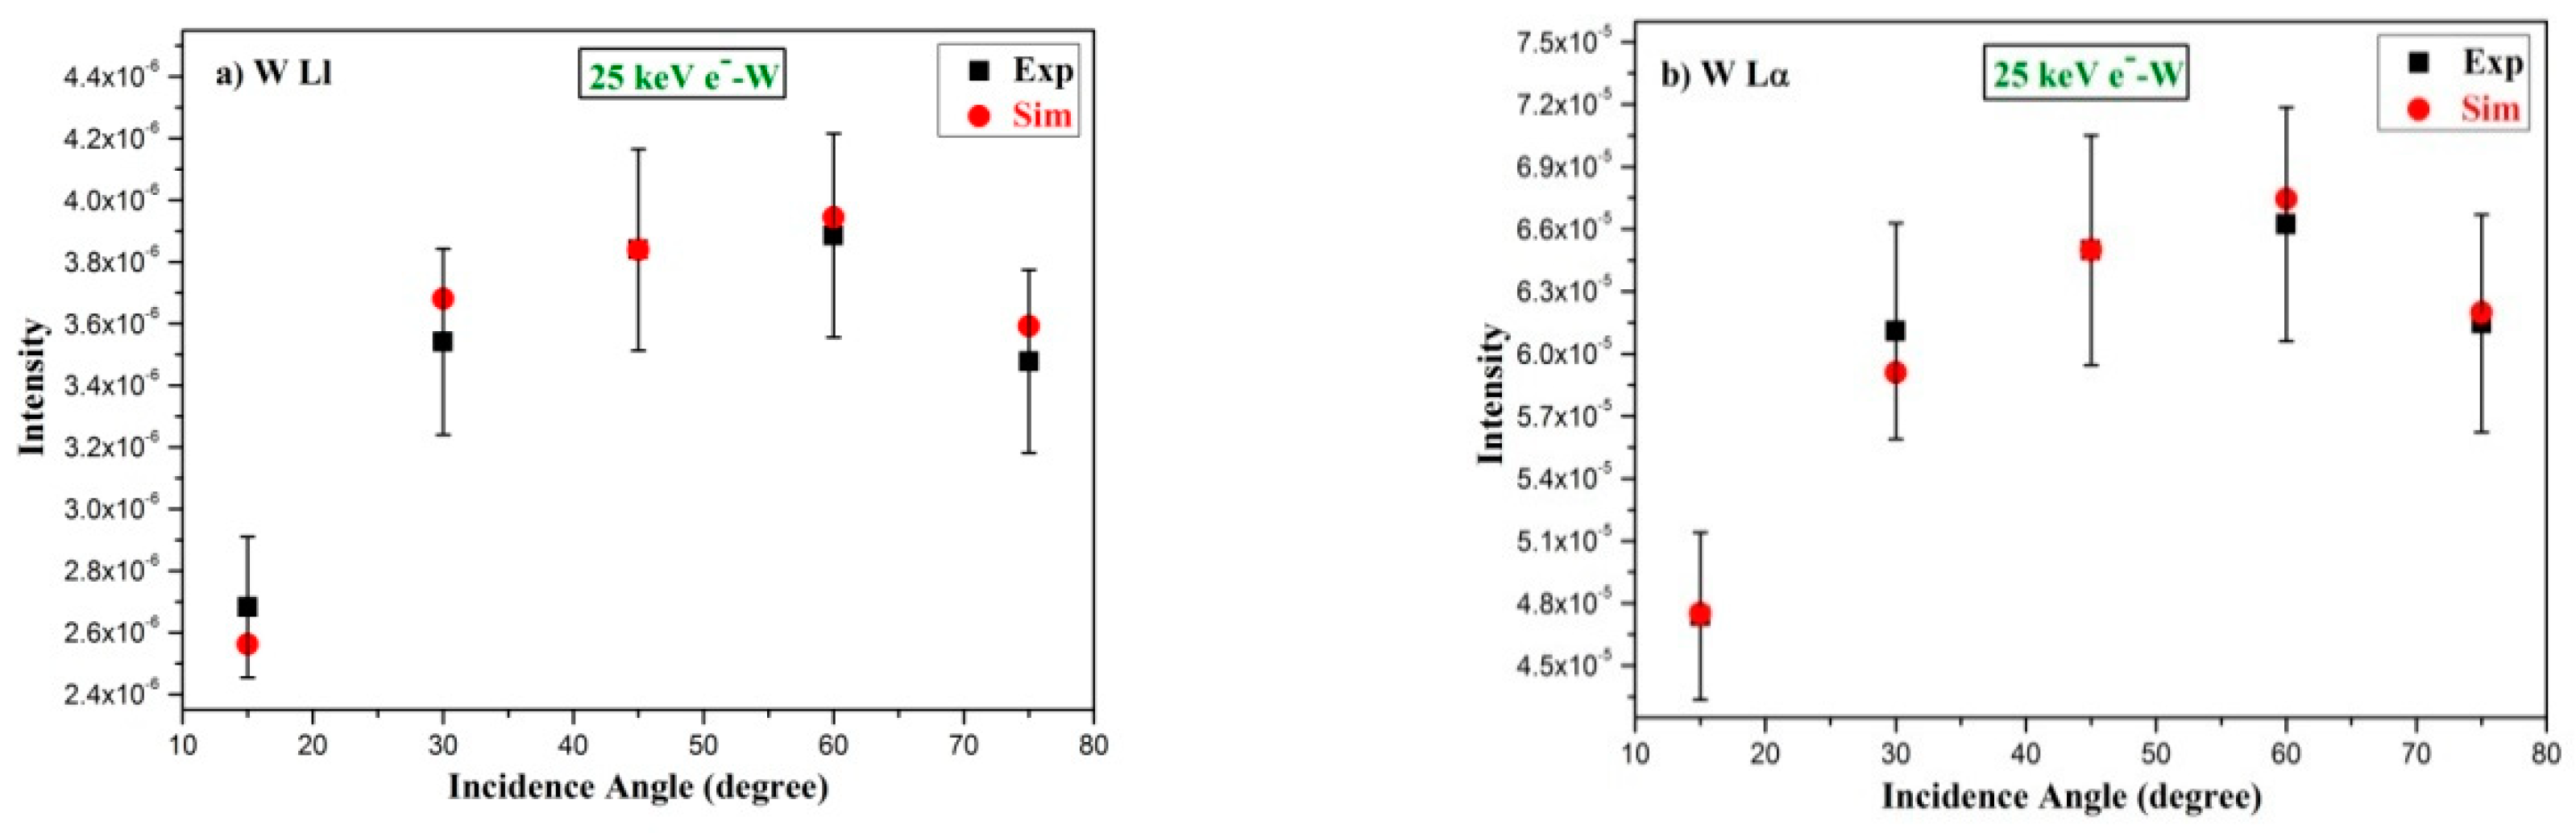
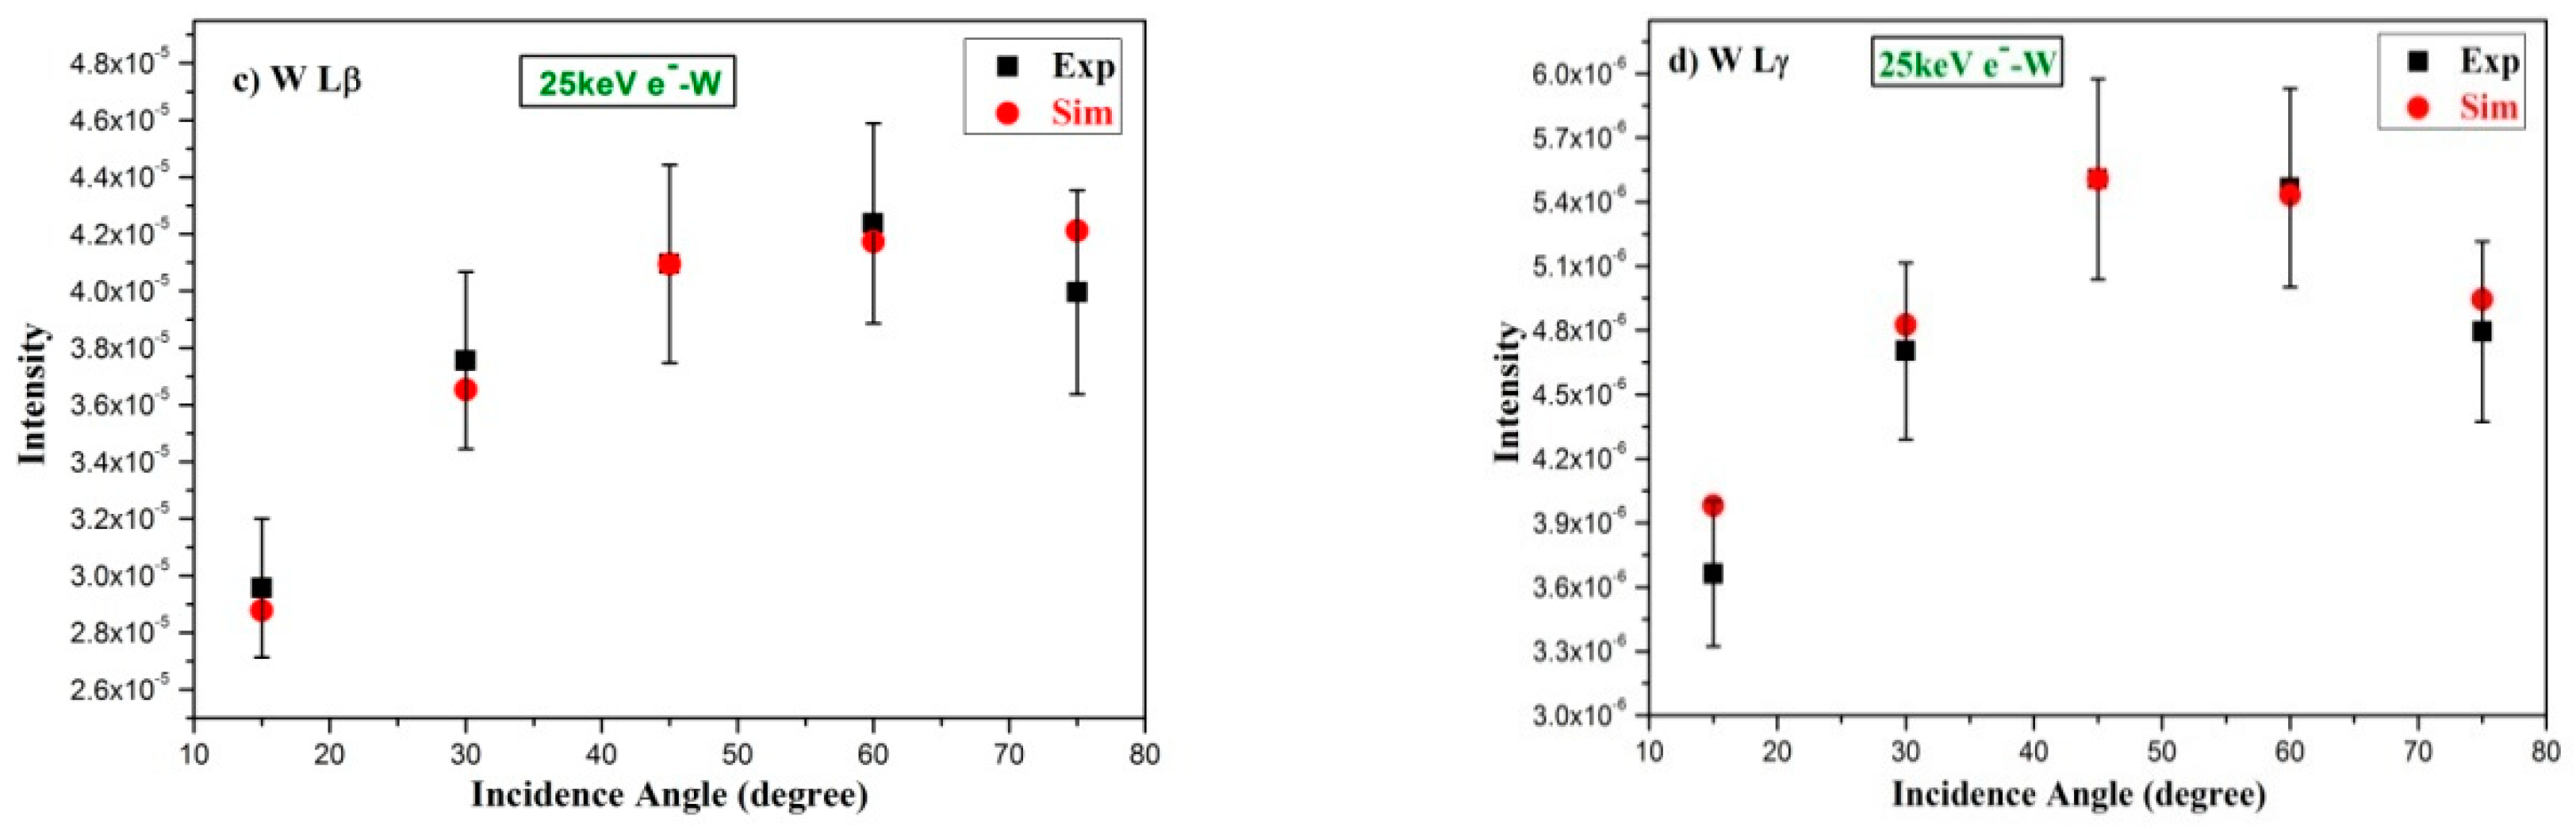
4. Simulation Results for Impact Energy and Angular Variation of Characteristic L X-Ray Lines

In order to compare the experimental results of relative intensity of characteristic X-ray lines and their ratios with those of theoretical predictions, we have used the general-purpose MC code PENELOPE [11]; specifically, we have employed the code PENEPMA [12] which is based on PENELOPE. This code simulates the coupled electron-photon transport in matter using a combination of numerical and analytical physical models to describe the interactions of electrons and photons with matter. Photon interactions are generated using the conventional detailed simulation method (all individual interactions are simulated in chronological order). Electron trajectories are generated using a mixed simulation algorithm, which can be conveniently switched to purely detailed simulation by selecting appropriate values for the cut-off parameters. The relevant cross-sections implemented in PENELOPE as well as the simulation algorithms are described in detail in Reference [11].
In this study, the following simulation parameters were used: C1 = 0.2 (average angular deflection in a step), C2 = 0.2 (maximum average fractional energy loss in a step), Wcc = 1 keV (cut-off energy loss for hard inelastic collisions), Wcr = 1 keV (cut-off energy loss for hard bremsstrahlung collisions), Eel = 1 keV (electron absorption energy) and Eph = 1 keV (photon absorption energy). The description of the above-mentioned parameters is found in References [11,12].
PENEPMA delivers X-ray spectra in absolute units, i.e., as probability density for detecting a photon per unit photon energy, per unit solid angle and per incident electron. Energy distributions of characteristic X-ray lines and those of BS photons emitted from the studied target at a given angle were simulated using the actual experimental conditions. Characteristic X-ray lines’ yield and the corresponding relative intensity ratios were finally extracted from the simulated spectra in the same way as it was done for the experimental spectra.

5. Results and Discussion

5.1. Angular Distribution of the Relative Intensity of L X-Ray Lines

A typical example of spectra showing variation of the experimental and the simulation results for relative intensity of Ll, Lα, Lβ and Lγ X-ray lines of W produced by impact of 25 keV electrons as a function of incidence angle α is displayed in Figure 3a–d. From these figures, it is seen that all lines under consideration show an anisotropic distribution in the measured angular range (0°–90°). This anisotropy is caused due to absorption of the CS radiation inside the target, the strength of which is proportional to the absorption path length (α-dependent) traversed by the radiation (see Figure 1). It is further noted that the relative intensity of the characteristic X-rays gradually increases with incidence angle α in going from α = 15° to α = 55°, that is, as θ varies from 75° to 35°. This gradual increase in relative intensity of CS X-rays is caused mainly due to decreasing strength of photon absorption with reduced path lengths as a function of α in traversing through the target material before photons are registered in the detector. Further, it is noted that the intensity of Lα is about 17.1, 1.6 and 12.3 times larger than the intensity of Ll, Lβ and Lγ respectively, when measured at α = 60°. The angular distribution of relative intensity of all lines under consideration shows a maximum around 55° ± 5°. In the above angular variation of relative intensities, the experimental data have been normalized to theory at α = 45° for comparison. The comparison between the experimental and the simulation results is found to exhibit a satisfactory agreement within the uncertainty of measurements.
It is noted from Figure 3a–d that the relative intensity of all CS lines decreases for incidence angle larger than 60°. This feature is explained by the fact that the absorption of photons in the target decreases with incidence angle (see Figure 1) while the production cross-section of the backscattered electrons increases with incidence angle [15]. The net result of the two effects yields a maximum intensity at a specific incidence angle (here, α = 55° ± 5°). A complete set of numerical data on angular variation of intensity for different L X-ray lines at three impact energies, namely, 15, 20 and 25 keV obtained from measurements and from simulation are presented in Table 1, Table 2 and Table 3, respectively.

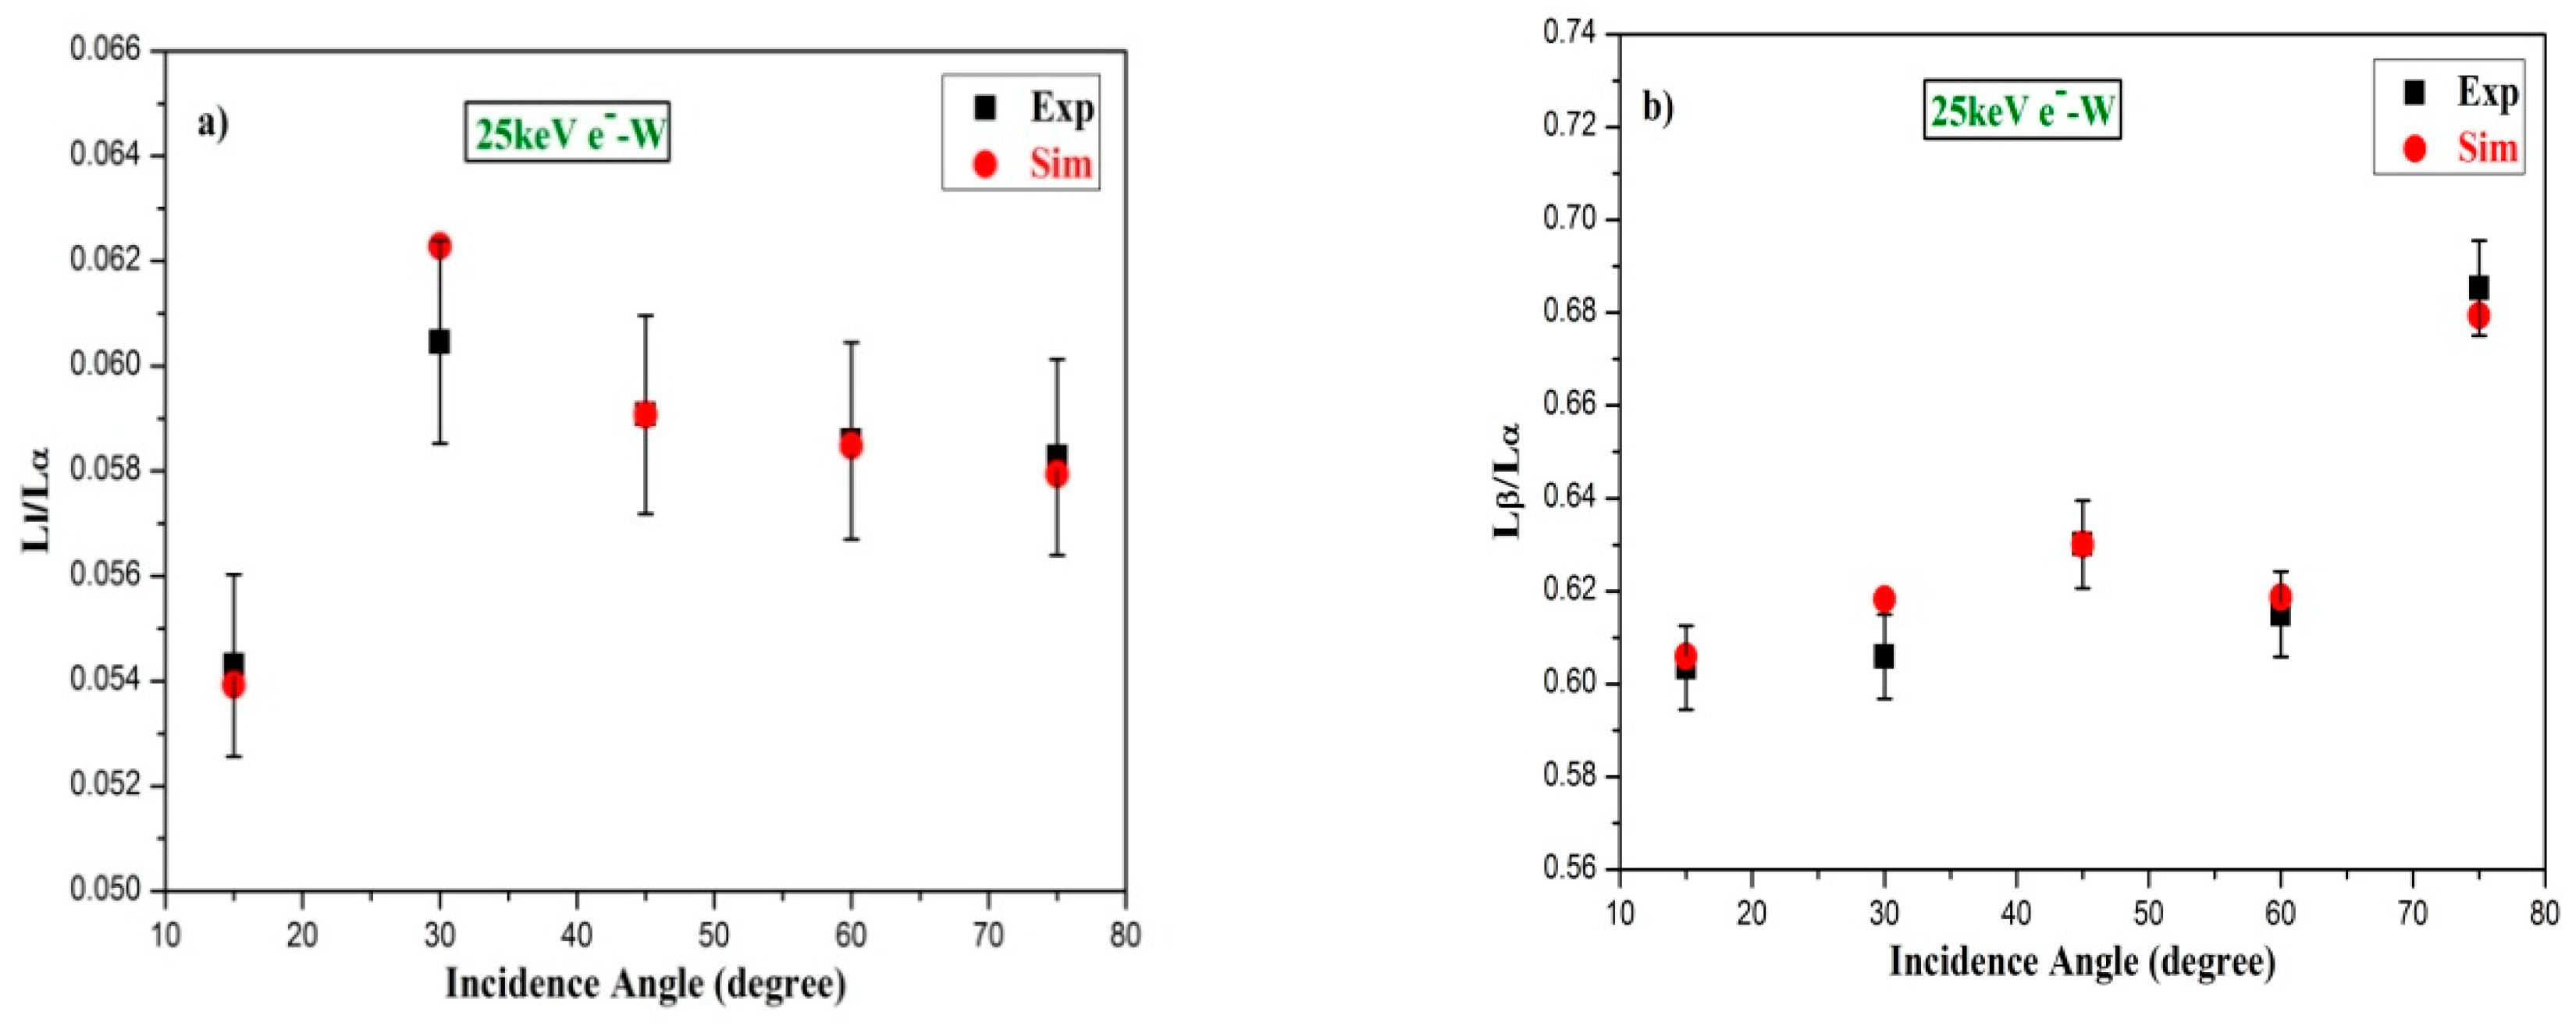
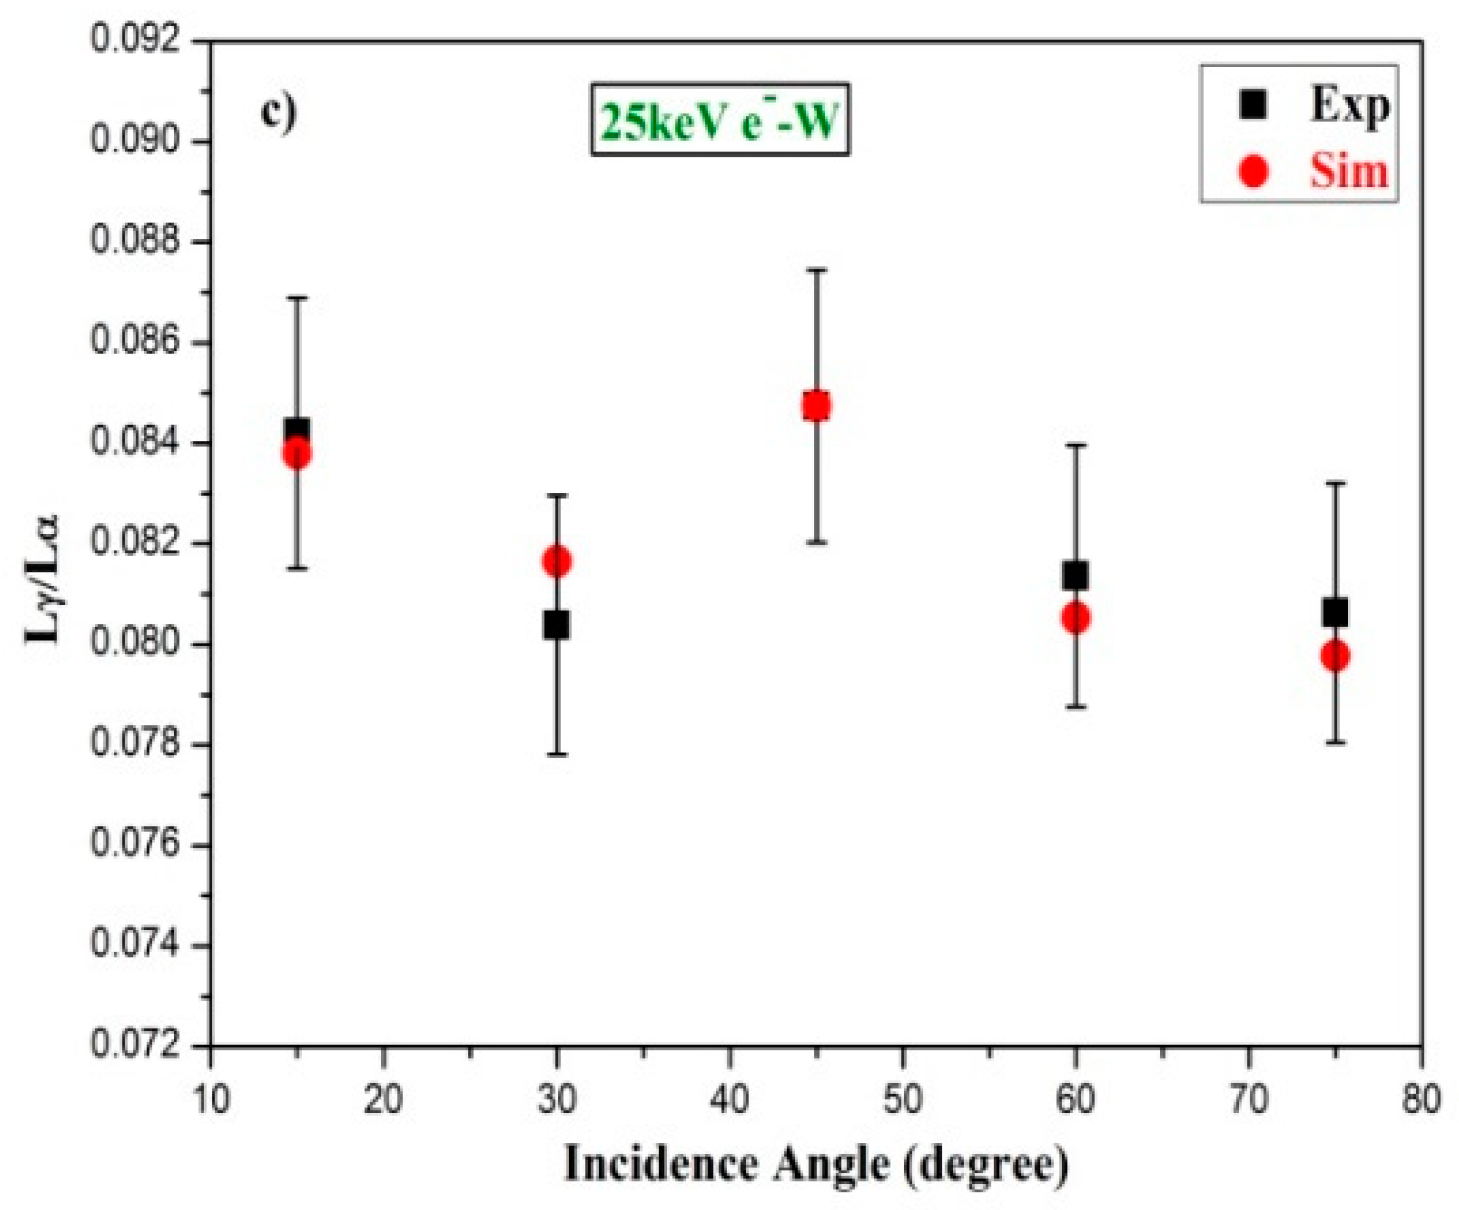
5.2. Intensity Ratio of L X-Ray Lines

The angular variation of intensity ratios of Ll/Lα, Lβ/Lα and Lγ/Lα X-ray lines was determined from the measured relative intensity of individual lines, and the corresponding variation has been compared with the calculations using the PENELOPE simulation code. Such variation of the intensity ratios of X-ray lines for Ll/Lα, Lβ/Lα and Lγ/Lα have been plotted as a function of incidence angle for a typical impact energy, namely, for 25 keV in Figure 4a–c, respectively.
The angular variation of intensity ratio of the considered X-ray lines is seen to exhibit a non-specific trend of variation; however, the magnitude of intensity ratio changes from one pair ratio of X-ray lines to the other pair ratio, for example, the magnitude of intensity ratio of Lβ/Lα is about 11-times larger than the magnitude of intensity ratio of Ll/Lα, whereas Lβ/Lα is about 6-times larger than the magnitude of intensity ratio of Lγ/Lα when measured at α = 45°. Despite such variable magnitude of intensity ratios among different X-ray lines, the experiment and the theory compare reasonably well with each other within the uncertainty of measurements. Further, it is noted that the angular variation of intensity ratio of Ll/Lα and that of Lβ/Lα show anisotropic distribution, whereas the angular variation of Lγ/Lα exhibits almost isotropic distribution within the uncertainty of measurements (see Table 1, Table 2 and Table 3).

5.3. Impact Energy Dependence of L X-Ray Intensity Ratio

We have obtained the impact energy dependence of intensity ratio of Ll, Lβ and Lγ X-ray lines relative to the intensity of Lα at a given incidence angle. As a typical example, the impact energy dependence of intensity ratios of Ll/Lα, Lβ/Lα and Lγ/Lα lines at incidence angle measured at α = 60° is shown in Figure 5a–c, respectively.
From Figure 5b,c, it is clearly seen that there is a linear dependence of Lβ/Lα and Lγ/Lα ratios on impact energy in the considered region. This dependence is found to be in good agreement with the simulation results within the uncertainty of measurements. In studies of impact energy dependence of relative intensity of L X-ray lines (Ll, Lα, Lβ and Lγ) of Sm, Ho, Er and Bi elements under bombardment of keV electrons, Ricz et al. [16] have shown that the intensity of these lines increases with impact energy for a fixed angle of incidence. Moreover, similar linear dependence of Ll/Lα ratio with impact energy is not found either by the results of measurements or by that of simulation. This different behavior of impact energy dependence of Ll/Lα ratio may partly arise due to the relatively poor intensity of the Ll line associated with a large uncertainty of measurements in comparison to that of the Lα line. Figure 5b,c further shows that the magnitude of Lβ/Lα ratio increases by a factor of about 1.36 in changing the impact energy from 15 to 25 keV, whereas the magnitude of Lγ/Lα ratio increases by a factor of about 1.49 when measured at α = 60°.

6. Conclusions

The impact energy and angular dependence of L X-ray lines induced by 10–25 keV electrons incident on a polycrystalline thick target of W (Z = 74) have been measured using a Si PIN photodiode detector and compared with results of the PENELOPE simulation. The angular range of incidence was varied from 15° to 75° at intervals of 5°. The variation of relative intensity of L X-ray lines, namely, Ll, Lα, Lβ and Lγ, as a function of incidence angle shows anisotropic distribution for all lines and exhibits a reasonable agreement with simulation results. The angular variation of the intensity ratios of Ll/Lα, Lβ/Lα and Lγ/Lα X-ray lines is found to be in good agreement with the MC calculations. The angular variation of intensity ratio of Ll/Lα and that of Lβ/Lα shows anisotropic distribution, whereas the angular variation of Lγ/Lα exhibits almost isotropic distribution within the uncertainty of measurements. These measurements are found to compare well with simulation results. Furthermore, the measured intensity ratios of Lβ/Lα and Lγ/Lα lines at a given incidence angle shows a linear increase with the impact energy, yielding good agreement with simulation, whereas the intensity ratio of Ll/Lα lines exhibits a non-linear variation with the impact energy and shows poor agreement with theory. The basic information extracted from this work could be summarized by stating that the ‘oblique’ incidence (around 40°–60°) of impacting electrons with the considered thick polycrystalline target enables a relatively larger intensity of the emitted characteristic L-lines than that of the ‘normal’ incidence. This finding enhances our understanding on X-line radiations which are generally needed for generating a larger intensity of radiations. Such radiations are usually employed in radiation therapy treatment related to medical science or in radiation damage studies of different targets related to materials and biological sciences.

Author Contributions

Conceptualization, B.S. and S.P.; Investigation, S.P. and B.S.; Methodology, B.S. and R.S.; Writing—original draft, B.S. and R.S.; Writing—review and editing, S.P., B.K.S. and R.S. All authors have read and agreed to the published version of the manuscript.

Funding

This research received no external funding.

Acknowledgments

The authors are thankful to Xavier Llovet for providing the MC calculations for this work and for holding fruitful discussions on many occasions on electron-induced collisions with thick targets. Bhupendra Singh is thankful to the University Grants Commission (UGC), Government of India, for awarding him a senior research fellowship during the progress of this work.

Conflicts of Interest

The authors declare that there is no conflict of interest.

References

  1. Davis, J.W.; Barabash, V.R.; Makhankov, A.; Ochl, L.P.; Slattery, K.T. Assessment of tungsten for use in the ITER plasma facing components. J. Nucl. Mater. 1998, 258–263, 308–312. [Google Scholar] [CrossRef]
  2. Joy, D.C. A database on electron-solid interactions. Scanning 1995, 17, 270–275. [Google Scholar] [CrossRef]
  3. Shima, K.; Nakagawa, T.; Umetani, K.; Mikumo, T. Threshold behavior ofCu-, Ge-, Ag-E-, and Au-L;shell ionization cross sections by electron impact. Phys. Rev. A 1981, 24, 32–117. [Google Scholar] [CrossRef]
  4. Schneider, H.; Tobehn, I.; Ebel, F.; Hippler, R. Absolute cross sections for inner shell ionization by lepton impact. Phys. Rev. Lett. 1993, 71, 2707–2709. [Google Scholar] [CrossRef]
  5. Fernández-Varea, J.M.; Segui, S.; Dingfelder, M. Lα, Lβ, and Lγ x-ray production cross sections of Hf, Ta, W, Re, Os, Au, Pb, and Bi by electron impact: Comparison of distorted-wave calculations with experiment. Phys. Rev. A At. Mol. Opt. Phys. 2011, 83, 022702. [Google Scholar] [CrossRef] [Green Version]
  6. Rahangdale, H.V.; Guerra, M.; Das, P.K.; De, S.; Santos, J.P.; Mitra, D.; Saha, S. Determination of subshell-resolved L -shell-ionization cross sections of gold induced by 15-40-keV electrons. Phys. Rev. A At. Mol. Opt. Phys. 2014, 89, 1–8. [Google Scholar] [CrossRef]
  7. Campos, C.S.; Vasconcellos, M.A.Z.; Llovet, X.; Salvat, F. Measurements of L-shell x-ray production cross sections of W, Pt, and Au by 10-30-keV electrons. Phys. Rev. A At. Mol. Opt. Phys. 2002, 66, 127191–127199. [Google Scholar] [CrossRef] [Green Version]
  8. Llovet, X.; Powell, C.J.; Salvat, F.; Jablonski, A. Cross Sections for Inner-Shell Ionization by Electron Impact. J. Phys. Chem. Ref. Data 2014, 43, 013102. [Google Scholar] [CrossRef]
  9. Wang, X.; Xu, Z.; Zhang, L.; Hu, P.; Shi, X. Angular distribution of L X-ray emission from tungsten following photoionization. Radiat. Phys. Chem. 2014, 103, 213–215. [Google Scholar] [CrossRef]
  10. Sestric, G.; Ferguson, S.; Wright, I.; Williams, S. Angular distributions of X-rays emitted following L 3 ionization of Au atoms by electron impact. Radiat. Phys. Chem. 2014, 102, 40–43. [Google Scholar] [CrossRef]
  11. Salvat, F. PENELOPE—A Code System for Monte Carlo Simulation of Electron and Photon Transport; OECD/NEA Data Bank/NSC Doc: Barcelona, Spain, 2015.
  12. Llovet, X.; Salvat, F. PENEPMA: A Monte Carlo Program for the Simulation of X-Ray Emission in Electron Probe Microanalysis. Microsc. Microanal. 2017, 23, 634–646. [Google Scholar] [CrossRef] [PubMed]
  13. Singh, B.; Kumar, S.; Prajapati, S.; Singh, B.K.; Llovet, X.; Shanker, R. Measurement of angular distributions of K x-ray intensity of Ti and Cu thick targets following impact of 10–25 keV electrons. J. Electron Spectrosc. Relat. Phenom. 2017, 216, 17–22. [Google Scholar] [CrossRef]
  14. Singh, B.; Prajapati, S.; Kumar, S.; Singh, B.K.; Llovet, X.; Shanker, R. Measurement of the angular distribution of thick target bremsstrahlung produced by 10–25 keV electrons incident on Ti and Cu targets. Radiat. Phys. Chem. 2018, 150, 82–89. [Google Scholar] [CrossRef]
  15. Yadav, R.K.; Shanker, R. Energy and angular distributions of backscattered electrons from the collision of 8-keV electrons with a thick tungsten target. Phys. Rev. A At. Mol. Opt. Phys. 2004, 70, 1–6. [Google Scholar] [CrossRef]
  16. Ricz, S.; Schlenk, B.; Berenyi, D.; Valek, A.; Hock, G.; Seif El Nasr, S.A.H. L X-ray production cross section for Sm, Ho, Er and Bi at several hundred keV electron impact. J. Phys. B At. Mol. Phys. 1978, 11, 4283–4286. [Google Scholar] [CrossRef]
Figure 1. Schematic of the electron beam-target-detector geometry of the employed experimental set up. Α = incidence angle, N = normal to the target surface, and θ = photon detection angle equal to (90°−α).
Atoms 08 00082 g001
Figure 2. Photon spectra showing fitting of the bremsstrahlung background and that of characteristic tungsten L X-ray lines produced from 25 keV electrons incident on W at α = 45° using the Gaussian multiple-peak fitting procedure (green line curves). Due to limited resolution of the detector, Lα, Lβ and Lγ lines are not resolved.
Atoms 08 00082 g002
Figure 3. Typical graphs showing variation of the measured relative intensity of (a) Ll, (b) Lα, (c) Lβ and (d) Lγ X-ray lines respectively, produced in collisions of 25 keV electrons with a pure polycrystalline thick W target as a function of incidence angle α. The black squares with error bars represent the measurements and the red circles denote the simulation results. The experimental data have been normalized to theory at α = 45°.
Atoms 08 00082 g003aAtoms 08 00082 g003b
Figure 4. Comparison of variation of the measured X-ray line intensity ratios of (a) Ll/Lα, (b) Lβ/Lα and (c) Lγ/Lα with that of the calculations from the PENELOPE simulation code for collisions of 25 keV electrons with a thick W target as a function of incidence angle. The black filled squares represent experimental data while red filled circles are data from simulation.
Atoms 08 00082 g004aAtoms 08 00082 g004b
Figure 5. Impact energy dependence of intensity ratio of Ll/Lα, Lβ/Lα and Lγ/Lα lines measured at an incidence angle α = 60°: (a) Ll/Lα, (b) Lβ/Lα and (c) Lγ/Lα, respectively. Black squares represent experiment whereas red circles denote corresponding simulation results.
Atoms 08 00082 g005
Table 1. Measured and simulation results for Ll, Lα, Lβ and Lγ X-ray photon yields (photons electron−1, keV−1Sr−1) as a function of incidence angle α that ranges from 15° to 75° in collisions of 15 keV electrons with a thick W target which are normalized at 45° to the Monte Carlo (MC) values.
α(Yield)Exp × 10−5(Yield)Sim × 10−5
LlLαLβLγLlLαLβLγ
15°0.2574.7452.8640.3990.2564.7502.8780.398
30°0.3656.0393.6590.4850.3685.9093.6530.482
45°0.3846.4994.0950.5510.3846.4994.0950.551
60°0.3936.7184.1320.5460.3946.7444.1730.543
75°0.3586.1464.2120.4950.3596.1994.2120.494
Table 2. Same as Table 1 for impact energy of 20 keV.
α(Yield)Exp × 10−5(Yield)Sim × 10−5
LlLαLβLγLlLαLβLγ
15°0.1522.7461.5500.2220.1612.7081.5732.278
30°0.1943.4111.9490.2510.2013.3211.9262.532
45°0.2103.6372.1240.2840.2113.6372.1242.840
60°0.2133.7832.2020.2720.2223.7912.2212.803
75°0.2003.6242.1500.2640.2133.6282.1932.719
Table 3. Same as Table 1 for impact energy of 25 keV.
α(Yield)Exp × 10−5(Yield)Sim × 10−5
LlLαLβLγLlLαLβLγ
15°0.2574.7452.8640.3990.2564.7502.8780.398
30°0.3656.0393.6590.4850.3685.9093.6530.482
45°0.3846.4994.0950.5510.3846.4994.0950.551
60°0.3936.7184.1320.5460.3946.7444.1730.543
75°0.3586.1464.2120.4950.3596.1994.2120.494
Publisher’s Note: MDPI stays neutral with regard to jurisdictional claims in published maps and institutional affiliations.

