New Energy Levels of Neutral Lanthanum Derived from an Optogalvanic Spectrum between 5610 and 6110 Å

Institute of Experimental Physics, Graz University of Technology, Petersgasse 16, A-8010 Graz, Austria
*
Author to whom correspondence should be addressed.
Atoms 2020, 8(4), 88; https://0-doi-org.brum.beds.ac.uk/10.3390/atoms8040088
Submission received: 6 November 2020
/
Revised: 29 November 2020
/
Accepted: 2 December 2020
/
Published: 4 December 2020
(This article belongs to the Section Atomic, Molecular and Nuclear Spectroscopy and Collisions)
Abstract
:In a previous paper, we reported on a complete optogalvanic (OG) spectrum of a discharge burning in a La–Ar gas mixture, in the spectral range 5610–6110 Å (17,851 to 16,364 cm−1). Now we are able to communicate further new energy levels, found via searching for laser-induced fluorescence lines when exciting unclassified lines from the OG spectrum. We were able to find 17 new levels, and for two further levels, the line list has extended. With the help of these 19 levels, we could classify 132 spectral lines.
1. Introduction
Lanthanum (La, Z = 57) has the electron ground state configuration [Xe] 5d6s2 and an empty 4f shell. The electronic structure and the spectrum of Lanthanum is of special interest, not only for practical reasons but also for the theoretical description of it.
La in its natural abundance has one dominant stable isotope (99.91%), with mass number 139, and a nuclear spin quantum number I = 7/2. Only this isotope could be detected in our laser spectroscopic investigations. The magnetic dipole moment and electric quadrupole moment are well known: µI = 2.7830455(9) µN and Q = 0.20(1)*10−28 m2 [1]. The ground state has designation 5d6s2 2D3/2. Altogether, today, around 340 energy levels with even parity and 160 levels with odd parity are known [2,3,4,5,6,7,8,9,10,11,12,13,14,15,16,17,18].
As reported in reference [16] (Atoms 2020, 8, 23; doi:10.3390/atoms8020023), we were able to record a complete optogalvanic (OG) spectrum of Lanthanum between 5610 and 6110 Å (17,851 to 16,364 cm−1), consisting of more than 1900 overlapping laser scans. In [16], the discovery of 12 even-parity levels and one odd-parity level was reported. Continuing the analysis of the spectra, we found a further 17 new energy levels with even parity. Further analysis of the spectrum is in progress. Two additional levels at 41,465.181 and 41,681.602 cm−1 were published earlier [14]. In the OG spectrum treated here, we found additional lines in which these levels are involved, confirming their existence. Thus, we give now a list of all lines classified by these two even-parity levels. Altogether, 132 spectral lines can be classified as transitions in which these 19 levels are involved. For checking the existence of the levels, we also set the laser wavelength to some lines in the ranges 6900–6110 and 5610–5550 Å, and observed OG and laser-induced fluorescence (LIF) signals.
For classification of the lines observed in our investigations, we used the program “Elements” [12,19], which shows classification suggestions together with proposed hyperfine structure (hf) patterns, calculated from already known energy levels and their hf constants. For some lines, up to 10 suggestions are found in a wavenumber interval of ±0.5 cm−1 around the wavenumber of the treated line. If for a line under investigation, no suggestion fits to the wavenumber and the observed hf pattern, we had to conclude that a new energy level is involved in the observed transition. The fit of the hf patterns was performed using the program “Fitter” [20]. Methods for finding new energy levels are described in references [12,14]. Some information we could obtain from an available Fourier transform spectrum [21,22].
2. Experiment
As reported in reference [16], the source of free La atoms was a discharge, burning in a La–Ar plasma. We used, as in several works before (e.g., [5]), a see-through hollow cathode lamp. The cylindric cathode had a length of 20 mm and was made from copper, the inner wall bushed with La, with an inner diameter of 3 mm. The discharge was started in Ar buffer gas of ca. 0.1 mbar pressure. After some minutes, a sputtering process began and the discharge was carried mainly by a La plasma. The color of the discharge changed during this process from grey-blue with moderate intensity (Ar) to white, emitting then very bright light. In order to enhance the sputtering process and to lower the Doppler width of the lines, the discharge housing was embedded in liquid nitrogen (see sketch in reference [16]). The discharge was operated in constant current mode at ca. 90 mA.
Tunable laser light was generated by a homemade continuous wave, actively stabilized ring dye laser, operated with R6G, pumped by a frequency-doubled Nd:YAG-laser (Coherent Verdi). A line width as low as ca. 1 MHz was obtained and the scanning range was 45 GHz (1.5 cm−1). Scan velocity was about 250 MHz/s, and we stored 50 data points per second. For additional wavelength regions, we also used the dyes DCM and R110. The frequency scale was generated using the transmission intensity of a temperature-stabilized confocal Fabry–Perot cavity (free spectral range 367.33(2) MHz).
The detected OG signal is proportional to the change of the power supply voltage in dependence on the laser wavelength. Since this change is very small compared to the applied voltage (some mV against ca. 350 V), detection is possible only when applying quite sensitive methods. Thus, before entering the discharge region, the laser light was intensity modulated by means of a mechanical chopper and the voltage change was amplified by means of a Lock-In amplifier, synchronized with the chopper.
The structures in the recorded OG spectra show all possible transitions independently of which energy states are involved. These lines can be classified due to their wavelength and their characteristic hf patterns. However, if an observed line cannot be explained as the transition between already known energy levels, we have to conclude that a new level is involved and we need information of at least one of the combining energy levels. For this purpose, we apply detection of LIF. We focused the discharge light by means of quartz lenses to the entrance slit of a monochromator and detected the transmitted light by means of a photomultiplier and a Lock-In amplifier. By tuning the monochromator, we could find LIF lines, which intensities are modulated with the chopper frequency, and were able to determine their wavelength. The combination of all information (LIF and laser wavelengths and hf pattern of the investigated transition) allowed us to discover up to now unknown energy levels, as described in references [12,14]. A sketch of the apparatus used can be found e.g., in reference [11]. Besides lines of La I, we also found lines belonging to La II and to the carrier gas of the discharge (Ar I, Ar II).
Since, meanwhile, a huge number of La I energy levels are known, we await to find new levels in the energy range between 40,000 cm−1 and the ionization limit of 44,981 cm−1 [23]. Taking into account the exciting photon energy (17,851 to 16,364 cm−1), the lower energy levels of the excited, not classifiable transitions must have energies above 22,000 cm−1 and below 29,000 cm−1. A schematic level scheme of La is shown in reference [16].
Let us assume that an odd-parity level in this energy range, sufficiently populated by the discharge, can be excited by the chopped laser light to a new, previously unknown even-parity level. This odd-parity level can also decay to low-lying even-parity levels. Since the odd-parity level is excited periodically, its population and thus, the intensities of its decay lines are also modulated by the chopper frequency. This gives the possibility to find the wavelengths of LIF lines by tuning the monochromator transmission wavelength and to identify via this way the odd-parity level. The phase of the detected LIF lines is opposite to the detected laser stray light and to the OG signal.
If the excited medium-energy level has even parity, the situation is in principle the same, but the lowest odd-parity level has an energy of 13,260 cm−1. Thus, no decay to lower odd-parity levels is possible in the visible or near ultraviolet region, and excited even-parity levels cannot be identified by this method. Indeed, only a very small number (ca. 5) of high-lying odd-parity levels were found by laser spectroscopy.
In principle, the new, high-lying level can decay and lead to LIF lines. However, as our experiments show, laser excitation leads to a high OG signal (mirroring the ionization probability) but only in very few cases to a detectable LIF signal. Thus, we have to conclude that the ionization probability in the discharge plasma is much higher than the probability of radiative decay.
3. Results
The levels found during this investigation are listed in Table 1 and all have even parity. Additionally, the levels 41,465.181 and 41,681.502 cm−1, published in reference [14], are listed with all classified lines.
In columns 1 to 3, J-value, energy E and hf constants A of the discovered levels are given. Due to the limited signal-to-noise-ratio (SNR) of the records, no values for the constants B could be determined. The levels are ordered by energy. The uncertainty of the energies of the levels is dependent on the number of lines classified by the level and by the accuracy of their wavelengths (given in col. 4). For lines in which center of gravity (cg) wavelength was determined by our lambdameter (uncertainty ±0.01 Å), two digits are given. For several excited lines, other, well classified lines showed up in the same laser scan due to the high line density (confer Figure 1 and Figure 2). In such cases, we could determine the cg wavelength with lower uncertainty. For the well-known classified lines, we could calculate their cg wavelengths from updated level energies [24]. For the conversion from wave number to wavelength, the formula given by Peck and Reeder [25] for the dispersion of air was applied. A common fit of all lines in the record allowed us to determine the spacing between the cg frequencies of the lines and to calculate the wavelength of the line classified by the new level. Wavelengths determined in this way are given in Table 1 with three digits (uncertainty ±0.003 Å).
The line on which the corresponding level was discovered is marked in Table 1 by an asterisk. For all lines classified by the corresponding new level, J-values, energies, and constants A and B of the combining level are given in columns 5 to 8. In column 9, the source of the A and B values in columns 7 and 8 is given. Column 10, comments, contains: nf means observation of LIF on a decay line of the lower level (“negative” LIF line), nf+ a strong LIF signal. Decay lines of the upper levels are marked with f. The wavelength of the LIF line is given without decimal places. For lines appearing in the FT spectra, the remark FT is given, followed by the SNR in the FT spectrum. Lines without comment are observed in the OG spectrum only and classified due to wavelength and hf pattern.
As can be noticed from Table 1, we confirmed the existence of the discovered levels also using laser wavelengths in the red region of the spectrum (6900–6100 Å). Of course, not all excitations of the predicted transition wavelengths were successful. However, sometimes due to such experiments, we discovered other new levels, which are also published in this work.
In Figure 1 and Figure 2, typical OG records are shown. Classification of the visible lines is given in Table 2.
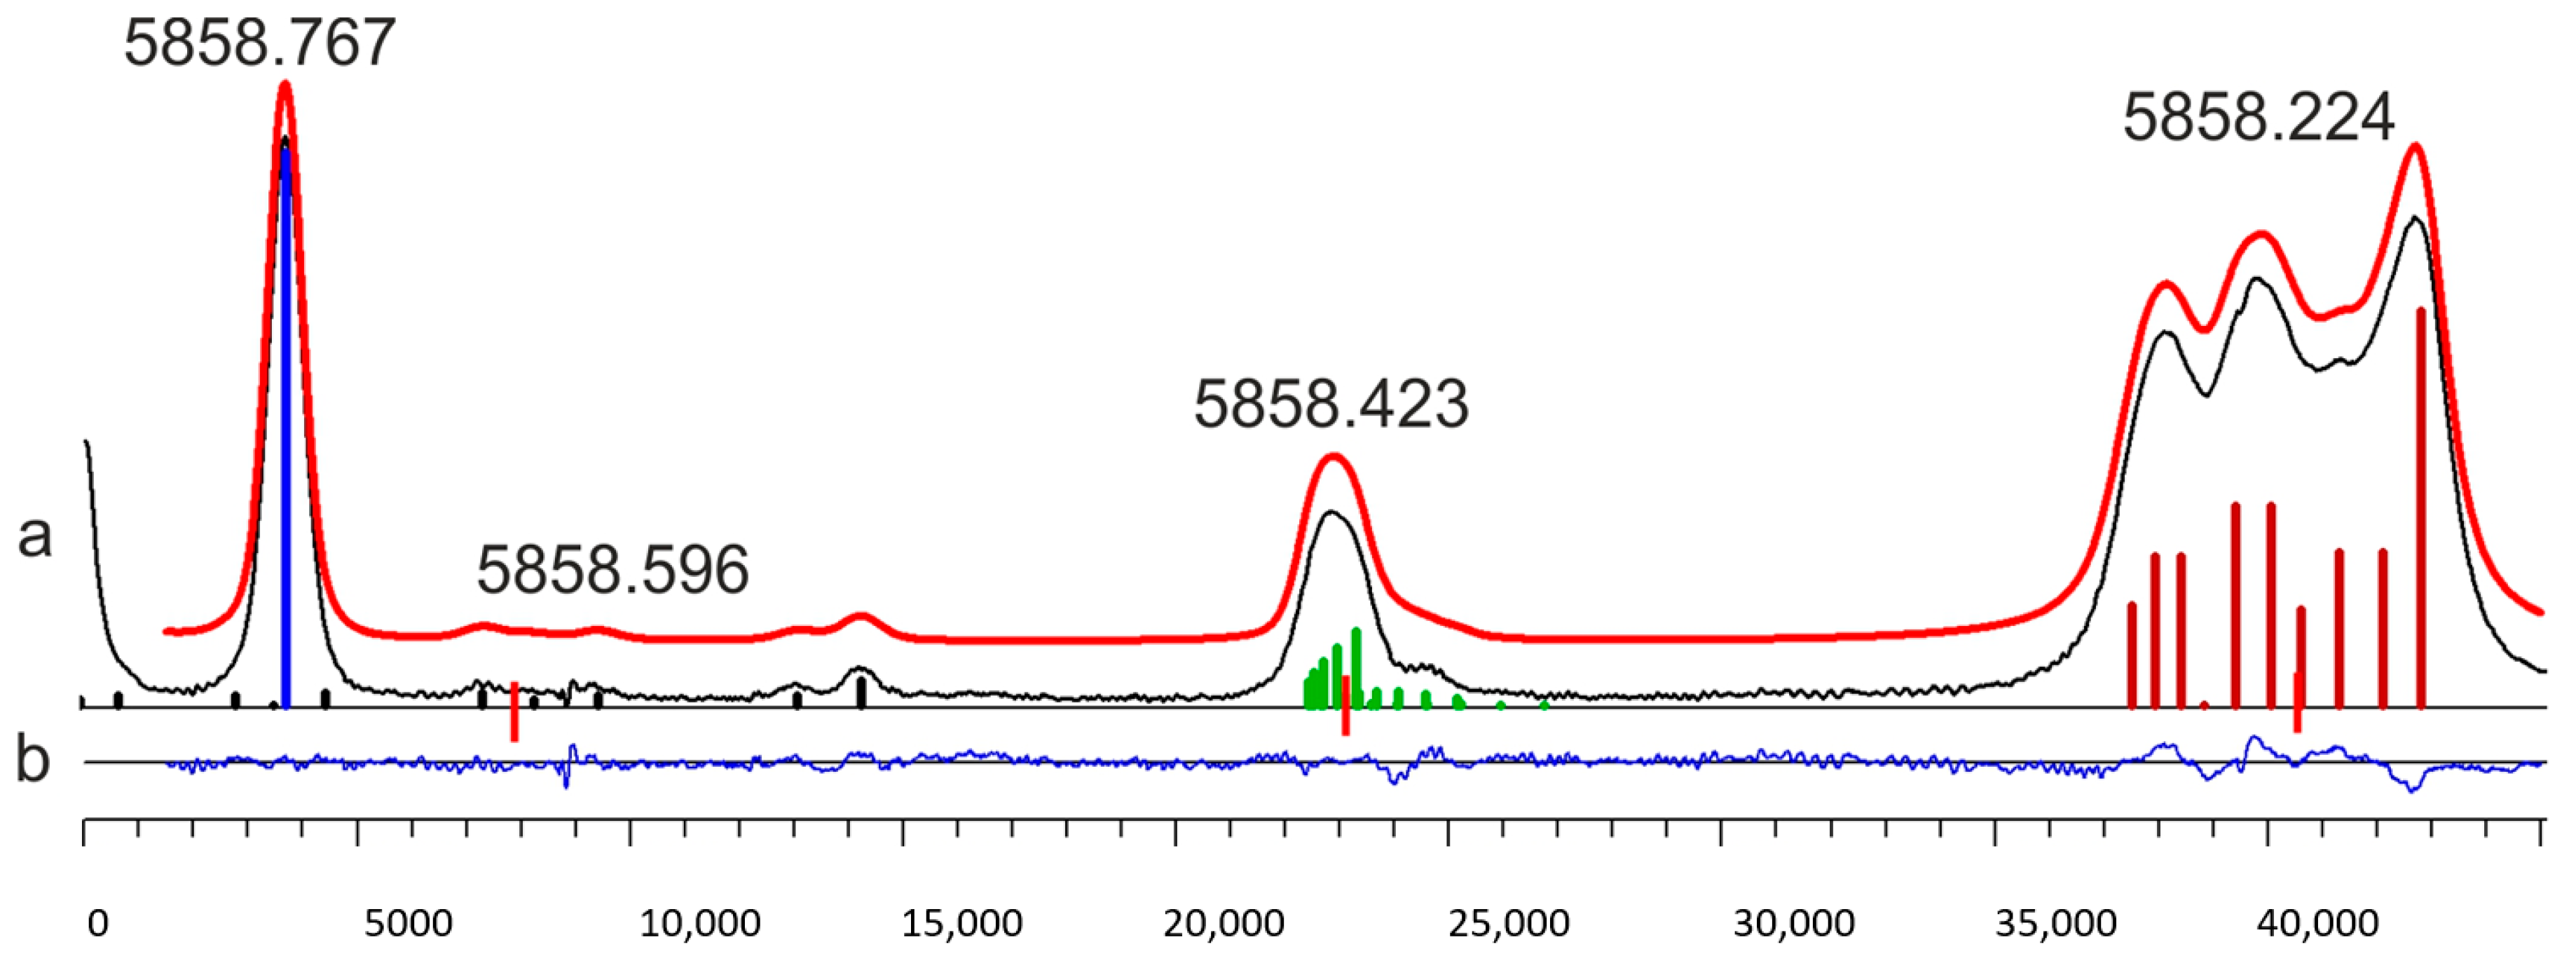
The laser scan started in Figure 1 at 5858.68 Å. The high peak at ca. 4000 MHz frequency offset is the last hf component of a widely split line (5857.767 Å, cg frequency at −6945 MHz). The next weak structure belongs to a line at 5858.596 Å. Both these lines are transitions between well-known levels and thus, their wavelengths can be calculated from the level energies, using recently improved energy values [24]. The hf structure of the line at ca. 23,000 MHz frequency offset can be nicely fitted, assuming the hf constants and J-values given in Table 2, but we were not able up to now to classify the line. The last hf pattern at 5858.224 Å was also not classified. The wavelength of the last two lines was determined from the differences of the cg frequencies. After excitation with laser light at the wavelength of the highest peak of the last line, we observed strong LIF at 4494 Å, with an opposite phase relative to the OG signal, identifying the level at 24,910.373 cm−1 as the lower level of the excited transition. This line did lead to the discovery of the new level at 41,975.663(10) cm−1, even parity, J = 3/2, A = 140(3) MHz. Z.
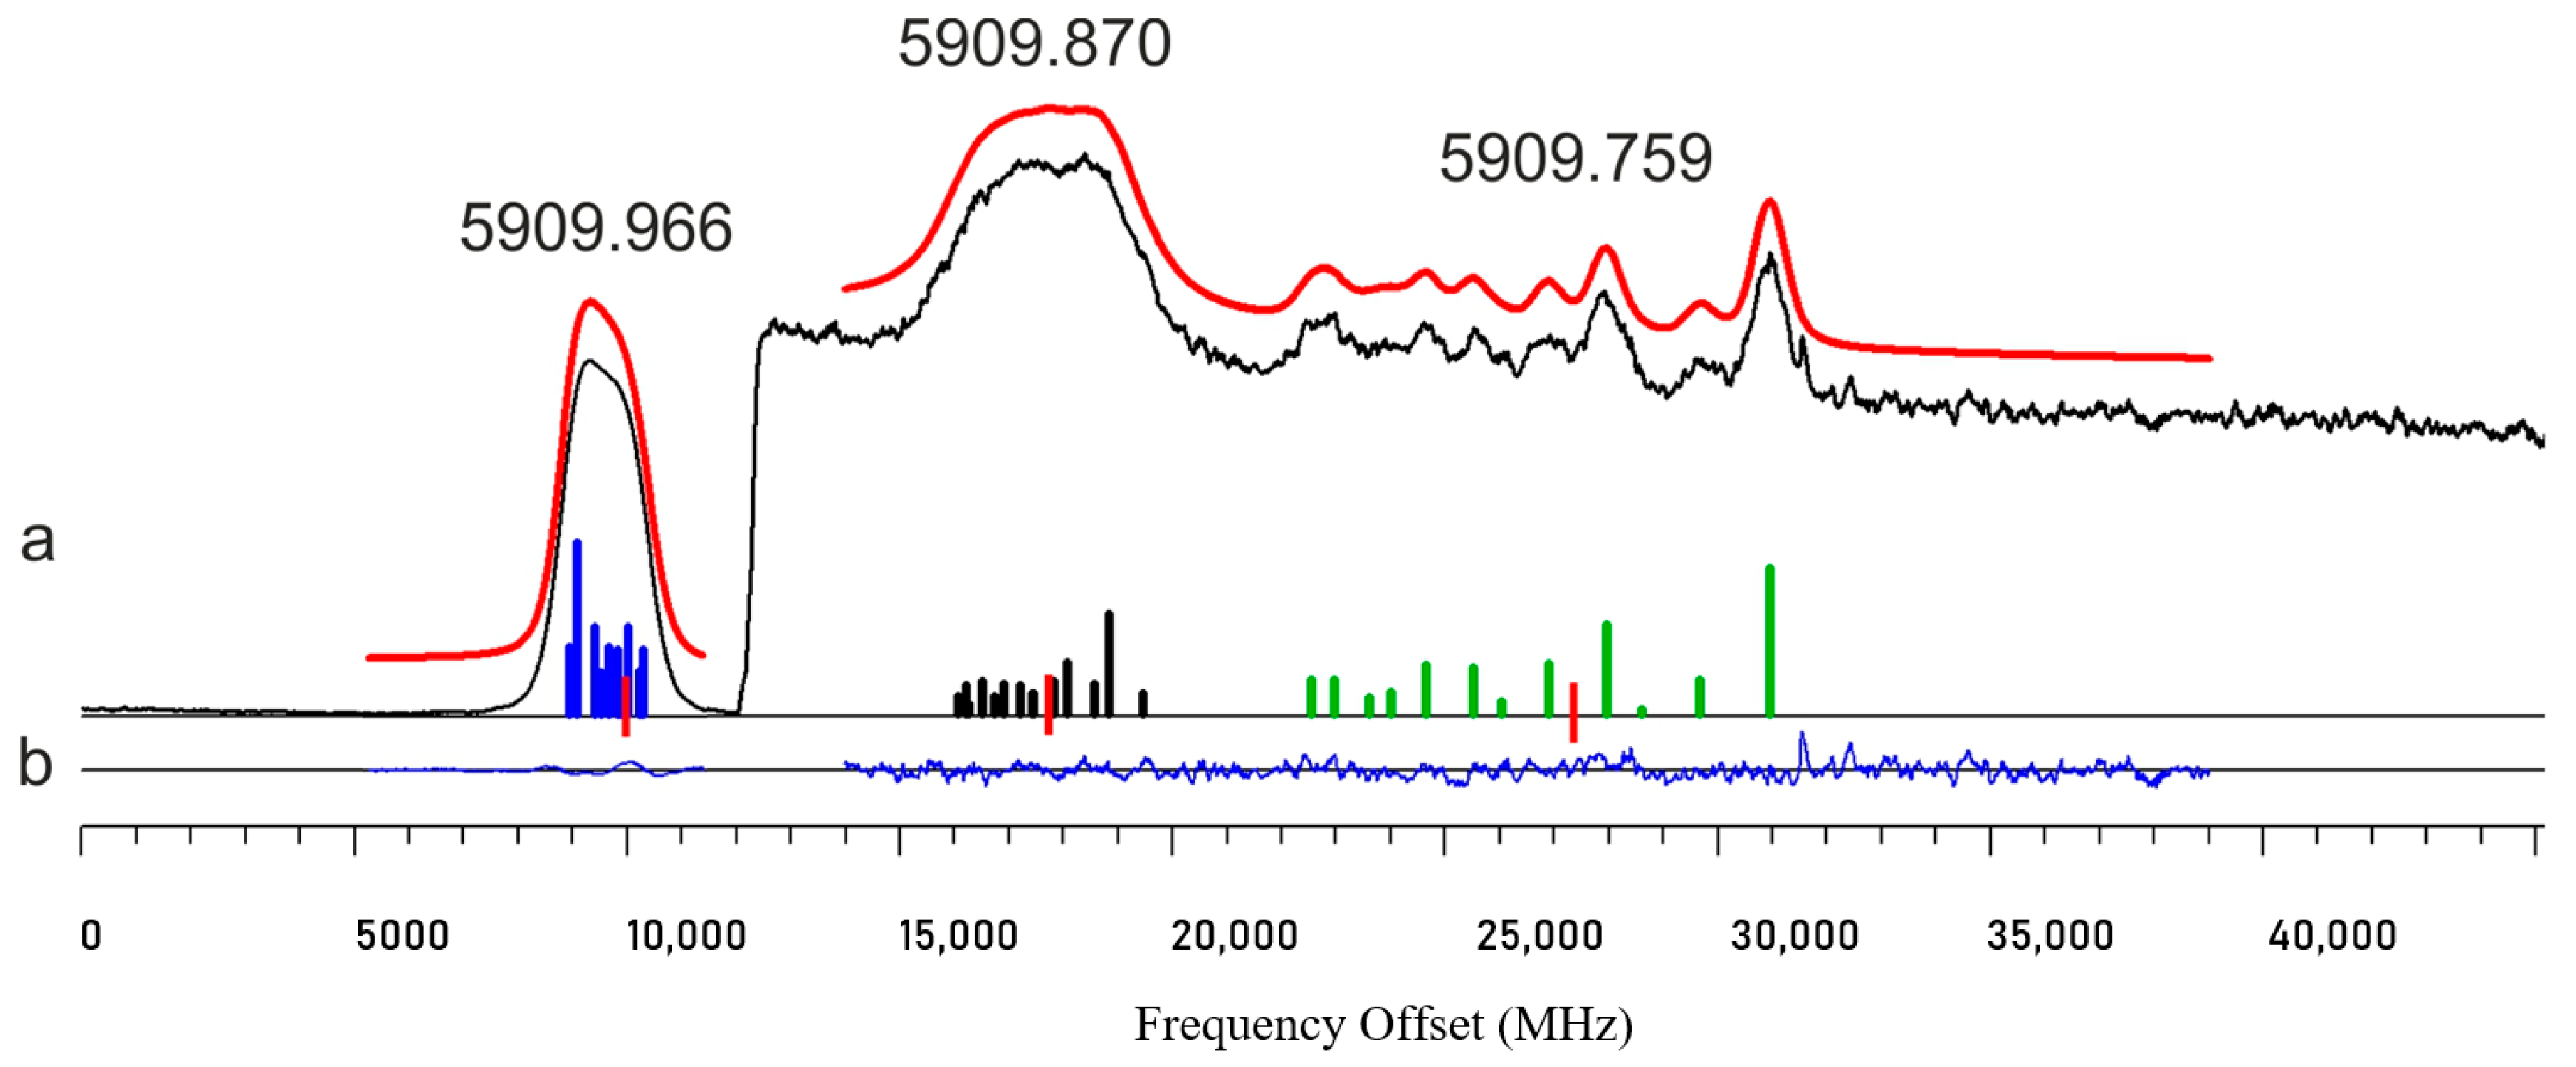
Figure 2 shows a record in which we have changed the amplification of the OG signal by a factor of 10 after ca. 12,000 MHz scan offset, since we noticed in another scan, starting at the same wavelength of 5910.07 Å, that after the strong line at 5909.966 Å, there might be some structures. Indeed, two weak lines are now clearly visible. The line at 5909.870 Å could not be classified, but their cg wavelength could be easily determined from both other classified lines, using the differences of the cg frequencies. Excitation of the unclassified line led to the observation of LIF at 4137 and 5639 Å, identifying the odd-parity level at 25,218.264 cm−1 as the lower level of the laser-driven transition, and finally, to the new even-parity level at 42,134.425(10) cm−1, J = 5/2, A = 209.9(20) zMHz. MHz.
As can be seen from the figures, the separation of the hf components of some lines is quite small and certainly much smaller than the resolution of the experiment, in which the FWHM of the line components is limited mainly by Doppler broadening (about 800 MHz) and additional collisional broadening. These effects are treated in more detail in reference [11]. Thus, we cannot fit each hf component separately. Instead, for each line, a start envelope curve is generated by a simulation of the observed hf pattern, using features contained in “Elements” [12,19]. For already classified lines, J-values and hf constants are known, and the FWHM is adapted to obtain agreement between the recorded and simulated curve. For unclassified lines, as mentioned before, J-value and hf constants of the lower level are known, and we vary the A-factor of the new level and FWHM until we obtain agreement. These values are then the start values of the program “Fitter” [20], which minimizes the deviation between the simulated and observed hf pattern with a least squares procedure. The program allows us to determine which parameters are set to be fixed and which ones are treated as free parameters (e.g., A-factor of the new level, FWHM). Moreover, up to five spectral lines contained in one laser scan can be fitted simultaneously, even if their hf patterns are overlapping, and the program gives their cg frequency positions in the scan
4. Conclusions
This paper reports 17 previously unknown energy levels of La I, having even parity. For two further levels, reported in reference [14], the full list of classified transitions is given. These 19 levels made it possible to classify altogether 132 spectral lines. The discovery of the new levels can be seen as a contribution to find more and more energy levels of La, enabling a future theoretical description of the energy levels.
Author Contributions
L.W. conceptualization, supervision, investigation, writing. T.B. investigation. All authors have read and agreed to the published version of the manuscript.
Funding
This research received no external funding.
Acknowledgments
The authors are thankful to two members of our group, B. Gamper and M. Faisal, who recorded some of the OG spectra used in this paper.
Conflicts of Interest
The authors declare no conflict of interest.
References
- Raghavan, P. Table of Nuclear Moments. At. Data Nuclear Data Tables 1989, 42, 189. [Google Scholar] [CrossRef]
- Martin, W.C.; Zalubas, R.; Hagan, L. Atomic Energy Levels—The Rare-Earth Elements; US. Nat. Bureau Stand: Washington, DC, USA, 1978; p. 411.
- Furmann, B.; Stefańska, D.; Dembczyński, J. Experimental investigations of the hyperfine structure in neutral La: I. Odd parity levels. J. Phys. B 2009, 42, 175005. [Google Scholar] [CrossRef]
- Furmann, B.; Stefańska, D.; Dembczyński, J. Experimental investigations of the hyperfine structure in neutral La: II. Even parity levels. J. Phys. B 2010, 43, 015001. [Google Scholar] [CrossRef]
- Nighat, Y.; Raith, M.; Manzoor, H.; Windholz, L. Investigation of the hyperfine structure of lanthanum lines by a laser-induced fluorescence technique. J. Phys. B 2010, 43, 125001. [Google Scholar] [CrossRef]
- Güzelçimen, F.; Siddiqui, I.; Başar, B.; Kröger, S.; Windholz, L. New energy levels and hyperfine structure measurements of neutral lanthanum by laser-induced fluorescence spectroscopy. J. Phys. B 2012, 45, 135005. [Google Scholar] [CrossRef]
- Siddiqui, I.; Shamim, K.; Gamper, B.; Dembczyński, J.; Windholz, L. Optogalvanic spectroscopy of the hyperfine structure of weak La I lines: Discovery of new even parity fine structure levels. J. Phys. B 2013, 46, 065002. [Google Scholar] [CrossRef]
- Gamper, B.; Głowacki, P.; Siddiqui, I.; Dembczyński, J.; Windholz, L. New even-parity fine structure levels of the Lanthanum atom discovered by means of optogalvanic spectroscopy. J. Phys. B 2014, 47, 165001. [Google Scholar] [CrossRef]
- Windholz, L.; Gamper, B.; Głowacki, P.; Dembczyński, J. The Puzzle of the La I Lines 6520.644 Å and 6519.869 Å. Spectr. Anal. Rev. 2014, 2, 10–18. [Google Scholar] [CrossRef] [Green Version]
- Başar, G.; Gamper, B.; Güzelçimen, F.; Öztürk, I.K.; Binder, T.; Başar, G.; Kröger, S.; Windholz, L. New even and odd parity fine structure levels of La I discovered by means of laser-induced fluorescence spectroscopy. J. Quant. Spectrosc. Radiat. Transf. 2016, 187, 505–510. [Google Scholar] [CrossRef]
- Windholz, L.; Gamper, B.; Binder, T. Variation of the observed widths of La I lines with the energy of the upper excited levels, demonstrated on previously unknown energy levels. Spectr. Anal. Rev. 2016, 4, 23–40. [Google Scholar] [CrossRef] [Green Version]
- Windholz, L. Finding of previously unknown energy levels using Fourier-transform and laser spectroscopy. Phys. Scr. 2016, 91, 114003. [Google Scholar] [CrossRef]
- Sobolewski, L.M.; Binder, T.; Güney, C.; Gamper, B.; Windholz, L. Laser induced fluorescence and optogalvanic spectroscopy applied to find previously unknown energy levels of La I and studies of their Zeeman structure. J. Quant. Spectrosc. Radiat. Transf. 2017, 200, 108–112. [Google Scholar] [CrossRef]
- Windholz, L. Progress in Finding New Energy Levels Using Laser Spectroscopy. Atoms 2018, 6, 54. [Google Scholar] [CrossRef] [Green Version]
- Öztürk, I.K.; Basar, G.; Basar, G.; Özdalgic, B.; Bingöl, D.; Güzelcimen, F.; Windholz, L.; Kröger, S. New energy levels of atomic lanthanum with small total angular momentum quantum number discovered by laser spectroscopic methods in the near IR. J. Quant. Spectrosc. Radiat. Transf. 2020, 253, 107100. [Google Scholar] [CrossRef]
- Windholz, L.; Binder, T. The Optogalvanic Spectrum of Neutral Lanthanum between 5610 and 6110 Å. Atoms 2020, 8, 23. [Google Scholar] [CrossRef]
- Windholz, L.; Gamper, B. New energy levels of La I deduced from the investigation of red spectral lines. J. Quant. Spectrosc. Radiat. Transf. 2020, 256, 107. [Google Scholar] [CrossRef]
- Faisal, M.; Siddiqui, I.; Windholz, L. New energy levels of La I found by laser spectroscopy. J. Quant. Spectrosc. Radiat. Transf. 2020. submitted. [Google Scholar]
- Windholz, L.; Guthöhrlein, G.H. Classification of Spectral Lines by Means of their Hyperfine Structure. Application to Ta I and Ta II Levels. Phys. Scr. 2003, T105, 55–60. [Google Scholar] [CrossRef]
- Guthöhrlein, G.H. Program Package “Fitter”; Holstenhofweg 85, D-22043; Helmut-Schmidt-Universität, Universität der Bundeswehr: Hamburg, Germany, 1998; unpublished. [Google Scholar]
- Güzelçimen, F.; Tonka, M.; Uddin, Z.; Bhatti, N.A.; Windholz, L.; Kröger, S.; Başar, G. Revised energy levels of singly ionized lanthanum. J. Quant. Spectrosc. Radiat. Transf. 2018, 211, 188–199. [Google Scholar] [CrossRef]
- Güzelçimen, F.; Başar, G.; Tamanis, M.; Kruzins, A.; Ferber, R.; Windholz, L.; Kröger, S. High resolution Fourier transform spectroscopy of lanthanum in Ar discharge in the near-infrared. Astrophys. J. Suppl. Ser. 2013, 208, 18. [Google Scholar] [CrossRef]
- Garton, W.R.S.; Wilson, M. Autoionization broadened Rydberg Series in the Spectrum of La I. Astrophys. J. 1966, 145, 333. [Google Scholar] [CrossRef]
- Güzelçimen, F.; Başar, G.; Kröger, S.; Windholz, L. Revised energy levels of atomic lanthanum. Astrophys. J. Suppl. Ser. 2020. submitted. [Google Scholar]
- Peck, E.R.; Reeder, K. Dispersion of Air. J. Opt. Soc. Am. 1972, 62, 958. [Google Scholar] [CrossRef]
- Basar, G.; Basar, G.; Kröger, S. High resolution measurements of the hyperfine structure of atomic Lanthanum for energetically low lying levels of odd parity. Opt. Commun. 2009, 282, 562–567. [Google Scholar] [CrossRef]
- Furmann, B.; Stefańska, D.; Dembczyński, J. Hyperfine structure analysis odd configurations levels in neutral lanthanum: I. Experimental. Phys. Scr. 2007, 76, 264. [Google Scholar] [CrossRef]
- Kajoch, A.; Krzykowski, A.; Stefanska, D.; Furmann, B.; Jarosz, A. Studies of hyperfine structure of La I by laser spectroscopy on atomic beam. Acta Phys. Pol. A 1996, 89, 517. [Google Scholar] [CrossRef]
- Basar, G.; Basar, G.; Er, A.; Kröger, S. Experimental hyperfine structure investigation of atomic La. Phys. Scr. 2007, 75, 572–576. [Google Scholar] [CrossRef]
Figure 1.
Optogalvanic laser scan starting at 5858.68 Å. (a) Experimental record (black), fitted curve (red), and hf components. The red bars mark the cg frequencies. (b) Difference between experimental and fitted trace, magnified by a factor of 1.84. The line at 5858.224 Å enabled the discovery of the new level at 41,975.663 cm−1 (see Table 1).

Figure 2.
Optogalvanic laser scan starting at 5910.07 Å. (a) Experimental record (black), fitted curve (red), and hf components. The red bars mark the cg frequencies. (b) Difference between experimental and fitted trace. The line at 5909.870 Å enabled the discovery of the new level at 442,134.425 cm−1 (see Table 1). The line at 5909.966 Å had much higher intensity than the others, thus at a frequency offset of 12,000 MHz, the amplification was increased by a factor of 10. This also increased the OG background, thus a jump of the signal occurred.


Table 1.
New La I energy levels and lines classified by these levels. E—energy; wl—wavelength; tw—this work. OG observation of only the OG signal. FT—wavelength determined from the Fourier transform spectrum with given SNR. nf—LIF line (phase opposite to the OG signal, “negative” LIF); nf+—strong LIF signal. f—LIF line (in phase with the OG signal). Wavelengths in column 10 are given without digits after decimal point.
| Upper Even-Parity Level | Line | Lower Odd-Parity Level | |||||||
|---|---|---|---|---|---|---|---|---|---|
| J | E (cm−1) | A (MHz) | wl (Å) | J | E (cm−1) | A (MHz) | B (MHz) | Ref. to Col. | Remark |
| 1 | 2 | 3 | 4 | 5 | 6 | 7 | 8 | 9 | 10 |
| 7/2 | 41,254.286 (10) | 147 (3) | 5543.79 | 7/2 | 23,221.093 | −76.4 (3) | 59 (4) | [26] | nf 5234 |
| 5569.17 | 7/2 | 23,303.253 | −28.1 (5) | 49 (20) | [27] | nf 5211 | |||
| 5620.39 | 9/2 | 23,466.829 | 373.1 (5) | 18 (10) | [27] | ||||
| 5752.363 | 5/2 | 23,874.944 | 241.7 (23) | 0 (15) | [27] | ||||
| 5809.575 | 5/2 | 24,046.093 | 325.8 (17) | −44 (15) | [27] | ||||
| 5823.939 | 7/2 | 24,088.538 | −134.1 (40) | 72 (30) | [27] | ||||
| 5878.89 | 9/2 | 24,248.989 | 405 (2) | 8 (4) | [5] | ||||
| 5934.971 * | 7/2 | 24,409.675 | 188.4 (17) | 17 (15) | [27] | nf 4280 | |||
| 5969.77 | 5/2 | 24,507.870 | 188 (2) | 15 (5) | [5] | ||||
| 6144.58 | 5/2 | 24,984.291 | 284.5 (17) | 22 (20) | [27] | ||||
| 6184.50 | 9/2 | 25,089.311 | 0 (1) | 140 (20) | [16] | ||||
| 7/2 | 41,465.181 (10) + | 115.6 (20) | 5504.50 | 7/2 | 23,303.253 | −28.1 (5) | 49 (20) | [27] | |
| 5554.53 | 9/2 | 23,466.829 | 373.1 (5) | 18 (10) | [27] | ||||
| 5683.40 * | 5/2 | 23,874.944 | 241.7 (23) | 0 (15) | [27] | nf+ 4791 nf 4714 nf 4380 | |||
| 5739.237 | 5/2 | 24,046.093 | 325.8 (17) | −44 (15) | [27] | nf 4157 | |||
| 5753.26 | 7/2 | 24,088.538 | −134.1 (40) | 72 (30) | [27] | nf 4339 | |||
| 5806.875 | 9/2 | 24,248.989 | 405 (2) | 8 (4) | [5] | nf 4966 f 3941 | |||
| 5861.59 | 7/2 | 24,409.675 | 188.4 (17) | 17 (15) | [27] | nf 4280 | |||
| 6065.96 | 5/2 | 24,984.291 | 284.5 (17) | 22 (20) | [27] | nf 4549 | |||
| 6104.8606 | 9/2 | 25,089.311 | 0 (1) | 140 (20) | [16] | ||||
| 6153.32 | 5/2 | 25,218.264 | 101 (5) | - | [7] | ||||
| 6215.28 | 7/2 | 25,380.277 | 389 (1) | - | [16] | ||||
| 6609.20 | 5/2 | 26,338.932 | 103.2 (22) | −29 (20) | [27] | nf+ 3953 | |||
| 7446.3345 | 7/2 | 28,039.456 | 166.2 (56) | 0 (20) | [27] | FT 8 | |||
| 1/2 | 41,592.957 (10) | 1443 (4) | 5939.999 | 3/2 | 24,762.601 | 418.0 (10) | 10 (6) | [27] | nf 4037 |
| 6257.649 * | 1/2 | 25,616.935 | −297.3 (15) | 0 | [27] | nf+ 5515 nf 5437 nf 3902 | |||
| 6267.90 | 3/2 | 25,642.997 | 273.3 (2) | 4 (4) | [28] | nf 4065 nf 5365 nf 5429 nf 5565 | |||
| 7/2 | 41,629.806 (10) | 268 (2) | 5504.177 | 9/2 | 23,466.829 | 373.1 (5) | 18 (10) | [27] | |
| 5685.50 | 5/2 | 24,046.093 | 325.8 (17) | −44 (15) | [27] | nf- 4157 nf 6038 | |||
| 5751.87 | 9/2 | 24,248.989 | 405 (2) | 8 (4) | [5] | ||||
| 5805.546 * | 7/2 | 24,409.675 | 188.4 (17) | 17 (15) | [27] | nf 4280 | |||
| 5838.83 | 5/2 | 24,507.870 | 188 (2) | 15 (5) | [5] | nf 4079 nf 4262 nf 4650 | |||
| 6005.96 | 5/2 | 24,984.291 | 284.5 (17) | 22 (20) | [27] | nf 4549 nf 4479 nf 4177 | |||
| 6041.92 | 7/2 | 25,083.354 | 70.8 (5) | 25 (15) | [29] | ||||
| 6044.09 | 9/2 | 25,089.311 | 0 (1) | 140 (20) | [16] | ||||
| 6395.108 | 9/2 | 25,997.176 | 414.3 (20) | 40 (20) | [27] | ||||
| 6844.056 | 5/2 | 27,022.617 | −147.7 (16) | 17 (20) | [27] | ||||
| 9/2 | 41,667.098 (10) | 508.2 (15) | 3751.6165 | 7/2 | 15,019.493 | 673.9 (3) | 72 (3) | [26] | FT 8 |
| 5941.64 * | 11/2 | 24,841.405 | 422 (5) | 200 (20) | [7] | nf 4824 nf+ 6699 | |||
| 6138.234 | 7/2 | 25,380.277 | 389.0 (10) | - | [16] | ||||
| 6330.32 | 11/2 | 25,874.498 | 44.0 (5) | 168 (10) | [16] | nf- 6266 | |||
| 6379.88 | 9/2 | 25,997.176 | 414.3 (20) | 40 (20) | [27] | nf 4570 | |||
| 6878.208 | 7/2 | 27,132.436 | 76 (1) | 54 (50) | [5] | ||||
| 3/2 | 41,672.351 (10) | −5 (5) | 5509.96 | 1/2 | 23,528.443 | 293.2 (20) | 0 | [27] | |
| 5564.048 | 3/2 | 23,704.813 | 105.1 (20) | −21 (15) | [27] | ||||
| 5869.29 | 3/2 | 24,639.258 | −200.0 (10) | 3 (2) | [28] | nf- 4238 nf- 4550 nf 6468 | |||
| 5964.232 * | 3/2 | 24,910.373 | −301.3 (5) | 14 (5) | [27] | nf+ 4494 nf+ 4564 | |||
| 5990.68 | 5/2 | 24,984.291 | 284.5 (17) | 22 (20) | [27] | ||||
| 6164.127 | 1/2 | 25,453.947 | −386.5 | 0 | [16] | ||||
| 6226.705 | 1/2 | 25,616.935 | −297.3 (15) | 0 | [27] | ||||
| 5/2 | 41,681.498 (15) + | 354.3 (10) | 5614.353 | 5/2 | 23,874.944 | 241.7 (23) | 0 (15) | [27] | nf 4187 |
| 5682.515 * | 7/2 | 24,088.538 | −134.1 (40) | 72 (30) | [27] | nf 4339 | |||
| 5908.91 | 3/2 | 24,762.601 | 418.0 (10) | 10 (6) | [27] | ||||
| 6132.82 | 7/2 | 25,380.277 | 389.0 (10) | - | [16] | nf 4567 | |||
| 6233.269 | 3/2 | 25,642.997 | 273.3 (2) | 4 (4) | [28] | ||||
| 6515.01 | 5/2 | 26,338.932 | 103.2 (22) | −29 (20) | [27] | ||||
| 3/2 | 41,975.663 (10) | 140 (3) | 5523.11 | 5/2 | 23,874.944 | 241.7 (23) | 0 (15) | [27] | |
| 5858.224 * | 3/2 | 24,910.373 | −301.3 (5) | 14 (5) | [27] | nf+ 4494 | |||
| 5883.707 | 5/2 | 24,984.291 | 284.5 (17) | 22 (20) | [27] | nf+ 4177 nf 4479 nf+ 4549 | |||
| 5965.862 | 5/2 | 25,218.264 | 101 (5) | - | [7] | ||||
| 6050.96 | 1/2 | 25,453.947 | −386.5 (20) | 0 | [16] | nf+ 3927 nf+ 5565 | |||
| 6111.254 | 1/2 | 25,616.935 | −297.3 (15) | 0 | [27] | ||||
| 6238.389 | 3/2 | 25,950.319 | 478.5 (19) | 18 (16) | [27] | ||||
| 5/2 | 42,134.425 (10) | 209.9 (20) | 5539.890 | 7/2 | 24,088.538 | −134.1 (40) | 72 (30) | [27] | |
| 5566.19 | 3/2 | 24,173.826 | −228.9 (22) | 30 (11) | [27] | ||||
| 5640.27 | 7/2 | 24,409.675 | 188.4 (17) | 17 (15) | [27] | nf+ 4280 nf+ 5975 nf+ 6111 | |||
| 5671.685 | 5/2 | 24,507.870 | 188 (2) | 15 (5) | [5] | nf 4079 nf 4262 nf+ 4650 nf 5940 | |||
| 5829.24 | 5/2 | 24,984.291 | 284.5 (17) | 22 (20) | [27] | nf+ 4177 nf+ 4549 nf 4652 | |||
| 5863.109 | 7/2 | 25,083.354 | 70.8 (0.5) | 25 (15) | [29] | nf 4160 nf 5744 | |||
| 5909.870 * | 5/2 | 25,218.264 | 101 (5) | - | [7] | nf+ 5639 nf+ 4137 | |||
| 5967.017 | 7/2 | 25,380.277 | 389.0 (10) | - | [16] | nf+ 4468 nf+ 4567 nf+ 4702 | |||
| 6177.191 | 3/2 | 25,950.319 | 478.5 (19) | 18 (16) | [27] | ||||
| 6329.169 | 5/2 | 26,338.932 | 103.2 (22) | −29 (20) | [27] | nf 5357 nf- 5304 | |||
| 6615.521 | 5/2 | 27,022.617 | −147.7 (16) | 17 (20) | [27] | nf 4104 | |||
| 6663.943 | 7/2 | 27,132.436 | 76 (1) | 54 (50) | [5] | nf+ 5821 nf 5808 nf 5239 | |||
| 6705.432 | 3/2 | 27,225.250 | −49.7 (5) | −11 (6) | [5] | nf+ 5541 | |||
| 6781.75 | 5/2 | 27,393.032 | 143.8 (10) | 32 (14) | [27] | nf 5734 nf 5276 nf- 4905 | |||
| 6911.31 | 5/2 | 27,669.374 | 226.8 (23) | - | [27] | nf- 3613 | |||
| 7/2 | 42,565.144 (10) | 89.3 (20) | 5506.45 | 7/2 | 24,409.675 | 188.4 (17) | 17 (15) | [27] | |
| 5686.428 | 5/2 | 24,984.291 | 284.5 (17) | 22 (20) | [27] | ||||
| 5718.65 | 7/2 | 25,083.354 | 70.8 (5) | 25 (15) | [29] | ||||
| 5720.608 | 9/2 | 25,089.311 | 0 (1) | 140 (20) | [16] | nf 6608 | |||
| 5817.459 | 7/2 | 25,380.277 | 389.0 (10) | - | [16] | nf 4567 | |||
| 6034.073 | 9/2 | 25,997.176 | 414.3 (20) | 40 (20) | [27] | nf 4570 | |||
| 6161.161 | 5/2 | 26,338.932 | 103.2 (22) | −29 (20) | [27] | ||||
| 6477.956 | 7/2 | 27,132.436 | 76 (1) | 54 (50) | [5] | nf 5821 | |||
| 6589.219 * | 5/2 | 27,393.032 | 143.8 (10) | 32 (14) | [27] | nf 5734 nf 5656 nf 5276 | |||
| 6711.47 | 5/2 | 27,669.374 | 226.8 (23) | - | [27] | ||||
| 5/2 | 42,798.254 (15) | 6 (8) | 6337.14 | 5/2 | 27,022.617 | −147.7 (16) | 17 (20) | [27] | nf+ 4104 |
| 6381.56 * | 7/2 | 27,132.436 | 76 (1) | 54 (50) | [5] | nf+ 5821 nf 5808 nf 5239 | |||
| 6419.593 | 3/2 | 27,225.250 | −49.7 (5) | −11 (6) | [5] | nf+ 5323 nf+ 5498 nf+ 5541 | |||
| 6515.857 | 7/2 | 27,455.309 | 358.0 (16) | 50 (13) | [27] | nf- 5714 nf- 4089 | |||
| 6741.355 | 3/2 | 27,968.543 | 132.9 (16) | - | [27] | nf+ 3574 nf 3714 nf+ 4770 nf 5120 | |||
| 6773.74 | 7/2 | 28,039.456 | 166.2 (56) | 0 (20) | [27] | nf 5001 nf 5301 nf 5517 | |||
| 7/2 | 42,883.112 (10) | 140 (20) | 5920.449 | 9/2 | 25,997.176 | 414.3 (20) | 40 (20) | [27] | |
| 6303.229 * | 5/2 | 27,022.617 | −147.7 (16) | 17 (20) | [27] | nf+ 4163 nf+ 4104 nf- 3699 | |||
| 6480.013 | 7/2 | 27,455.309 | 358.0 (16) | 50 (13) | [27] | nf+ 4089 nf+ 4172 nf+ 5714 | |||
| 6571.184 | 5/2 | 27,669.374 | 226.8 (23) | - | [27] | nf 3613 nf 4839 | |||
| 6757.66 | 9/2 | 28,089.175 | 393.0 (52) | 120 (60) | [27] | nf+ 4064 | |||
| 3/2 | 43,085.973 (15) | 270 (3) | 5522.82 | 5/2 | 24,984.291 | 284.5 (17) | 22 (20) | [27] | |
| 5595.134 * | 5/2 | 25,218.264 | 101 (5) | - | [7] | nf+ 5823 nf+ 5639 nf 5491 nf+ 4137 | |||
| 5731.38 | 3/2 | 25,642.997 | 273.3 (2) | 4 (4) | [28] | nf 5565 nf 5429 nf 5365 nf 4065 | |||
| 5969.553 | 5/2 | 26,338.932 | 103.2 (22) | −29 (20) | [27] | nf- 3953 nf 5304 nf+ 5357 | |||
| 6303.138 | 3/2 | 27,225.250 | −49.7 (5) | −11 (6) | [5] | nf+ 4945 nf+ 3672 nf+ 5323 | |||
| 6370.53 | 5/2 | 27,393.032 | 143.8 (10) | 32 (14) | [27] | nf 5734 nf 5656 nf+ 5276 | |||
| 6484.73 | 5/2 | 27,669.374 | 226.8 (23) | - | [27] | nf+ 4839 nf 3613 | |||
| 6518.38 | 1/2 | 27,748.979 | 274.8 (34) | 0 | [27] | nf+ 5544 nf 5179 | |||
| 6613.052 | 3/2 | 27,968.543 | 132.9 (16) | - | [27] | nf+ 5120 | |||
| 5/2 | 43,089.634 (10) | 71 (3) | 5730.174 | 3/2 | 25,642.997 | 273.3 (2) | 4 (4) | [28] | nf 3898 nf+ 4065 nf+ 5365 nf+ 5429 |
| 6222.207 | 5/2 | 27,022.617 | −147.7 (16) | 17 (20) | [27] | ||||
| 6369.044 * | 5/2 | 27,393.032 | 143.8 (10) | 32 (14) | [27] | nf+ 5734 nf+ 5656 nf+ 5276 | |||
| 6642.61 | 7/2 | 28,039.456 | 166.2 (56) | 0 (20) | [27] | ||||
| 6855.30 | 5/2 | 28,506.412 | 344.3 (50) | −71 (40) | [27] | nf+ 5173 nf 4887 nf 4800 | |||
| 6872.585 | 7/2 | 28,543.077 | −68.5 (8) | −50 (30) | [27] | nf+ 5380 nf+ 4878 | |||
| 7/2 | 43,128.698 (15) | 305 (5) | 6353.23 | 5/2 | 27,393.032 | 143.8 (10) | 32 (14) | [27] | nf 3649 nf 5276 |
| 6446.023 * | 9/2 | 27,619.544 | 186.7 (20) | 35 (30) | [27] | nf+ 5648 nf 5661 | |||
| 6836.99 | 5/2 | 28,506.412 | 344.3 (50) | −71 (40) | [27] | nf+ 5173 | |||
| 5/2 or 3/2 | 43,135.573 (15) | 106 (2) or 158 (2) | 5579.644 | 5/2 | 25,218.264 | 101 (5) | - | [7] | |
| 6204.539 | 5/2 | 27,022.617 | −147.7 (16) | 17 (20) | [27] | nf 4104 nf 3699 nf 4163 | |||
| 6350.460 * | 5/2 | 27,393.032 | 143.8 (10) | 32 (14) | [27] | nf+ 5272 nf 4905 nf+ 5656 nf+ 5734 | |||
| 5/2 | 43,148.907 (20) | 196 (20) | 6199.356 | 5/2 | 27,022.617 | −147.7 (16) | 17 (20) | [27] | |
| 6241.84 | 7/2 | 27,132.436 | 76 (1) | 54 (50) | [5] | ||||
| 6370.27 | 7/2 | 27,455.309 | 358.0 (16) | 50 (13) | [27] | nf 4089 | |||
| 6458.36 * | 5/2 | 27,669.374 | 226.8 (23) | - | [27] | nf 3613 nf+ 4839 | |||
| 6585.638 | 3/2 | 27,968.543 | 132.9 (16) | - | [27] | nf 3574 | |||
| 6827.56 | 5/2 | 28,506.412 | 344.3 (50) | −71 (40) | [27] | nf 3641 nf+ 5173 | |||
| 7/2 | 43,463.384 (15) | 344 (8) | 6220.91 | 5/2 | 27,393.032 | 143.8 (10) | 32 (14) | [27] | nf 5276 |
| 6502.61 | 9/2 | 28,089.175 | 393.0 (52) | 120 (60) | [27] | nf 4064 nf- 4171 | |||
| 6700.425 * | 7/2 | 28,543.077 | −68.5 (8) | −50 (30) | [27] | nf 4878 nf 3636 | |||
| 5/2 | 43,650.075 (15) | 92 (20) | 6149.494 | 5/2 | 27,393.032 | 143.8 (10) | 32 (14) | [27] | |
| 6255.816 | 5/2 | 27,669.374 | 226.8 (23) | - | [27] | nf- 4839 nf 3613 | |||
| 6601.600 * | 5/2 | 28,506.412 | 344.3 (50) | −71 (40) | [27] | nf 4800 nf 4887 nf+ 5173 nf 3641 | |||
+ these levels were reported already in reference [14], but without list of all classified lines.
Table 2.
Classification of the lines shown in Figure 1 and Figure 2. wl—wavelength; E—energy. The hf pattern of the line at 5858.423 Å could be simulated well using the J- and A-values given in the table, but could not be classified yet.
| Upper Level | Lower Level | |||||||||||
|---|---|---|---|---|---|---|---|---|---|---|---|---|
| wl (Å) | E (cm−1) | J | P | A (MHz) | B (MHz) | Ref. to A, B | E (cm−1) | J | P | A (MHz) | B (MHz) | Ref. to A, B |
| 5858.7668 | 34,861.006 | 1/2 | e | −716 (5) | 0 | [5] | 17,797.298 | 3/2 | o | 1335 (1) | - | [16] |
| 5858.596 | 33,799.289 | 3/2 | o | 959.0 (15) | 47 (20) | [18] | 16,735.090 | 3/2 | e | −233.7 (20) | - | tw b |
| 5858.423 | ? | 7/2 | ? | 440 | - | ? | 9/2 | ? | 370 | - | ||
| 5858.224 | 41,975.663 | 3/2 | e | 140 (3) | - | tw | 24,910.373 | 3/2 | o | −301.3 (5) | 14 (5) | [27] |
| 5909.9657 | 39,355.230 | 3/2 | e | 50 (5) | - | [6] | 22,439.346 | 3/2 | o | 149.5 (32) | −45 (35) | [27] |
| 5909.870 | 42,134.425 | 5/2 | e | 209.9 (20) | - | tw | 25,218.264 | 5/2 | o | 101 (5) | - | [7] |
| 5909.759 | 34,015.781 | 3/2 | o | 345.1 (20) | - | tw a | 17,099.306 | 5/2 | e | −210 (6) | - | tw |
Publisher’s Note: MDPI stays neutral with regard to jurisdictional claims in published maps and institutional affiliations. |
© 2020 by the authors. Licensee MDPI, Basel, Switzerland. This article is an open access article distributed under the terms and conditions of the Creative Commons Attribution (CC BY) license (http://creativecommons.org/licenses/by/4.0/).
Share and Cite
MDPI and ACS Style
Windholz, L.; Binder, T. New Energy Levels of Neutral Lanthanum Derived from an Optogalvanic Spectrum between 5610 and 6110 Å. Atoms 2020, 8, 88. https://0-doi-org.brum.beds.ac.uk/10.3390/atoms8040088
AMA Style
Windholz L, Binder T. New Energy Levels of Neutral Lanthanum Derived from an Optogalvanic Spectrum between 5610 and 6110 Å. Atoms. 2020; 8(4):88. https://0-doi-org.brum.beds.ac.uk/10.3390/atoms8040088
Chicago/Turabian StyleWindholz, Laurentius, and Tobias Binder. 2020. "New Energy Levels of Neutral Lanthanum Derived from an Optogalvanic Spectrum between 5610 and 6110 Å" Atoms 8, no. 4: 88. https://0-doi-org.brum.beds.ac.uk/10.3390/atoms8040088
Note that from the first issue of 2016, this journal uses article numbers instead of page numbers. See further details here.