
Emission Lines in 290–360 nm of Highly Charged Tungsten Ions W20+–W29+
by
 , and
, and
Shota Era
1, 
Daiji Kato
2,1,*,
Hiroyuki A. Sakaue
2,
Toshiki Umezaki
1,
Nobuyuki Nakamura
3,2 and
Izumi Murakami
2,4 1
Interdisciplinary Graduate School of Engineering Sciences, Kyushu University, Kasuga, Fukuoka 816-8580, Japan
2
National Institute for Fusion Science, 322-6 Oroshi-cho, Toki, Gifu 509-5292, Japan
3
Institute for Laser Science, The University of Electro-Communications, 1-5-1 Chofugaoka, Chofu, Tokyo 182-8585, Japan
4
Department of Fusion Science, The Graduate University for Advanced Studies, SOKENDAI, 322-6 Oroshi-cho, Toki, Gifu 509-5292, Japan
*
Author to whom correspondence should be addressed.
Atoms 2021, 9(3), 63; https://0-doi-org.brum.beds.ac.uk/10.3390/atoms9030063
Submission received: 11 August 2021
/
Revised: 4 September 2021
/
Accepted: 6 September 2021
/
Published: 8 September 2021
(This article belongs to the Special Issue Atomic and Molecular Spectra in Magnetically Confined Torus Plasmas)
Abstract
:Forbidden transitions in the near-UV and visible wavelength of highly charged tungsten (W) ions are potentially useful as novel tungsten diagnostics means of fusion plasmas. Emission lines in 290–360 nm from W ions interacting with an electron beam of 540–1370 eV are measured, using a compact electron-beam-ion-trap. The charge states of 64 lines are identified as W–W. A magnetic-dipole (M1) line of W between the excited states is newly identified; the wavelength is determined as 351.03(10) nm in air. The theoretical wavelength calculated using the multiconfiguration Dirac–Hartree–Fock method is in a good agreement with the measurement.
1. Introduction
Emission lines of tungsten (W) ions are highly relevant to nuclear fusion energy development because tungsten will be used as plasma-facing in-vessel component materials of ITER (International Thermonuclear Experimental Reactor), being, therefore, the primary heavy impurity in the ITER plasma. X-ray [1,2], extreme-ultra-violet (EUV) [1,3,4,5,6], and vacuum-ultra-violet (VUV) [7,8] emission lines of highly charged W ions were studied with large plasma devices. On the other hand, W measurements in the plasma devices using visible lines were limited to neutral and singly charged ions until visible and near-UV lines emitted by highly charged W ions were observed at the large helical device (LHD), using tungsten pellet injection [9,10,11].
Forbidden transitions of highly charged ions in the near-UV and visible wavelength region [12] are particularly useful because their intrinsically narrow natural widths can be used for Doppler measurements of ion temperatures, plasma flows, and core rotations. Moreover, mirrors and optical fibers are available to avoid fusion neutron irradiation to detectors. Recently, a local tungsten density in core plasmas of the LHD was successfully assessed with near-UV magnetic-dipole (M1) lines emitted by W and W ions [13]. Such visible and near-UV emission lines of highly charged W ions were intensively measured by different research groups, using electron-beam-ion-traps (EBITs): W–W [14,15], W–W [16], W [17], W–W [18], W [19], W–W [20], W [21], W [22,23], W–W [24], W [25], W [26,27], and W [28,29,30]. However, charge state identification still remain uncertain for many lines observed at LHD. In this contribution, therefore, we present new identification for emission lines in 290–360 nm from W–W, using a compact EBIT at National Institute for Fusion Science (CoBIT-II).
In Section 2, experimental methods with CoBIT-II are explained in detail; the results are presented in Section 3. In Section 4, theoretical calculations of emission lines are presented, focusing on an M1 line of W which is hitherto unidentified. Discussion about the present results is given in Section 5 before the summary and conclusion.
2. Experiment
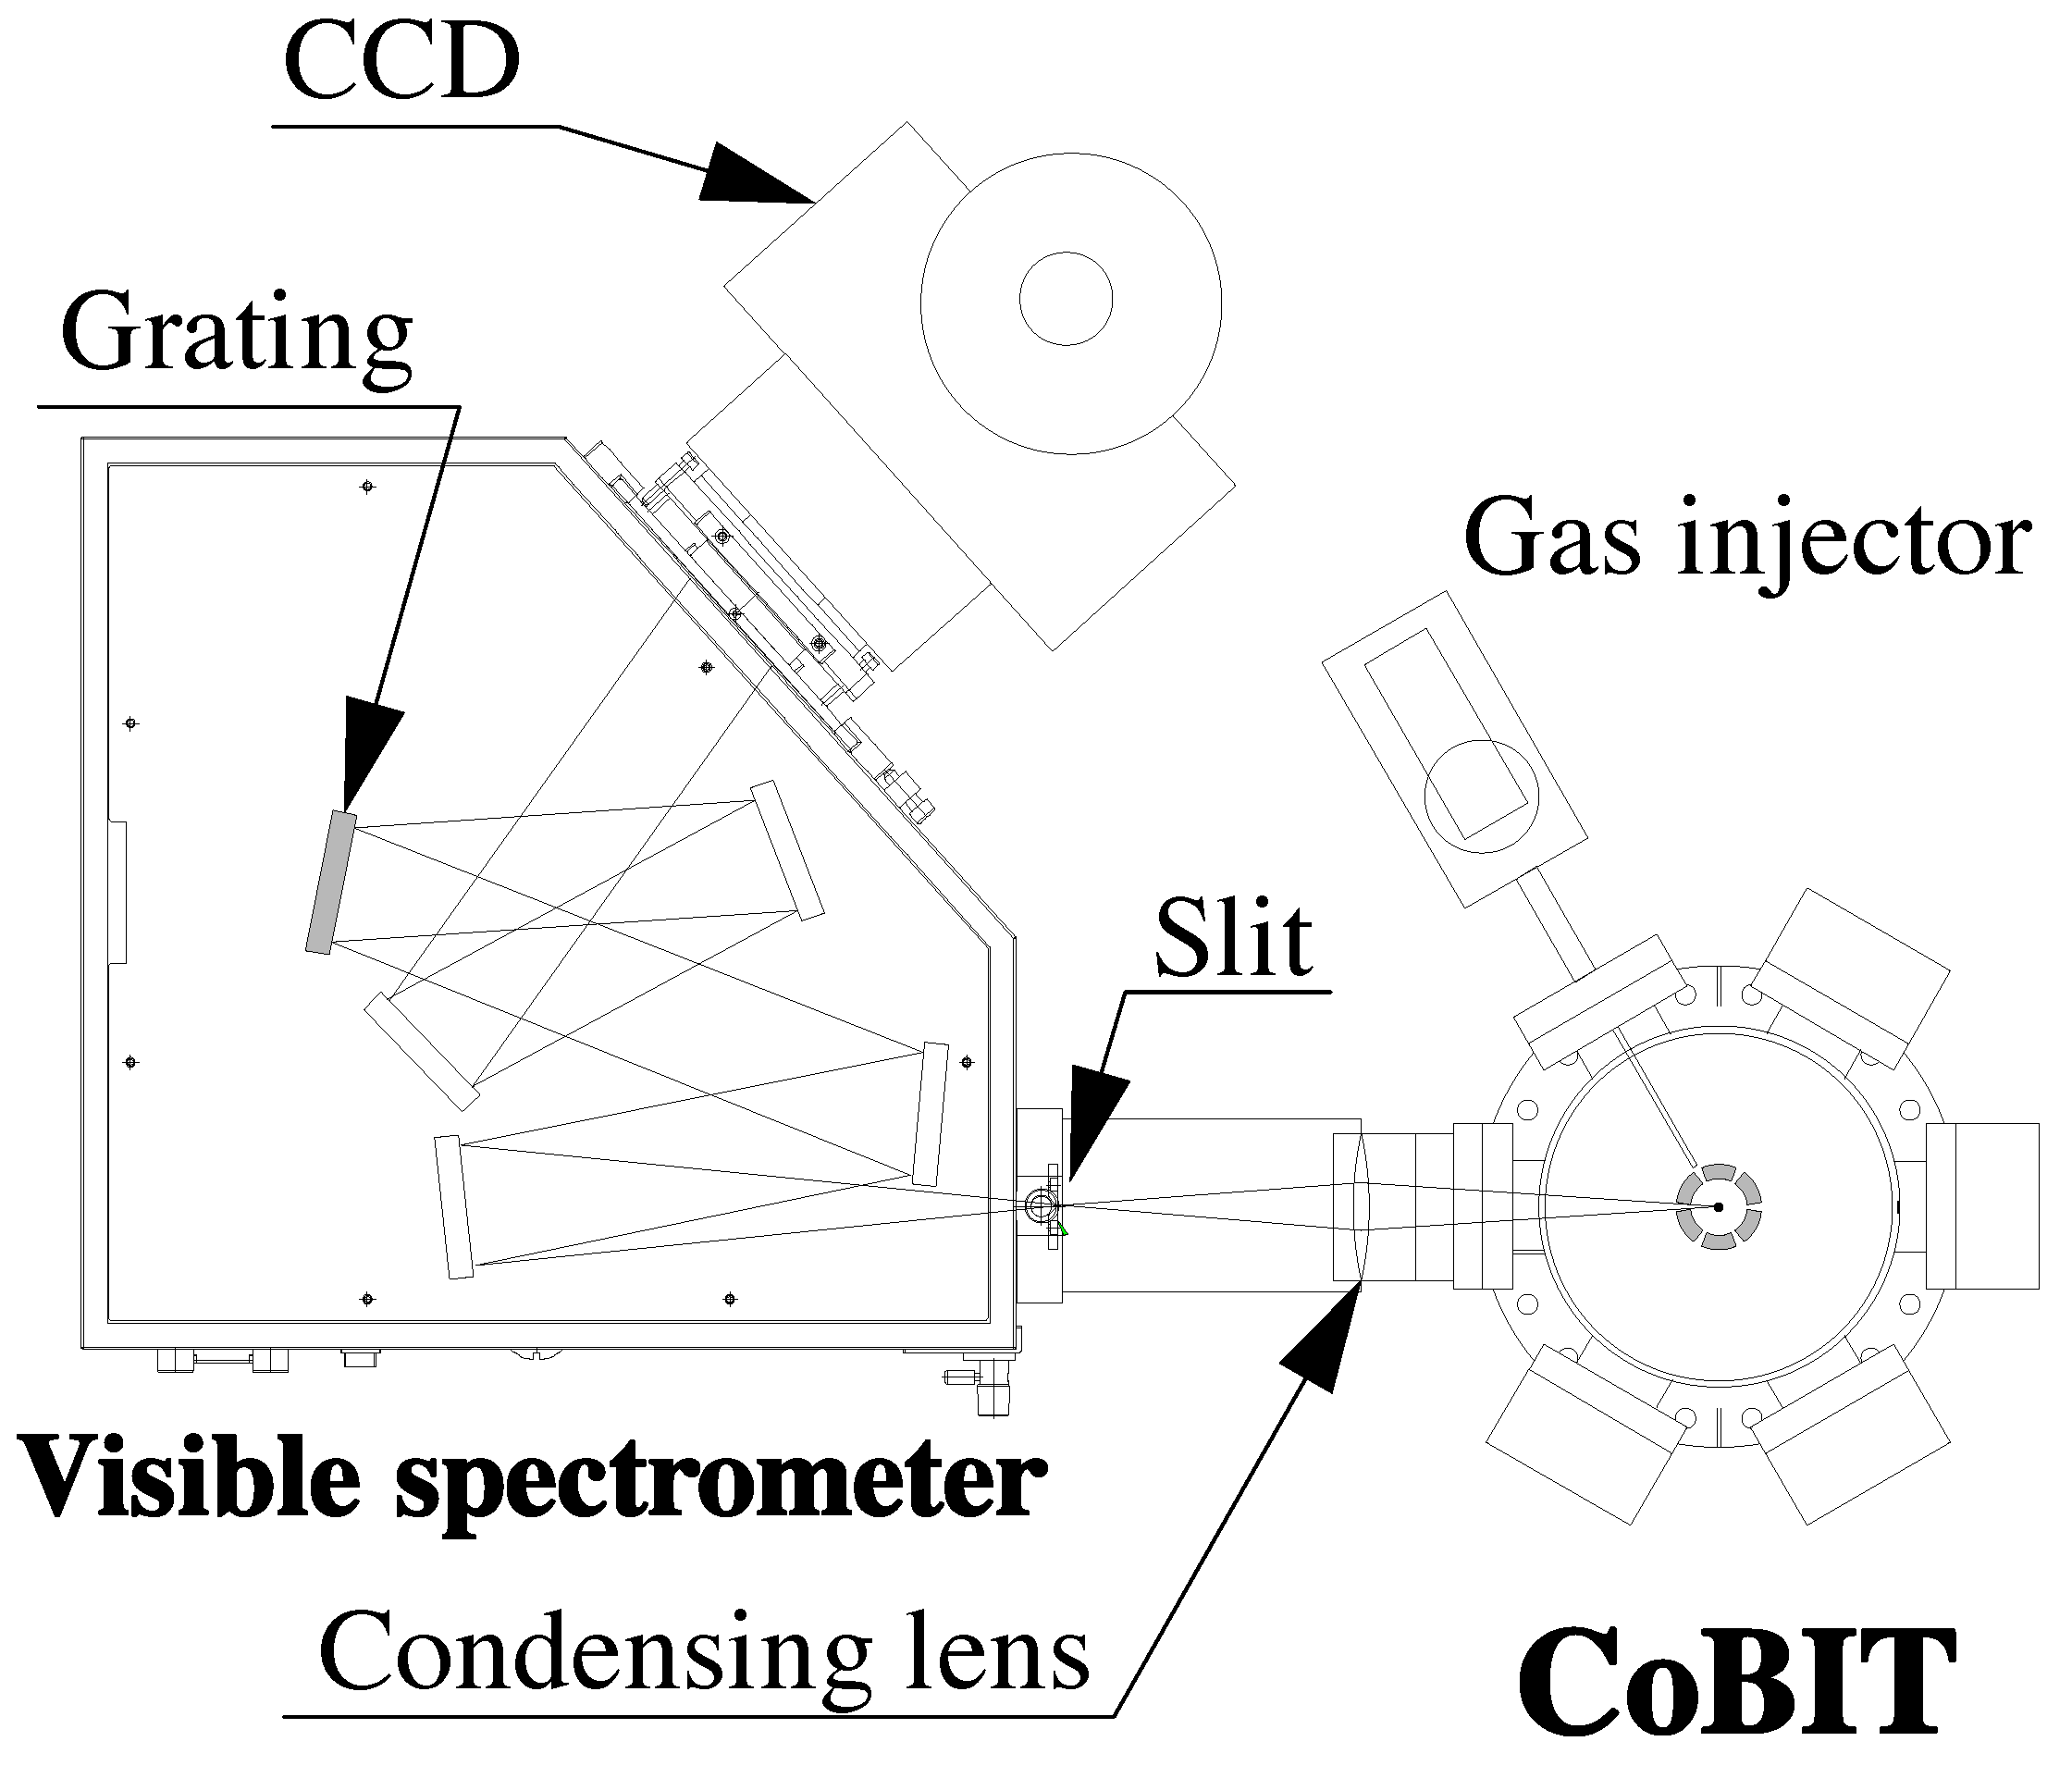
The present experiment was performed using a compact electron-beam-ion-trap at National Institute for Fusion Science (CoBIT-II) [31,32]. CoBIT-II consists of an electron gun, an ion trap (drift tubes), an electron collector, a high-temperature superconducting coil, and a liquid nitrogen tank inside a vacuum chamber. An electron beam from the electron gun is radially compressed and axially guided through the drift tube by a strong magnetic field from the superconducting Helmholtz-type coil. After passing through the drift tube, the electron beam is collected by the electron collector. The ion trap is made by a radial space charge potential of the electron beam and an axial potential well of an externally applied electric field in the drift tube. Highly charged ions are produced by successive electron-impact ionization in the trap. The trap region is maintained in an ultra-high vacuum condition ( Pa) so that the charge exchange with the residual neutral gas is negligible. Emission lines from the highly charged ions can be observed at the right angle direction to the electron beam axis through a view port of the vessel. In the present studies, tungsten was introduced as a vapor of tungsten hexacarbonyl W(CO) from a gas injector.
Figure 1 shows a schematic of a UV-visible spectrometer and the gas injector at CoBIT-II looking down from above. The spectrometer consists of an entrance slit (100 m width), a grating of 1200 grooves/mm blazed at 300 nm, and a nitrogen cooled back-illuminated charge coupled device (CCD) detector (PyLoN eXcelon, imaging array: , pixel: ). A condensing lens is used to focus the emission from CoBIT-II on to the entrance slit. Wavelength calibration was performed after the observation using standard lamps of He, Ne, Ar, and Hg placed in front of the entrance slit. The wavelength of each line position on the detector was carefully determined by consulting wavelength data of the Atomic Spectra Database at NIST [33]. The correlation between the wavelengths and corresponding line positions is well approximated by a linear function. We evaluated the accuracy of this calibration function, using the M1 line of W at 337.743(26) nm [25,34] in air (the line c in Figure 2). The calibration function gives a central wavelength that matches the reference wavelength within the uncertainty.
W ions in the trap have charge states distributed in a consecutive range. Steady-state abundance of the charge state in EBITs is determined predominantly by electron-impact ionization and axial ion escape [35]. Although for highly charged ions, recombination with free electrons also plays an important role in determining the charge state distribution, the effects of electron transfer from ambient neutral species can be neglected under the ultra-high vacuum condition. As a result, emission lines of each charge state have intensities in proportion to the steady-state abundance. Since the electron beam of EBITs has mono-energies, the highest charge state in the trap, can be associated with the electron beam energies naively as , where is the ionization threshold of W. In the present work, therefore, the charge state q is assigned to emission lines which appear in the spectra at and absent at . This method is simple and, in principle, applicable, provided that the accurate ionization thresholds are available. However, it is noted that identification by such assignment has uncertainty, due to the possibility of existence of long-lived meta-stable excited states, e.g., Ref. [26].
3. Emission Lines in 290–360 nm of W–W Ions
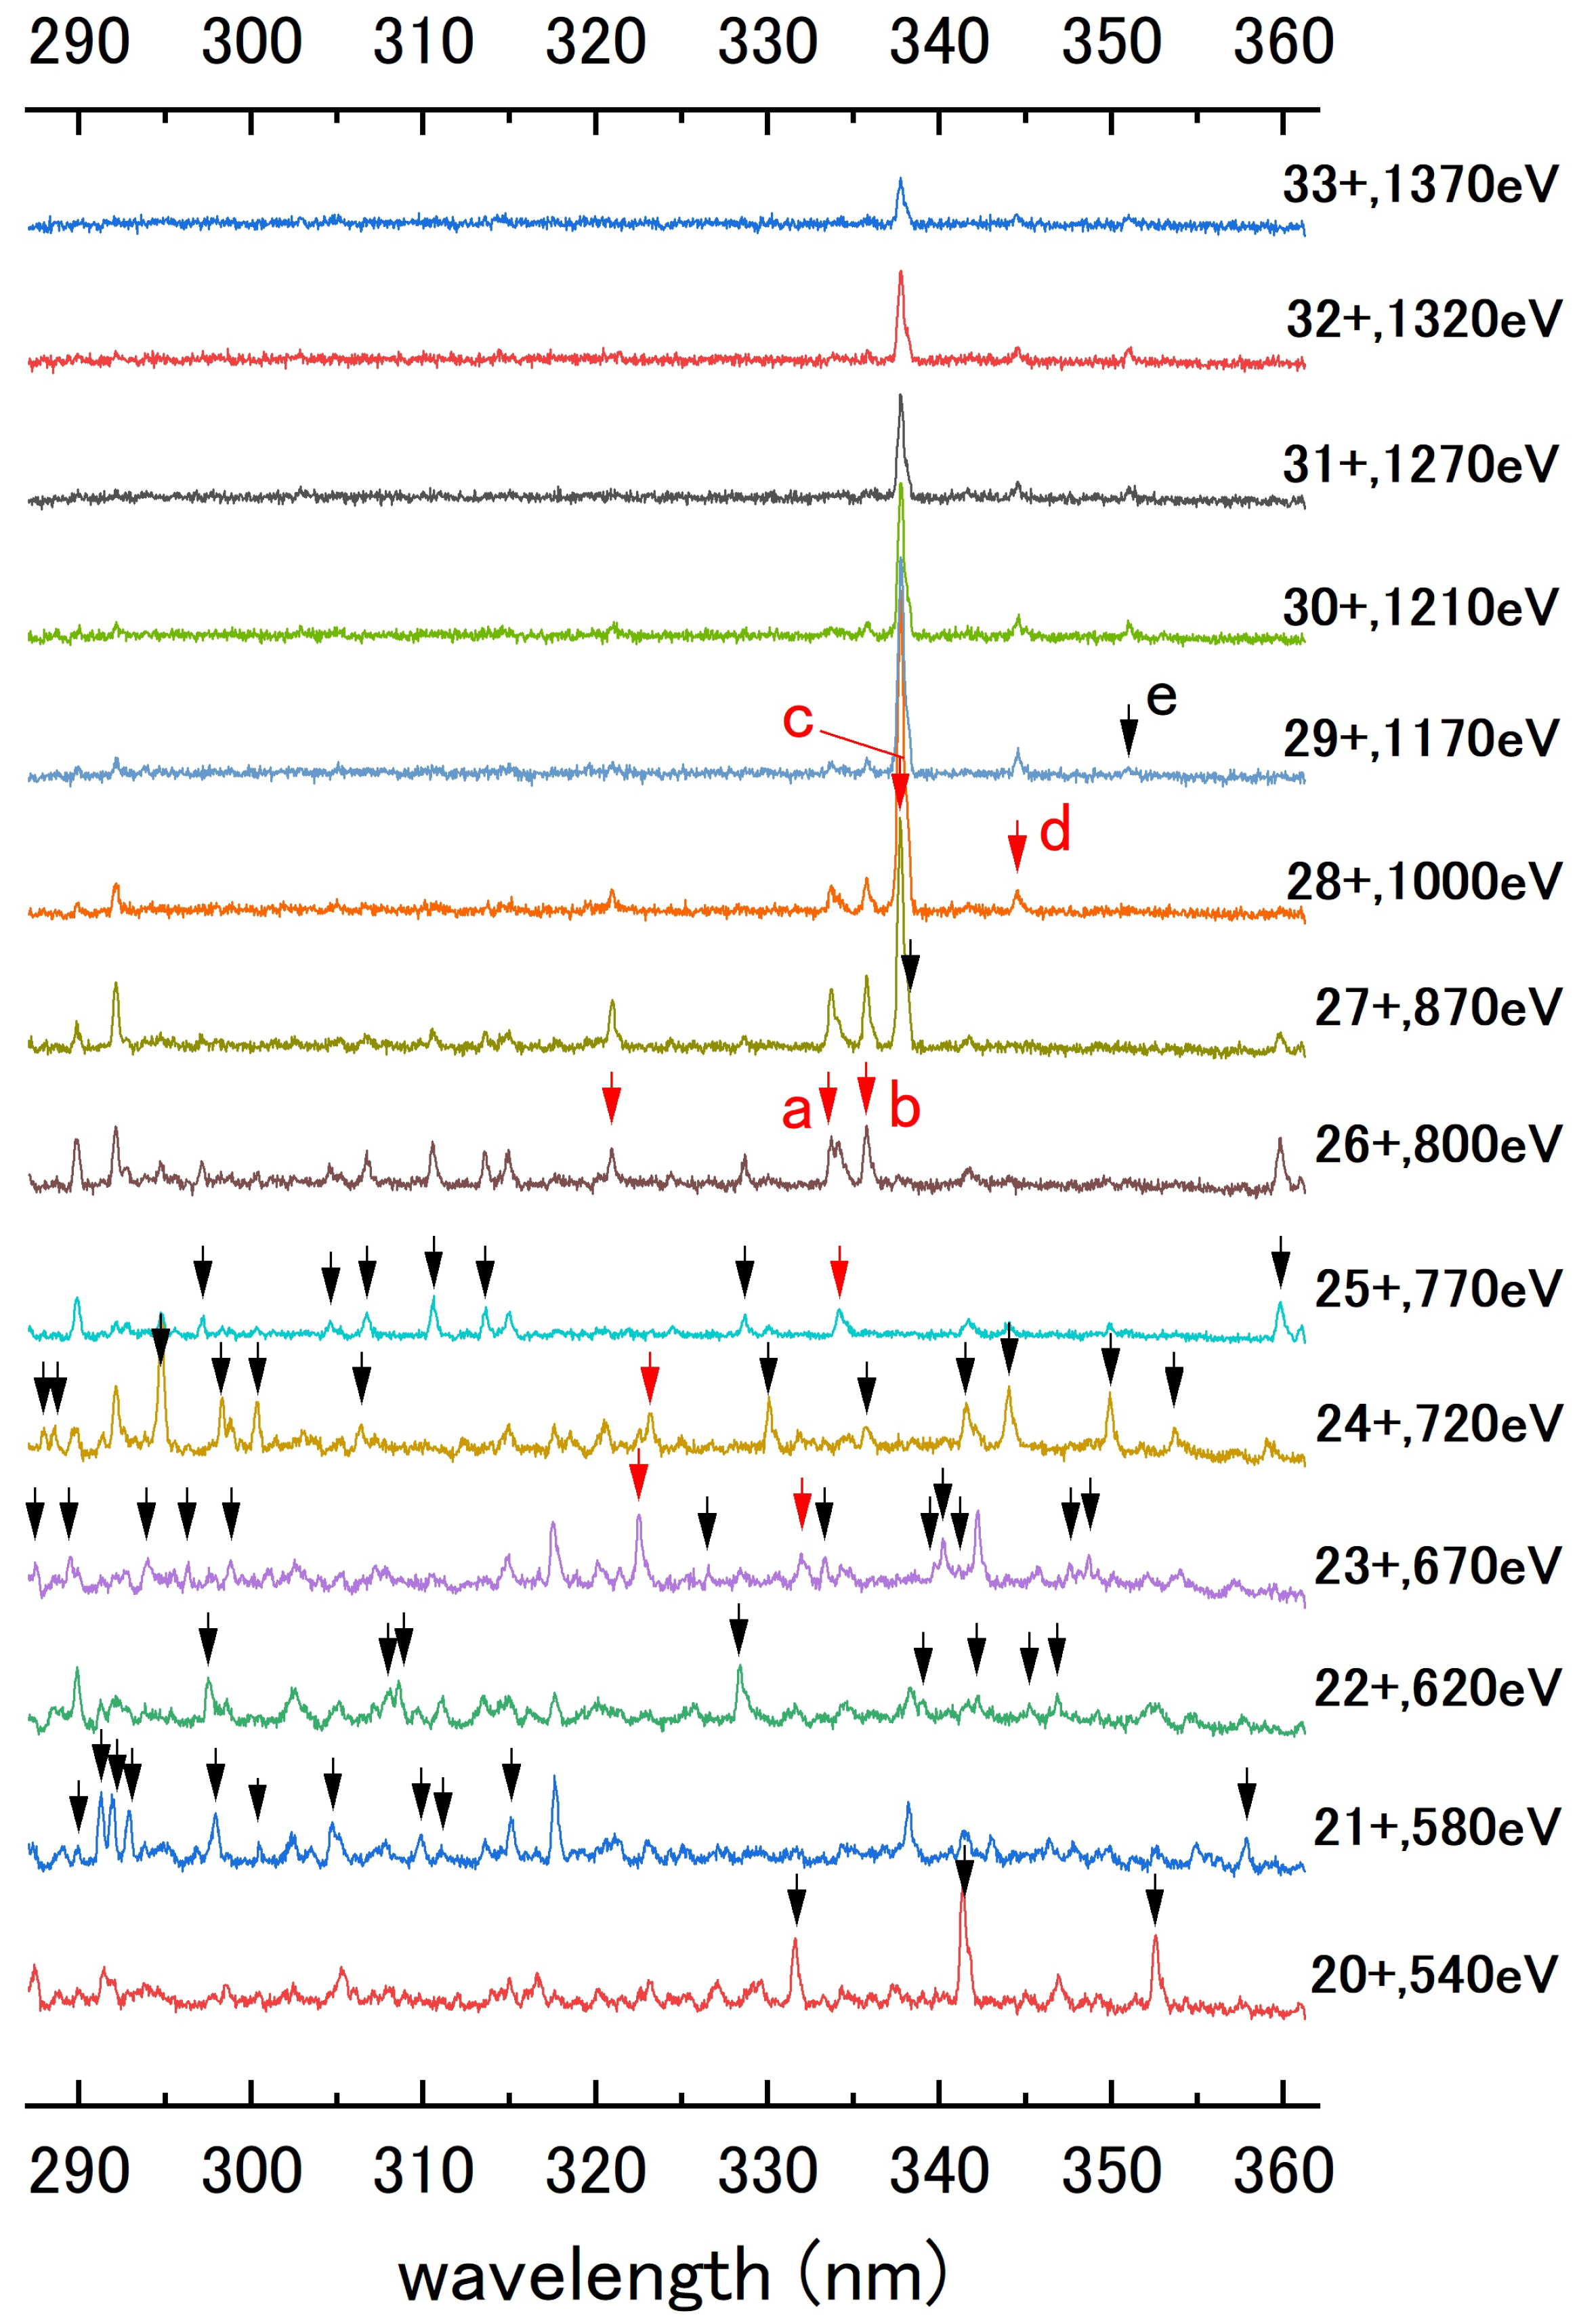
Emission line spectra for 290–360 nm measured at 14 electron beam energies for 540–1370 eV are shown in Figure 2. The present measurements are performed at electron beam energies such that each ionization threshold of consecutive charge states for 20–33 falls in between the successive energies. In the present wavelength range, 64 lines in total are identified as emission lines of W–W ions. Quite a few emission lines are observed in the spectra especially for lower charge states () reflecting complicated atomic structures of the ground state configurations with many electrons. The lines a and b are due to the M1 transitions of W in the ground state: and , respectively [23]. The line c is the M1 transition of W in the ground state: [25]. The line d is the M1 transition of W in the excited state: [27].
The lines indicated by red arrows in Figure 2 can be identified in the spectra previously observed at LHD using tungsten pellet injection [10,11]. The other lines, including the line e of W, are found by the present work. The wavelengths of each charge state are listed in Table 1. Uncertainty in the wavelengths is evaluated as a square root of the sum of variance in the central wavelength determined by the Gaussian fitting that is associated with the linear calibration function.
Figure 3 shows spectra magnified for the line e of W at 351.03(10) nm along with the line d of W. The line e is absent in the spectrum of 1000 eV below the ionization threshold of W (1132 eV [36]). Line e appears from the spectrum of 1170 eV and increases the intensity at higher energies, while the intensity of the line d decreases monotonically with the energy.
4. Theoretical Calculation for Emission Lines of W
Emission lines of W ions in CoBIT-II were calculated, using a collisional-radiative (CR) model. In the CR model, the rate equation of electron-impact (de)excitation and ionization and subsequent radiative cascade decays are solved assuming quasi-stationary state approximation for population densities of excited states. The equilibrium equation for the population density of each excited-state energy level is as follows:
where are rate coefficients of electron collision (de)excitation from a level i to j, collisional ionization from i, radiative transition rates from i to , and electron densities. The left-hand side of the equation represents out-flow rates of population densities from the level i, and the right-hand side in-flow rates to this level. The electron collision rate coefficients for the mono-energetic electron beam are expressed as a product of an electron velocity of the beam and a collision cross section given at the velocity, i.e., . The typical value of electron density for the electron beam, i.e., m, is adopted for the calculations. In the present model, we included the configurations of , , , , , and . These excited state configurations are chosen because they have lower excitation energies. Energy levels of the configurations, radiative transition rates (electric-dipole, quadruple and octupole and magnetic-dipole and quadruple), and distorted-wave electron collision cross sections are calculated with fully relativistic wave functions obtained by the parametric potential method using the HULLAC code (v9.610j) [37].
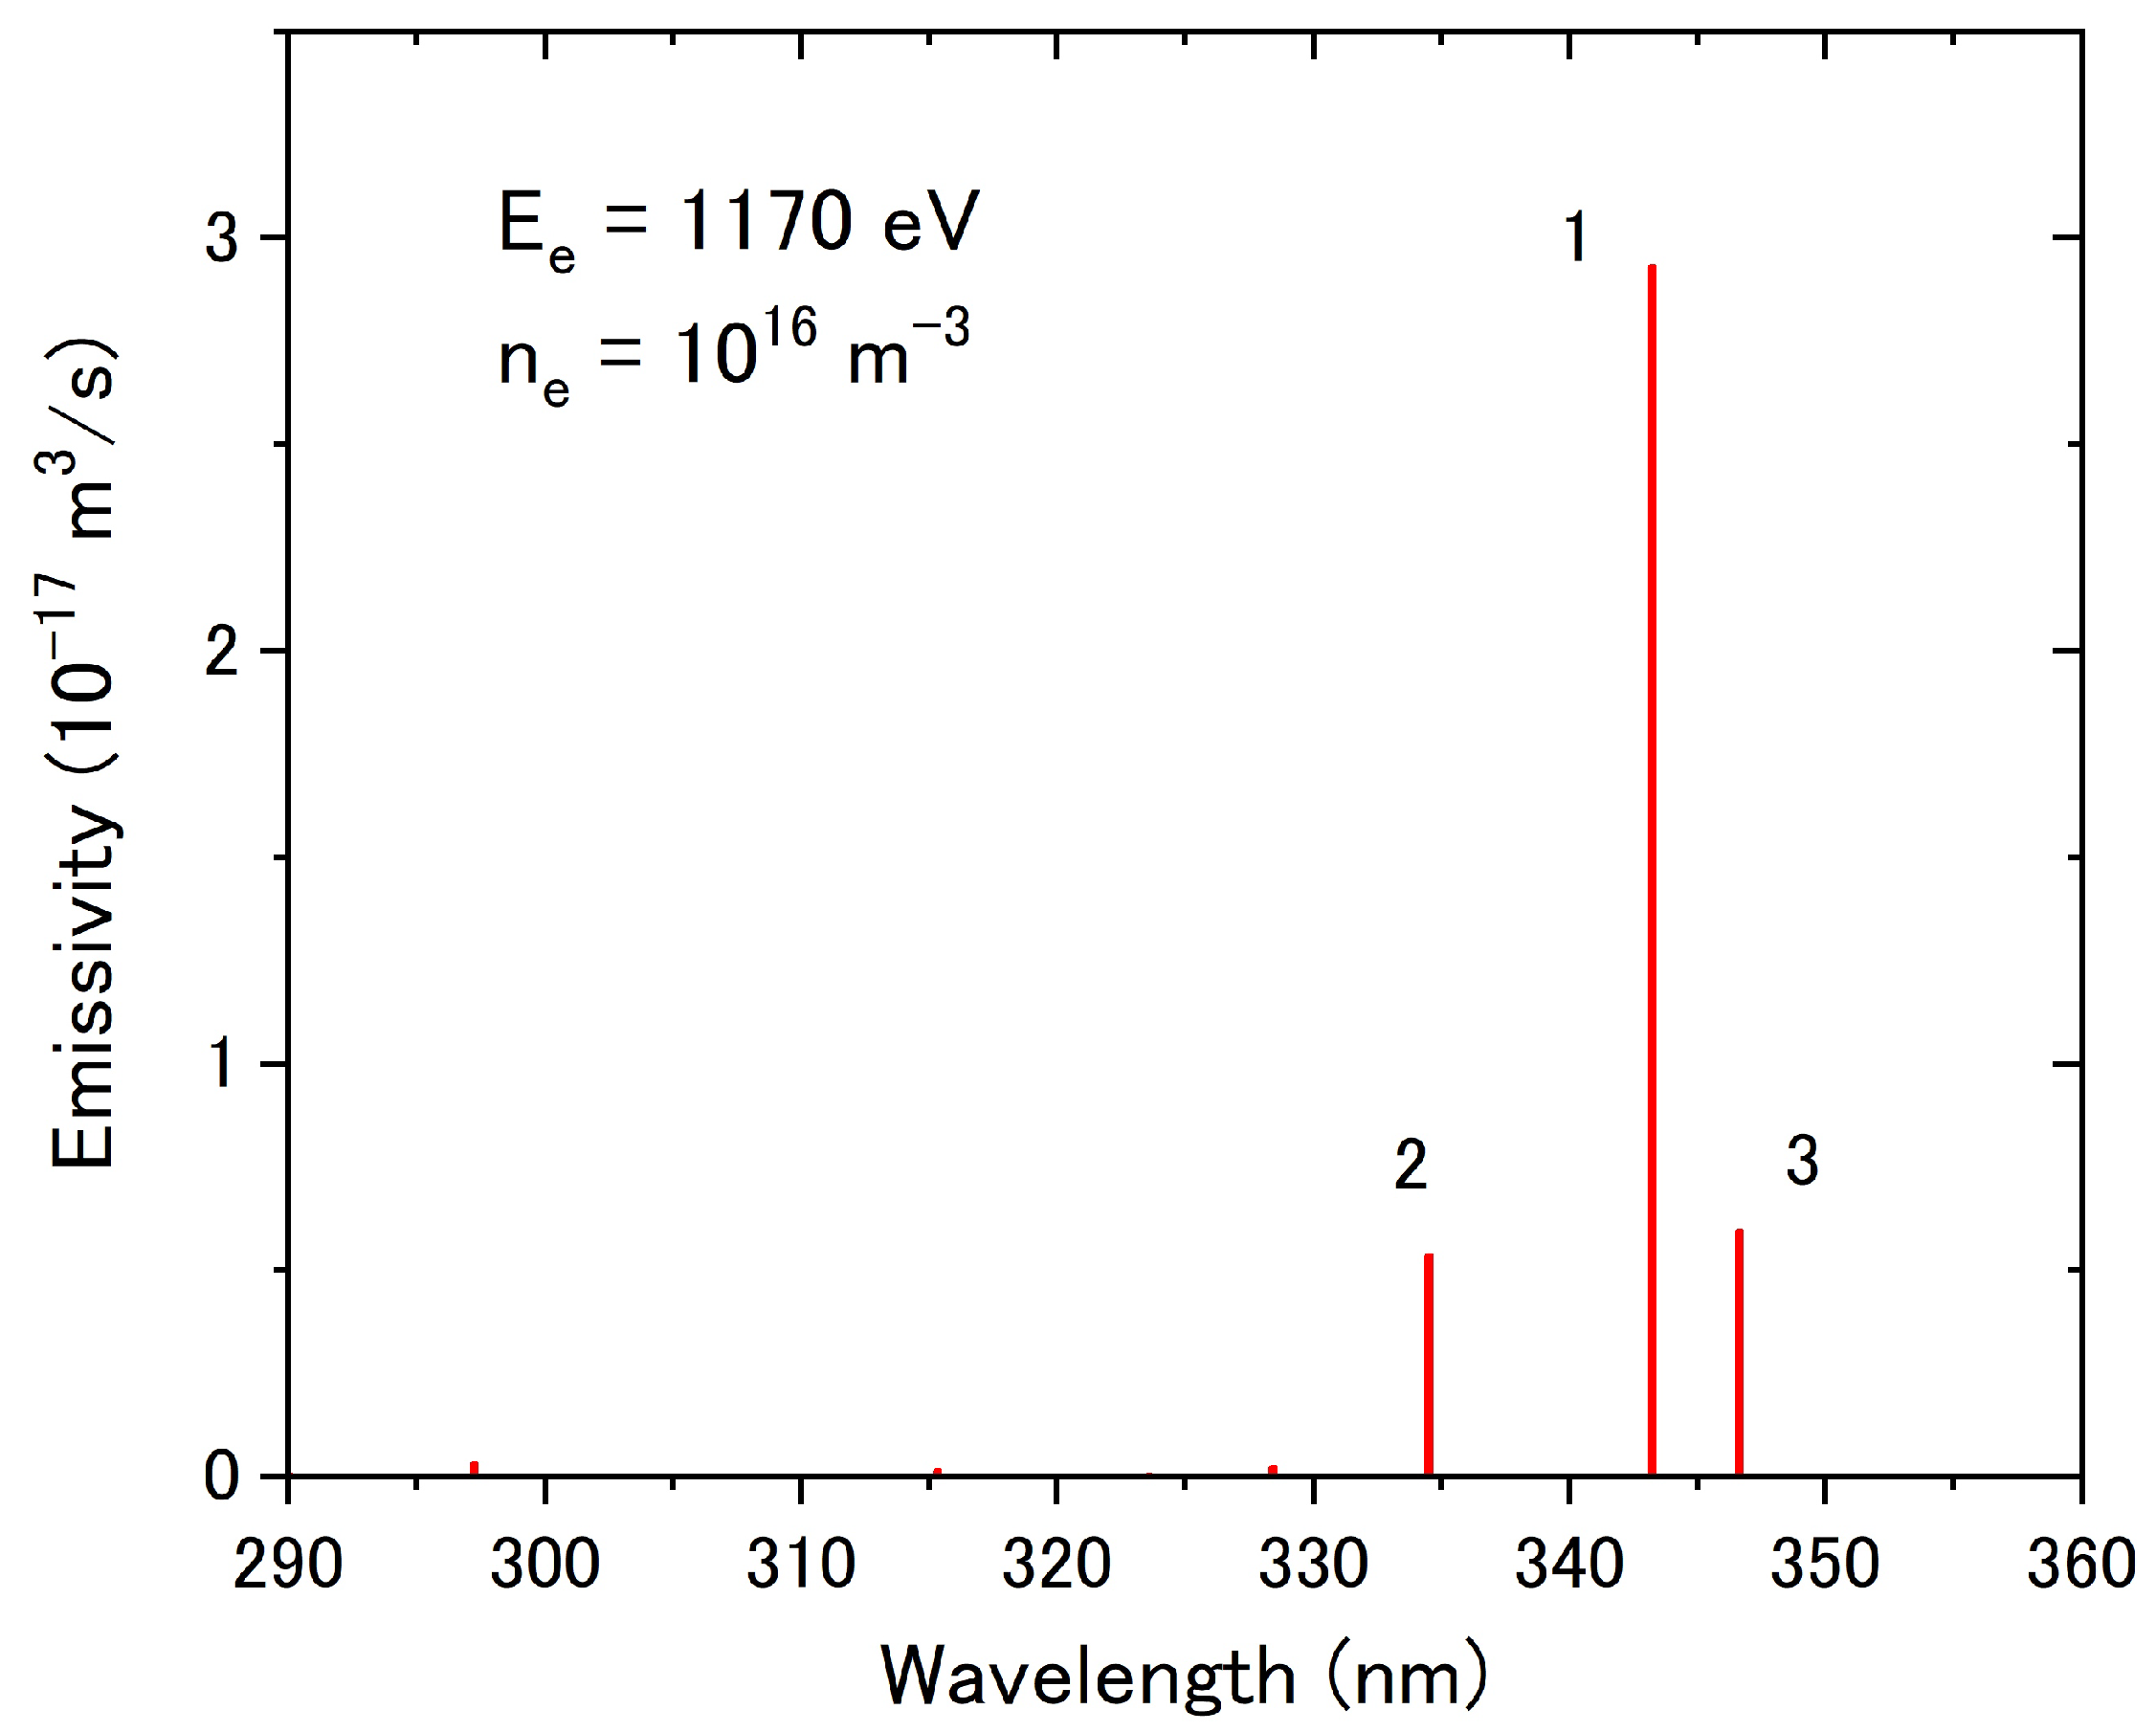
Figure 4 shows the CR model spectrum for eV. Three candidate lines are obtained in 290–360 nm due to M1 transitions in the excited state at about 200 eV above the ground state , i.e., line 1: , line 2: , and line 3: . It is noted that the M1 transition of the ground state fine structure, , falls into the VUV range. The strongest one, that is, line 1, is considered as the observed line e; the other lines are too weak to be observed for the present measurements. The transition rate of the line 1 is 91.6 s.
However, discrepancy of the calculated wavelength from the measurement is significant (about 2%). Subtle electron–electron correlation effects should be taken into account to predict the wavelength with a higher accuracy. Thus, the multi-configuration Dirac–Hartree–Fock (MCDHF) [38] calculations are performed using GRASP2018 code [39].
The MCDHF method is based on the Dirac–Coulomb Hamiltonian, which consists of the single-electron Dirac Hamiltonian and Coulomb interaction energies with nucleus and ambient electrons. Solutions (atomic state functions) are represented as linear combinations of configuration state functions (CSFs), as follows:
Here, J and M are the angular momentum quantum numbers and P is parity. denotes other appropriate labeling of the configuration state function j, for example, the orbital occupancy and coupling scheme. Normally, the label of the atomic state function is the same as the label of the dominating CSF in the linear combination. The CSFs are built from products of single-electron Dirac orbitals. Both the radial parts of the Dirac orbitals and the linear combination coefficients are optimized self-consistently so as to minimize level energies, which is the so-called extended optimal level (EOL) scheme [40]. Subsequently, we performed relativistic configuration interaction (RCI) calculations with the Dirac orbitals optimized by the MCDHF procedure. In the RCI calculations, the Breit interaction of the low frequency limit and the leading QED corrections (i.e., self-interaction and vacuum polarization) are also included.
As a starting point, we performed the DHF calculation with the single reference configuration . It is noted that the EOL procedure was performed for the upper and lower levels separately. As shown in Table 2, the DHF calculation underestimates the observed wavelength by about 4%. We investigated variation of the wavelength values by expanding CSFs in the atomic state functions. The CSF expansion (active space) is obtained by single and double (SD) substitution from the reference configuration up to active orbital sets. In the present work, SD substitutions are allowed only from orbitals, and inner orbitals are treated as an inactive core. In Table 2, transition wavelengths obtained with the active space within the first layer orbital set (SD1, ) and with a larger active space including the second layer orbital set (SD2, 175,140) are also shown. The transition wavelength of SD2 is in a good agreement with the observed wavelength (discrepancy is only 0.3%).
5. Discussion
The lower state of the line e, is the meta-stable state, which can decay only via electric-quadruple (E2) or higher order multi-pole transitions. Such a long-lived state can have a relatively large population at low electron densities. The present CR model predicts the fractional population of the meta-stable state to be about 6%: 60% of the total population for all excited states in the model. This result supports the present identification of the line e. The MCDHF calculation of the transition wavelength also agrees with the present measurement. The largest CSF expansion (SD2) provides the closest result to the experimental value. However, the result is apparently overshooting the experimental value, as the configuration expansion is enlarged further. This can partly be ascribed to the omission of correlation effects from deeper core orbitals, such as and in the present calculations. The wavelength of the line e: 351.03(10) nm is close to that of an emission line previously reported by Watanabe et al. [24]: 350.74(3) nm, using the Tokyo-EBIT. However, it is not correct to assume that both lines are identical because the wavelengths differ by . On the other hand, another line of 344.40(4) nm, reported by Watanabe et al. [24], can be considered identical with the line d of W at 344.57(10) nm by the present measurement.
It is noteworthy that the profile of line c shows clearly a shoulder in the long wavelength side, due to blending with another line at 338.15(9) nm. Since both intensities show a similar energy dependence, the charge state of the blending line is also considered as W. In this case, the line must be associated with meta-stable excited states of W. Further investigation is necessary for definite identification because such a line was never reported in previous studies.
Besides the lines a–d, the lines of W at 320.97(9) nm, W at 334.20(9) nm, W at 323.22(8) nm, and W at 322.58(8) nm and 332.02(9) nm are also identified at LHD [10,11,13]. These lines are, therefore, potentially useful for the tungsten diagnostics of fusion plasmas. However, the number of such lines is much smaller than that observed in the same wavelength range, using CoBIT-II (see Figure 2). This may suggest that the emission lines of CoBIT-II include many forbidden lines associated with long-lived meta-stable excited states. Populations of such meta-stable excited states can survive at low electron densities but it becomes smaller at higher electron densities of LHD ( m) because collisional de-population will take place over a shorter time than radiative lifetimes of the meta-stable excited states. The M1 lines identified at LHD should, therefore, mostly be associated with M1 transitions in the ground state fine-structures, as the line a–c are. In this regard, the line d is an intriguing exception.
6. Summary and Conclusions
Emission lines in 290–360 nm from W ions interacting with an electron beam of 540–1370 eV were measured, using a compact electron-beam-ion-trap at the National Institute for Fusion Science (CoBIT-II) [32]. We assigned the charge state q to each emission line, which appears in the spectra at and absent at , where stands for the ionization threshold for the charge state q and the electron beam energy. In the present work, 64 lines of W–W were identified. Such lines observed at the large helical device (LHD) [10,11], whose charge states are identified by the present work, will serve the tungsten diagnostics of fusion plasmas.
The emission line spectrum of W in the wavelength range was calculated using the collisional-radiative (CR) model. The present CR model predicts three candidates for the observed line at 351.03(10) nm. We identified the strongest line as follows: , as the observed line. The wavelength was calculated with a high accuracy using GRASP2018 code [39]; the result is in a very good agreement with the measured value (0.3% discrepancy).
Author Contributions
Conceptualization, D.K.; methodology, D.K.; software, S.E. and D.K.; validation, S.E., D.K., H.A.S., T.U., N.N. and I.M.; formal analysis, S.E. and D.K.; investigation, S.E., D.K. and H.A.S.; resources, D.K. and H.A.S.; data curation, S.E.; writing—original draft preparation, D.K.; writing—review and editing, H.A.S., N.N. and I.M.; visualization, S.E., D.K. and H.A.S.; supervision, D.K.; project administration, D.K. and I.M.; funding acquisition, D.K. and N.N. All authors have read and agreed to the published version of the manuscript.
Funding
This research was funded by JSPS Grant-in-Aid for Scientific Research (KAKENHI (B)18H01201 and (A)19H00665), the NIFS Collaboration Research program (NIFS20KLPF075, NIFS21KLPF083), and the NINS program of Promoting Research by Networking among Institutions (grant No. 01411702).
Institutional Review Board Statement
Not applicable.
Informed Consent Statement
Not applicable.
Data Availability Statement
Not applicable.
Acknowledgments
We acknowledge the support provided by JSPS Grant-in-Aid for Scientific Research (KAKENHI (B)18H01201 and (A)19H00665), the NIFS Collaboration Research program (NIFS20KLPF075, NIFS21KLPF083), and the NINS program of Promoting Research by Networking among Institutions (grant No. 01411702). D.K. thanks Gediminas Gaigalas for making his own version of GRASP2018 code available.
Conflicts of Interest
The authors declare no conflict of interest.
References
- Pütterich, T.; Neu, R.; Dux, R.; Whiteford, A.D.; O’Mullane, M.G. Modelling of measured tungsten spectra from ASDEX Upgrade and predictions for ITER. Plasma Phys. Control. Fusion 2008, 50, 085016. [Google Scholar] [CrossRef] [Green Version]
- Nakano, T.; Shumack, A.E.; Maggi, C.F.; Reinke, M.; Lawson, K.D.; Coffey, I.; Pütterich, T.; Brezinsek, S.; Lipschultz, B.; Matthews, G.F. Determination of tungsten and molybdenum concentrations from an x-ray range spectrum in JET with the ITER-like wall configuration. J. Phys. B At. Mol. Opt. Phys. 2015, 48, 144023. [Google Scholar] [CrossRef] [Green Version]
- Chowdhuri, M.B.; Morita, S.; Goto, M.; Nishimura, H.; Nagai, K.; Fujioka, S. Line analysis of EUV Spectra from Molybdenum and Tungsten Injected with Impurity Pellets in LHD. Plasma Fusion Res. 2007, 2, S1060. [Google Scholar] [CrossRef] [Green Version]
- Clementson, J.; Beiersdorfer, P.; Magee, E.W.; McLean, H.S.; Wood, R.D. Tungsten spectroscopy relevant to the diagnostics of ITER divertor plasmas. J. Phys. B At. Mol. Opt. Phys. 2010, 43, 144009. [Google Scholar] [CrossRef]
- Asmussen, K.; Fournier, K.B.; Laming, J.M.; Neu, R.; Seely, J.F.; Dux, R.; Engelhardt, W.; Fuchs, J.C. Spectroscopic investigations of tungsten in the EUV region and the determination of its concentration in tokamaks. Nucl. Fusion 1998, 38, 967–986. [Google Scholar] [CrossRef] [Green Version]
- Zhang, L.; Morita, S.; Xu, Z.; Zhang, P.F.; Zang, Q.; Duan, Y.M.; Liu, H.Q.; Zhao, H.L.; Dinga, F.; Ohishi, T.; et al. Suppression of tungsten accumulation during ELMy H-mode by lower hybrid wave heating in the EAST tokamak. Nucl. Mater. Energy 2017, 12, 774–778. [Google Scholar] [CrossRef]
- Oishi, T.; Morita, S.; Huang, X.; Zhang, H.; Goto, M. Observation of W IV–W VII line emissions in wavelength range of 495–1475 Åin the large helical device. Phys. Scr. 2016, 91, 025602. [Google Scholar] [CrossRef]
- Oishi, T.; Morita, S.; Kato, D.; Murakami, I.; Sakaue, H.A.; Kawamoto, Y.; Goto, M. Identification of forbidden emission lines from highly ionized tungsten ions in VUV wavelength range in LHD for ITER edge plasma diagnostics. Nucl. Mater. Energy 2020, 26, 100932. [Google Scholar] [CrossRef]
- Kato, D.; Goto, M.; Morita, S.; Murakami, I.; Sakaue, H.A.; Ding, X.-B.; Sudo, S.; Suzuki, C.; Tamura, N.; Nakamura, N.; et al. Observation of visible forbidden lines from highly charged tungsten ions at the large helical device. Phys. Scr. 2013, T156, 014081. [Google Scholar] [CrossRef]
- Kato, D.; Sakaue, H.A.; Murakami, I.; Fujii, K.; Goto, M.; Oishi, T.; Morita, S.; Nakamura, N.; Koike, F.; Sasaki, A.; et al. Near UV-visible line emission from tungsten highly-charged ions in Large Helical Device. NIFS-PROC 2015, 98, 43–49. [Google Scholar]
- Fujii, K.; Kato, D.; Nakamura, N.; Goto, M.; Morita, S.; Hasuo, M. Experimental evaluation of fractional abundance data for W23+–W28+. J. Phys. B At. Mol. Opt. Phys. 2017, 50, 105002. [Google Scholar] [CrossRef]
- Feldman, U.; Indelicato, P.; Sugar, J. Magnetic dipole line from U LXXI ground-term levels predicted at 3200 Å. J. Opt. Soc. Am. B 1991, 8, 3–5. [Google Scholar] [CrossRef]
- Kato, D.; Sakaue, H.A.; Murakami, I.; Goto, M.; Oishi, T.; Tamura, N.; Funaba, H.; Morita, S. Assessment of W density in LHD core plasmas using visible forbidden lines of highly charged W ions. Nucl. Fusion 2021. [Google Scholar] [CrossRef]
- Mita, M.; Sakaue, H.A.; Kato, D.; Murakami, I.; Nakamura, N. Direct Observation of the M1 Transition between the Ground Term Fine Structure Levels of W VIII. Atoms 2017, 5, 13. [Google Scholar] [CrossRef]
- Mita, M.; Kato, D.; Murakami, I.; Sakaue, H.A.; Nakamura, N. Identication of visible lines from multiply charged W8+ and W9+ ions. Phys. Rev. A 2020, 102, 042818. [Google Scholar]
- Komatsu, A.; Sakoda, J.; Minoshima, M.; Sakaue, H.A.; Ding, X.-B.; Kato, D.; Murakami, I.; Koike, F.; Nakamura, N. Visible Transitions in Highly Charged Tungsten Ions: 365–475nm. Plasma Fusion Res. 2012, 7, 1201158. [Google Scholar] [CrossRef] [Green Version]
- Li, M.; Qiu, M.L.; Xiao, J.; Yao, K.; Brage, T.; Hutton, R.; Zou, Y. A strong visible line in the spectrum of W11+. Phys. Scr. 2016, 91, 105401. [Google Scholar] [CrossRef]
- Kobayashi, Y.; Kubota, K.; Omote, K.; Komatsu, A.; Sakoda, J.; Minoshima, M.; Kato, D.; Li, J.; Sakaue, H.A.; Murakami, I.; et al. Extreme ultraviolet and visible spectroscopy of promethiumlike heavy ions. Phys. Rev. A 2015, 92, 022510. [Google Scholar] [CrossRef] [Green Version]
- Zhao, Z.Z.; Qiu, M.L.; Zhao, R.F.; Li, W.X.; Guo, X.L.; Xiao, J.; Chen, C.Y.; Zou, Y.; Hutton, R. Experimental and theoretical study of visible transitions in promethium-like tungsten. J. Phys. B At. Mol. Opt. Phys. 2015, 48, 115004. [Google Scholar] [CrossRef]
- Murata, S.; Safronova, M.S.; Safronova, U.I.; Nakamura, N. Visible spectra of heavy ions with an open 4f shell. X-Ray Spectrom. 2020, 49, 200–203. [Google Scholar] [CrossRef]
- Li, W.; Xiao, J.; Shi, Z.; Fei, Z.; Zhao, R.; Brage, T.; Huldt, S.; Hutton, R.; Zou, Y. Investigation of M1 transitions of the ground state configuration of In-like tungsten. J. Phys. B At. Mol. Opt. Phys. 2016, 49, 105002. [Google Scholar] [CrossRef] [Green Version]
- Komatsu, A.; Sakoda, J.; Nakamura, N.; Sakaue, H.A.; Ding, X.-B.; Kato, D.; Murakami, I.; Koike, F. Visible spectroscopy of highly charged tungsten ions. Phys. Scr. 2011, T144, 014012. [Google Scholar] [CrossRef]
- Fei, Z.; Li, W.; Grumer, J.; Shi, Z.; Zhao, R.; Brage, T.; Huldt, S.; Yao, K.; Hutton, R.; Zou, Y. Forbidden-line spectroscopy of the ground-state configuration of Cd-like W. Phys. Rev. A 2014, 90, 052517. [Google Scholar] [CrossRef]
- Watanabe, H.; Nakamura, N.; Kato, D.; Sakaue, H.A.; Ohtani, S. Lines from highly charged tungsten ions observed in the visible region between 340 and 400 nm. Can. J. Phys. 2012, 90, 497–501. [Google Scholar] [CrossRef]
- Fei, Z.; Zhao, R.; Shi, Z.; Xiao, J.; Qiu, M.L.; Grumer, J.; Andersson, M.; Brage, T.; Hutton, R.; Zou, Y. Experimental and theoretical study of the ground-state M1 transition in Ag-like tungsten. Phys. Rev. A 2012, 86, 062501. [Google Scholar] [CrossRef]
- Minoshima, M.; Sakoda, J.; Komatsu, A.; Sakaue, H.A.; Ding, X.-B.; Kato, D.; Murakami, I.; Dong, C.-Z.; Koike, F.; Watanabe, H.; et al. Visible transitions of highly charged tungsten ions observed with a compact electron beam ion trap. Phys. Scr. 2013, T156, 014010. [Google Scholar] [CrossRef]
- Qiu, M.L.; Zhao, R.F.; Guo, X.L.; Zhao, Z.Z.; Li, W.X.; Du, S.Y.; Xiao, J.; Yao, K.; Chen, C.Y.; Hutton, R.; et al. Investigation of transitions between metastable levels of the first excited configuration of palladium-like tungsten. J. Phys. B At. Mol. Opt. Phys. 2014, 47, 175002. [Google Scholar] [CrossRef]
- Utter, S.B.; Beiersdorfer, P.; Brown, G.V. Measurement of an unusual M1 transition in the ground state of Ti-like W52+. Phys. Rev. A 2000, 61, 030503(R). [Google Scholar] [CrossRef]
- Porto, J.V.; Kink, I.; Gillaspy, J.D. UV light from the ground term of Ti-like ytterbium, tungsten, and bismuth. Phys. Rev. A 2000, 61, 054501. [Google Scholar] [CrossRef] [Green Version]
- Watanabe, H.; Crosby, D.; Currell, F.J.; Fukami, T.; Kato, D.; Ohtani, S.; Silver, J.D.; Yamada, C. Magnetic Dipole Transitions in Titaniumlike Ions. Phys. Rev. A 2001, 63, 042513. [Google Scholar] [CrossRef] [Green Version]
- Nakamura, N.; Kikuchi, H.; Sakaue, H.A.; Watanabe, T. Compact electron beam ion trap for spectroscopy of moderate charge state ions. Rev. Sci. Instrum. 2008, 79, 063104. [Google Scholar] [CrossRef]
- Sakaue, H.A.; Nakamura, N.; Watanabe, E.; Komatsu, A.; Watanabe, T. A compact EBIT for spectroscopic studies of moderate charge state ions. J. Instrum. 2010, 5, C08010. [Google Scholar] [CrossRef]
- Kramida, A.; Ralchenko, Y.; Reader, J. NIST Atomic Spectra Database (Version 5.6.1). Available online: https://physics.nist.gov/asd (accessed on 7 June 2019).
- Grumer, J.; Zhao, R.; Brage, T.; Li, W.; Huldt, S.; Hutton, R.; Zou, Y. Coronal lines and the importance of deep-core—valence correlation in Ag-like ions. Phys. Rev. A 2014, 89, 062511. [Google Scholar] [CrossRef] [Green Version]
- Penetrante, B.M.; Bardsley, J.N.; DeWitt, D.; Clark, M.; Schneider, D. Evolution of ion-charge-state distribution in an electron-beam ion trap. Phys. Rev. A 1991, 43, 4861–4872. [Google Scholar] [CrossRef]
- Kramida, A.E.; Shirai, T. Energy levels and spectral lines of tungsten, W III through W LXXIV. At. Data Nucl. Data Tables 2009, 95, 305–474. [Google Scholar] [CrossRef]
- Bar-Shalom, A.; Klapisch, M.; Oreg, J. HULLAC, an integrated computer package for atomic processes in plasmas. J. Quant. Spectrosc. Radiat. Transf. 2001, 71, 169–188. [Google Scholar] [CrossRef]
- Froese Fischer, C.; Godefroid, M.; Brage, T.; Jönsson, P.; Gaigalas, G. Advanced multiconfiguration methods for complex atoms: I. Energies and wave functions. J. Phys. B At. Mol. Opt. Phys. 2016, 49, 182004. [Google Scholar] [CrossRef] [Green Version]
- Froese Fischer, C.; Gaigalas, G.; Jönsson, P.; Bieroń, J. GRASP2018—A Fortran 95 version of the General Relativistic Atomic Structure Package. Comput. Phys. Commun. 2019, 237, 184–187. [Google Scholar] [CrossRef]
- Dyall, K.G.; Grant, I.P.; Johnson, C.T.; Parpia, F.A.; Plummer, E.P. Grasp: A general-purpose relativistic atomic structure program. Comput. Phys. Commun. 1989, 55, 425–456. [Google Scholar] [CrossRef]
Figure 1.
Schematic of the UV-visible spectrometer and the gas injector at the compact electron-beam-ion-trap in the National Institute for Fusion Science (CoBIT-II).
Figure 1.
Schematic of the UV-visible spectrometer and the gas injector at the compact electron-beam-ion-trap in the National Institute for Fusion Science (CoBIT-II).

Figure 2.
Emission line spectra for 290–360 nm of W ions in CoBIT-II. The electron beam energy and the highest charge state produced at the energy, , are written at the right of each spectrum. Arrows in each spectrum indicate the emission lines of the ions in the charge state. Each spectrum was measured for 20 min exposure time.

Figure 3.
Emission lines of W and W ions in CoBIT-II. This is a magnification of the wavelength range and the vertical scale of Figure 2 for 1000–1270 eV.
Figure 3.
Emission lines of W and W ions in CoBIT-II. This is a magnification of the wavelength range and the vertical scale of Figure 2 for 1000–1270 eV.

Figure 4.
Emission line spectrum of the CR model for W. The transition of the line 1 is , the line 2 , and the line 3 .
Figure 4.
Emission line spectrum of the CR model for W. The transition of the line 1 is , the line 2 , and the line 3 .


Table 1.
Wavelengths (in air) of emission lines in 290–360 nm from W. Numbers in parenthesis are uncertainty. The superscript placed to the right of the wavelength indicates each emission line of a–e in Figure 2.
Table 1.
Wavelengths (in air) of emission lines in 290–360 nm from W. Numbers in parenthesis are uncertainty. The superscript placed to the right of the wavelength indicates each emission line of a–e in Figure 2.
| q | Wavelength (nm) |
|---|---|
| 29 | 351.03(10) e |
| 28 | 344.57(10) |
| 27 | 337.76(9) , 338.15(9) |
| 26 | 320.97(9), 333.74(9) , 335.76(9) |
| 25 | 297.15(6), 304.60(7), 306.74(7), 310.59(7), 313.63(7), |
| 328.68(9), 334.20(9), 359.93(11) | |
| 24 | 287.95(7), 288.55(7), 294.79(7), 298.31(7), 300.35(7), |
| 306.38(7), 323.22(8), 330.14(9), 335.75(9), 341.58(10), | |
| 344.05(10), 349.92(10), 353.71(11) | |
| 23 | 287.48(7), 289.49(7), 294.00(7), 296.32(7), 298.84(7), |
| 322.58(8), 326.60(9), 332.02(9), 333.35(9), 339.78(10), | |
| 340.27(9), 341.13(10), 347.60(10), 348.68(10) | |
| 22 | 297.56(7), 307.98(7), 308.57(7), 328.43(8), 339.03(10), |
| 342.22(10), 345.30(11), 346.89(10) | |
| 21 | 289.89(7), 291.30(7), 291.94(7), 292.91(7), 297.91(7), |
| 300.51(9), 304.71(7), 309.85(7), 311.06(7), 315.14(8), | |
| 357.82(11) | |
| 20 | 331.63(9), 341.38(10), 352.59(10) |
Table 2.
Calculated wavelengths () for the transition of W. DHF stands for the wavelength obtained with the reference CSF , SD1 the result with the CSF expansion in the first layer , and SD2 the result with the expansion including the second layer 175,140). HULLAC stands for the wavelength value in the CR model (Figure 4) calculated by HULLAC code.
| HULLAC | DHF | SD1 | SD2 | Experiment | |
|---|---|---|---|---|---|
| (nm) | 343.24 | 337.86 | 346.83 | 352.13 | 351.03(10) |
Publisher’s Note: MDPI stays neutral with regard to jurisdictional claims in published maps and institutional affiliations. |
© 2021 by the authors. Licensee MDPI, Basel, Switzerland. This article is an open access article distributed under the terms and conditions of the Creative Commons Attribution (CC BY) license (https://creativecommons.org/licenses/by/4.0/).
Share and Cite
MDPI and ACS Style
Era, S.; Kato, D.; Sakaue, H.A.; Umezaki, T.; Nakamura, N.; Murakami, I. Emission Lines in 290–360 nm of Highly Charged Tungsten Ions W20+–W29+. Atoms 2021, 9, 63. https://0-doi-org.brum.beds.ac.uk/10.3390/atoms9030063
AMA Style
Era S, Kato D, Sakaue HA, Umezaki T, Nakamura N, Murakami I. Emission Lines in 290–360 nm of Highly Charged Tungsten Ions W20+–W29+. Atoms. 2021; 9(3):63. https://0-doi-org.brum.beds.ac.uk/10.3390/atoms9030063
Chicago/Turabian StyleEra, Shota, Daiji Kato, Hiroyuki A. Sakaue, Toshiki Umezaki, Nobuyuki Nakamura, and Izumi Murakami. 2021. "Emission Lines in 290–360 nm of Highly Charged Tungsten Ions W20+–W29+" Atoms 9, no. 3: 63. https://0-doi-org.brum.beds.ac.uk/10.3390/atoms9030063
Note that from the first issue of 2016, this journal uses article numbers instead of page numbers. See further details here.