
Revealing the Target Electronic Structure with Under-Threshold RABBITT

Research School of Physics, The Australian National University, Canberra, ACT 2600, Australia
Atoms 2021, 9(3), 66; https://0-doi-org.brum.beds.ac.uk/10.3390/atoms9030066
Submission received: 6 August 2021
/
Revised: 8 September 2021
/
Accepted: 9 September 2021
/
Published: 13 September 2021
(This article belongs to the Special Issue A Tribute to Oleg Zatsarinny (1953–2021) and His Science–Fees Are Waived)
Abstract
:The process of reconstruction of attosecond beating by interference of two-photon transitions (RABBITT) reveals the target atom electronic structure when one of the transitions proceeds from below the ionization threshold. Such an under-threshold RABBITT resonates with the target bound states and thus maps faithfully the discrete energy levels and the corresponding oscillator strengths. We demonstrate this sensitivity by considering the Ne atom driven by the combination of the XUV and IR pulses at the fundamental laser frequency in the 800 and 1000 nm ranges.
PACS:
32.80.Rm; 32.80.Fb; 42.50.Hz1. Introduction
The process of reconstruction of attosecond beating by the interference of two-photon transitions (RABBITT) [1,2] has become a widely used tool for attosecond chronoscopy of atoms [3], molecules [4,5] liquids [6], and solids [7,8]. In RABBITT, XUV driven primary ionization is augmented by secondary IR photon absorption or emission. The latter IR-driven processes lead to the same final continuous state whose population depends on the relative phase of the absorption/emission amplitudes. Experimental access to this phase difference makes it possible to convert it to the photoemission time delay and to resolve photoemission on the attosecond time scale.
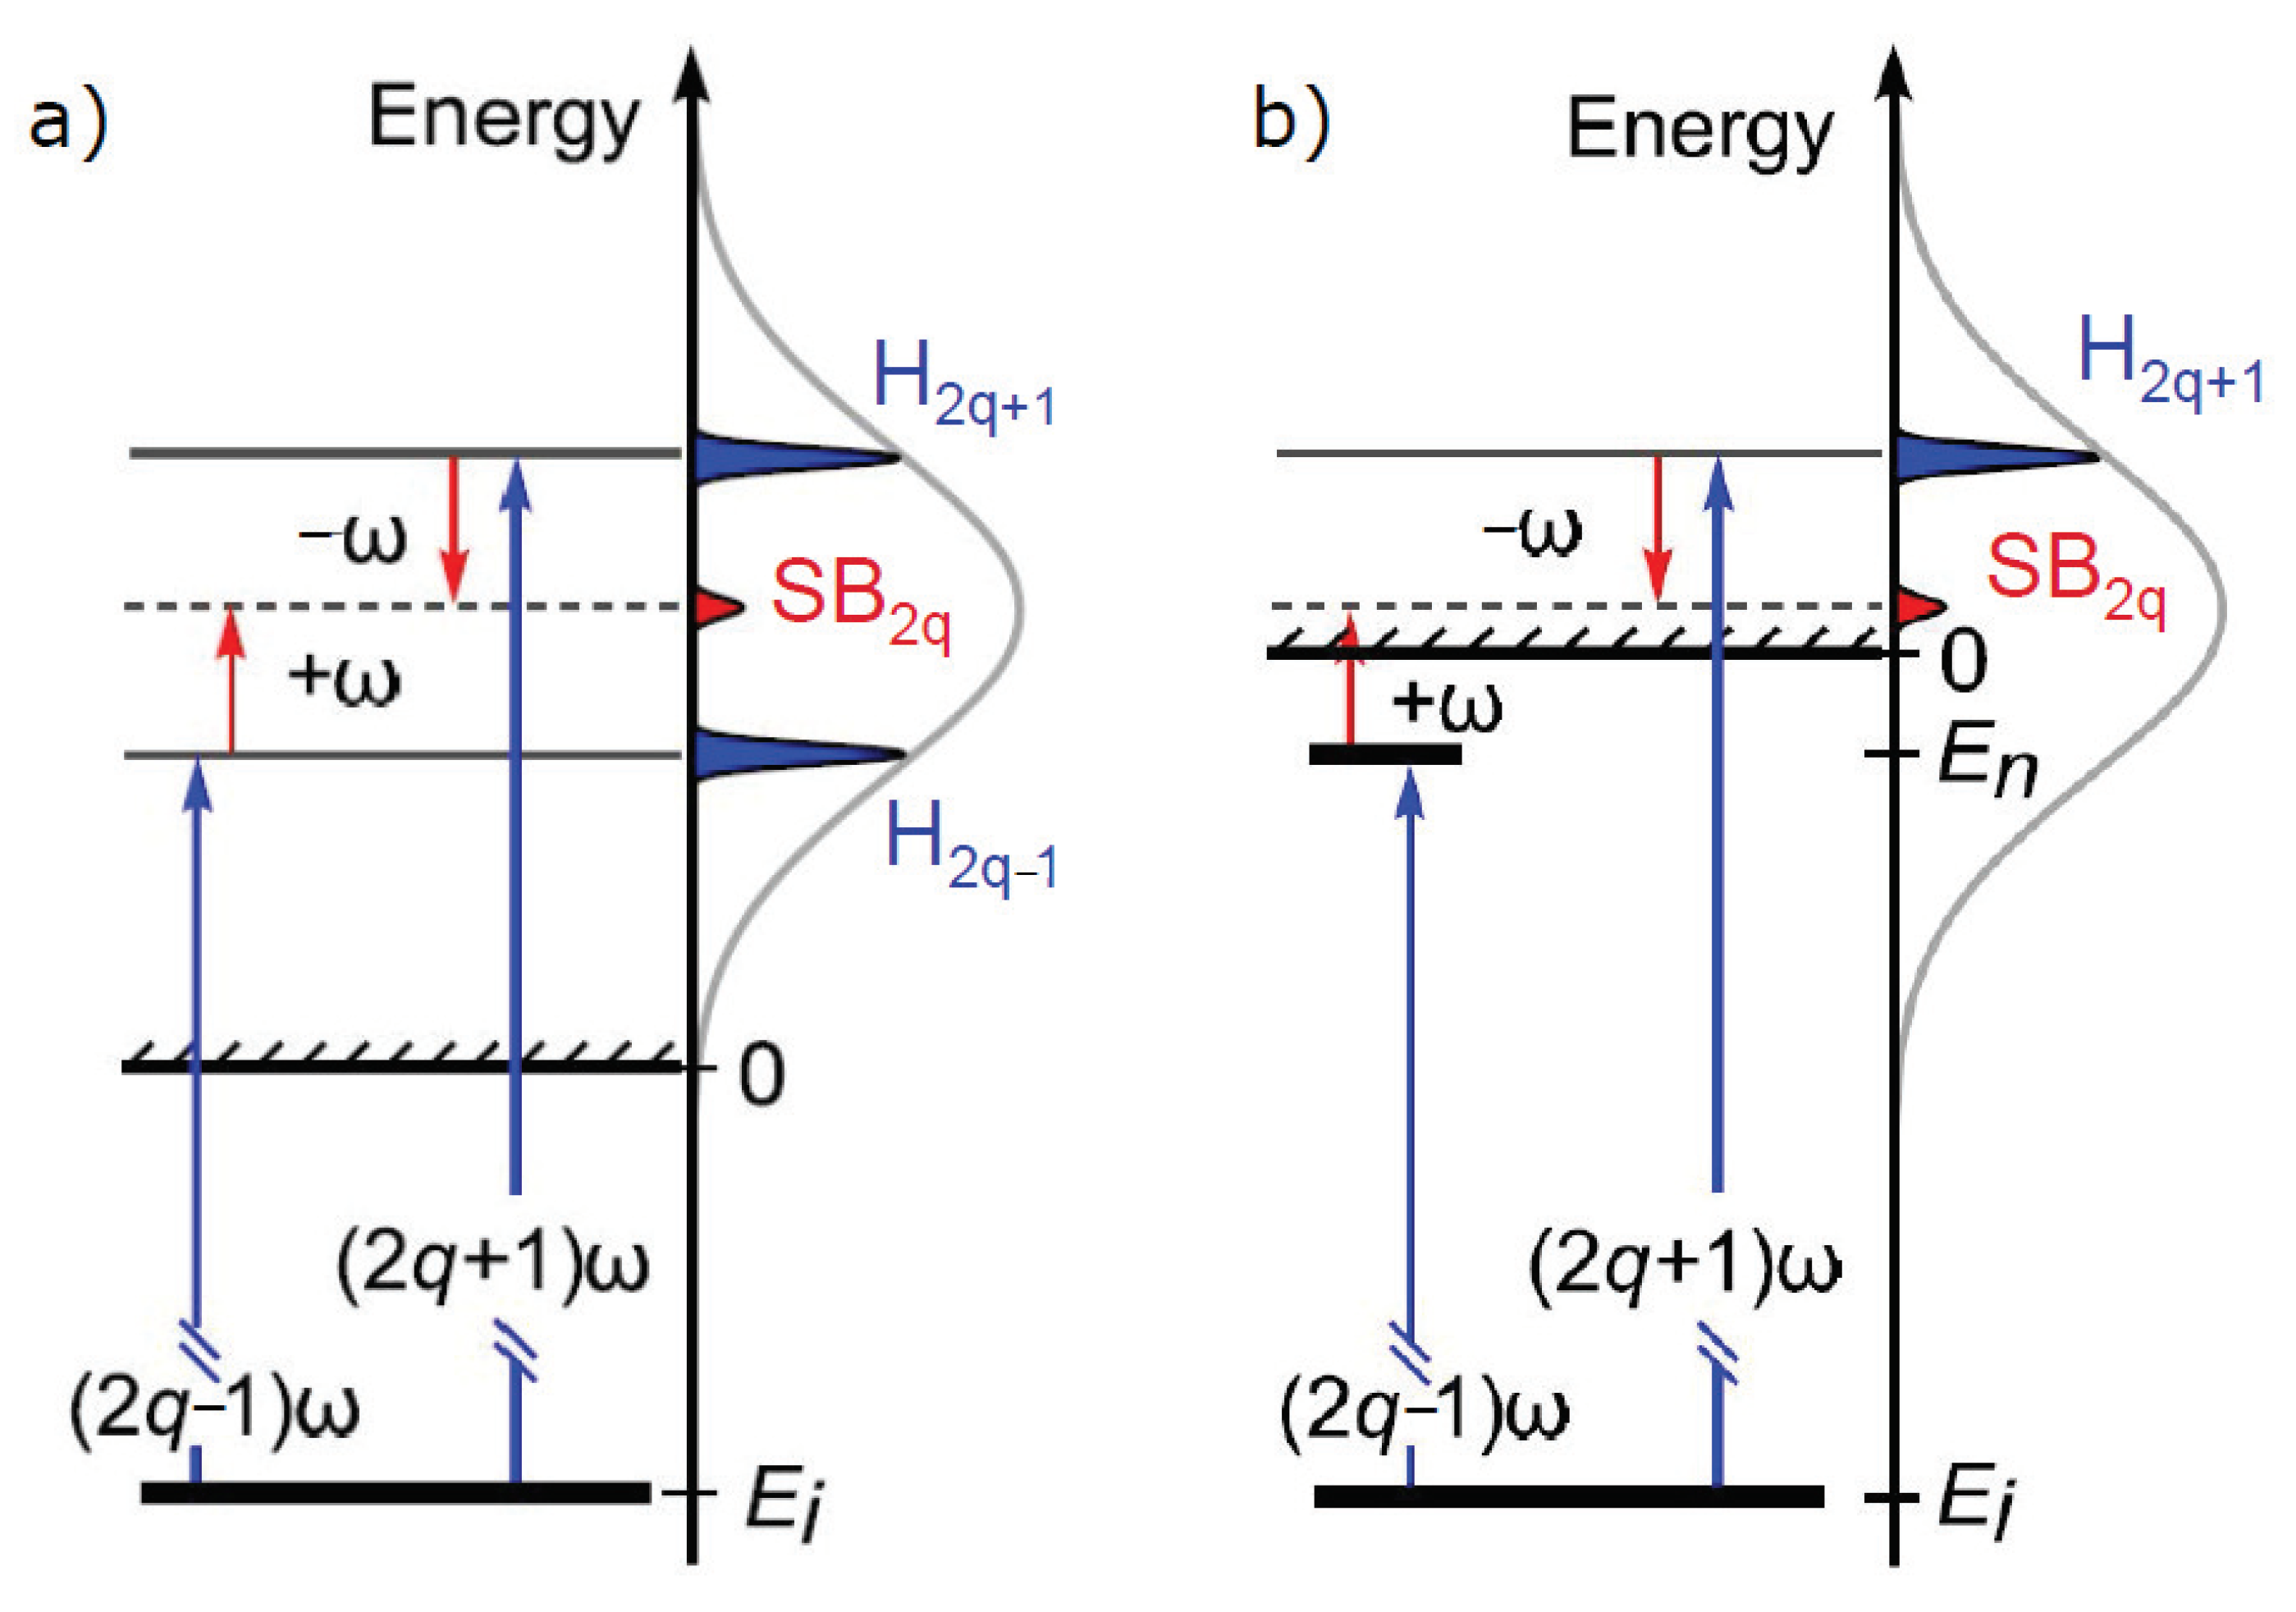
The RABBITT process is illustrated graphically in Figure 1a. The XUV photon from a high-order harmonics generation source with the frequency is absorbed from the initial atomic bound state Ei. The ionized electron appears in the continuum and forms the two harmonic peaks in the photoelectron spectrum marked as H2q±1. The subsequent IR photon absorption ω or emission −ω leads to formation of the sideband marked as SB2q. Since the two distinct quantum paths lead to the same final state, the SB population oscillates as the time delay τ between the XUV and IR pulses varies:
Here, the magnitude A and B parameters depend on the specific experimental conditions. The RABBITT phase parameter
is the sum of the phase difference between the neighboring odd harmonics (), the analogous difference of the Wigner phases (), and the difference of the continuum–continuum (CC) phases (). The two latter phase differences originate from the XUV and IR photon absorption, respectively. They are converted to the corresponding time delays by the finite difference formula
The atomic time delay is the group delay of the photoelectron wave packet propagating in the combined field of the ion remainder and the dressing IR field relative to its free space propagation.
The under-threshold RABBITT process, which we term for brevity uRABBITT, is depicted in Figure 1b. In this process, the photon absorption promotes the target electron to a discrete excited state below the threshold . It is the subsequent photon absorption that takes the photoelectron to the continuum where it interferes with its downward converted counterpart. The distinct feature of the uRABBITT process is that one of the harmonic peaks H2q−1 is missing in the photoelectron spectrum. The phase parameter C of the uRABBITT process does not contain the CC component in the IR photon absorption. Instead, it acquires a resonant phase due to the transition between the initial bound to the discrete intermediate states. In the case of an isolated resonance, the resonant phase can be approximated by a simplified expression [9]:
Here, Γ is proportional to the spectral width of the XUV pulse and is the detuning from the resonance. More elaborate expressions for the resonant two-photon absorption phase are derived in [10,11].
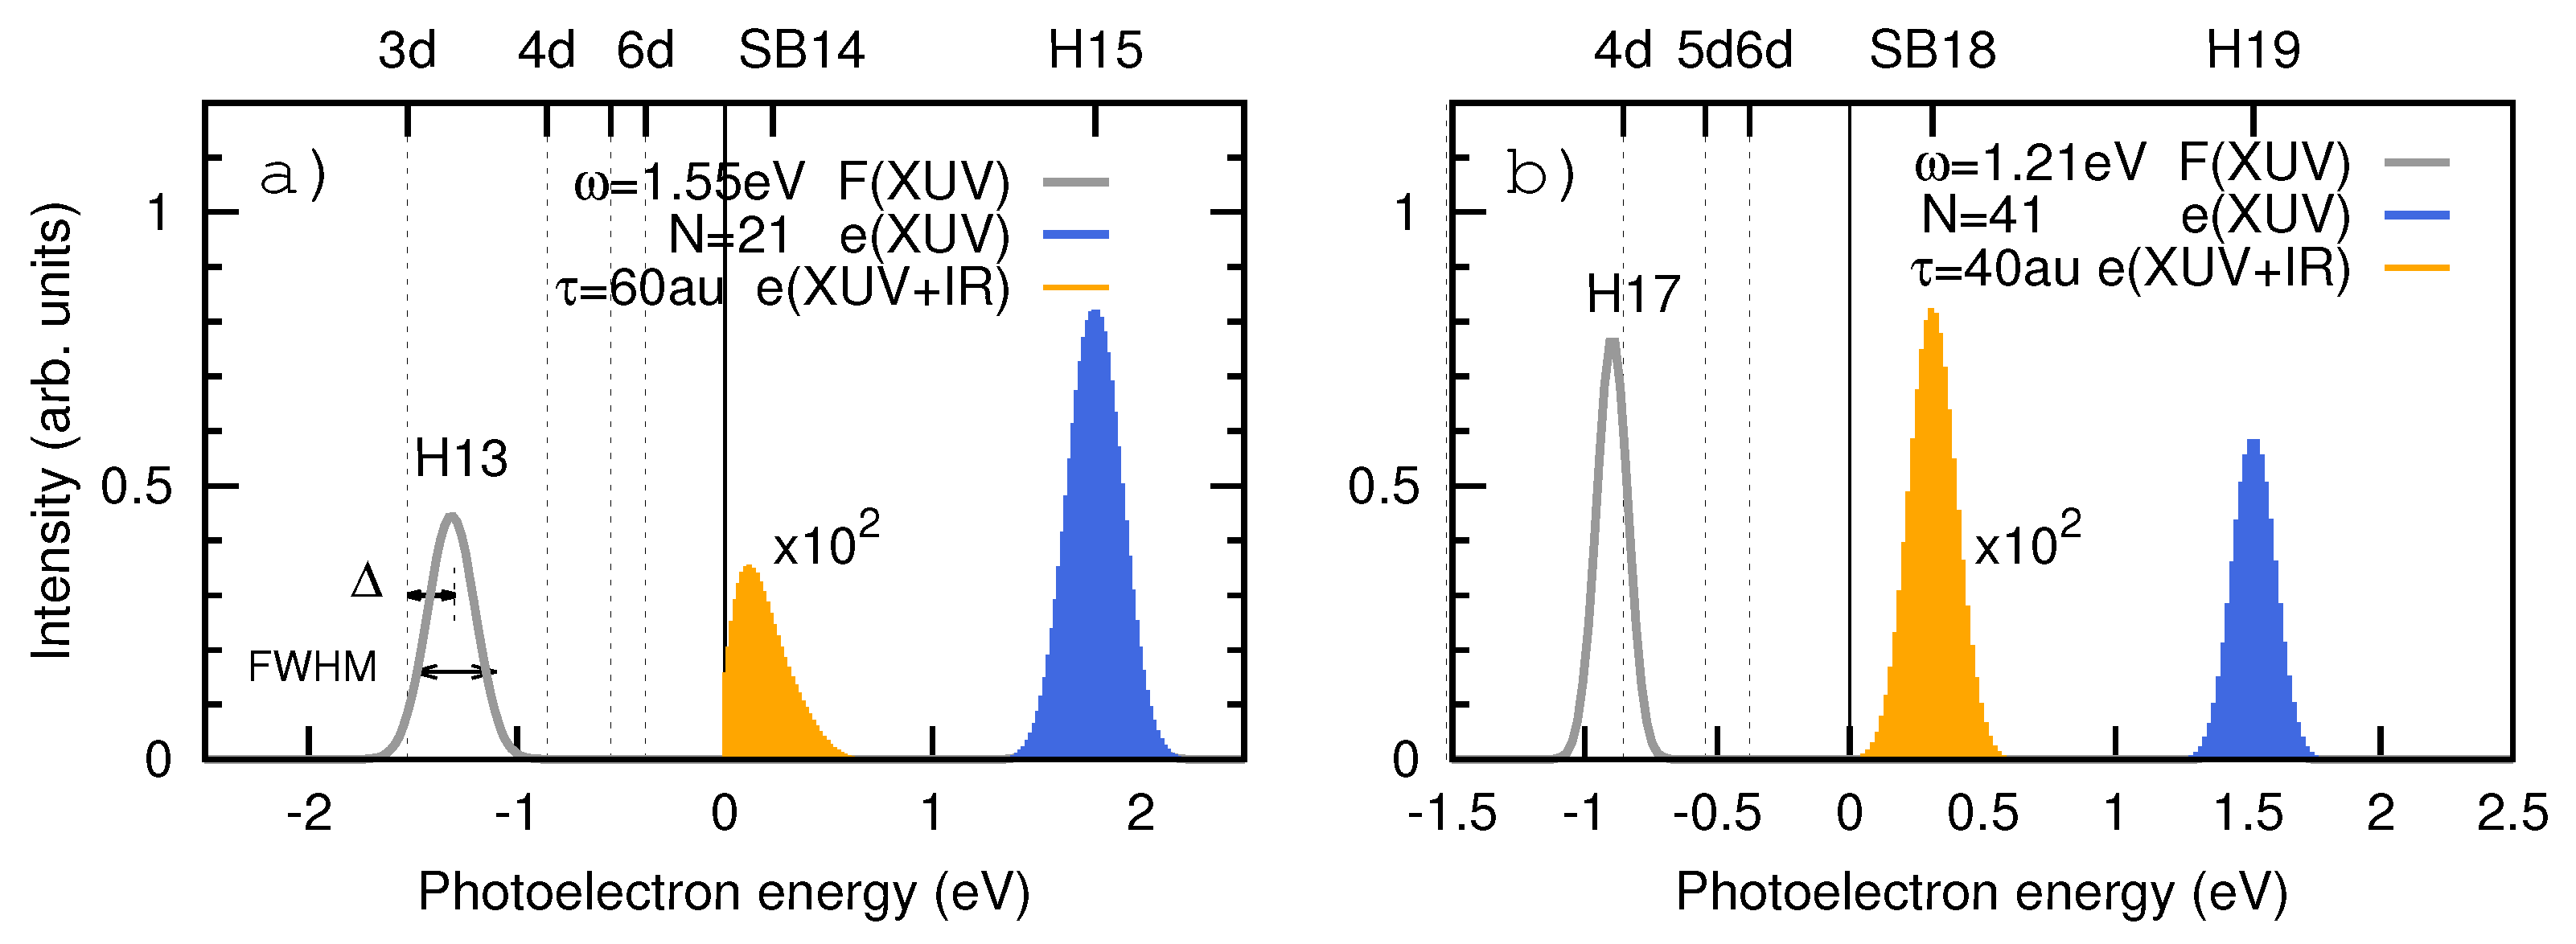
The uRABBITT process has been demonstrated experimentally in He [12] and in Ne [13,14]. The work by Villeneuve et al. [13] can be viewed as the angular resolved version of a previous study in helium. The Ne case is illustrated graphically in Figure 2 for the IR laser wavelength near 800 nm (a) and 1024 nm (b). In Figure 2a, the harmonic H15 is matched with the corresponding peak of the photoelectron spectrum while the harmonic H13 falls below the threshold where it overlaps with the discrete level. Absorption of an XUV photon from the harmonic H13 leads to the population of the excited and states with comparable oscillator strengths [15]. However, the IR absorption from is much stronger than that from , and the latter state can be ignored in the uRABBITT process (see Section 2.3 for more details). Similarly, in Figure 2b, the harmonic peak H17 falls below the threshold where it overlaps with the discrete level. The uRABBITT sideband SB18 appears just above the threshold.
The RABBITT–uRABBITT phase transition in Ne at 800 nm was studied theoretically [9]. A strong uRABBITT phase variation was demonstrated when SB14 trespassed the energy level. A rather large XUV spectral width employed in [9] did not allow for an accurate uRABBITT phase determination in the 1000 nm wavelength range when SB18 was expected to overlap with a group of narrowly spaced target states. In the present work, the XUV spectral resolution is significantly improved and the Ne bound state mapping is reported both in the 800 and 1000 nm spectral ranges. We demonstrate that, in both cases, the resonant uRABBITT phase maps faithfully the target atom electronic structure, thus allowing access to the bound state energies and the corresponding oscillator strengths.
2. Theoretical Model
2.1. Lowest Order Perturbation Theory
The simplest interpretation of the parameters entering Equation (1) is provided by the lowest order perturbation theory (LOPT):
Here, we introduce the complex amplitudes of the XUV absorption, augmented by absorption or emission of an IR photon. These two-photon ionization amplitudes are written in the LOPT as
Here, , or and are the initial, intermediate and final states, respectively, and are the dipole operators of the XUV and IR photon absorption. The XUV photon energy is and denotes the pole bypass in the complex energy plane. For a realistic XUV pulse, the infinitesimal should be substututed with a finite that is proportional to the corresponding FWHM [9].
For the conventional RABBITT, the sum over discrete intermediate states is neglected in Equation (6) as the relevant energy denominators are large. For uRABBITT, the contribution of the discrete sum is essential. We isolate this part of the absorption amplitude into the resonant term
Here, is the dipole oscillator strength and is the partial photo-ionization cross-section. Accordingly, the resonance affected uRABBITT parameters become
The resonance-free B and C parameters can be extended continuously across the threshold from the non-resonant sideband SB2q+1. The unknown analytically amplitudes can be found by fitting the numerical TDSE results with Equation (7).
2.2. Non-Perturbative Treatment
Accurate non-perturbative treatment of the RABBITT process requires a numerical solution of the time-dependent Schrödinger equation (TDSE). We seek this solution in the single-active electron (SAE) approximation using the TDSE computer code [16]. The target atom is described by a localized Hartree–Fock potential (LHF) [17]. The TDSE SAE approach to RABBITT has been tested successfully on He [18], Li [19], Ne [20], and heavier noble gas atoms [21]. The TDSE is driven by a superposition of an XUV attosecond pulse train (APT) and the IR pulse in several fixed increments of the IR/XUV delay .
The APT is modeled with the vector potential
where
Here, is the vector potential peak value and is the period of the IR field. The XUV central frequency is and the time constants are chosen to span a sufficient number of harmonics in the range of photon frequencies of interest for a given atom.
The vector potential of the IR pulse is represented by the cosine squared envelope
In the present work, the APT is centered at and its spectral width is reduced to eV by increasing the number of pulselets to in comparison with in [9]. Typical XUV and IR field intensities were of the order of W/cm2. In this low intensities regime, our numerical results depend weakly on variation of the pulses intensity. The photoelectron spectrum is obtained by projecting the time-dependent wave function at the end of the time evolution on the basis of Volkov states. Numerical details are given in the preceding publications [20,21]. The present set of calculations required approximately 80K CPU-hours of the Gadi supercomputer hosted at the National Computational Infrastructure (NCI Australia) and ranked 44th in the Top-500 supercomputer list [22].
2.3. Target Electronic Structure
We use the software package atom [23] to peform the calculations of the quantities , , and entering Equation (6). These results are presented in Table 1 and displayed graphically in Figure 3. In the table, we also list the binding energies returned by our TDSE code that utilizes the LHF potential. Except for the ground state energy, the binding energies are close between the LHF and non-local HF calculations.
Figure 3a shows that the oscillator strengths are close between the and bound states at comparable photon energies. However, Figure 3b displays very clearly that the subsequent ionization process favors very strongly the intermediate states and the states can be safely ignored in uRABBITT. We see from the same Figure 3b that the photoionization cross-sections depend rather weakly on n, and it is the oscillator strength factor that determines largely the resonant amplitude (6) in Ne.
3. Numerical Results
3.1. Photolelectron Spectra
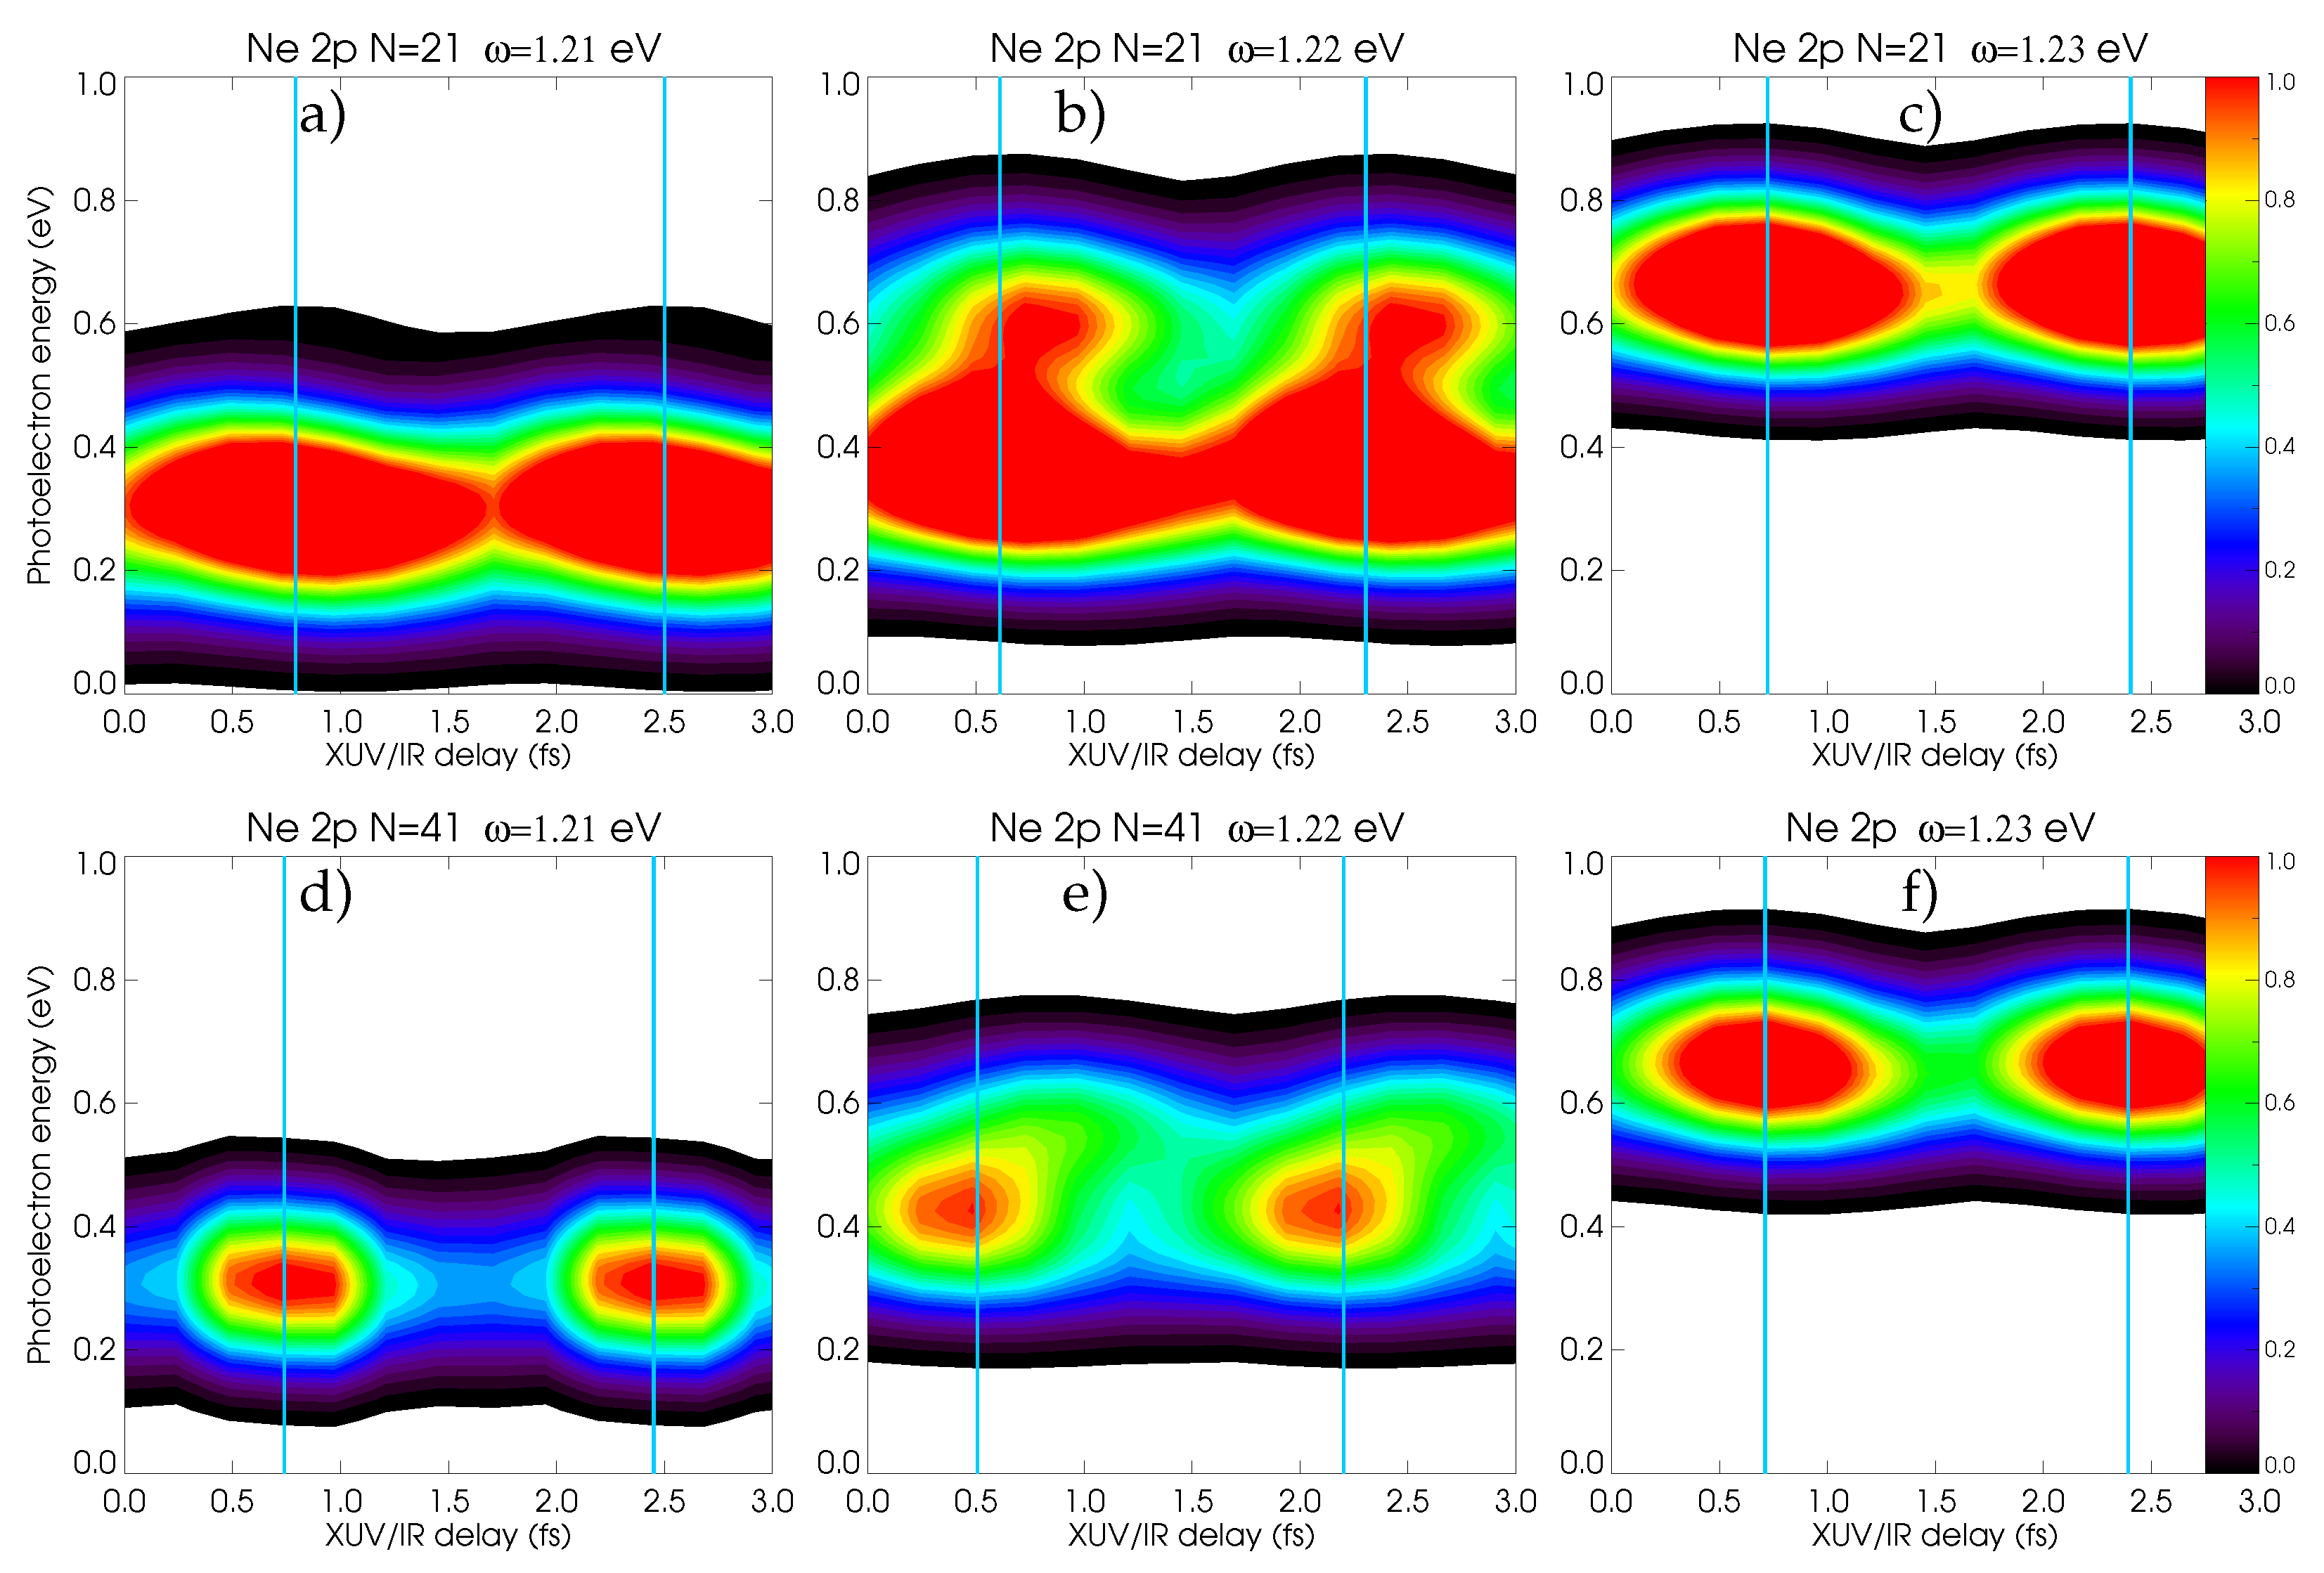
First, we illustrate the effect of the XUV spectral width on the RABBITT photoelectron spectra. For this purpose, we analyze the RABBITT traces which are composed of the stacks of the angular integrated photoelectron spectra obtained at various time delay between the XUV and IR pulses. The RABBITT traces of the Ne atom at the IR frequencies of , 1.22, and 1.23 eV are shown in Figure 4 (from left to right). These traces illustrate the passage of the harmonic peak H17 over the bound state as is exhibited in Figure 2b. The RABBITT trace in Figure 4b shows clearly the double hump structure resulting from the overlap of H17 both with the and bound states. The overlap with the single bound state or occurs at the photon energies and 1.23 eV, respectively. These cases produce well-resolved single peak structures in Figure 4a,c. The bottom row of panels in Figure 4d–f is analogous to the top row except that the XUV spectral width is halved by increasing the number of the pulselets in the APT to . The and bound states are clearly resolved at all the photon energies.
3.2. RABBITT Phase and Magnitude Parameters
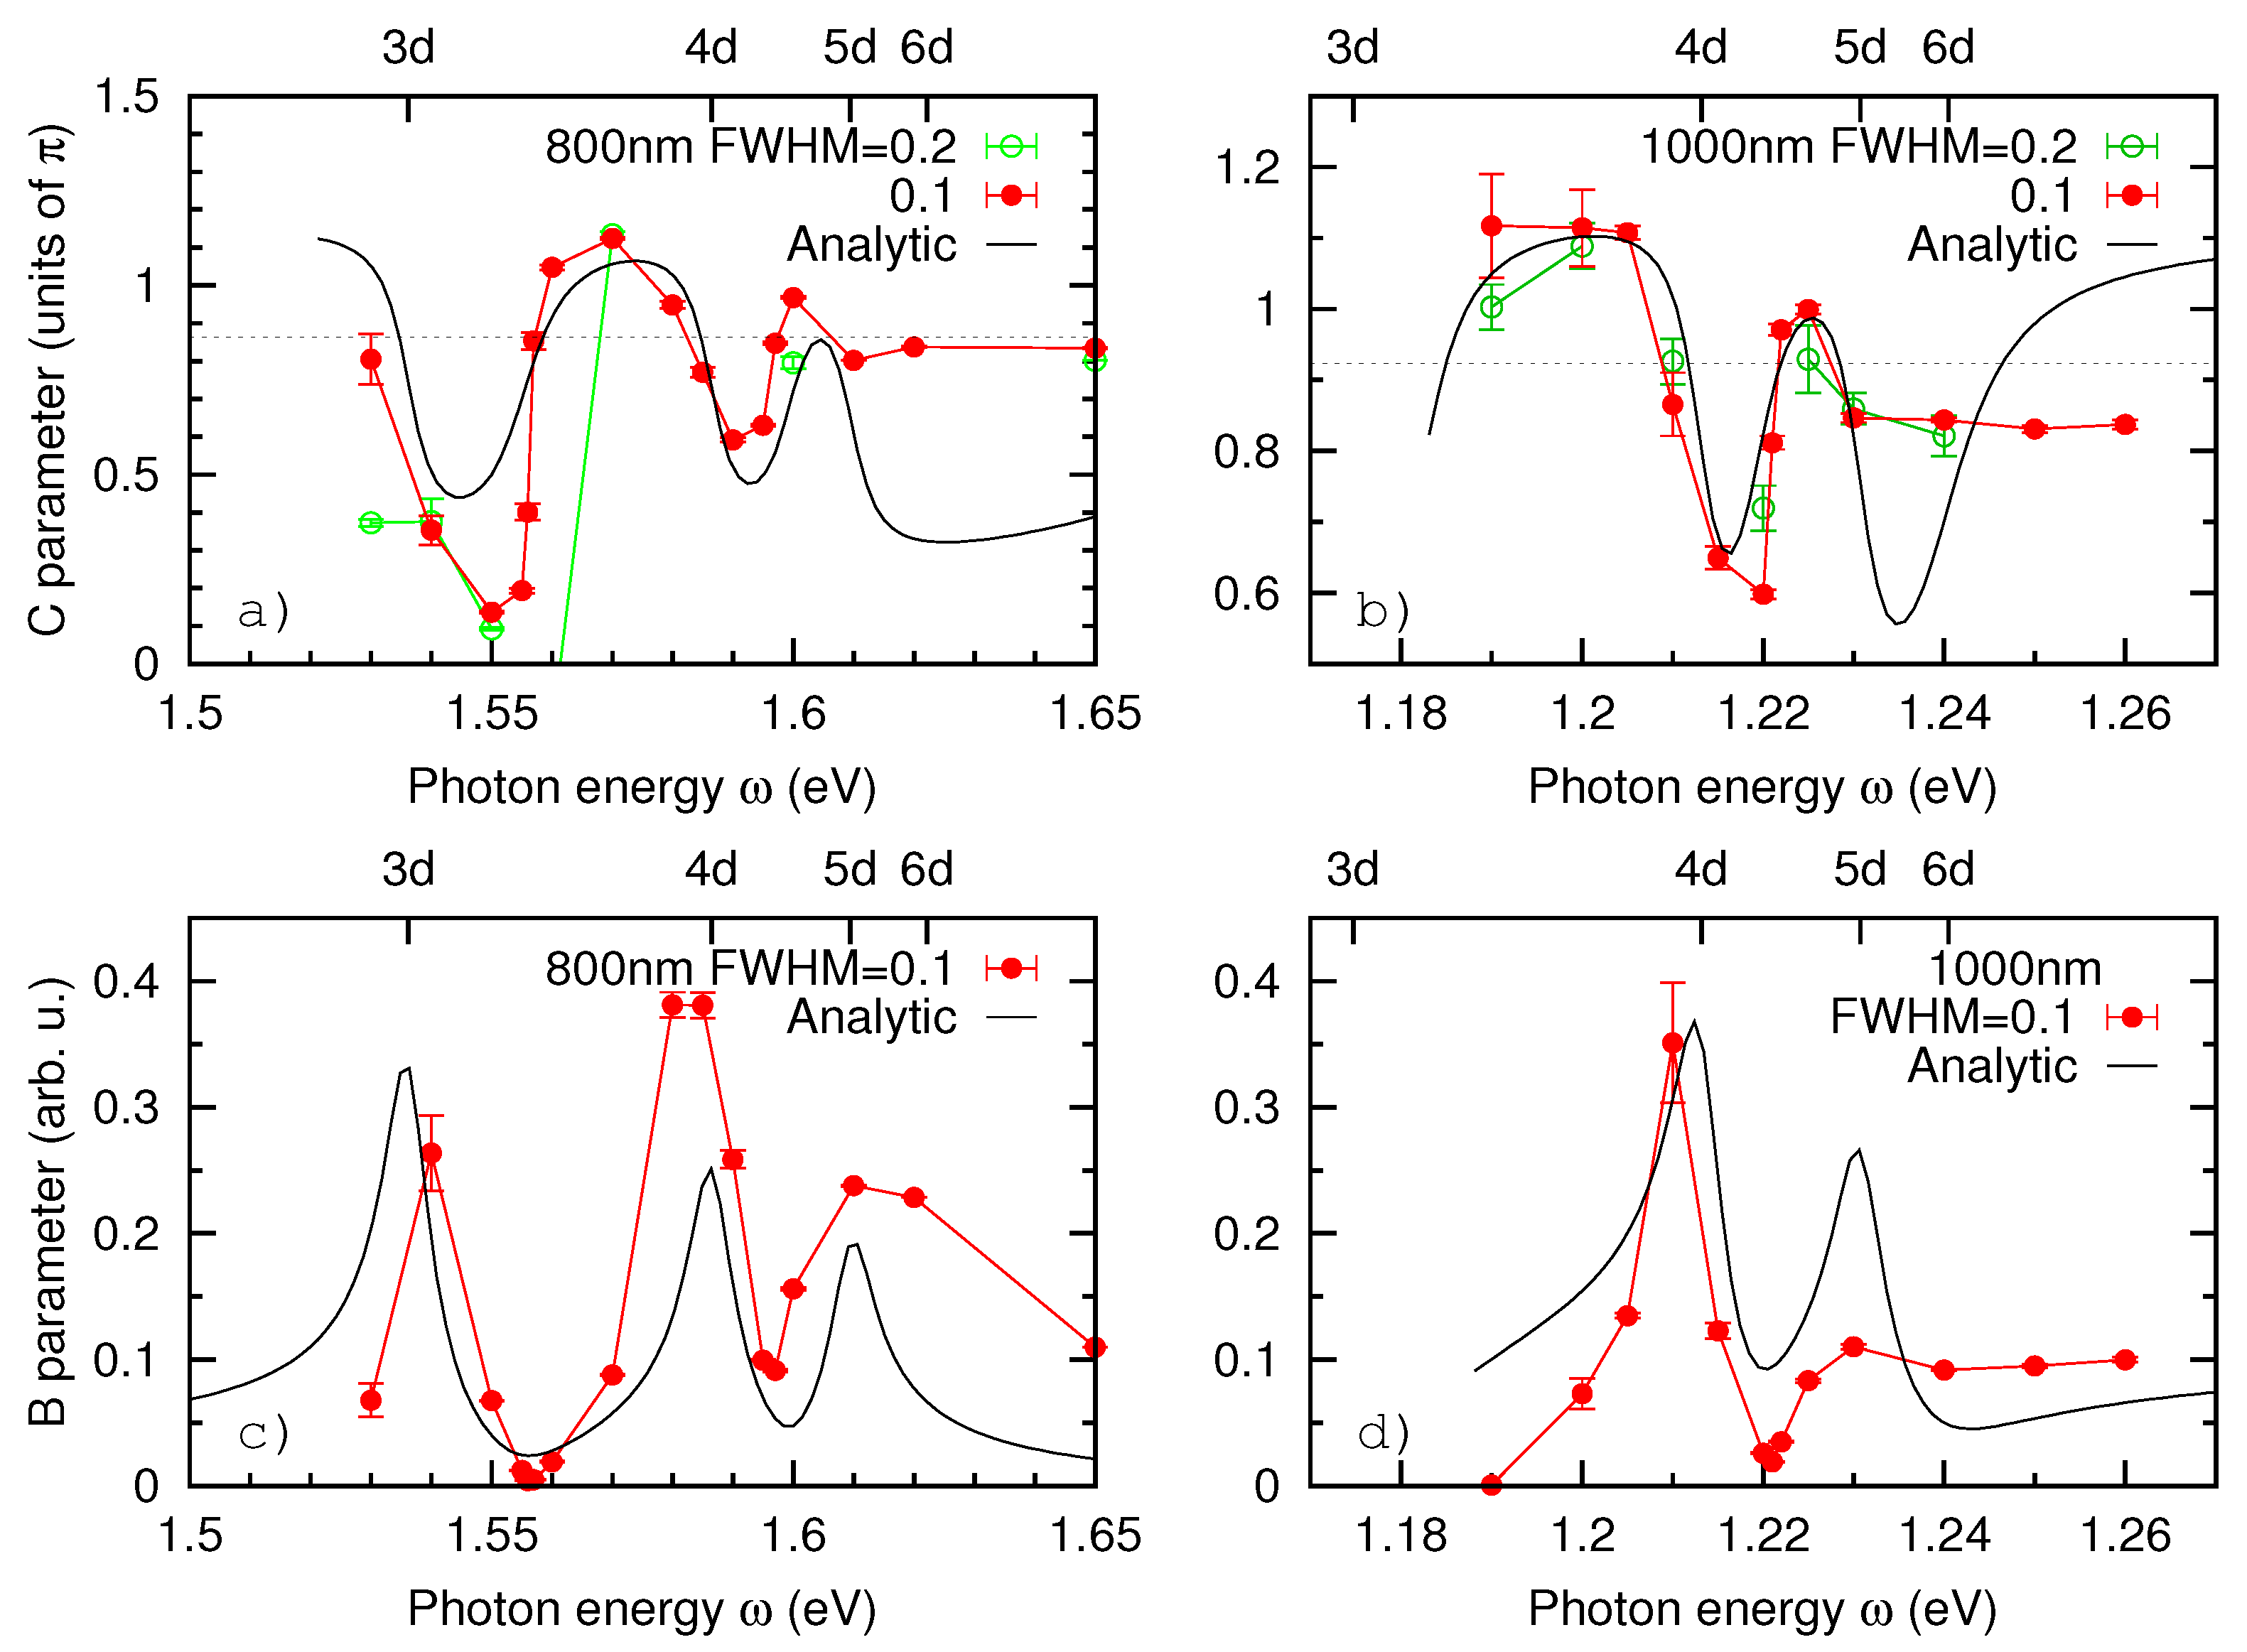
The sideband intensities are integrated over the energy window and their time dependence is fitted with Equation (1). The resulting phase C parameters and the magnitude B parameters are plotted in the top and bottom rows of Figure 5, respectively. The left panels Figure 5a,c correspond to the 800 wavelength range ( eV). The right panels Figure 5b,d span the photon energies in the 1000 wavelength range ( eV). The top horizontal axis marks the crossing of the submerged harmonic peak with a discrete energy level: where for 800 nm and 17 for 1000 nm, respectively. In Figure 5, the TDSE results with both FWHM=0.2 and 0.1 eV are plotted. The smaller XUV spectral width allows for a much more narrowly spaced photon energy points to be resolved.
The RABBIT phase C and magnitude B parameters are fitted with the analytic expressions (6) and (7). In the latter expression, the non-resonant terms are determined from the conventional SB16 for 800 nm and SB20 for 1000 nm. These terms remain flat over the considered photon energy range. Comparison of the TDSE and LOPT results is fair for both sets of parameters.
4. Conclusions
In the present work, we utilized the under-threshold RABBITT process to map the target electronic structure of the Ne atom. For this purpose, we run an extensive set of numerical TDSE simulations over the two spectral ranges near the central wavelengths of 800 and 1000 nm with a fine increment meV. We made a comparison of our numerical results with predictions of the analytic LOPT expressions utilizing accurate bound state energies and oscillator strengths. These expressions predict a rapid variation of the RABBITT phase C and the magnitude B parameters when the submerged harmonic peak H2q−1 overlaps with one of the bound states. The companion bound state series is found to be very weak in the Ne atom. This is confirmed by the propensity of the f final state continuum which is not accessible from the internediate state [13]. Our numerical results agree rather well with the analytic formulas, thus validating our approach. This means that the uRABBITT process can indeed be used for mapping the target atom electronic structure once the submerged harmonic peak sweeps across the series of the bound states. The uRABBITT technique can be used in various atomic targets and thus prove itself to be a useful and novel spectroscopic tool.
While the present work analyzed the angular integrated photoelectron spectra, the angular dependence of the RABBITT phase can also be studied with a clear transition to the uRABBITT regime. In particular, in our previous work [9], an f-angular character of the final photoelectron continuum was demonstrated in line with the experimental findings [13]. This significantly broadens the scope of the uRABBITT spectroscopy.
Funding
This research was funded by the Australian Reseach Council under the Discovery Project DP190101145.
Data Availability Statement
The numerical data reported in the present work are available on request from the author.
Acknowledgments
The author gratefully acknowledges Giuseppe Sansone, Hamed Ahmadi, and Matteo Moioli for many intense and stimulating discussions. Serguei Patchkovskii is acknowledged for placing his SCID TDSE code at the author’s disposal. Resources of National Computational Infrastructure facility (NCI Australia) have been employed.
Conflicts of Interest
The author declares no conflict of interest.
References
- Muller, H. Reconstruction of attosecond harmonic beating by interference of two-photon transitions. Appl. Phys. B 2002, 74, s17–s21. [Google Scholar] [CrossRef]
- Toma, E.S.; Muller, H.G. Calculation of matrix elements for mixed extreme-ultraviolet–infrared two-photon above-threshold ionization of argon. J. Phys. B 2002, 35, 3435. [Google Scholar] [CrossRef]
- Pazourek, R.; Nagele, S.; Burgdörfer, J. Attosecond chronoscopy of photoemission. Rev. Mod. Phys. 2015, 87, 765–802. [Google Scholar] [CrossRef]
- Huppert, M.; Jordan, I.; Baykusheva, D.; von Conta, A.; Wörner, H.J. Attosecond Delays in Molecular Photoionization. Phys. Rev. Lett. 2016, 117, 093001. [Google Scholar] [CrossRef] [PubMed]
- Vos, J.; Cattaneo, L.; Patchkovskii, S.; Zimmermann, T.; Cirelli, C.; Lucchini, M.; Kheifets, A.; Landsman, A.S.; Keller, U. Orientation-dependent Stereo Wigner Time delay in a small molecule. Science 2018, 360, 1326–1330. [Google Scholar] [CrossRef] [PubMed]
- Jordan, I.; Huppert, M.; Rattenbacher, D.; Peper, M.; Jelovina, D.; Perry, C.; von Conta, A.; Schild, A.; Wörner, H.J. Attosecond spectroscopy of liquid water. Science 2020, 369, 974–979. [Google Scholar] [CrossRef] [PubMed]
- Lucchini, M.; Castiglioni, L.; Kasmi, L.; Kliuiev, P.; Ludwig, A.; Greif, M.; Osterwalder, J.; Hengsberger, M.; Gallmann, L.; Keller, U. Light-Matter Interaction at Surfaces in the Spatiotemporal Limit of Macroscopic Models. Phys. Rev. Lett. 2015, 115, 137401. [Google Scholar] [CrossRef] [PubMed]
- Locher, R.; Castiglioni, L.; Lucchini, M.; Greif, M.; Gallmann, L.; Osterwalder, J.; Hengsberger, M.; Keller, U. Energy-dependent photoemission delays from noble metal surfaces by attosecond interferometry. Optica 2015, 2, 405–410. [Google Scholar] [CrossRef]
- Kheifets, A.S.; Bray, A.W. RABBITT phase transition across the ionization threshold. Phys. Rev. A 2021, 103, L011101. [Google Scholar] [CrossRef]
- Jiménez-Galán, A.; Martín, F.; Argenti, L. Two-photon finite-pulse model for resonant transitions in attosecond experiments. Phys. Rev. A 2016, 93, 023429. [Google Scholar] [CrossRef]
- Ishikawa, K.L.; Ueda, K. Competition of Resonant and Nonresonant Paths in Resonance-Enhanced Two-Photon Single Ionization of He by an Ultrashort Extreme-Ultraviolet Pulse. Phys. Rev. Lett. 2012, 108, 033003. [Google Scholar] [CrossRef] [PubMed]
- Swoboda, M.; Fordell, T.; Klünder, K.; Dahlström, J.M.; Miranda, M.; Buth, C.; Schafer, K.J.; Mauritsson, J.; L’Huillier, A.; Gisselbrecht, M. Phase Measurement of Resonant Two-Photon Ionization in Helium. Phys. Rev. Lett. 2010, 104, 103003. [Google Scholar] [CrossRef] [PubMed]
- Villeneuve, D.M.; Hockett, P.; Vrakking, M.J.J.; Niikura, H. Coherent imaging of an attosecond electron wave packet. Science 2017, 356, 1150–1153. [Google Scholar] [CrossRef] [PubMed]
- Moioli, M.; Hamilton, K.R.; Ahmadi, H.; Ertel, D.; Schmoll, M.; Popova, M.M.; Gryzlova, E.V.; Grum-Grzhimailo, A.N.; Kiselev, M.D.; Atri-Schuller, D.; et al. Attosecond time delays near the photoionisation threshold of neon. Photonic Electron. Atom. Collisions 2021, 32, J31. [Google Scholar]
- Amusia, M.Y. Atomic Photoeffect; Plenum Press: New York, NY, USA, 1990. [Google Scholar]
- Morales, F.; Bredtmann, T.; Patchkovskii, S. iSURF: A family of infinite-time surface flux methods. J. Phys. B 2016, 49, 245001. [Google Scholar] [CrossRef]
- Wendin, G.; Starace, A.F. Perturbation theory in a strong-interaction regime with application to 4d-subshell spectra of Ba and La. J. Phys. B 1978, 11, 4119. [Google Scholar] [CrossRef]
- Heuser, S.; Jiménez Galán, A.; Cirelli, C.; Marante, C.; Sabbar, M.; Boge, R.; Lucchini, M.; Gallmann, L.; Ivanov, I.; Kheifets, A.S.; et al. Angular dependence of photoemission time delay in helium. Phys. Rev. A 2016, 94, 063409. [Google Scholar] [CrossRef]
- Kheifets, A.S. Strongly resonant RABBITT on lithium. Phys. Rev. A 2021, 104, L021103. [Google Scholar] [CrossRef]
- Ivanov, I.A.; Kheifets, A.S. Angle-dependent time delay in two-color XUV+IR photoemission of He and Ne. Phys. Rev. A 2017, 96, 013408. [Google Scholar] [CrossRef]
- Bray, A.W.; Naseem, F.; Kheifets, A.S. Simulation of angular-resolved RABBITT measurements in noble-gas atoms. Phys. Rev. A 2018, 97, 063404. [Google Scholar] [CrossRef]
- The 500 Most Powerful Commercially Available Computer Systems. Available online: https://www.top500.org/lists/top500/2021/06/ (accessed on 28 June 2021).
- Amusia, M.I.; Chernysheva, L.V. Computation of Atomic Processes: A Handbook for the ATOM Programs; Institute of Physics Publishing Ltd.: Bristol, UK; Philadelphia, PA, USA, 1997. [Google Scholar]
- Kramida, A.; Ralchenko, Y.; Reader, J.; NIST ASD Team. NIST Atomic Spectra Database (ver. 5.2); National Institute of Standards and Technology: Gaithersburg, MD, USA, 2014. Available online: http://physics.nist.gov/asd (accessed on 30 June 2015).
Figure 1.
(a) Schematic representation of the conventional RABBITT process; (b) the same for the uRABBITT process.
Figure 1.
(a) Schematic representation of the conventional RABBITT process; (b) the same for the uRABBITT process.

Figure 2.
(a) Photoelectron spectrum of Ne at ω = 1.55 eV (800 nm) is overlapped with the spectrum of the driving XUV pulse. The primary harmonic peak H15 and the scaled sideband SB14 are shaded in blue and orange, respectively. The submerged harmonic peak H13 overlaps with the dicrete 3d energy level. The arrows indicate the detuning Δ and FWHM; (b) same for ω = 1.21 eV (1024 nm) where the submerged harmonic peak H17 overlaps with the 4d bound state and SB18 emerges above the threshold.

Figure 3.
(a) Oscillator strengths of the and transitions in Ne from the atom calculation; (b) partial photoionization cross-sections for the transitions.
Figure 3.
(a) Oscillator strengths of the and transitions in Ne from the atom calculation; (b) partial photoionization cross-sections for the transitions.

Figure 4.
From left to right: RABBITT traces of the Ne atom at the photon frequencies (a,d), 1.22 (b,e), and 1.23 eV (c,f). The number of the pulselets N = 21 in the top row (a–c) corresponds to the spectral width FWHM = 0.2 eV. In the bottom row (d–f), N = 41 and FWHM = 0.1 eV. The thin blue lines mark the center of the SB18.

Figure 5.
Top: the RABBITT phase C parameter as the function of the fundamental laser frequency in the 800 nm (a) and 1000 nm (b) wavelength ranges. The top horizontal axis marks the crossing of the harmonic peaks H13 (a) and H17 (b) with the discrete energy levels. Bottom: the RABBITT magnitude B parameter for the 800 nm (c) and 1000 nm (d) spectral ranges. Comparison with the analytic expressions (6) and (7) is made. The thin dotted line marks the non-resonant RABBITT C parameters which remain flat over the marked photon energy range.


Table 1.
Binding energies Enl and oscillator strengths fnl of Ne in atomic units. The TDSE calculations with the LHF potential are compared with the ATOM calculations with the non-local HF potential. The experimental binding energies are from [24].
Table 1.
Binding energies Enl and oscillator strengths fnl of Ne in atomic units. The TDSE calculations with the LHF potential are compared with the ATOM calculations with the non-local HF potential. The experimental binding energies are from [24].
| nl | Binding Energy Enl, au | fnl, au | ||
|---|---|---|---|---|
| Expt. | Theory | |||
| NIST | TDSE | ATOM | ||
| 2p | 0.792 | 0.788 | 0.850 | |
| 3s | 0.181 | 0.171 | 0.175 | 0.1505 |
| 4s | 0.066 | 0.067 | 0.068 | 0.0265 |
| 3d | 0.056 | 0.055 | 0.056 | 0.0203 |
| 4d | 0.031 | 0.031 | 0.031 | 0.0109 |
| 5d | 0.020 | 0.020 | 0.020 | 0.0061 |
Publisher’s Note: MDPI stays neutral with regard to jurisdictional claims in published maps and institutional affiliations. |
© 2021 by the author. Licensee MDPI, Basel, Switzerland. This article is an open access article distributed under the terms and conditions of the Creative Commons Attribution (CC BY) license (https://creativecommons.org/licenses/by/4.0/).
Share and Cite
MDPI and ACS Style
Kheifets, A. Revealing the Target Electronic Structure with Under-Threshold RABBITT. Atoms 2021, 9, 66. https://0-doi-org.brum.beds.ac.uk/10.3390/atoms9030066
AMA Style
Kheifets A. Revealing the Target Electronic Structure with Under-Threshold RABBITT. Atoms. 2021; 9(3):66. https://0-doi-org.brum.beds.ac.uk/10.3390/atoms9030066
Chicago/Turabian StyleKheifets, Anatoli. 2021. "Revealing the Target Electronic Structure with Under-Threshold RABBITT" Atoms 9, no. 3: 66. https://0-doi-org.brum.beds.ac.uk/10.3390/atoms9030066
Note that from the first issue of 2016, this journal uses article numbers instead of page numbers. See further details here.