Article

Simultaneous Observation of Tungsten Spectra of W0 to W46+ Ions in Visible, VUV and EUV Wavelength Ranges in the Large Helical Device

1
National Institute for Fusion Science, National Institutes of Natural Sciences, 322-6 Oroshi-cho, Toki, Gifu 509-5292, Japan
2
Department of Fusion Science, The Graduate University for Advanced Studies, SOKENDAI, 322-6 Oroshi-cho, Toki, Gifu 509-5292, Japan
3
Interdisciplinary Graduate School of Engineering Sciences, Kyushu University, Kasuga, Fukuoka 816-8580, Japan
4
National Astronomical Observatory of Japan, 2-21-1 Osawa, Mitaka, Tokyo 181-8588, Japan
*
Author to whom correspondence should be addressed.
Submission received: 1 September 2021 / Revised: 15 September 2021 / Accepted: 15 September 2021 / Published: 17 September 2021
(This article belongs to the Special Issue Atomic and Molecular Spectra in Magnetically Confined Torus Plasmas)

Abstract

:
Spectroscopic studies for emissions released from tungsten ions have been conducted in the Large Helical Device (LHD) for contribution to the tungsten transport study in tungsten divertor fusion devices and for expansion of the experimental database of tungsten line emissions. Tungsten ions are distributed in the LHD plasma by injecting a pellet consisting of a small piece of tungsten metal wire enclosed by a carbon tube. Line emissions from W0, W5+, W6+, W24+–W28+, W37+, W38+, and W41+–W46+ are observed simultaneously in the visible (3200–3550 Å), vacuum ultraviolet (250–1050 Å), and extreme ultraviolet (5–300 Å) wavelength ranges and the wavelengths are summarized. Temporal evolutions of line emissions from these charge states are compared for comprehensive understanding of tungsten impurity behavior in a single discharge. The charge distribution of tungsten ions strongly depends on the electron temperature. Measurements of emissions from W10+ to W20+ are still insufficient, which is addressed as a future task.

1. Introduction

Tungsten (W) is considered as a candidate material for plasma-facing components (PFCs) in the divertor region of the international thermonuclear experimental reactor (ITER) and future fusion reactors because of its high melting point, low sputtering yield, and low tritium retention [1,2,3]. On the other hand, there is a concern that tungsten ions with a large atomic number of Z = 74 will cause large energy loss by radiation and ionization when the plasma is contaminated by the W impurity. Therefore, it is very important to investigate the behavior of tungsten in high temperature plasmas in order to control tungsten transport and establish reliable operation scenarios for fusion reactors. Since tungsten is high-Z and can take a wide range of charge states, the wavelength range to be covered by spectroscopy is also wide. Therefore, efforts to compile a database of the emission spectra of tungsten ions with a wide range of charge states are actively conducted [4], and spectroscopic diagnostics to further accumulate spectral data have been continuously carried out in basic experiments such as the electron beam ion trap (EBIT) and magnetic field confinement plasma experiments [5,6,7,8,9,10].
Spectroscopic studies for emission from W ions in combination with a tungsten pellet injection technique have been intensively conducted on the Large Helical Device (LHD) for contribution to tungsten transport studies in tungsten divertor fusion devices represented by ITER and for expansion of the experimental database of tungsten line emissions [11,12,13,14]. The electron temperature, Te, of the LHD core plasmas with a tungsten pellet injection ranges from 0.5 keV to 3.5 keV, which is close to that of the edge plasmas in ITER around the last closed flux surface, including the scrape-off layer. Thus, observation of tungsten lines in LHD could improve the tungsten diagnostics in ITER edge plasmas. The current status of tungsten emission lines observed in LHD using visible, vacuum ultraviolet (VUV), and extreme ultraviolet (EUV) spectroscopy can be summarized as follows. The line emissions from the neutral atoms, W0, as well as the singly ionized ions, W+, were observed using visible spectroscopy in the wavelength range of 4000–4400 Å [11]. The visible spectroscopy has also observed magnetic dipole (M1) forbidden transition lines from W26+ and W27+ in the wavelength range of 3300–3900 Å [15,16,17]. The line emissions from tungsten ions in low charge states, W2+–W6+, have been identified in the VUV range of 500–1500 Å [18]. Recently, several M1 lines of W29+–W39+ were successfully observed in the VUV wavelength range of 500–900 Å [19]. Additionally, in the EUV range of 5–500 Å, tungsten ions in low charge states, W4+–W7+, medium charge states, W24+–W33+ in the structures of the unresolved transition array (UTA), as well as high charge states, W41+–W46+, have been identified [20,21,22]. This paper is dedicated to summarizing the tungsten spectra in the visible, VUV, and EUV wavelength ranges based on the progress of line identifications. Temporal evolution of emissions from tungsten ions in various charge states that are observed simultaneously will also be demonstrated for comprehensive understanding of behavior of tungsten impurity.

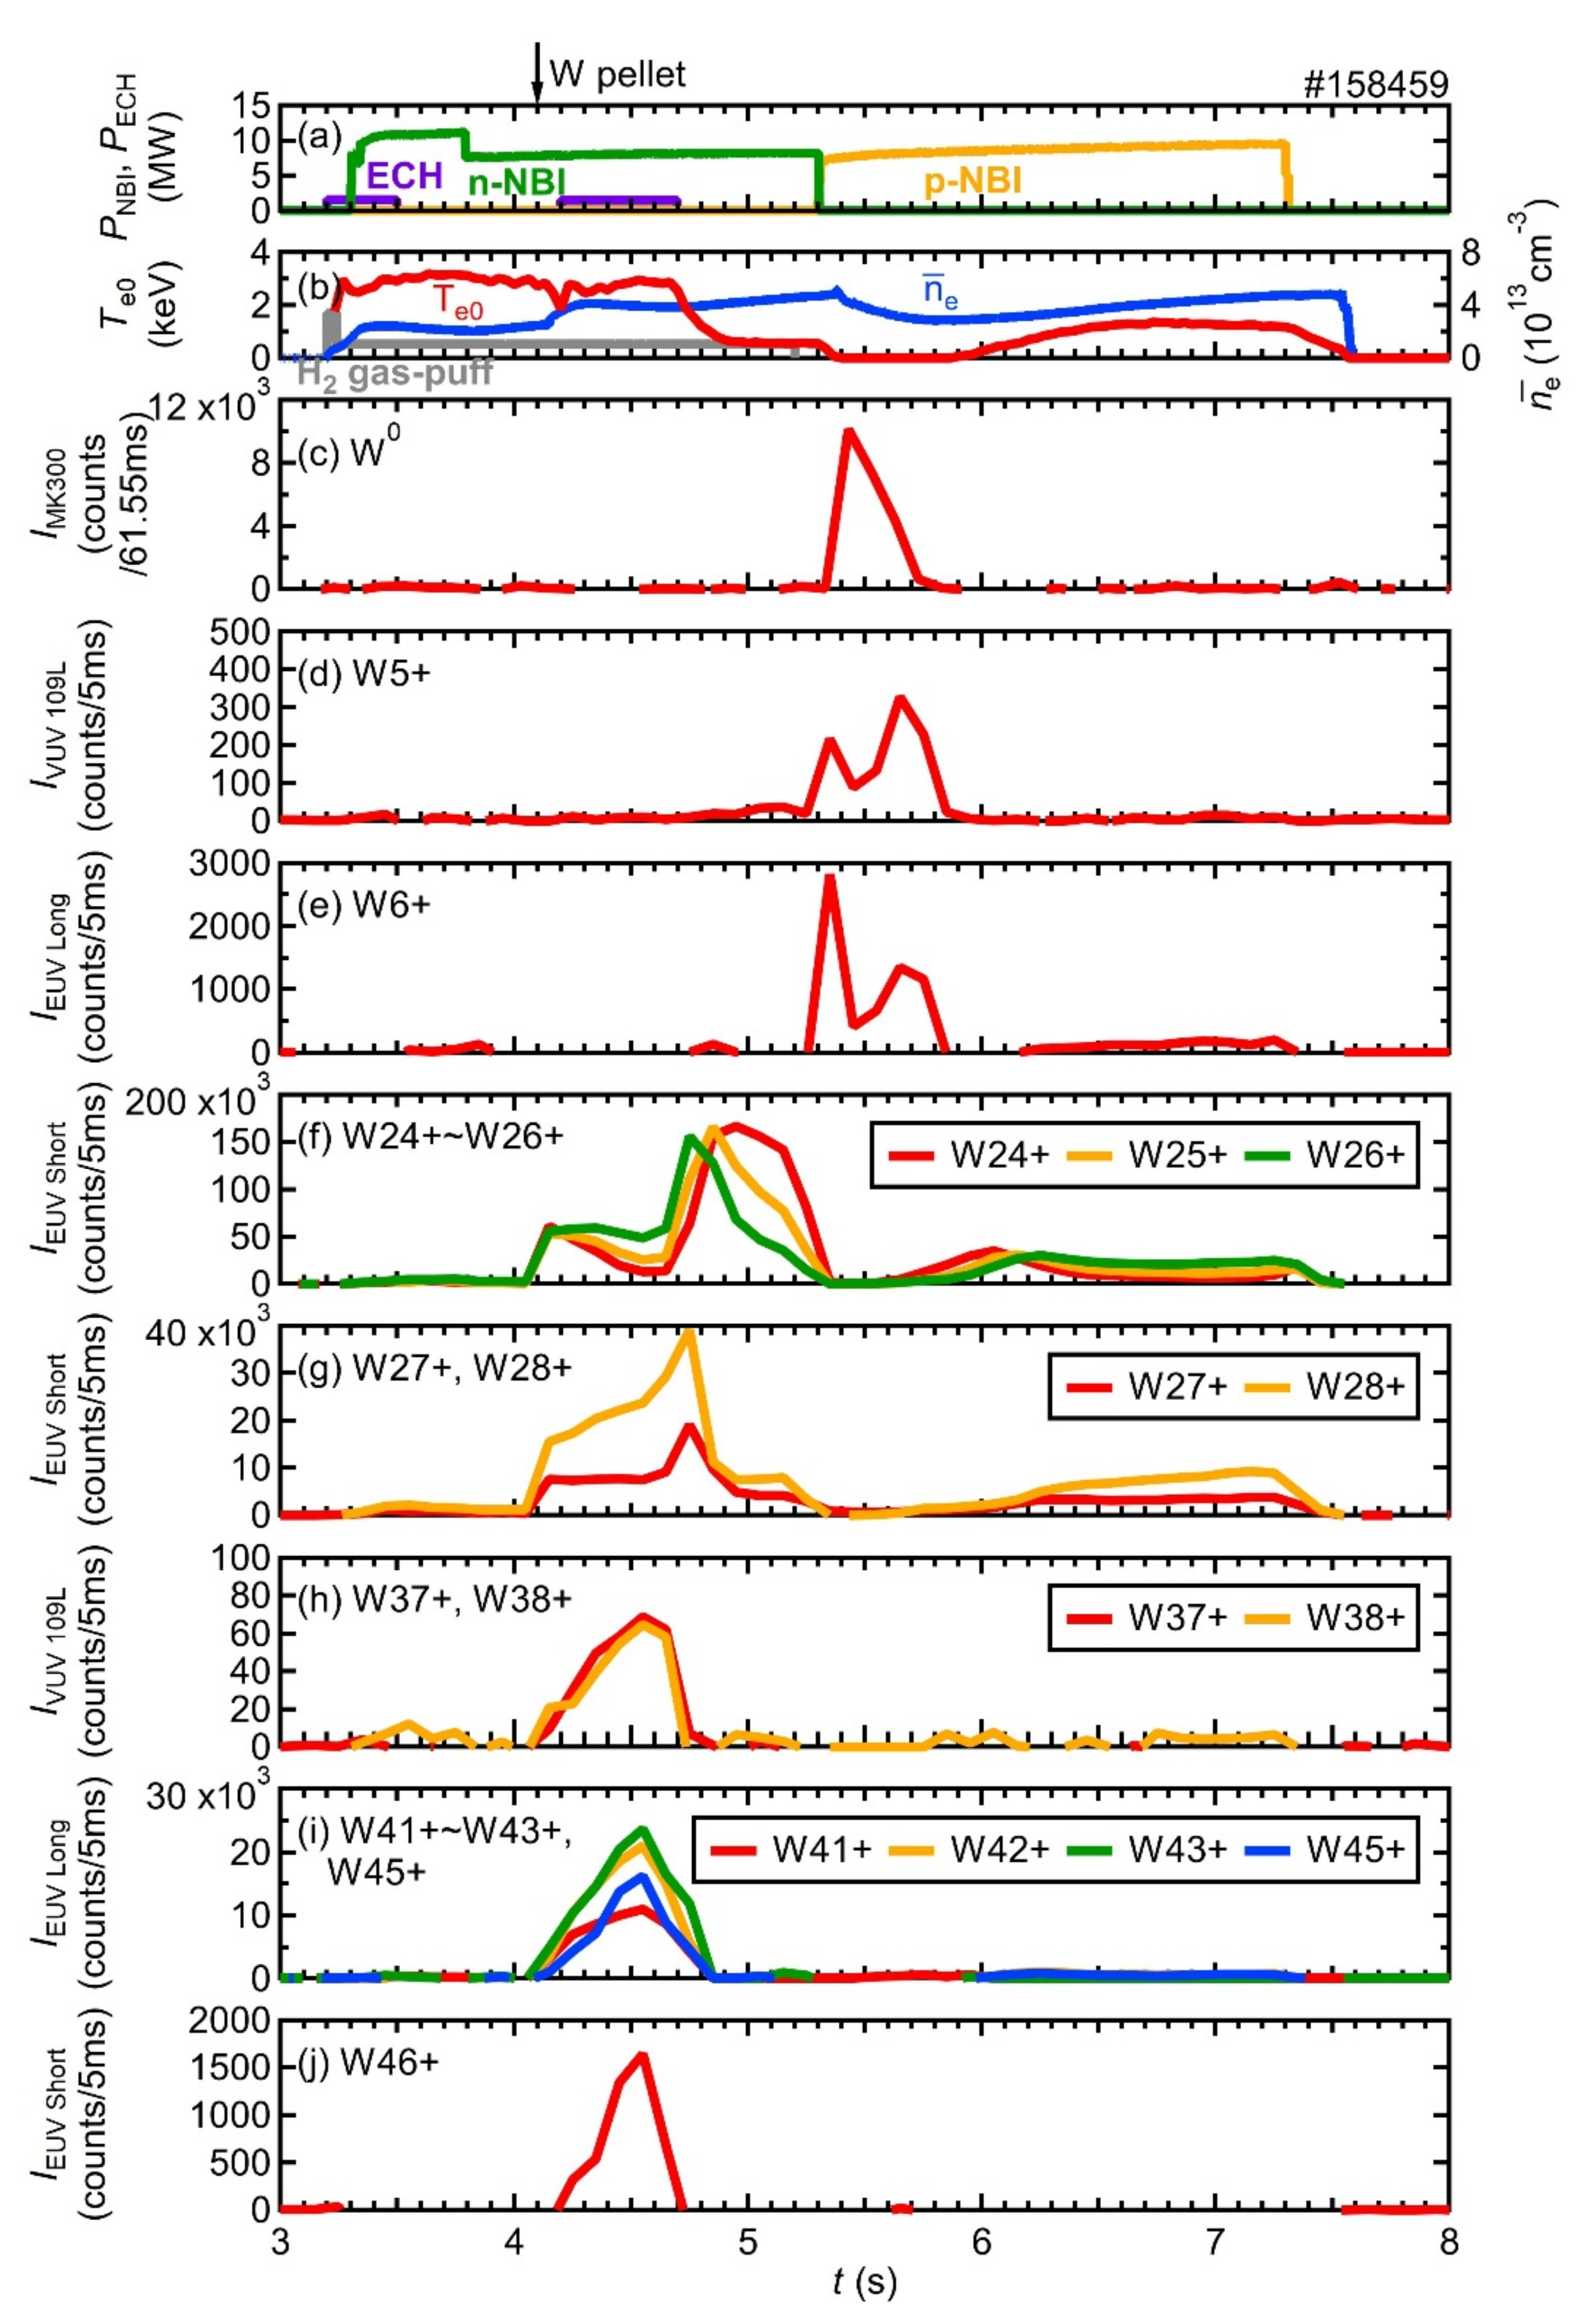
2. Tungsten Pellet Injection Experiment in LHD

LHD is a heliotron-type plasma confinement device which has the major/minor radii of 3.6/0.64 m in the standard configuration with a maximum plasma volume of 30 m3 and toroidal magnetic field of 3 T [23]. The coil system consists of a set of two continuous superconducting helical coils with a poloidal pitch number of two and a toroidal pitch number of 10 and three pairs of superconducting poloidal coils. Figure 1a illustrates the top view of the shape of the plasma in the LHD device together with schematic drawings of the neutral beam injection (NBI) for heating, the impurity pellet injection, and the spectroscopic diagnostics consisting of two flat-field grazing incidence EUV spectrometers (denoted as “EUV Short” [24] and “EUV Long” [25]), a normal incidence 20 cm VUV spectrometer (denoted as “VUV 109L” [26]), and an astigmatism-corrected Czerny–Turner-type 30 cm visible spectrometer (denoted as “MK300” [27]). Neutral hydrogen atoms are used as beam particles in the experiments presented in this paper. NBIs #1, 2, and 3, which have negative ion sources (n-NBI), are injected tangentially to the magnetic axis, while #4 and 5 with positive ion sources (p-NBI) are injected perpendicular to the magnetic axis. Tungsten ions are distributed in the NBI-heated LHD plasma by injecting a pellet consisting of a small piece of tungsten metal wire enclosed by a carbon or polyethylene pellet with the shape of a cylindrical tube [13]. Figure 1b,c illustrate the cross sections of the magnetic surfaces, where the optical axes of the VUV/EUV and visible spectroscopy systems are located, respectively, together with the field of view of each system. The EUV Short, EUV Long, and VUV 109L spectrometers cover the wavelength ranges of 5–60 Å, 100–300 Å, and 250–1050 Å, respectively. CCD detectors (1024 × 256 pixels, pixel size 26 × 26 μm2, Andor DO420-BN) are placed at the positions of the exit slits of the spectrometers. A CCD data acquisition operational mode applied in this experiment is called “full-binning” mode, in which all CCD-pixels aligned in the vertical direction are replaced by a single channel, and the vertical spatial resolution is entirely eliminated. The time resolution for the spectra measurements is 5 ms in the full-binning data acquisition mode. The MK300 visible spectrometer covers the wavelength range of 3200–3550 Å. A CCD detector (1024 × 1024 pixels, pixel size 13 × 13 μm2, Andor DU934-N) is placed at the position of the exit slit of the spectrometer and is operated in the sub-image data acquisition mode with a sampling time of 100 ms, including an exposure time of 61.55 ms. Although this spectrometer usually divides the field of view into 40 observation chords to measure the spatial distribution of the emission [28], in this paper we used the spectra obtained by integrating all 40 observation chords.
Figure 2 shows a typical waveform of the tungsten pellet injection experiment in a hydrogen discharge with the position of the magnetic axis, Rax, at 3.6 m at a toroidal magnetic field, Bt, of 2.75 T in the counter-clockwise direction. In this discharge, the length and diameter of a tungsten wire enclosed in a carbon pellet were 0.7 mm and 0.1 mm, respectively. Then, the number of tungsten atoms enclosed in a pellet, NW, was 3.5 × 10¹⁷. As shown in Figure 2a, the plasma was initiated by electron cyclotron heating (ECH), and further heated by the neutral hydrogen beams. Figure 2b–e show the central electron temperature, Te0, the line-averaged electron density, n ¯ e , the plasma stored energy, Wp, and the total radiation power, Prad, respectively. In order to obtain Te0, the electron temperature measured by Thomson scattering at the location of −0.1 < reff/a99 < 0.1 was averaged, where reff is the effective minor radius and a99 is the plasma edge, defined as the effective minor radius in which 99% of electron stored energy was enclosed [29]. After the tungsten pellet injection at 4.1 s, Te0 and Wp quickly decreased, while ne increased. ECH was superposed for 4.2–4.7 s; then, Te0 recovered up to around 3 keV. After the ECH was turned off, Te0 decreased and kept the value around 0.6 keV for 5.0–5.3 s. The NBI heating scheme was switched from the n-NBIs to p-NBIs at 5.3 s. Then, Te0 decreased down to a very low level close to zero for 5.4–5.9 s, followed by a recovery to a value of around 1.4 keV due to continuous heating by p-NBIs. In this paper, spectral data were obtained at four different timings with different Te0, namely t1 = 4.5 s (Te0 ~ 3.0 keV), t2 = 4.7 s (Te0 ~ 1.7 keV), t3 = 5.0 s (Te0 ~ 0.6 keV), and t4 = 5.6 s (Te0 ~ 0 keV), as indicated in Figure 2, to demonstrate the effect of the electron temperature on the observable charge states of the tungsten ions.
Figure 3 shows temporal evolutions of radial profiles of the electron temperature, Te, and the electron density, ne, Figure 3a,b for 4.0–4.8 s, Figure 3c,d for 5.0–5.8 s, and Figure 3e,f for 6.0–6.8 s, plotted against reff/a99. After the pellet injection at 4.1 s, Te decreased over the entire region within the plasma edge, and then recovered in the central region of the plasma at about −0.6 < reff/a99 < 0.6 due to the ECH superposition for 4.2–4.7 s, as shown in Figure 3a. ne increased after the pellet injection, keeping a flat radial profile as shown in Figure 3b. When the NBI heating scheme was switched from the n-NBIs to p-NBIs at 5.3 s, both the Te and ne profiles became extremely hollow, as shown in Figure 3c,d. In this paper, the emission spectra with the central electron temperature close to zero are presented as “the spectrum with Te0 = 0 keV”, but note that the actual emission is from the peripheral part of the plasma with a finite electron temperature, which surrounds the central part with a very low electron temperature. Thereafter, both of the central Te and ne recovered due to a continuous heating by p-NBIs, as shown in Figure 3e,f. The large variation of Te after the pellet injection as shown in Figure 2 and Figure 3 can provide us with an excellent opportunity to observe tungsten line emissions in various kinds of charge states as a function of discharge time.

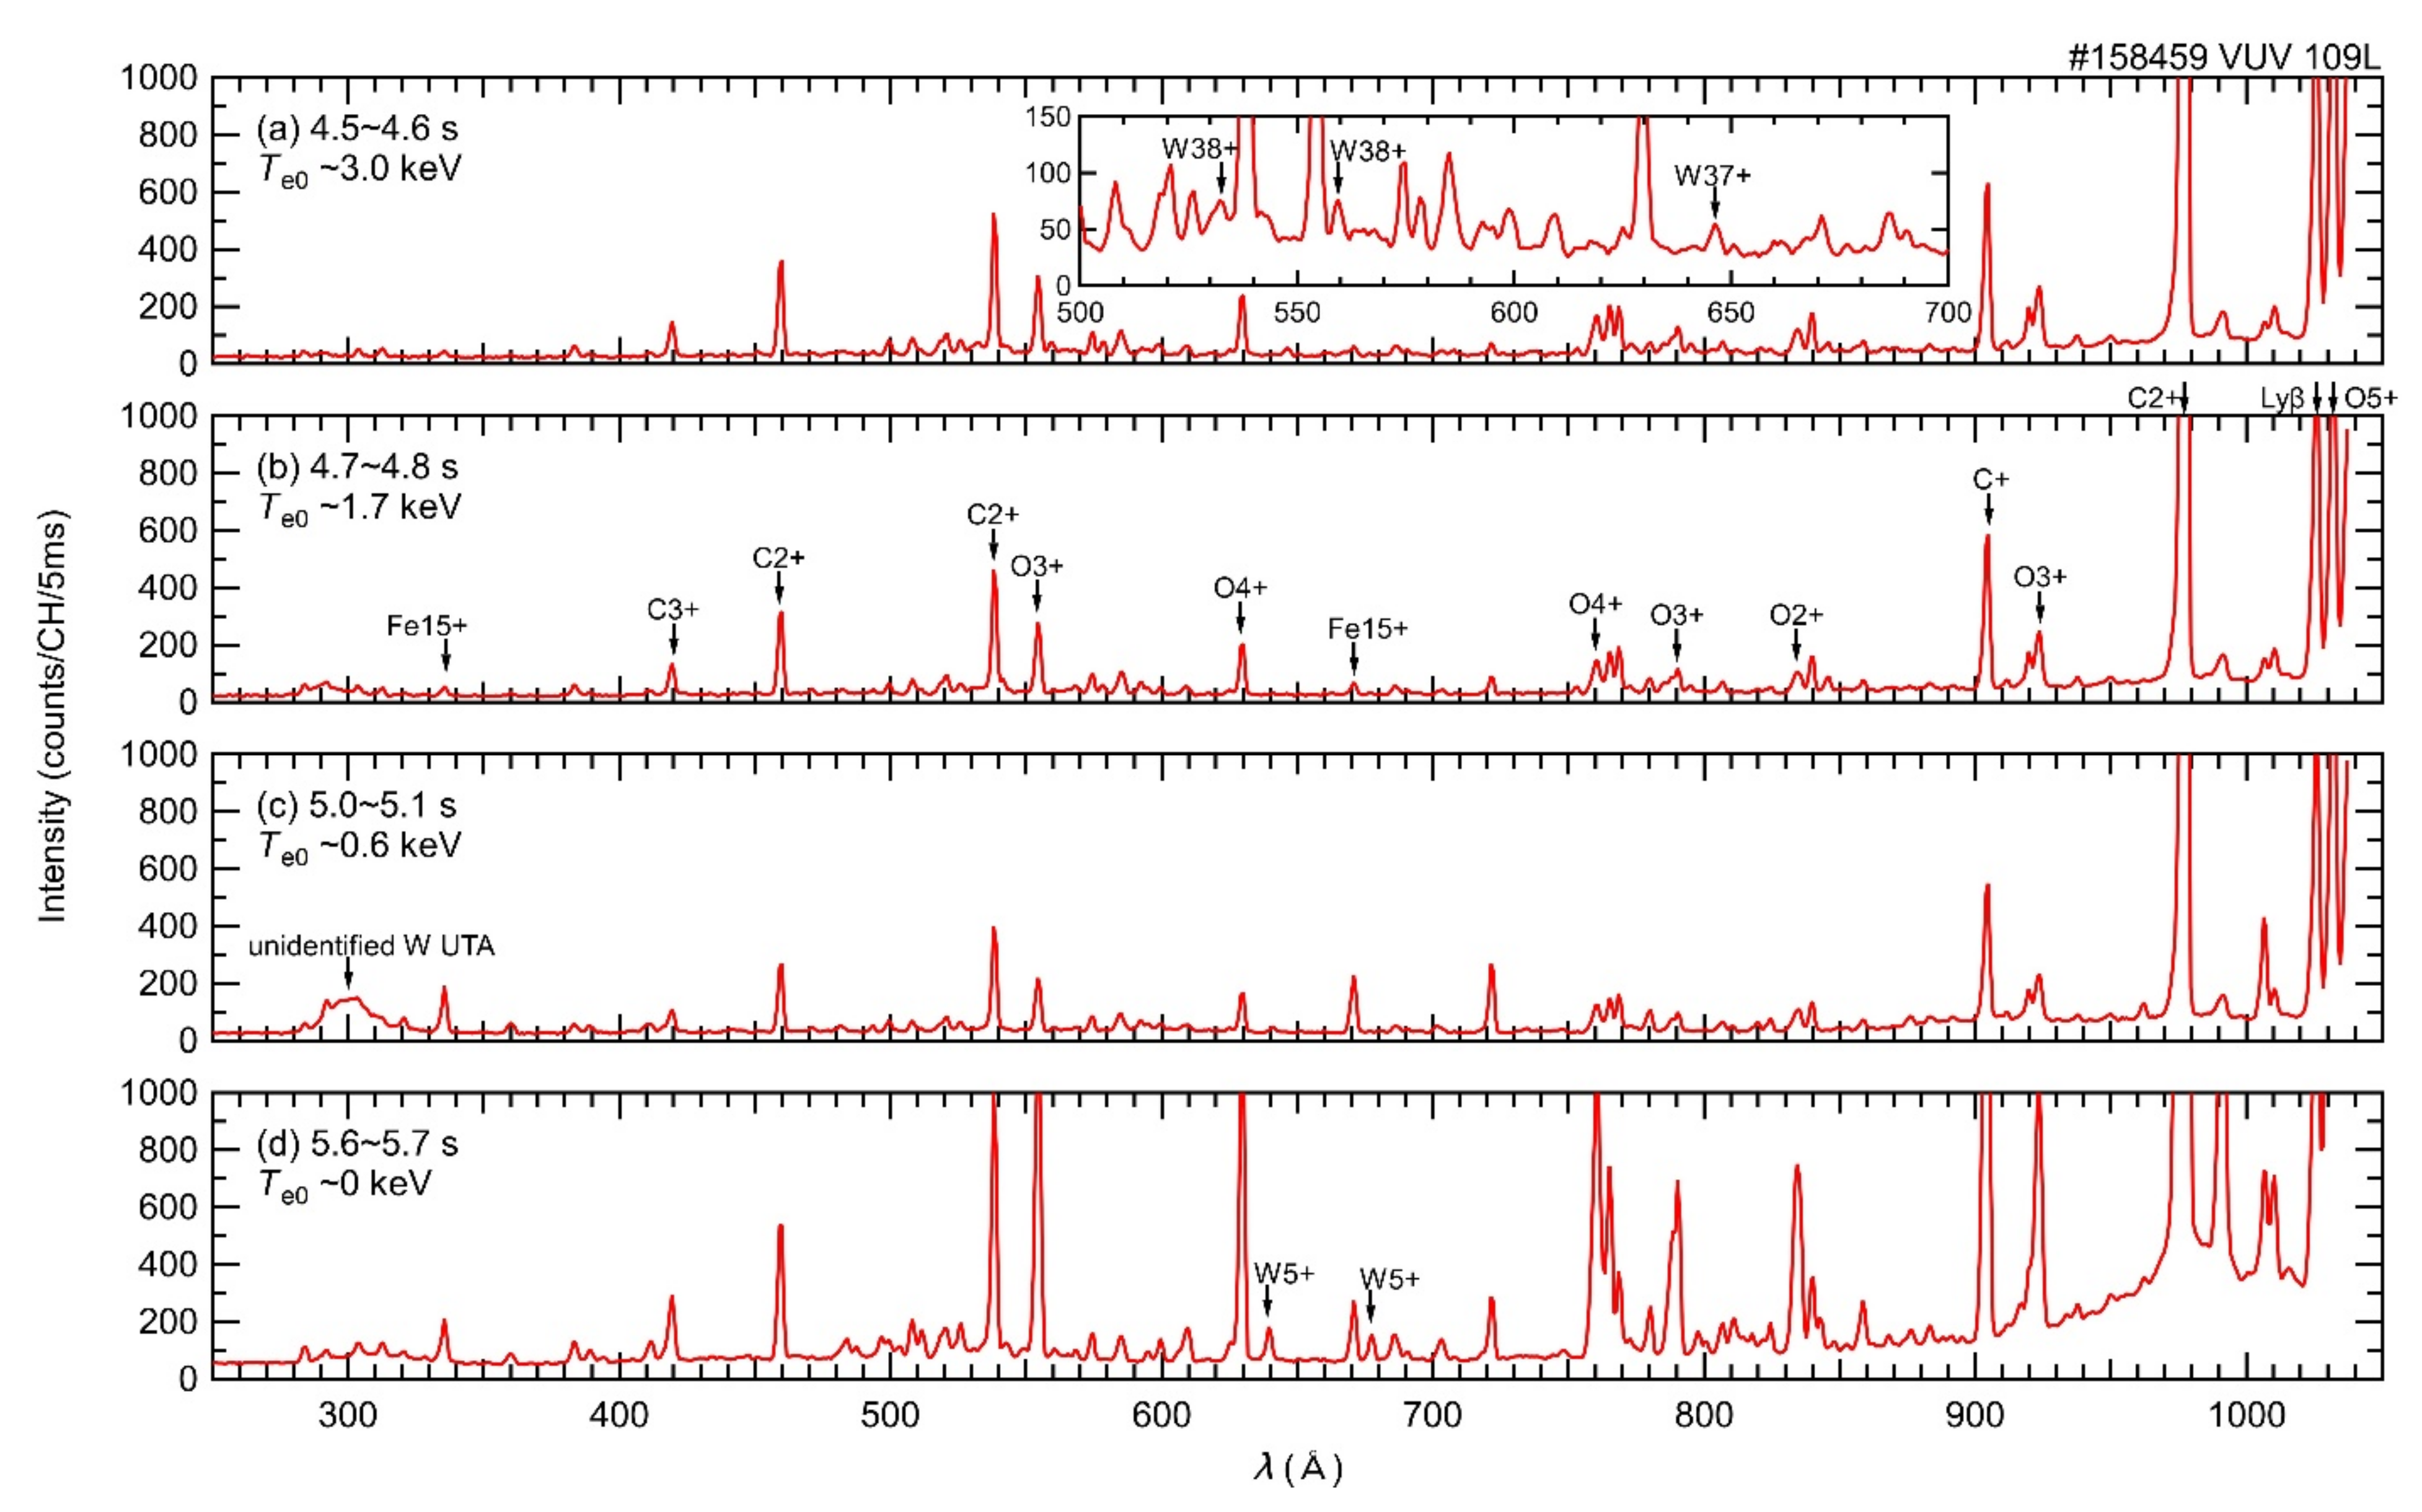
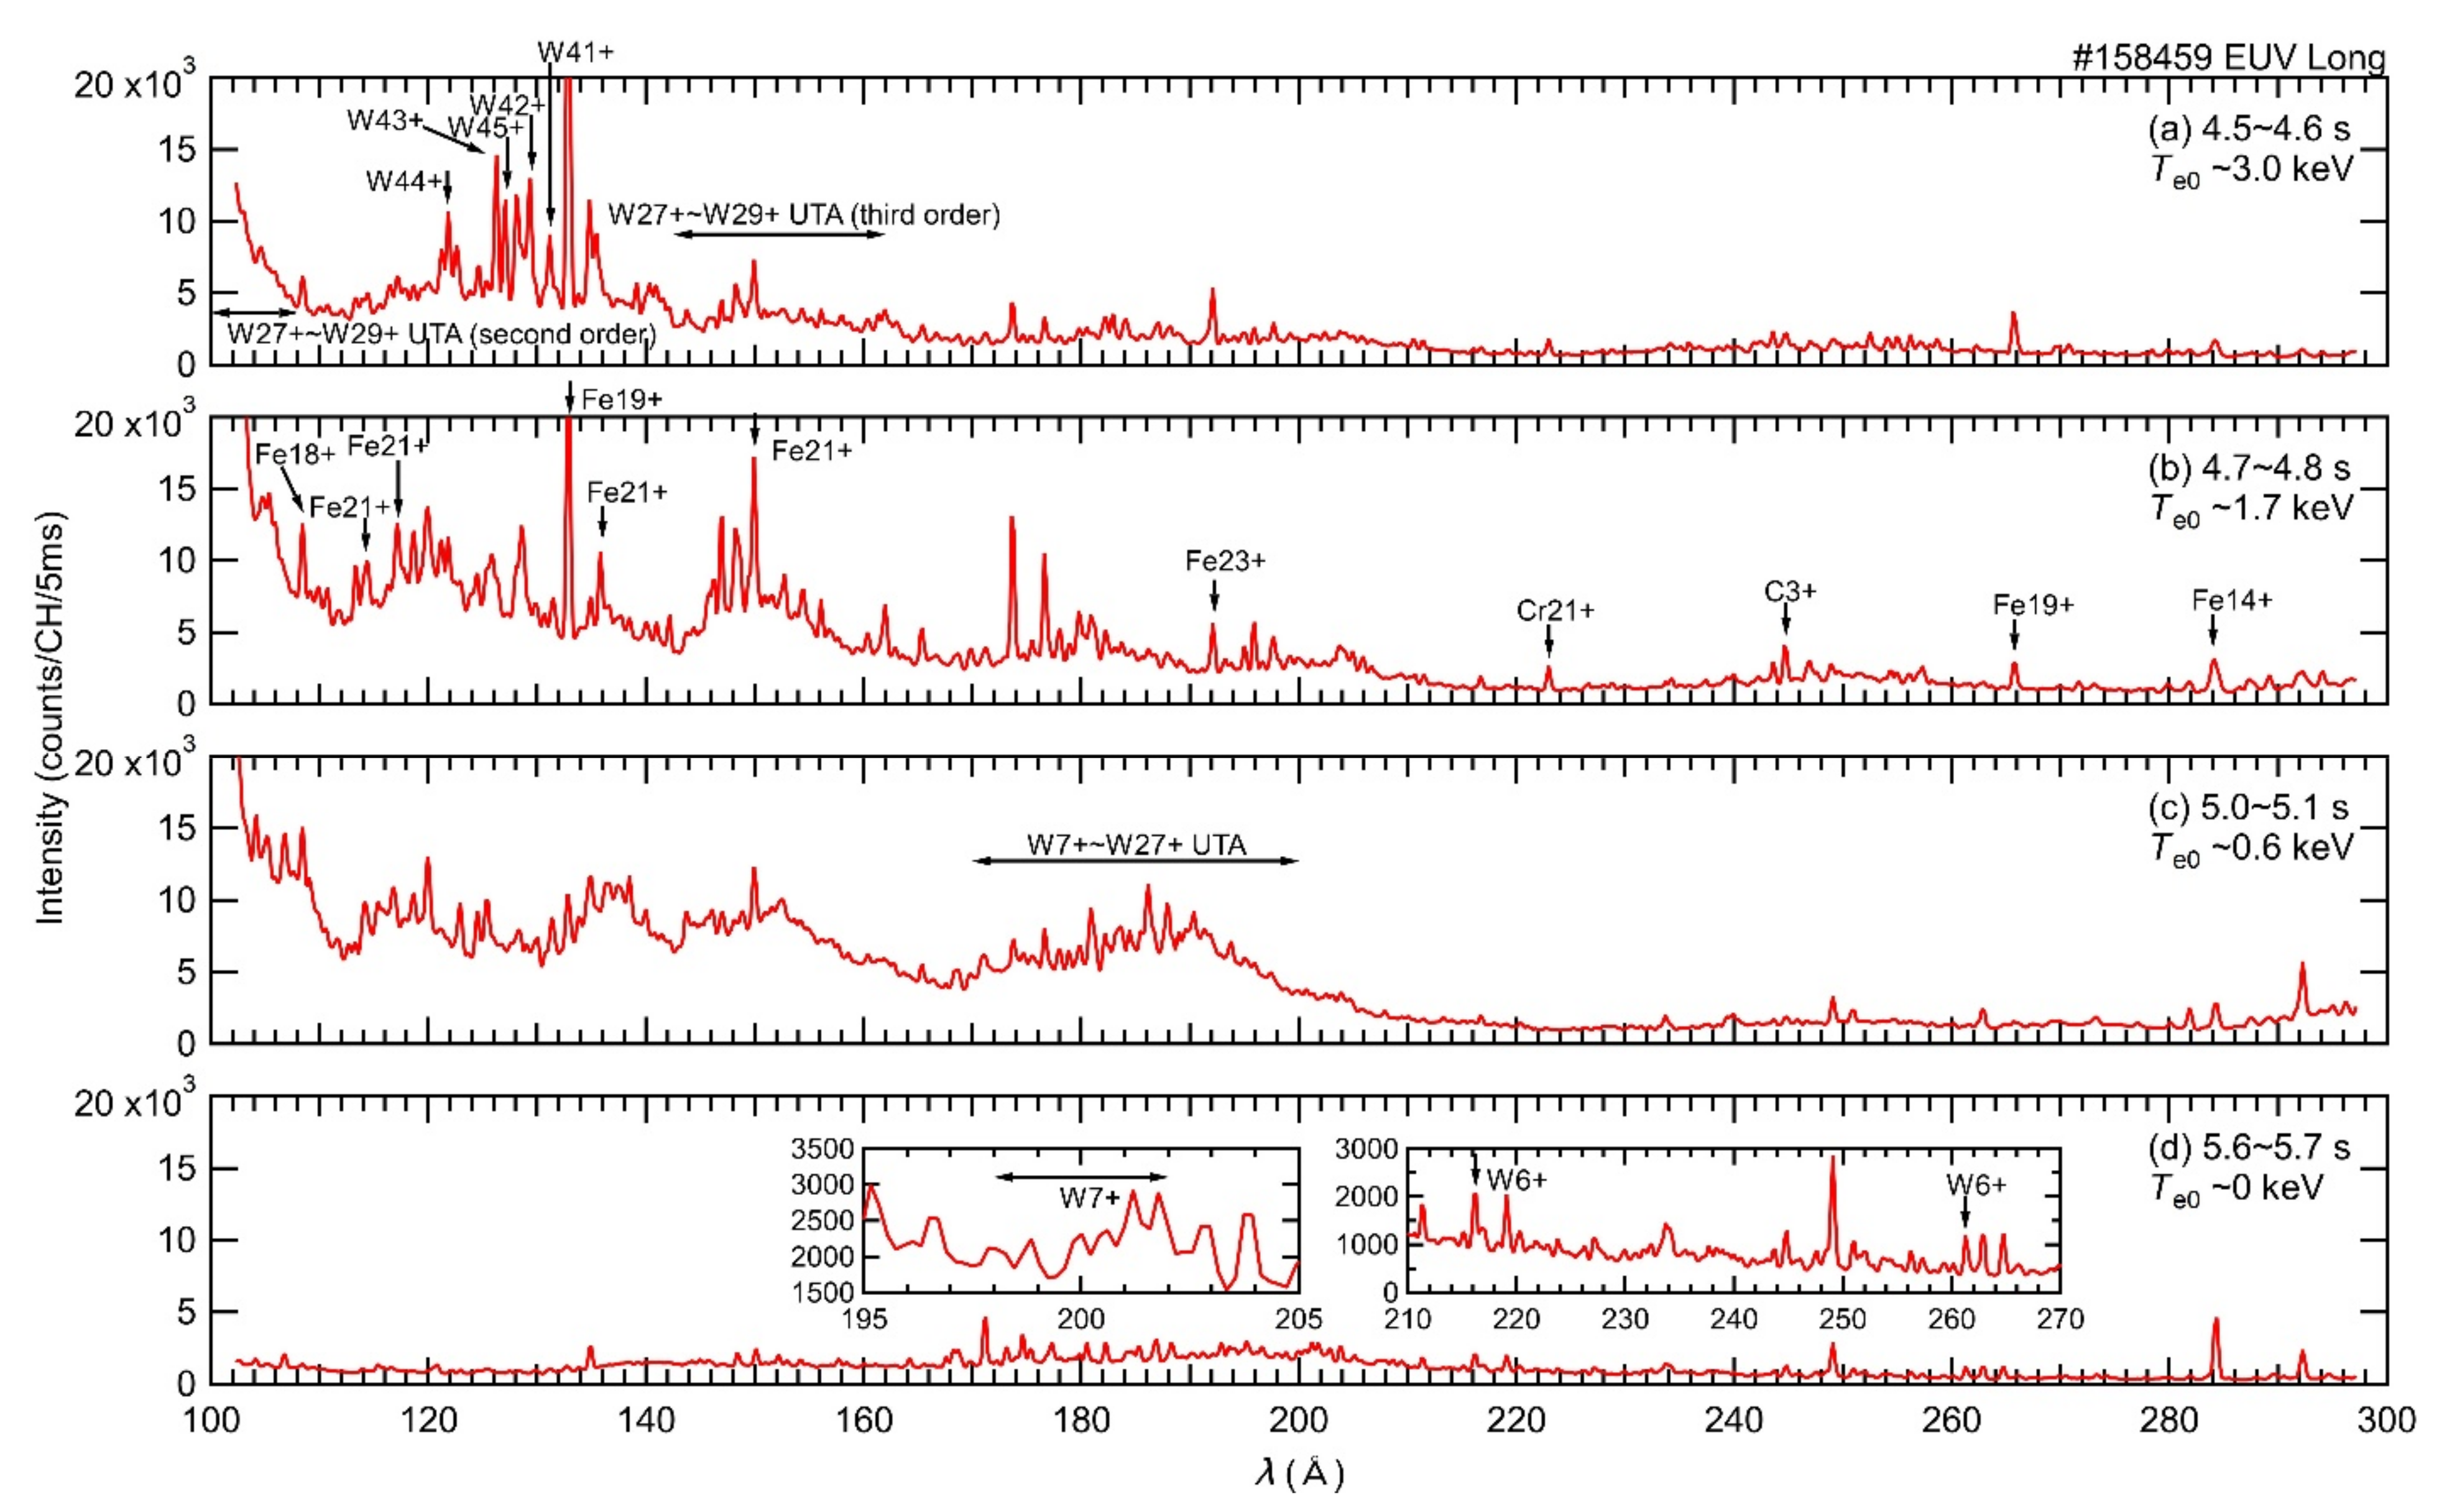
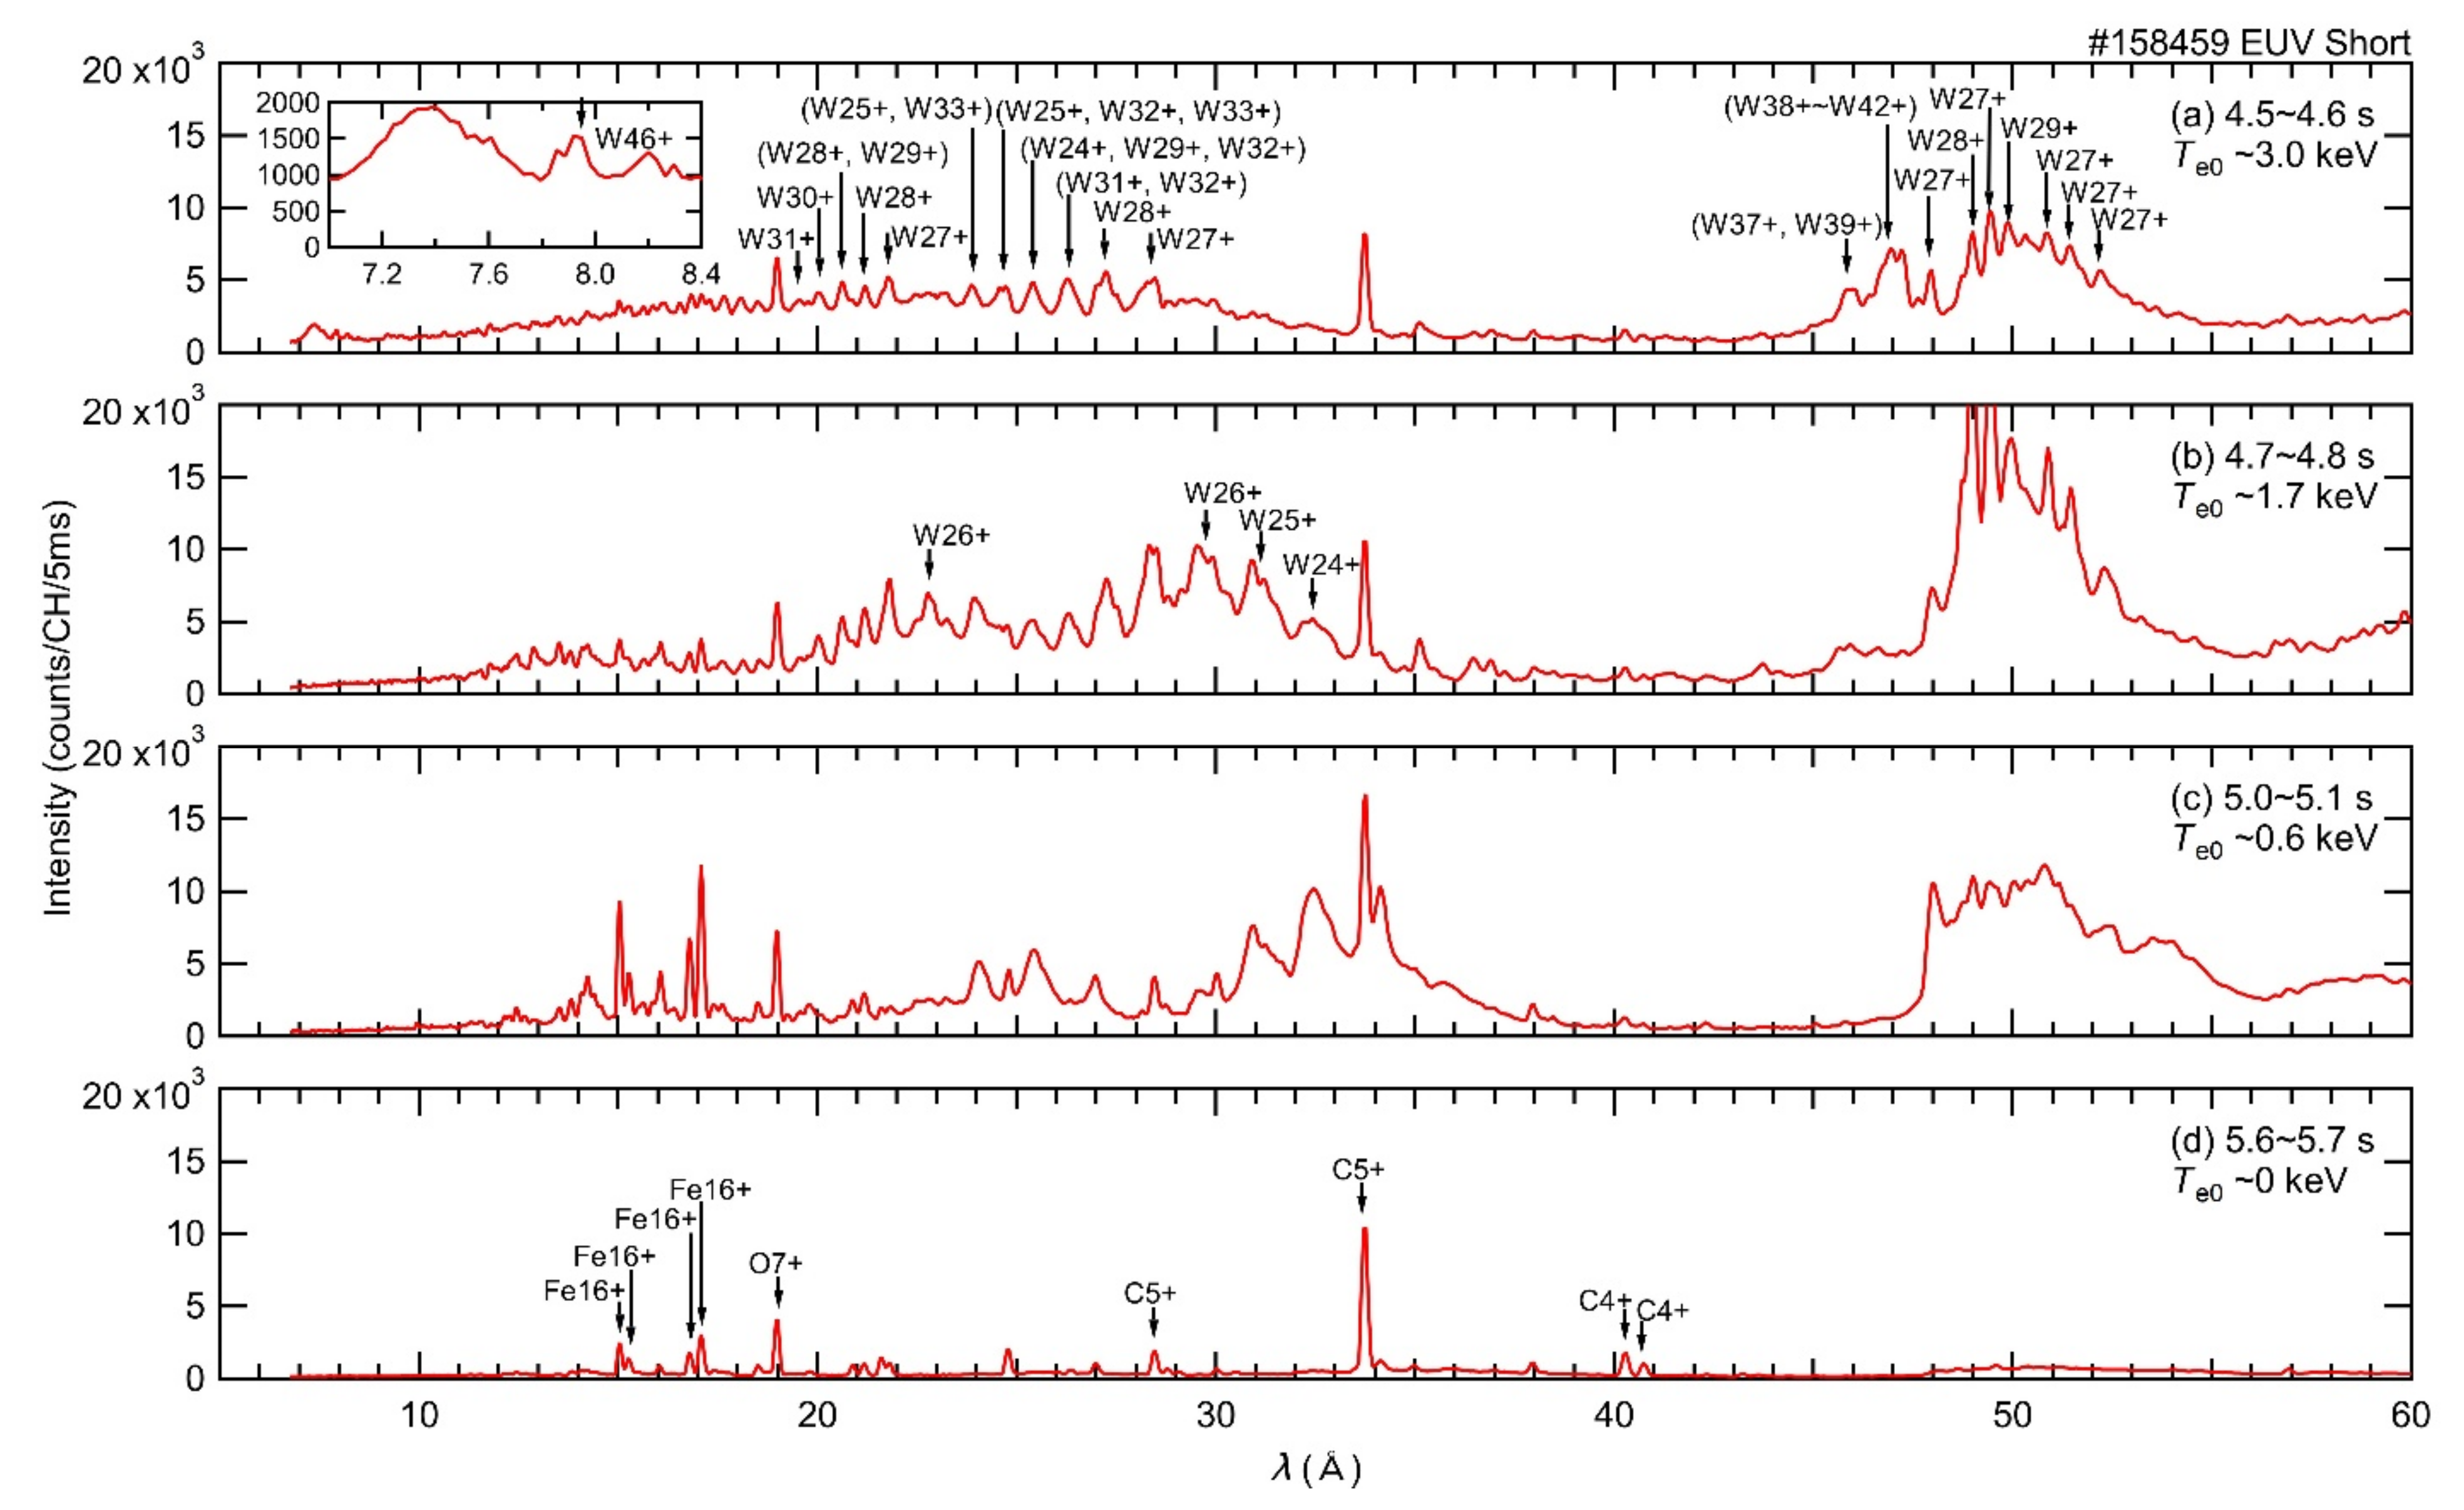
3. Tungsten Line Emissions in the Visible, VUV, and EUV Wavelength Ranges

The results of the spectroscopic observations are summarized in this section. The identifications of charge states and the transitions are taken from the NIST database [30]. Figure 4 shows visible spectra including W0, W26+, and W27+ line emissions in the wavelength range of 3200–3550 Å measured using the MK300 spectrometer. Te0 is also indicated for each timing of the data acquisition. W26+ 3337.05 Å (4d104f2 3F, J = 4 → 4d104f2 3F, J = 3), W26+ 3357.61 Å (4d104f2 3F, J = 4 → 4d104f2 1G, J = 4), and W27+ 3377.42 Å (4d104f 2F°, J = 7/2 → 4d104f 2F°, J = 5/2) were observed in the spectra with Te0 = 3.0 keV and 1.7 keV, as shown in Figure 4a,b, respectively. These W26+ and W27+ lines have already been identified as the M1 forbidden transition lines [16,17]. These lines became less significant in the spectrum with Te0 = 0.6 keV as shown in Figure 4c, and completely disappeared in the spectrum with Te0 = 0 keV as shown in Figure 4d. On the other hand, Figure 4d indicated that several W0 lines appeared at the wavelengths of 3205.54 Å, 3229.26 Å, 3346.19 Å, 3427.03 Å, and 3461.26 Å in the spectrum with Te0 = 0 keV [30].
Figure 5 shows VUV spectra, including W5+, W37+, and W38+ line emissions in the wavelength range of 250–1050 Å, measured using the VUV 109L spectrometer with Te0 for each timing of the data acquisition. W37+ 646.3 Å (4p64d 2D, J = 5/2 → 4p64d 2D, J = 3/2), W38+ 532.2 Å (4p54d (3/2, 5/2)°, J = 3 → 4p54d (3/2, 3/2)°, J = 3), and W38+ 559.3 Å (4p54d (3/2, 5/2)°, J = 3 → 4p54d (3/2, 3/2)°, J = 2) were observed in the spectrum with Te0 = 3.0 keV as shown in Figure 5a [19]. These W37+ and W38+ lines have been already identified as the M1 forbidden transition lines. These lines completely disappeared in the spectrum with Te0 = 1.7 keV, as shown in Figure 5b. In the spectrum with Te0 = 0.6 keV, a UTA-like broad peak was observed around 300 Å, as shown in Figure 5c. Identification of the charge states and the transitions of this UTA will be a subject of future studies. In the spectrum with Te0 = 0 keV, two clear peaks of W5+ emission with 6p → 5d transition were observed at 639.62 Å and 677.34 Å, as shown in Figure 5d [18,26,30].
Figure 6 shows EUV spectra, including W6+, W7+, and W41+~W45+ line emissions in the wavelength range of 100–300 Å, measured using the EUV Long spectrometer with Te0 for each timing of the data acquisition. W41+ 131.15 Å (3d104s24p3 2D°, J = 5/2 → 3d104s24p3 2D°, J = 3/2), W42+ 129.31 Å (3d104s24p2 1D, J = 2 → 3d104s24p2 3P, J = 0), W43+ 126.25 Å (3d104s24p 2P°, J = 3/2 → 3d104s24p 2P°, J = 1/2), W44+ 121.84 Å as the second order of W44+ 60.93 Å (3d104s4p (1/2,3/2)°, J = 1 → 3d104s2 1S, J = 0), and W45+ 127.06 Å (3d104p 2P°, J = 1/2 → 3d104s 2S, J = 1/2) were observed in the spectrum with Te0 = 3.0 keV, as shown in Figure 6a [20,30]. The W41+ and W43+ lines are M1 forbidden transition lines and the W42+ line is an electric-quadrupole (E2) transition. These W41+–W45+ lines completely disappeared in the spectrum with Te0 = 1.7 keV, as shown in Figure 6b. In the spectrum with Te0 = 0.6 keV, a broad UTA was observed around 170–200 Å, as shown in Figure 6c. It has already been reported that this UTA is primarily formed by n = 5 → 5 transitions of W7+–W27+ ions [31]. In the spectrum with Te0 = 0 keV, two clear peaks of W6+ emission with 5d → 5p transition were observed at 216.17 Å and 261.31 Å, as shown in Figure 6d. These lines are recognized as useful tools to evaluate tungsten influx in tokamak experiments [32]. Moreover, several small peaks were found at around 198–202 Å in Figure 6d. They are probably W7+ lines because the spectral shape is similar to that of the W7+ spectrum identified in EBIT experiments [33,34]. The emission of W7+ ions in this wavelength region has been identified in detail through vacuum spark experiments with high-resolution spectroscopic diagnostics [35,36]. The spectral identification of W7+ ions in LHD will be improved by comparing the observed peaks with these previous studies.
Figure 7 shows the EUV spectra, including W24+–W42+ UTA and W46+ line emissions in the wavelength range of 5–60 Å, measured using the EUV Short spectrometer with Te0 for each timing of the data acquisition. A W46+ emission line was observed at 7.93 Å as the highest charge state of tungsten ions in LHD in the spectrum with Te0 = 3.0 keV, as shown in Figure 7a [22]. This line is a blend of an E2 transition of W46+ at 7.928 Å (3d94s (5/2, 1/2), J = 2 → 3d10 1S, J = 0) and a magnetic-octupole (M3) transition of W46+ at 7.938 Å (3d94s (5/2, 1/2), J = 3 → 3d10 1S, J = 0). UTAs consisting of W24+–W33+ and W27+–W42+ also appeared at 19–33 Å and 46–53 Å, respectively. The identification of charge states of the UTA was performed by comparing the spectra obtained in LHD and the compact electron beam ion trap (CoBIT) with CR model calculations [11,37,38,39]. It is worth noting that the UTAs at around 50 Å have been used to evaluate tungsten ion concentrations in tokamak experiments [40]. More detailed discussion on determination of the tungsten ion density in LHD has also been provided using W24+, W25+, and W26+ peaks in the UTA [41]. The spectral shape of the UTAs depended on Te0 in such a way that the spectral structure of W37+–W42+ at 46–48 Å disappeared in the spectrum with Te0 = 1.7 keV as shown in Figure 7b, and W24+ at 32.5 Å became prominent in the spectrum with Te0 = 0.6 keV as shown in Figure 7c. Finally, no emission lines of W ions can be seen in the spectrum with Te0 = 0 keV as shown in Figure 7d.
It is worthwhile to summarize the wavelengths of the emission lines observed in this study for useful tools in future spectroscopic studies. The wavelengths of W0, W5+, W6+, W24+–W28+, W37+, W38+, and W41+–W46+ line emissions observed in this study are summarized in Table 1. The first and the second columns give the charge states and the ionization energies, IEs, respectively. The third and the fourth columns give the wavelengths of line emissions from the NIST database, λNIST, and the present observation, λobs, respectively. A discrepancy between λNIST and λobs is shown in the fifth column. The lower- and upper-level configurations from the NIST database are given in the sixth and the seventh columns, respectively. The eighth column gives remarks on the blended lines, the unresolved transition arrays (UTAs), or the transition types for forbidden lines. References for the line identifications or the previous observations are given in the ninth column. If no adequate item is registered in the NIST database, “-“ is indicated.
As an example of an application of the summarized wavelengths, the temporal variation of emission of each charge state during the discharge is demonstrated. Figure 8 shows the temporal evolution of: Figure 8a, the heating power of ECH, n-NBI, and p-NBI, Figure 8b, the central electron temperature and line-averaged electron density, W0–W46+ intensities integrated over the wavelength ranges of Figure 8c, 3426.2–3427.9 Å for W0, Figure 8d 637.8–641.2 Å for W5+, Figure 8e 261.0–261.5 Å for W6+, Figure 8f 32.15–32.30 Å for W24+, 30.73–31.69 Å for W25+, 29.29–30.40 Å for W26+, Figure 8g 28.58–28.69 Å for W27+, 27.35–27.78 Å for W28+, Figure 8h 645.3–647.1 Å for W37+, 558.6–560.3 Å for W38+, Figure 8i 131.0–131.3 Å for W41+, 129.2–129.5 Å for W42+, 126.1–126.5 Å for W43+, 126.9–127.3 Å for W45+, and Figure 8j 7.89–7.95 Å for W46+. The vertical axes in Figure 8c–j show the number of counts detected by the CCD, and the corresponding spectrometer is indicated by subscripts such as “IMK300”, “IVUV 109L”, “IEUV Long”, and “IEUV Short”. The signal levels in neighboring wavelength ranges with no significant line emissions were subtracted from the tungsten line intensities as background levels mainly consisting of bremsstrahlung emissions.
As shown in the figure, the emissions from medium charge states of W24+–W28+ first appeared just after the pellet injection at 4.1 s. As Te0 increased from 2 to 3 keV by the superposition of ECH from 4.2 to 4.7 s, W24+–W26+ decreased while W37+, W38+, and W41+–W46+ increased. After the termination of ECH superposition at 4.7 s, W37+, W38+, and W41+–W46+ suddenly disappeared, while W24+–W28+ recovered for some time and then began to decrease as Te0 decreased from 3.0 to 0.6 keV. When the NBI heating was switched from n-NBIs to p-NBIs at 5.3 s and Te0 approached 0 keV, W5+ and W6+ appeared first, then W0 became dominant; subsequently W0 decreased and W5+ and W6+ increased. Since the heating by the p-NBIs continued until the end of the discharge, W5+ and W6+ disappeared and W24+–W28+ appeared sequentially as Te0 recovered up to 1.4 keV. It has been clearly demonstrated that the dominant charge state varied sequentially, together with Te0, which is a reasonable relationship between the electron temperature and the ionization energy. This is progress toward comprehensive understanding of the behavior of tungsten impurities in plasmas, but on the other hand, spectroscopic data from W10+ to W20+ are extremely insufficient. It is our future task to measure these charge regions for further understanding.

4. Summary

Spectroscopic studies of emissions released from tungsten ions have been conducted in LHD for contribution to the tungsten transport study in tungsten divertor fusion devices and for expansion of the experimental database of tungsten line emissions. Tungsten ions have been distributed in the LHD plasma by injecting a pellet consisting of a small piece of tungsten metal wire enclosed by a carbon tube. Wavelengths of W0, W5+, W6+, W24+–W28+, W37+, W38+, and W41+–W46+ line emissions observed in the visible, VUV, and EUV wavelength ranges have been summarized. The temporal evolution of line emissions from these charge states has been compared for comprehensive understanding of tungsten impurity behavior in a single discharge. The charge distribution of tungsten ions strongly depends on electron temperature. Measurements of emissions from W10+ to W20+ are still insufficient, which is a subject for future research.

Author Contributions

Conceptualization, T.O. and S.M.; methodology, T.O. and S.M.; software, T.O.; validation, T.O.; formal analysis, T.O.; investigation, T.O., S.M., D.K., I.M., H.A.S., Y.K., T.K. and M.G.; resources, T.O., Y.K., T.K. and M.G.; data curation, T.O., Y.K., T.K. and M.G.; writing—original draft preparation, T.O.; writing—review and editing, S.M., I.M. and M.G.; visualization, T.O.; supervision, S.M. and I.M.; project administration, S.M. and I.M.; funding acquisition, T.O., Y.K. and M.G. All authors have read and agreed to the published version of the manuscript.

Funding

This work was partially supported by JSPS KAKENHI grant numbers 17K14426 and 20K03896.

Data Availability Statement

Data are available on request.

Acknowledgments

The authors thank all the members of the LHD team for their cooperation with the LHD operation.

Conflicts of Interest

The authors declare no conflict of interest.

References

  1. ITER Physics Basis Editors; ITER Physics Expert Group Chairs and Co-Chairs; ITER Joint Central Team and Physics Integration Unit. Chapter 1: Overview and summary. Nucl. Fusion 1999, 39, 2137–2174. [Google Scholar] [CrossRef]
  2. Neu, R.; Dux, R.; Kallenbach, A.; Pütterich, T.; Balden, M.; Fuchs, J.C.; Herrmann, A.; Maggi, C.F.; O’Mullane, M.; Pugno, R.; et al. Tungsten: An option for divertor and main chamber plasma facing components in future fusion devices. Nucl. Fusion 2005, 45, 209–218. [Google Scholar] [CrossRef]
  3. Roth, J.; Tsitrone, E.; Loarer, T.; Philipps, V.; Brezinsek, S.; Loarte, A.; Counsell, G.F.; Doerner, R.P.; Schmid, K.; Ogorodnikova, O.V.; et al. Tritium inventory in ITER plasma-facing materials and tritium removal procedures. Plasma Phys. Control. Fusion 2008, 50, 103001. [Google Scholar] [CrossRef]
  4. Kramida, A.E.; Shirai, T. Energy levels and spectral lines of tungsten, W III through W LXXIV. At. Data Nucl. Data Tables 2009, 95, 305–474. [Google Scholar] [CrossRef]
  5. Clementson, J.; Beiersdorfer, P. Wavelength measurement of n = 3 to n = 3 transitions in highly charged tungsten ions. Phys. Rev. A 2010, 81, 52509. [Google Scholar] [CrossRef]
  6. Podpaly, Y.; Clementson, J.; Beiersdorfer, P.; Williamson, J.; Brown, G.V.; Gu, M.F. Spectroscopy of 2s1/2−2p3/2 transitions in W65+ through W71+. Phys. Rev. A 2009, 80, 52504. [Google Scholar] [CrossRef]
  7. Ralchenko, Y.; Reader, J.; Pomeroy, J.M.; Tan, J.N.; Gillaspy, J.D. Spectra ofW39+–W47+ in the 12–20 nm region observed with an EBIT light source. J. Phys. B At. Mol. Opt. Phys. 2007, 40, 3861–3875. [Google Scholar] [CrossRef] [Green Version]
  8. Yanagibayashi, J.; Nakano, T.; Iwamae, A.; Kubo, H.; Hasuo, M.; Itami, K. Highly charged tungsten spectra observed from JT-60U plasmas at Te ≈ 8 and 14 keV. J. Phys. B At. Mol. Opt. Phys. 2010, 43, 144013. [Google Scholar] [CrossRef]
  9. Pütterich, T.; Neu, R.; Dux, R.; Whiteford, A.D.; O’Mullane, M.G.; the ASDEX Upgrade Team. Modelling of measured tungsten spectra from ASDEX Upgrade and predictions for ITER. Plasma Phys. Control. Fusion 2008, 50, 85016. [Google Scholar] [CrossRef] [Green Version]
  10. Pütterich, T.; Neu, R.; Biedermann, C.; Radtke1, R.; ASDEX Upgrade Team. Disentangling the emissions of highly ionized tungsten in the range 4–14 nm. J. Phys. B At. Mol. Opt. Phys. 2005, 38, 3071–3082. [Google Scholar] [CrossRef]
  11. Morita, S.; Dong, C.F.; Goto, M.; Kato, D.; Murakami, I.; Sakaue, H.A.; Hasuo, M.; Koike, F.; Nakamura, N.; Oishi, T.; et al. A Study of tungsten spectra using Large Helical Device and Compact Electron Beam Ion Trap in NIFS. AIP Conf. Proc. 2013, 1545, 143–152. [Google Scholar] [CrossRef]
  12. Morita, S.; Dong, C.F.; Kato, D.; Liu, Y.; Zhang, L.; Cui, Z.Y.; Goto, M.; Kawamoto, Y.; Murakami, I.; Oishi, T. Quantitative analysis on tungsten spectra of W6+ to W45+ ions. J. Phys. Conf. Ser. 2019, 1289, 12005. [Google Scholar] [CrossRef]
  13. Huang, X.L.; Morita, S.; Oishi, T.; Goto, M.; Zhang, H.M. Coaxial pellets for metallic impurity injection on the large helical device. Rev. Sci. Instrum. 2014, 85, E811–E818. [Google Scholar] [CrossRef] [PubMed]
  14. Oishi, T.; Morita, S.; Huang, X.L.; Liu, Y.; Goto, M.; The LHD Experiment Group. Response of plasmas to tungsten pellet injection in neutral beam heated discharges in Large Helical Device. Plasma Fusion Res. 2018, 13, 3402031. [Google Scholar] [CrossRef] [Green Version]
  15. Kato, D.; Goto, M.; Morita, S.; Murakami, I.; Sakaue, H.A.; Ding, X.B.; Sudo, S.; Suzuki, C.; Tamura, N.; Nakamura, N.; et al. Observation of visible forbidden lines from highly charged tungsten ions at the large helical device. Phys. Scr. 2013, T156, 14081. [Google Scholar] [CrossRef]
  16. Kato, D.; Sakaue, H.A.; Murakami, I.; Goto, M.; Oishi, T.; Fujii, K.; Nakamura, N.; Morita, S.; LHD Experiment Group. Observation of Visible Forbidden Lines of Tungsten Highly Charged Ions in LHD Core Plasmas and Its Application to Ion Distribution Analysis. Preprint: 26th IAEA Fusion Energy Conf. (2016, Kyoto) EX/P8-14. Available online: https://nucleus.iaea.org/sites/fusionportal/Shared%20Documents/FEC%202016/fec2016-preprints/preprint0240.pdf (accessed on 1 September 2021).
  17. Kato, D.; Sakaue, H.A.; Murakami, I.; Goto, M.; Oishi, T.; Tamura, N.; Funaba, H.; Morita, S. Assessment of W Density in LHD Core Plasmas Using Visible Forbidden Lines of Highly Charged W Ions. Nucl. Fusion 2021, in press. [Google Scholar] [CrossRef]
  18. Oishi, T.; Morita, S.; Huang, X.L.; Zhang, H.M.; Goto, M.; The LHD Experiment Group. Observation of W IV–W VII line emissions in wavelength range of 495–1475 Å in the large helical device. Phys. Scr. 2016, 91, 25602. [Google Scholar] [CrossRef]
  19. Oishi, T.; Morita, S.; Kato, D.; Murakami, I.; Sakaue, H.A.; Kawamoto, Y.; Goto, M.; The LHD Experiment Group. Identification of forbidden emission lines from highly ionized tungsten ions in VUV wavelength range in LHD for ITER edge plasma diagnostics. Nucl. Mater. Energy 2021, 26, 100932. [Google Scholar] [CrossRef]
  20. Liu, Y.; Morita, S.; Oishi, T.; Goto, M.; Huang, X.L. Observation of Tungsten Line Emissions inWavelength Range of 10–500 Å in Large Helical Device. Plasma Fusion Res. 2018, 13, 3402020. [Google Scholar] [CrossRef] [Green Version]
  21. Liu, Y.; Morita, S.; Huang, X.L.; Oishi, T.; Goto, M.; Zhang, H.M. Component investigation of ionization stages on tungsten unresolved transition array spectra for plasma diagnostics based on space-resolved extreme-ultra violet spectroscopy in large helical device. J. Appl. Phys. 2017, 122, 233301. [Google Scholar] [CrossRef]
  22. Oishi, T.; Morita, S.; Kato, D.; Murakami, I.; Sakaue, H.A.; Kawamoto, Y.; Goto, M. Observation of line emissions from Ni-like W46+ ions in wavelength range of 7–8 Å in the Large Helical Device. Phys. Scr. 2021, 96, 25602. [Google Scholar] [CrossRef]
  23. Takeiri, Y.; Morisaki, T.; Osakabe, M.; Yokoyama, M.; Sakakibara, S.; Takahashi, H.; Nakamura, Y.; Oishi, T.; Motojima, G.; Murakami, S.; et al. Extension of the operational regime of the LHD towards a deuterium experiment. Nucl. Fusion 2017, 57, 102023. [Google Scholar] [CrossRef]
  24. Chowdhuri, M.B.; Morita, S.; Goto, M. Characteristics of an absolutely calibrated flat-field extreme ultraviolet spectrometer in the 10–130 Å range for fusion plasma diagnostics. Appl. Opt. 2008, 47, 135–146. [Google Scholar] [CrossRef] [PubMed]
  25. Chowdhuri, M.B.; Morita, S.; Goto, M.; Nishimura, H.; Nagai, K.; Fujioka, S. Spectroscopic comparison between 1200 grooves/mm ruled and holographic gratings of a flat-field spectrometer and its absolute sensitivity calibration using bremsstrahlung continuum. Rev. Sci. Instrum. 2007, 78, 23501. [Google Scholar] [CrossRef] [PubMed]
  26. Oishi, T.; Morita, S.; Huang, X.L.; Zhang, H.M.; Goto, M.; The LHD Experiment Group. Line Spectrum of Tungsten Ions at Low Ionization Stages in Large Helical Device in Wavelength Range of 300–2400 Å Measured Using 20 cm Normal Incidence VUV Spectrometers. Plasma Fus. Res. 2015, 10, 3402031. [Google Scholar] [CrossRef] [Green Version]
  27. Zhou, H.Y.; Morita, S.; Goto, M.; Dong, C.F. Zeff profile diagnostics using visible bremsstrahlung continuum for nonaxisymmetric plasmas with finite β in large helical device. J. Appl. Phys. 2010, 107, 53306. [Google Scholar] [CrossRef]
  28. Kawamoto, Y.; Morita, S.; Goto, M.; Oishi, T. Qualitative Improvement of Zeff Diagnostic Based on Visible Bremsstrahlung Profile Measurement by Changing Observation Cross Section in LHD. Plasma Fus. Res. 2021, 16, 2402072. [Google Scholar] [CrossRef]
  29. Watanabe, K.Y.; Suzuki, Y.; Yamaguchi, T.; Narihara, K.; Tanaka, K.; Tokuzawa, T.; Yamada, I.; Sakakibara, S.; Narushima, Y.; Morisaki, T.; et al. Change of plasma boundaries due to beta in heliotron plasma with helical divertor configuration. Plasma Phys. Controlled Fusion 2007, 49, 605–618. [Google Scholar] [CrossRef]
  30. Kramida, A.; Ralchenko, Y.; Reader, J.; NIST ASD Team. NIST Atomic Spectra Database, (ver. 5.8); National Institute of Standards and Technology: Gaithersburg, MD, USA, 2020. Available online: https://physics.nist.gov/asd (accessed on 17 August 2021). [CrossRef]
  31. Suzuki, C.; Harte, C.S.; Kilbane, D.; Kato, T.; Sakaue, H.A.; Murakami, I.; Kato, D.; Sato, K.; Tamura, N.; Sudo, S.; et al. Interpretation of spectral emission in the 20 nm region from tungsten ions observed in fusion device plasmas. J. Phys. B At. Mol. Opt. Phys. 2011, 44, 175004. [Google Scholar] [CrossRef]
  32. Dong, C.F.; Morita, S.; Cui, Z.Y.; Sun, P.; Zhang, K.; Murakami, I.; Zhang, B.Y.; Yang, Z.C.; Zheng, D.L.; Feng, L.; et al. Evaluation of tungsten influx rate and study of edge tungsten behavior based on the observation of EUV line emissions from W6+ ions in HL-2A. Nucl. Fusion 2019, 59, 16020. [Google Scholar] [CrossRef]
  33. Mita, M.; Sakaue, H.A.; Kato, D.; Murakami, I.; Nakamura, N. Direct Observation of the M1 Transition between the Ground Term Fine Structure Levels of W VIII. Atoms 2017, 5, 13. [Google Scholar] [CrossRef]
  34. Clementson, J.; Lennartsson, T.; Beiersdorfer, P. Extreme ultraviolet spectra of few-times ionized tungsten for divertor plasma diagnostics. Atoms 2015, 3, 407–421. [Google Scholar] [CrossRef] [Green Version]
  35. Ryabtsev, A.; Kononov, E.; Kildiyarova, R.; Tchang-Brillet, W.-Ü.L.; Wyart, J.F.; Champion, N.; Blaess, C. Spectra of W VIII and W IX in the EUV region. Atoms 2015, 3, 273–298. [Google Scholar] [CrossRef] [Green Version]
  36. Ryabtsev, A.; Kononov, E.Y.; Kildiyarova, R.; Tchang-Brillet, W.-Ü.L.; Wyart, J.F. The spectrum of seven times ionized tungsten (W VIII) relevant to tokamak divertor plasmas. Phys. Scr. 2013, 87, 45303. [Google Scholar] [CrossRef]
  37. Sakaue, H.A.; Kato, D.; Ding, X.B.; Murakami, I.; Koike, F. Spectroscopy of highly charged tungsten ions with Electron Beam Ion Traps. AIP Conf. Proc. 2012, 1438, 91–96. [Google Scholar] [CrossRef]
  38. Murakami, I.; Sakaue, H.A.; Suzuki, C.; Kato, D.; Goto, M.; Tamura, N.; Sudo, S.; Morita, S.; LHD Experiment Group. Development of quantitative atomic modeling for tungsten transport study using LHD plasma with tungsten pellet injection. Nucl. Fusion 2015, 55, 93016. [Google Scholar] [CrossRef]
  39. Murakami, I.; Kato, D.; Oishi, T.; Goto, M.; Kawamoto, Y.; Suzuki, C.; Sakaue, H.A.; Morita, S.; LHD Experiment Group. Progress of tungsten spectral modeling for ITER edge plasma diagnostics based on tungsten spectroscopy in LHD. Nucl. Mater. Energy 2021, 26, 100923. [Google Scholar] [CrossRef]
  40. Zhang, L.; Morita, S.; Xu, Z.; Zhang, P.F.; Zang, Q.; Duan, Y.M.; Liu, H.Q.; Zhao, H.L.; Ding, F.; Ohishi, T.; et al. Suppression of tungsten accumulation during ELMy H-mode by lower hybrid wave heating in the EAST tokamak. Nucl. Mater. Energy 2017, 12, 774–778. [Google Scholar] [CrossRef]
  41. Liu, Y.; Morita, S.; Murakami, I.; Oishi, T.; Goto, M.; Huang, X.L. Density evaluation of tungsten W24+, W25+, and W26+ ions using unresolved transition array at 27–34 Å in Large Helical Device. Jpn. J. Appl. Phys. 2018, 57, 106101. [Google Scholar] [CrossRef]
Figure 1. (a) Top view of shape of plasma in LHD device together with schematic drawings of neutral beam injection (NBI) for heating, spectroscopic diagnostics, and impurity pellet injection. Cross sections of magnetic surfaces where optical axes of (b) VUV/EUV and (c) visible spectroscopy systems are located, respectively, together with viewing angle of each system.
Atoms 09 00069 g001
Figure 2. Typical waveform of W pellet injection experiment in LHD: (a) heating power of ECH, n-NBI, and p-NBI, (b) central electron temperature, (c) line-averaged electron density, (d) plasma stored energy, and (e) total radiation power. Four timings of data acquisition, t1 = 4.5 s, t2 = 4.7 s, t3 = 5.0 s, and t4 = 5.6 s are indicated together.
Atoms 09 00069 g002
Figure 3. Temporal evolutions of radial profiles of electron temperature, Te, and electron density, ne, (a,b) for 4.0–4.8 s, (c,d) for 5.0–5.8 s, and (e,f) for 6.0–6.8 s plotted against effective minor radius, reff, normalized by a99. Locations of reff/a99 = ±1 are plasma edges.
Atoms 09 00069 g003
Figure 4. Visible spectra including W0, W26+, and W27+ line emissions in the wavelength range of 3200–3550 Å measured using “MK300” spectrometer. Central electron temperature, Te0, is also indicated for each timing of data acquisition. (a) 4.5~4.56155 s, Te0~3.0 keV, (b) 4.7~4.76155 s, Te0~1.7 keV, (c) 5.0~5.06155 s, Te0~0.6 keV, (d) 5.6~5.66155 s, Te0~0 keV.
Atoms 09 00069 g004
Figure 5. VUV spectra including W5+, W37+, and W38+ line emissions in the wavelength range of 250–1050 Å measured using “VUV 109L” spectrometer with Te0 for each timing of data acquisition. (a) 4.5~4.6 s, Te0~3.0 keV, (b) 4.7~4.8 s, Te0~1.7 keV, (c) 5.0~5.1 s, Te0~0.6 keV, (d) 5.6~5.7 s, Te0~0 keV.
Atoms 09 00069 g005
Figure 6. EUV spectra including W6+, W7+, and W41+–W45+ line emissions in the wavelength range of 100–300 Å measured using “EUV Long” spectrometer with Te0 for each timing of data acquisition. (a) 4.5~4.6 s, Te0~3.0 keV, (b) 4.7~4.8 s, Te0~1.7 keV, (c) 5.0~5.1 s, Te0~0.6 keV, (d) 5.6~5.7 s, Te0~0 keV.
Atoms 09 00069 g006
Figure 7. EUV spectra including W24+–W42+ UTA and W46+ line emissions in the wavelength range of 5–60 Å measured using “EUV Short” spectrometer with Te0 for each timing of data acquisition. (a) 4.5~4.6 s, Te0~3.0 keV, (b) 4.7~4.8 s, Te0~1.7 keV, (c) 5.0~5.1 s, Te0~0.6 keV, (d) 5.6~5.7 s, Te0~0 keV.
Atoms 09 00069 g007
Figure 8. Temporal evolution of (a) heating power of ECH, n-NBI, and p-NBI, (b) central electron temperature and line-averaged electron density, and W0–W46+ intensities integrated over wavelength ranges of (c) 3426.2–3427.9 Å for W0, (d) 637.8–641.2 Å for W5+, (e) 261.0–261.5 Å for W6+, (f) 32.15–32.30 Å for W24+, 30.73–31.69 Å for W25+, 29.29–30.40 Å for W26+, (g) 28.58–28.69 Å for W27+, 27.35–27.78 Å for W28+, (h) 645.3–647.1 Å for W37+, 558.6–560.3 Å for W38+, (i) 131.0–131.3 Å for W41+, 129.2–129.5 Å for W42+, 126.1–126.5 Å for W43+, 126.9–127.3 Å for W45+, and (j) 7.89–7.95 Å for W46+.
Atoms 09 00069 g008
Table 1. Wavelength list of W0, W5+, W6+, W24+–W28+, W37+, W38+, and W41+–W46+ line emissions observed in this study.
Wq+IE (eV)λNIST (Å)λobs (Å)λNISTλobs (Å)Lower-Level Configuration,
Term, J
Upper-Level Configuration,
Term, J
RemarksReferences
W07.93205.503205.54 ± 0.06−0.045d46s2,
3D, 1
- [30]
W07.93229.233229.26 ± 0.07−0.035d5(4D)6s,
5D, 2
- [30]
W07.93346.113346.19 ± 0.06−0.085d5(6D)6s,
7S, 3
5d46s(6D)6p,
5D°, 4
[30]
W07.93426.883427.03 ± 0.06-5d46s2,
3D, 1
-blended[30]
3427.725d46s2,
3G, 3
W07.93461.363461.26 ± 0.060.15d5(4G)6s,
5G, 4
- [30]
W5+64.8639.68639.62 ± 0.090.065s25p65d,
2D, 5/2
5s25p66p,
2P°, 3/2
[18,26,30]
W5+64.8677.72677.34 ± 0.080.385s25p65d,
2D, 3/2
5s25p66p,
2P°, 1/2
[18,26,30]
W6+122.0216.22216.17 ± 0.060.055s25p6,
1S, 0
5s25p5(21/2)5d,
(1/2,3/2)°, 1
[30,32]
W6+122.0261.39261.31 ± 0.060.085s25p6,
1S, 0
5s25p5(23/2)5d,
(3/2,5/2)°, 1
[30,32]
W24+734.1-~27.3---UTA[11,21,37,38,39,41]
W25+784.1-~28.4---UTA[11,21,37,38,39,41]
W26+833.4-~29.7---UTA[11,21,37,38,39,41]
W26+833.4-3337.05 ± 0.09-4d104f2,
3F, 3
4d104f2,
3F, 4
M1[16,17]
W26+833.4-3357.61 ± 0.08-4d104f2,
1G, 4
4d104f2,
3F, 4
M1[16,17]
W27+881.4-~31.0---UTA[11,21,37,38,39]
W27+881.4-3377.42 ± 0.06-4d104f,
2F°, 5/2
4d104f,
2F°, 7/2
M1[16,17]
W28+1132.2-~32.5---UTA[11,21,37,38,39]
W37+1621.7646.7646.3 ± 0.10.44p64d,
2D, 3/2
4p64d,
2D, 5/2
M1[19,30]
W38+1829.8532.9532.2 ± 0.20.74p5(23/2)4d,
(3/2, 3/2)°, 3
4p5(23/2)4d,
(3/2, 5/2)°, 3
M1[19,30]
W38+1829.8559.1559.3 ± 0.1−0.24p5(23/2)4d,
(3/2, 3/2)°, 2
4p5(23/2)4d,
(3/2, 5/2)°, 3
M1[19,30]
W41+1994.8131.22131.15 ± 0.060.073d104s24p3,
2D°, 3/2
3d104s24p3,
2D°, 5/2
M1[20,30]
W42+2149.1129.41129.31 ± 0.060.103d104s24p2,
3P, 0
3d104s24p2,
1D, 2
E2[20,30]
W43+2210.0126.29126.25 ± 0.060.043d104s24p,
2P°, 1/2
3d104s24p,
2P°, 3/2
M1[20,30]
W44+2354.560.93 × 2121.84 ± 0.060.023d104s2,
1S, 0
3d104s4p,
(1/2,3/2)°, 1
second order[11,20,30]
W45+2414.1127.00127.06 ± 0.06−0.063d104s,
2S, 1/2
3d104p,
2P°, 1/2
[20,30]
W46+40577.9287.93 ± 0.02-3d10,
1S, 0
3d94s,
(5/2,1/2), 2
E2 + M3 blended[22,30]
7.9383d10,
1S, 0
3d94s,
(5/2,1/2), 3
Publisher’s Note: MDPI stays neutral with regard to jurisdictional claims in published maps and institutional affiliations.

