
Extreme-Ultraviolet Beam-Foil Spectra of Na through Cl


Ruhr-Universität Bochum, Fakultät für Physik und Astronomie, AIRUB, 44780 Bochum, Germany
Atoms 2021, 9(4), 93; https://0-doi-org.brum.beds.ac.uk/10.3390/atoms9040093
Submission received: 5 October 2021
/
Revised: 31 October 2021
/
Accepted: 2 November 2021
/
Published: 4 November 2021
(This article belongs to the Section Atomic, Molecular and Nuclear Spectroscopy and Collisions)
Abstract
:Beam-foil EUV spectra of elements from Na through Cl are presented, partly in survey spectra and partly in detail spectra. The ionization stages of interest are medium to high, so that three to thirteen electrons remain. Research topics are outlined and the problems of the measurement technique discussed.
1. Introduction
The spectroscopy of individual elements has been pursued for about two centuries, developing laboratory light sources as well as spectroscopic techniques and equipment. Among the key insights achieved by Robert Bunsen and Gustav Kirchhoff in the middle of the 19th century were the emission lines of Na observed after sprinkling table salt into the flame of a burner and the identity of the positions of dark lines in the spectrum of the Sun with those of emission lines produced in the laboratory. The spectroscopy of ion beams began with observations on canal rays about a hundred years ago, for example in experiments performed by Wilhelm Wien. Ion accelerators began to provide fast beams of protons, deuterons and so on for nuclear physics studies about a century ago; over time, ion source development and research interests have included heavier elements up to U and even beyond. Beam-foil spectroscopy, the atomic physics study of light (and electrons) emitted by fast ion beams after they had been passed through thin foils, evolved as a technique some half a century ago [1,2,3,4,5,6,7,8,9,10]. In principle, all charge states of all elements are accessible to study by fast-ion beam techniques, given the availability of ion sources and appropriately powerful ion accelerators [10,11].
This presentation picks out some detailed work on few-electron ions of Na, Mg, Al, Si, P, S, and Cl ions at a moderate-size heavy-ion accelerator and employs a simple detection system that works in the extreme ultraviolet (EUV). The intention is to illuminate and cross-link some of the data recorded several decades ago and thus to highlight certain research ideas and what became of them in practice, pointing out options for future study. Particulars of the beam-foil spectroscopic measurement technique are mentioned along the way as a didactical tool for discussing peculiarities and options, and for pointing out solved and not-yet solved problems.
2. General Remarks
Since the 1930s, Bengt Edlén and Folke Tyrén [12,13,14] (on elements K through Co), Jonas Söderqvist [15,16] (on elements Na through Si), and Edvin Ferner [17,18] (on Al, Si, and S) have performed excellent spectroscopic measurements in the soft-X-ray range that used high orders of diffraction of EUV radiation in comparison to low-diffraction order images of UV radiation for accurate EUV wavelength determinations. Their line identifications and spectrum analyses remain key to the present atomic structure knowledge on these elements and their spectra.
Since the 1960s, a wealth of new EUV data has been obtained from controlled fusion plasma experiments or solar observations by space-borne devices. In the 1970s, Brian Fawcett [19] presented spectroscopic studies of laser-produced plasmas of elements Al through Cl (incidentally the same range of elements as is discussed with beam-foil data here) and identified all major transitions in the n = 2 shell ions, as well as a number of XUV transitions (with wavelengths below 4 nm) in Cl and Fe ions. Fawcett achieved the line classifications [20] by combining experimental data with Hartree–Fock computations. Those are not very accurate on their own, but are extremely helpful when key parameters are fitted to match experimental data and thus high-quality consistency checks can be performed (see the historical overview in [21]). The semi-empirical Cowan code computations were in competition with ab initio atomic structure computations. In the late 1970s, a particularly wide-ranging example was the Multiconfiguration Dirac–Fock computations by Chen, Kim and Desclaux [22]. Their tabulations provided very helpful tools for decades, even as they were confined to a few electron configurations and consequently were of limited accuracy, because of the nascent computing resources available at the time. The non-relativistic scaled Hartree–Fock computations still have their specific value (see [21]), but relativistic atomic structure computations are necessary to describe medium- and high-Z elements. Several of these ab initio computational approaches meanwhile have achieved a remarkable accuracy (see [23] and references therein) that in some cases competes with experiment.
Among others, Fawcett tried to identify transitions of iron group elements [20] and to obtain reference lines preferably of lighter elements that could also be studied in the laboratory. The wavelength range from 10 nm to 26 nm is of particular interest in terrestrial and coronal plasma physics, because so many lines of Fe X and higher spectra shine here. For example, Fawcett recognised that the 3d–4f transitions in Li-like ions provide rather isolated lines in the wavelength interval of interest, and that these lines appear in coronal spectra, too. If one can determine the wavelengths of these lines accurately, one can determine the velocity of the emitter towards the observer, for example the velocity and thus the kinetic energy of solar flares. The same lines were produced in the laboratory in a laser-produced plasma. However, although the plasma footprint remains in the same location, the laser-heated plasma actually expands rapidly. If the observer looks at the plasma, many of the emitting particles fly towards the observer, and their emission is Doppler shifted; consequently the determination of absolute wavelengths in the rest frame of the plasma ions is spoiled. In due course, the observation of such plasmas changed from viewing the core of the plasma spot to a sideway observation of the expanding plasma plume and similar geometric refinements, thus notably reducing (but not fully suppressing) the first-order Doppler shift.
For the 1s3d–4f lines in Mg X (near 18.71 nm), Al XI (near 15.46 nm), and Si XII (near 12.99 nm), Fawcett and Ridgeley [24] (see also references to earlier work therein) gave the wavelengths of the two dominant fine structure components with an accuracy of 0.001 nm, which in solar physics meant a limitation of the data interpretation due to mass motion, while in beam-foil spectroscopy the same accuracy data yielded highly useful and practical references in ranges of the spectrum with little interference from other charge state spectra. Sample spectra are shown in Figure 1 and discussed below. The 3d–4f transitions in Li-like ions connect levels of maximum angular momentum ℓ, so-called yrast levels (a name adopted from nuclear physics). The electrons in such transitions stay practically outside of the 1s electron core, and thus the simple Bohr formula provides a valid approximation to a hydrogenic model (Table 1). In the EUV, the wavelengths of the 1s3d–4f lines estimated thus simply are about 0.03 nm longer than the measured values; turning this view around, the effect of core polarisation shortens the wavelengths in the Li-like ions of our sample by as much as 0.03 nm compared to the truly H-like ions. For yrast transitions of higher principal quantum number n the difference is smaller yet. For the 1s3p–4d transitions the core polarisation effect on the wavelength is larger by about an order of magnitude compared to the 1s3d–4f transitions.
All of this has been described conceptually by Edlén in his 1964 Handbuch der Physik article on atomic spectra [25,26]. Although fundamental studies of the few-electron EUV spectra of Na, Mg, Al, and Si go back to the 1930s (see above), the reference data literature on these spectra is not fully up-to-date and consistent even for relatively low-lying levels right above the n = 2 level manifold that has been treated by Edlén [27,28,29,30,31]. For example, Kelly and Palumbo [32] and Kelly [33] do not show n = 3–4 transitions in Na IX, but list 3d–4f wavelengths in Mg X and Al XI, and a proposed wavelength of the 3p–4d transition array in the same spectrum. For Si XII, there are measured wavelengths of 3d–4f transitions and predicted ones for 3s–4p and 3p–4d. The NIST ASD online database shows a single measured wavelength for Na IX 3d–4f of 23.178 nm that is suspicious, because it is inconsistent with the three individual components of the transition array (23.098 nm, 23.106 nm, 23.109 nm) as (correctly) derived by the Ritz combination principle in the same tables [34]. Fawcett and Ridgeley [24] do not cover Na; the spectrum in Figure 1a proves that the wavelength interval between the 3p–4d and 3d–4f lines is incompatible with the measurement quoted in the NIST ASD tables [34]. Last, but not least, the tabulated measured Na IX wavelength exceeds the simple estimate by the Bohr formula (see Table 1). For Mg X and Al XI, the NIST ASD tables show wavelengths of the two strongest 3d–4f transitions. For Si XII there are apparently accurate wavelength data on most n = 3–4 transitions, but no entries on the 3d–4f transition wavelengths. It is puzzling to find such (minor) gaps and inconsistencies in tables that have been so competently compiled and admirably curated since many decades.
3. Beam-Foil Measurements
Beam-foil spectroscopy uses a mass- and charge-state selected ion beam, that is, a light source that contains a single isotope and, after the interaction with a foil or gas target, with a predictable charge state distribution [35,36,37]. On the one hand, it is reassuring to know that all emission detected belongs to a known elemental species. On the other hand, most spectrometers do not measure absolute wavelengths, but rely on the fine mechanics of delicate spectroscopic machinery in order to determine the differences in wavelength of the lines of interest from those of reference lines. However, suitable reference lines in the same spectral range are rare if they have to be of the same element and a near-by charge state. There are some (quite involved) ‘refocusing’ techniques of observing stationary light sources along (or alternatingly) with moving ion beams (which feature significant Doppler shifts), but these had not yet been conceived some half of a century ago when beam-foil spectroscopy began to provide vacuum ultraviolet spectra of interest for the analysis of terrestrial laboratory discharges or the solar corona.
Unfortunately the Bochum beam-foil measurement set-up (the source of most of the data discussed below) was not capable of sufficiently high measurement precision and accuracy to compete with most of the above studies and databases in terms of wavelength accuracy. However, there are insights to be gained by a different observation technique even at a more moderate level of accuracy. As an example, Figure 1 shows the 3d–4f line and its near neighbourhood in the Li-like spectra of Na, Mg, Al, and Si. The ion beam energy was chosen for maximising the expected signal from the three-electron ion within the performance envelope of the available 4 MV Dynamitron tandem heavy-ion accelerator with its high-current sputter ion source [38,39]. For Na and Mg this was, indeed, the highest-fraction charge state [35], whereas for Al and Si the highest-fraction charge state produced was the four-electron ion. Nevertheless, three-electron ions were abundant enough for statistically reliable spectroscopic measurements.
A tandem accelerator starts out from negative ions which are accelerated towards the high-voltage terminal, where the ions are stripped to become (multiply) positively charged, and then the ions use the same voltage drop for further acceleration towards ground potential at the detection site. The Bochum beam-foil experiment has been described in some detail elsewhere [40,41,42,43]; here, it is sufficient to mention a beam-foil measurement chamber with a foil wheel (holding spare foils that could replace the active exciter foil without breaking the vacuum) that could be displaced by up to 17.5 cm (for lifetime measurements with delays after excitation of up to some 20 ns). A McPherson Mod. 247 grazing-incidence scanning monochromator equipped with a grating of R = 2.2 m and 600 ℓ/mm or 3600 ℓ/mm dispersed the light seen from the ion beam, and a channel electron multiplier (‘channeltron’) served as the detector. With the mechanically ruled 600 ℓ/mm grating, the spectrometer operated best in the wavelength range from 8 nm to some 70 nm [44,45]. With the (less efficient) high groove density grating the monochromator was mechanically limited to operations in the wavelength range below 20 nm. This grating offered a spectral resolving power that clearly split the Si XII 3p–4d transition array due to the fine structure splitting of the 3p levels (see Figure 1d).
There is another detail of practical importance that can be seen in Figure 1: The 3d–4f transition array produces a much stronger signal than the 3p–4d transition array. Several factors contribute to this. If the levels were populated according to their statistical weights , or for the terms, , this would imply a level population of the 4 F term levels higher than that of the 4 D term levels by about 40%. The levels of the 4 D term decay to n = 3 as well as to n = 2 levels. The branching ratio is roughly 1:3. Hence the 3p–4d lines in the spectrum represent only 1/4 of the total upper level population of the 4 D term. Together with the statistical weight effect, one should expect the 3p–4d line to be weaker than the (unbranched) 3d–4f line by about a factor of five. All spectra in Figure 1 indicate a factor of 10 or more. The additional factor of two or more is a result of cascade repopulation which favours the levels with maximum angular momentum ℓ for a given principal quantum number n, that is, the yrast levels. This signal enhancement by cascades, combined with the simple (approximate) estimate of their wavelengths, renders yrast transitions particularly attractive as markers in beam-foil spectra.
3.1. Na
With the term system and level energies of key levels known from the groundbreaking spectral studies by Söderqvist [15,16], beam-foil spectroscopy added measurements of transitions rates and level lifetimes of several ions of Na [46,47,48,49]. Scientists at NIST have compiled level and transition rate data [50,51,52], and consequently the NIST ASD online database lists more than 2500 lines of Na III–X in the wavelength range from 5 to 60 nm. Among other projects, Bochum beam-foil work addressed line intensities in the n = 2 level manifold in B-like ions [53] and the intercombination decays of n = 3 levels in Be-like ions [54]. In the course of those studies, Na survey spectra of various ranges within the wavelength interval 8 to 50 nm have been recorded, with better spectral resolution than available in the early beam-foil studies at Lyon [46,47]. The Lyon work on Na began at ion beam energies of 0.8 MeV and continued at 1.5 MeV and some higher values; the Bochum survey spectra of Na were recorded at ion beam energies of 1.5 MeV (favouring charge states q = 3 and 4), 2.8 and 3 MeV (favouring q = 4 and 5), 4.5 MeV (favouring q = 5), and 7 MeV (favouring q = 6+), at each ion beam energy expecting contributions by 4 to 5 adjacent charge states [35,36,37].
The valence electron in the Na atom is easily excited and ionized, and a positive ion produced. Such positive ions of alkali elements Li and Na are good candidates for use in single-stage ion accelerators, and when beam-foil activities began at Bochum in the early 1970s, a small accelerator provided beams of these elements (an even smaller ion accelerator at Stockholm as well as work at Lyon had produced evidence for doubly excited Li ions a few years before [55,56,57], which was an essential step that enabled and explained many later findings (see [58]), including the formation of negative ions of rare gases and alkalis). When in 1973 the Bochum Dynamitron tandem accelerator began operations, negative ions were wanted, and those of Na seemed elusive. Several years after finding doubly excited Li it was recognised, also in beam-foil work, that the negative ion of Li, Li, provides a strong line in the UV spectrum that arises from a transition between core-excited levels. Na ions can be produced similarly, and not only by the ion-foil interaction, but also in a negative-ion source, providing atomic and molecular negative ions (see [38]). Owing to continued development work by Bochum accelerator chief Klaus Brand and the operators, the performance of the reflection sputter ion source at the Bochum tandem accelerator eventually exceeded that of the inventor’s device.
The Bochum survey spectra were recorded in mechanical scans of an EUV monochromator. Because mechanical drives tend to suffer from periodic errors (for example, of the lead screw), a linear length gauge was added to the spectrometer. This device detected changing Moiré patterns from overlaying a stationary and a movable line grid, and in this way it monitored the exit slit displacement with an accuracy of ±1 m. However, the gauge had a mechanical range of 60 mm, and consequently during longer scans it required a repositioning of the bracket that held the gauge. Moreover, the spectrometer design did not lend itself to establishing an absolute reference position. Thus, gearbox shifts between measurement campaigns and alignment inconsistencies in chains of settings would not be detected by the length gauge readings but only in off-line data analysis. Consequently mechanical offsets between recordings were recognised only if each of the data sections comprised reference lines. In the Na spectra there are plenty of well-established and recognisable lines in the wavelength range above 30 nm. The NIST ASD database [34] comprises very many lines also at shorter wavelengths, and the beam-foil recordings show very many lines, but (as discussed below in the comparison to theory) the complexity of the spectra as well as the high density of mostly weak lines make it difficult to match the data sets.
Compilations and tabulations based on experimental data are always suspected of being incomplete. An effort was therefore undertaken to test this assumption and the quality of modern atomic structure computations [59]. State-of-the-art relativistic configuration interaction (RCI) computations of Na VII (B-like) were to be compared with extended EUV spectra recorded at Bochum. The intended comparison of experiment and computation, alas, failed because of complexity. The computations yielded very many line positions of high accuracy, including many new line predictions in the wavelength range below 20 nm. However, the beam-foil data show ever so many (mostly weak) lines (of several charge state ions) that there are several candidate lines within the uncertainty range of each computed line, while recognisable reference lines are scarce. This finding relates to one of the advantages of the beam-foil light source, being isotopically pure. Unfortunately this also means that in-spectrum reference lines are available only from the very element under study. The experimental survey spectrum shown in [59] suffers from this problem; the long-wavelength sections of the spectrum (recorded at a different occasion) need to be adjusted in wavelength by an amount different from the short-wavelength section. The spectra shown and discussed below result from improvements beyond the calibration used in the presentation of experimental data in the study by Jönsson et al. [59]. The effort of identifying reference lines and thus tying down the wavelength scale with appropriate accuracy is an ongoing process and has not yet been finished. The problem is easier to solve at much higher ion beam energies, where few-electron ions dominate the spectrum (see the discussion of Li-like ions in Section 1). The excitation conditions in the experiments that fed into the NIST ASD database differ from those of beam-foil excitation. What should be helpful is collisional-radiative modelling of the spectrum (which was not available to us); a synthetic spectrum with known components would render interpreting a measured spectrum an easier task.
Figure 2, Figure 3, Figure 4 and Figure 5 show composite spectra of Na recorded at up to four ion beam energies, with the relative line emissions depending on the associated charge state distributions [35,36,37]. There is no absolute emissivity reference available for these spectra. The full wavelength range from about 8 nm to about 54 nm was typically covered in six sections recorded during one or two days of operation. Spectra recorded in immediate succession have been stitched together by reference to the length gauge readings, but measurements at different occasions needed calibration lines in each group of spectral tiles, and these are sparse below 30 nm. A spectrum tile border near 28 nm occurred in several experiments; this is visible in Figure 3c,d by a change in intensity of the line pattern that resembles a noise spectrum.
At an ion beam energy of 1.5 MeV the strongest charge state fractions are q = 3 and 4; at 3 MeV the maximum expected is for q = 4 and 5; at 4.5 MeV the maximum charge state fraction is for q = 5, and at 7 MeV the highest fraction is expected for q = 6. With so many lines known in the various spectra, one might expect no calibration problems. However, the best known lines lie at wavelengths above some 30 nm and belong to ions with few electrons, in our sample, Be- and B-like, that is with four or five electrons, respectively. These are best produced at the higher ion beam energies. This leaves calibration problems in the spectra at wavelengths shorter than 30 nm in all our Na spectra, and in particular in the lower ion beam energy spectra. A multitude of lines have been listed in the data bases, but it is difficult to find line groups with recognisable patterns that would anchor the wavelength scale. Tying the wavelength scale to the identified lines at longer wavelengths is not accurate enough for the short wavelength sections and the lower ion beam energy spectra. There are a few prominent Na IV lines in the lowest-beam energy spectrum at wavelengths below 20 nm (Figure 2d). These lines fit and thus corroborate the overall calibration, but they cannot serve as calibration anchors themselves, because they (and a few Na III lines in Figure 3d) consist of several unresolved components each. In Figure 4a,b a merged line group is visible at a wavelength near 33.7 nm. The doublet-quartet intercombination transition array Na VII 2s2pP – 2pD would fit in wavelength [34], but the small branch fraction of intercombination transitions in the presence of intra-shell transitions without a spin change are expected to render those intercombination transitions too weak to observe in the present experiment geometry.
Evidently the intention of measurements at several ion beam energies was to obtain spectra that differ in composition by the underlying charge state distributions, but that at the same time are close enough to each other to permit tracing the appearance of specific lines as a function of ion beam energy. This worked out as intended for the spectra recorded at ion beam energies of 1.5 MeV and at 4.5 MeV and 7 MeV. The spectrum recorded at an ion beam energy of 3 MeV (spectrum (c) in Figure 2, Figure 3, Figure 4 and Figure 5) is clearly different and does not fit such an interpolation. In the wavelength range 29 to 50 nm this spectrum resembles the other spectra fairly well, but outside of this interval the 3-MeV spectrum features a high number of spikes and line-like structures that appear more like noise than all the other spectra. However, within this noisy range, there are spectral structures that lie in the correct position and show an intensity that is commensurate with the spectra recorded at other ion beam energies. This combination suggests that the exciter foils suffered some damage under ion irradition, and this affected the light yield directly (changing the excitation and observation geometry) as well as indirectly, by disturbing the charge state balance and thus the ion beam electric current measured by the Faraday cup for signal normalisation. The suspect sections of the Na spectra recorded at 3 MeV ion beam energy are marked (by blue bars) in the figures, but nevertheless they are included in this presentation as a demonstration of such experimental problems. This specific problem is particularly cumbersome with scanning detection systems that require many hours to successively cover the thousands of data channels needed for a survey spectrum. Another, related, case appears in Figure 5b: in the spectrum recorded at an ion beam energy of 4.5 MeV, a Na VII line is missing near a wavelength of 48.3 nm. The line is present in the other spectra, but in this spectrum, probably the exciter foil broke fully just before the spectral scan reached the line position, and was replaced just after having passed this position. In the long-wavelength section of the spectrum recorded at 3 MeV, another peculiarity shows: amidst otherwise regular spectral features two line-like structures at 50 nm and at 51.8 nm have irregular profiles, and there are lines at wavelengths beyond 52 nm that defy any identification so far and should not be subsumed with Na (the search for the origin of such foreign spectral features has included unexplained malfunctions of the data acquisition system, producing an intermittent error par excellence. Multiple measurements are an essential tool for spotting such problems). Yet another suspect feature is a line at 12.1 nm (Figure 2b); the signal distribution of this line is extraordinarily narrow and bright, so that an electronic noise burst or the passage of a cosmic ray must have perturbed the signal electronics. The latter effect is frequently encountered in position sensitive detectors, whose detector chip area is much larger than that of the single-channel open photomultiplier used here, and the exposure time per data channel is much longer.
3.2. Mg
Following Söderqvist’s lead [15,16], the spectra of multiply ionised Mg ions have been studied variously, supported by the astrophysical interest in data on atoms with even-even nuclei. Besides the compilations cited above, scientists at NIST have collected and presented level and transition rate data on all charge states of Mg [52,60], and the NIST ASD online database holds entries for more than 2000 transitions of Mg in the EUV. At a tandem accelerator, Mg yields ion beams with moderate currents. Wide-range survey spectra of Mg in the the EUV have been presented elsewhere [61]. The quality of the corresponding figure in that publication has badly suffered in the digitisation process. Unfortunately the underlying data file has not survived the subsequent four decades hence, with their many changes in data storage systems and media, so that the spectrum cannot be redrawn here. A fair number of systematic studies at Bochum have included Mg (for example [53,54,62]), and some instructive examples can be drawn from those. At the ion beam energies of the measurements depicted in Figure 6, Figure 7 and Figure 8, the most abundant charge state is q = 8+ (Be-like spectrum).
Bochum beam-foil work has investigated the line intensities in the n = 2 level manifold in B-like ions as they change as a function of atomic number [53]. Figure 6 shows such a spectrum and the data quality achieved. Besides the Mg VIII lines of interest, the spectrum comprises the resonance line Mg IX 2sS – 2s2p P at 36.8076 nm which provides a fairly isolated accurate calibration reference over a wide range of ion beam energies. Since the line arises from a transition in the singlet term system, there is no problem of possibly unresolved fine structure.
An experimental problem is indicated by the blue bars in Figure 6. The light yield of exciter foils under ion irradiation varies due to unexplored parameters; there also is a (usually small) variation with radiation dose, that is, during use. If one wants to observe relative line intensities, the data are better reproducible if obtained with one and the same foil. If one expects to require an hour for the measurement of the essential lines in a spectrum under conditions that usually let foils last for about two hours before significant breakage occurs, one may economise by bridging wavelength sections of lower interest at a lower preset (that corresponds to the ion beam charge collected on a Faraday cup) and thus data accumulation time per channel than chosen for the data of principal interest and the calibration lines.
In Be-like ions, a number of intercombination transitions are of interest. For example, at low nuclear charge Z the 2s3p P level decays preferentially to the 2s3s S level, alongside the decays of the J = 0,2 levels of the same term. At high Z, however, the J = 1 level preferentially decays with a spin change towards the 2sS level. There also is a decay branch to the 2pP levels. For Mg VII the wavelength of the 3s–3p in-shell decay branch falls into the vacuum ultraviolet (VUV), whereas the n = 2–3 decay branches lie in the soft-X-ray range (SXR). Among these options, the decays of the three levels are separated widest in wavelength in the VUV range and should be easy to resolve. In the SXR, the respective decay branches fall close in wavelength to a variety of other decays. Moreover, at short wavelengths the resolving power of a given diffraction grating is poorest (the instrumental line width being independent of wavelength). Thus, VUV observations are preferred if the lines can be detected. Figure 7 shows such a search for the intra-shell decays of n = 3 levels in the Be-like ions of Mg [54]. Figure 7a shows the wavelength range (145–160 nm) in which the transitions are predicted. This wavelength range lies beyond the working range of the EUV spectrometer when equipped with the mostly used 600 ℓ/mm grating; a 300 ℓ/mm grating was used instead, as well as a channeltron detector coated for extending the detection range from the EUV into the VUV. The two strongest lines in the spectrum arise from the Mg IX 2sS – 2s2p P transition (wavelength 36.8076 nm) in the fourth diffraction order and the Mg IX 2s2p P – 2pD transition (wavelength 74.955 nm) in the second diffraction order. The second transition feeds the first, and both are enhanced by cascade repopulation that is funneled along the yrast line of levels. In one test, a control spectrum was recorded with a MgF filter in front of the detector. This material has a short-wavelength transmission cut-off near 120 nm. The lines were fully suppressed by the filter (see [54]), which indicated that the observed lines had wavelengths shorter than 120 nm. A second test (without a filter) compared the spectrum observed at the rear side of the exciter foil with a spectrum recorded 2 mm away (after a delay of about 160 ps) (Figure 7b). The lines were reproduced as expected for the given calibration lines. Significantly, the delayed spectrum looks practically free from background contributions by the many decays that are observed near the foil. The lines of interest should have been visible in both spectra, if the spectrometer and detector efficiency had been sufficiently high. No line of notable intensity could be identified with the lines of interest in the VUV; this non-observation necessitated the continuation of the experiment [54] in the SXR range, where the resolving power of grating spectrometers is much poorer.
Figure 8 shows a beam-foil spectrum of the vicinity of the Mg X 3d–4f and 3p–4d transitions recorded at an ion beam energy of 19 MeV. The other Mg X n = 3–4 transitions [24] lie outside the range covered in this measurement. The wavelength interval is wider and the ion beam energy lower than for the data in Figure 1b. There are several unidentified spectral features. According to the charge state distribution [35], charge states q = 6–10 may be expected to contribute to the spectrum. Most of the unlabeled spectral features in Figure 8 are expected to arise from ions with 4, 5, or 6 electrons, but none has been identified yet.
3.3. Al
Al as an odd-numbered element is of lower cosmic abundance than its neighbouring elements Mg and Si, but at least the isotope Al plays a notable role in nuclear astrophysics, especially of supernovae. The number of entries on Al in the EUV part of the NIST ASD online database is similar to those on Na or Mg and amounts to more than 2000. The basic atomic energy levels, transitions and transition probabilities are evidently well established [15,18,19,20,33,63,64]. There has been no attempt to obtain wide-range EUV survey spectra at the Bochum beam-foil facility, because Al ion beams at the tandem accelerator were weaker than those of many other elements. However, the ion beam current sufficed for various detail studies such as those undertaken in the course of the aforementioned projects on isoelectronic systematics [53,54,62].
A relatively short Al survey spectrum has covered the wavelength range of the n = 3–4 transitions in the Li-, Be- and B-like spectra of Al (Al XI, X, IX) (Figure 9). A corresponding highly-resolved spectrum of Si has been recorded in 1978 [42], and its eventual theoretical interpretation (with hundreds of lines per charge state) within the subsequent quarter of a century will be recalled in the next subsection. That Si spectrum was recorded using a high-resolution diffraction grating of 3600 ℓ/mm. Unfortunately the much lower ion beam current available for Al barred a corresponding high-resolution measurement on Al. Therefore the spectrum in Figure 9 was obtained with the work horse diffraction grating of 600 ℓ/mm, which is not sufficient to resolve all detail. However, the beam-foil group at Lyon (France) has obtained a Si spectrum of comparable resolution [65] in which they interpreted the spectrum of the Be-like ion, and from their data they also determined parameters for the corresponding Al X spectrum (which was not shown in their publication). Similarly, Kramida has derived fit parameters for Hartree–Fock computations of various elements, including Al, from their work on the Bochum Si spectra [66]; an explicit line list of the Al X beam-foil data has not yet been produced. In Figure 9, the Al X n = 3–4 spectrum extends roughly from 15.5 nm to 18 nm. The 3d–4f yrast transitions in Li- and Be-like ions of Al (near 15.47 nm and 17.7/17.8 nm, respectively) are readily identified. In contrast, the Al IX n = 3–4 transitions are spread out over the wavelength interval from 18 to 22 nm. No consistent theoretical detail study appears to have been executed on these lines, and many transitions that are expected to contribute to the spectrum are not yet listed in the NIST ASD compilation [34].
Figure 10 shows a spectrum of Al at a low ion beam energy, corresponding to part of the Na spectrum in Figure 2d and Figure 3d. According to the charge state distributions provided by Delaunay [35], the largest fraction charge state should be q = 4 (spectrum Al V), with contributions to the observed spectrum from charge states q = 2–5. The difficulties of finding suitable reference lines resembles the problems described with Na above. For example, according to the NIST ASD [34] database the strongest line (with a wavelength near 10.4 nm) in the graphical display is a blend of more than half a dozen lines of Al V and Al VI. The Al V features near 12.6 nm and 13.0 nm consist of several lines each, and most of the multi-component lines longwards of 17 nm are not yet identified. Actually, only the two Al IV lines near 16.0 nm appear to be unaffected by blends. They belong to the Ne-like Al IV 2pS – 2p3s P resonance and intercombination transitions. Their wavelengths are accurately known (see [34]) and serve as wavelength anchors for the spectrum shown.
These lines in Ne-like Al also provide a reference marker to discuss a field of study by beam-foil techniques that I have chosen not to expand on in this series of data surveys, that is, the measurement and interpretation of decay curves with the goal of atomic level lifetime measurements. The resonance and intercombination decay rates in Ne-like and many other atomic systems are linked (in atomic theory) via matrix elements that describe multiplet mixing. These matrix elements permit the calculation of the intercombination transition rate relative to the much larger resonance transition rate, which in turn is assumed to be better calculable, because the resonance transition (without spin change) is presumed to be closely related to transitions in the one-electron system. Evidently a measurement of both rates is desirable to learn about the mixing, and measurements of many elements would indicate how the mixing evolves with increasing atomic number Z. This is a research program that has been outlined, pursued and accompanied especially by Larry Curtis at Toledo (OH, USA). After a number of lifetime measurements of the 2p3s P levels in the Ne-like ions of various elements had been executed, Curtis tried semi-empirical techniques in order to systematise the results. The results of some of the early measurements scattered badly, and obviously there had been systematic analysis and error problems. However, Curtis’ work provided a guideline with a high-Z hydrogenic limit that was beyond dispute. Then beam-foil results from Lund (Sweden) [67] were published with much smaller error bars than the competition had been able to achieve, but some of the new results were at odds with Curtis’ expectations. In order to check on the earlier results, beam-foil work at Bochum revisited the lower-Z elements and modelled the cascade repopulation for the lifetime analysis [68], improving notably on the systematic errors. It became clear which earlier results needed to be superseded, and Curtis’ eye-guiding lines were largely corroborated (see [69]). Unfortunately, some of the Lund results remained off the track, until a new decay curve analysis yielded revised results that fell closer to Curtis’ predictions [70]. Several older results for elements of higher Z, which had been tainted by not being compatible with the isoelectronic trends as long as the earlier Lund data were deemed correct, now returned to their earlier standing of being not very precise, but reasonably accurate.
Figure 11 shows the resonance/intercombination line pair in Ne-like spectra of elements from Na through S, measured in preparation for lifetime measurements [68]. These six detailed spectra illustrate the time-resolved observation aspect of beam-foil spectroscopy in a peculiar way. In a stationary light source, the two upper levels 2p3s P of the resonance and intercombination transition, respectively, may be expected to be roughly equally populated, because they have about the same excitation energy and similar statistical weights (this simplified discussion neglects excitation paths, level lifetimes, etc.). Figure 11 shows a line intensity ratio that at low Z (e.g., in Na and Mg) favours the resonance line, decreases with increasing atomic number Z, and that in the observation of P and S even seems to slightly prefer the intercombination line. This variation along the isoelectronic sequence results from the geometry of observation of the fast ion beam. The Bochum detection system (looking sideway at the ion beam) views a section of the fast ion beam that is about 0.9 mm wide and corresponds to a time-of-flight interval of the fast ions of about 60 to 100 ps, depending on the ion velocity. In Na, the two level lifetimes of interest are about 0.3 ns and 6 ns, respectively. The detection system thus sees a much smaller fraction of a decay length (level lifetime times ion velocity v) of the intercombination decay than of the resonance line. The lifetime ratio varies from a factor of about 20 in Na to a factor of about 4 in S, which explains the decrease of the line ratio. At the same time the transition rates scale steeply with Z; both level lifetimes are shorter than the width of the ‘time window’ in the case of S. Thus, a line ratio of one is expected in the high-Z limit, at which the detection zone is much longer than each of the decay lengths. However, the positioning of the detection zone near the rear side of the exciter foil is a matter of judgement; one wants to include as much as possible of the luminescent ion beam, yet also include the foil position. If the detection zone misses the foil position by a small fraction of the zone width slightly, the loss of signal is larger for the faster decay (the resonance line), and thus a line ratio smaller than unity can occur. By the way, the line ratio in P and S has been observed in both first and second diffraction order (with practically similar line ratios), and also for recording decay curves. In first diffraction order, the lines were not fully resolved from each other, but still sufficiently well resolved for decay curve measurements. The lifetime results from both observations agreed with each other. The resonance level lifetime in S VII, however, was too short to be determined in the Bochum study [68], because it amounted to only a small fraction of the time window width, at the limit of what an analysis can disentangle that takes even the detailed properties of the detection zone into account [71].
3.4. Si
Early EUV spectra of Si have been reported by Söderqvist [15] and Ferner [17,18]. The database group at NIST has compiled wavelength and transition probability data on all charge states of Si [72], and the online database NIST ASD [34] is about as comprehensive on Si as it is on Na, Mg, and Al.
Si can be provided at a fairly high ion beam current at the Bochum heavy-ion tandem accelerator, and it has been used for a fair range of spectrum and atomic lifetime investigations [40,41,42,43], so that little material remains to be reported here. The determination of the detection efficiency curve of the EUV spectrometer system [44,45] permitted to derive not only level lifetimes, but also branching ratios and transition probabilities for B-like ions of Si and P [73]. Most of that work concerned transitions within the n = 2 valence shell of Li- through O-like ions at wavelengths above some 20 nm. The spectra, some of which were recorded with high resolution, of course showed many lines at shorter wavelengths, too, especially in the range expected of n = 3–4 transitions in Si ions with 4 or 5 electrons, for which literature data were sparse. Major progress was made for Si XI by Khardi et al. [65] and little later by Kramida who applied the Cowan code, a scalable Hartree–Fock atomic structure code, to the problem [66], some 18 years after the beam-foil measurements. Another decade later, Vilkas and Ishikawa successfully analysed the spectrum Si X by using a Multireference Møller-Plesset approach [74].
Figure 12 demonstrates the inherent time resolution of the beam-foil light source (again). The Si XII 2p P levels feature lifetimes in the nanosecond range and experience cascade repopulations, so that their decay signal is almost independent of observation position in the proximity of the exciter foil. The Si XII 6h level lifetime is about 11 ps (estimated in a hydrogenic approximation), and the decay should thus be unobservable after a delay of 350 ps (Figure 12b)—if it was not part of the same yrast level decay chain as replenishes the 2p levels.
Figure 13, Figure 14 and Figure 15 show three survey spectra of Si, all recorded at ion beam energies significantly lower than most of the aforementioned Bochum studies of the 1970s and 1980s. The typical charge states are about two units lower, which does not sound much, but which removes the cherished calibration lines provided by Li-and Be-like ions. Common to all three spectra and thus very helpful for calibration and spectrum inter-comparison is the line triplet Si VIII 2s2pS–2s2pP at 31.4327/31.6206/31.9826 nm [34]. There are many other lines that appear in two or even in all three spectra, but with many groups of lines of rather similar spacings initial identification can be tricky, even if helped by multiplet line ratio patterns from basic theory [75]. Once the spectra are calibrated and can be compared at a similar scale, it is easy to check for the appearance, growth, and disappearance of lines of given charge state as a function of ion beam energy. For example, in Figure 15, a group of Si IX and Si X lines reveals how at the lowest ion beam energy the Si X line is almost non-existent, while at the highest ion beam energy it exceeds its neighbours. In Figure 15, three lines in the wavelength interval 19 nm to 20 nm remain presently unidentified; their excitation curves suggest an identification with Si VII (lines near 19.173 nm and 19.270 nm) and Si VI (line near 19.862 nm), respectively.
I only can admire the spectroscopic practitioners of more than half a century ago who analysed their photographic spectra (of non-linear intensity scale) without the help of accurate atomic structure computations.
3.5. P
Phosphorus is reputedly too dangerous to handle without need in a university laboratory, because chemical compounds related to nerve gas agents might by inadvertently produced. However, GaP specimens from semiconductor experiments can be used with relatively little hazard, and that way a strong ion beam was obtained at the Bochum accelerator laboratory (and similarly, decades later, at the tandem accelerator that served the Heidelberg heavy-ion Test Storage Ring (TSR) [76]). Then a few spectra and lifetimes were recorded [77] similarly to the aforementioned work on Si. However, for no specific reasons known most of the data files on P did not survive the many changes of storage media and computers over the decades since. An exception are the P spectra in Figure 11.
3.6. S
Among the early studies of the spectra of multiply charged sulfur ions is the work by Ferner [18] who also evaluated photographic plates provided to them by Edlén. Sulfur is one of the strongest ion beams available at tandem accelerators, and beam-foil studies of such ions were undertaken in the USA in the mid-1970s, for example by David Pegg, Ivan Sellin and their colleagues at the tandem accelerator at Oak Ridge TN (see [78,79,80,81,82]), with a primary interest in level lifetimes of three- and four-electron ions. The Bochum group entered the field of EUV spectroscopy just a little later. Few-electron ions of S require rather higher ion beam energies than are available at Bochum. Hence no survey spectra of S were recorded at Bochum, but the performance of the Bochum tandem accelerator sufficed for systematic studies of spectrum detail along isoelectronic sequences (see [53]). No unpublished spectra that are worth showing in the present context have been preserved beyond the S spectra in Figure 11.
3.7. Cl
Forester et al. [83] have studied level lifetimes of decays in the shell of various Cl ions that were provided by the tandem accelerator at Oak Ridge TN. The Bochum 4 MV Dynamitron tandem accelerator was not powerful enough to produce two- or three-electron ions of Cl, and provided only small amounts of four-electron ions. It was sufficient, though, to provide a decent signal for the study of relative line intensities in B-like ions [53] (here Cl XIII). The machine was very versatile and capable also to operate at low ion beam energies. Therefore an early project investigated 3p–4s transitions in Al-like ions for their significant variation with atomic number Z [84,85] (see Figure 16). The spectra of Figure 16, Figure 17 and Figure 18 result from those projects. The spectrum in Figure 18 essentially continues the spectrum in Figure 17, but at a moderate delay which corresponds to a few lifetimes of most of the upper levels involved. In this time range after excitation, low-lying levels are notably replenished by cascades, so that the line intensities of the decays associated with these levels remain high. Consequently, similar transitions in ions of neighbouring charge states result in roughly similar upper level lifetimes; the relative line intensities in such spectra may be fairly similar in prompt and (not too much) delayed spectra. In the spectra depicted, practically all major lines have been identified from the tables compiled by Kelly [33]. In the figures, actually only a few weak lines remain unassigned. Somewhat irritatingly more than 30 years later, of all these quite regular lines, only two lines (of Cl X) are listed in the NIST ASD online database [34].
4. Discussion
Various plasma discharges, from the low-density plasmas of tokamaks to high-density laser-produced plasmas, as well as very-low density plasmas of electron beam ion traps or the solar corona, provide interesting spectra in all spectral ranges. I find it fascinating that a different technique, the excitation of a fast ion beam by being passed through a thin foil, offers such different properties (excitation, time-resolution, isotopic purity) that, though hampered by Doppler shifts and other problems, it can serve in a complementary role to all other spectroscopic techniques and be used to obtain wavelength and level lifetime data of all elements and all charge states. Of course, there is the cost factor of operating heavy-ion accelerators. With these machines having largely exhausted the field they had been acquired for, that is, low-energy nuclear physics as far as can be studied at a university laboratory, beam-foil spectroscopy has been losing the opportunity of being a co-user of such facilities. The technique has offered interesting research options, many of which were taken up in various laboratories around the world. One may mourn various missed opportunities, but science moves on.
In the decades beam-foil spectroscopy was pursued actively, the practitioners relied on a few key data compilations for the interpretation of their spectra, and sometimes they contributed to later editions of the same. Some of the compilations seemed to “know” so much, but, of course, not everything. Now, looking from a distance, it is interesting to see how the production and compilation of spectroscopic data show ups and downs of activity and productivity, and both reflect funding cycles of certain areas of research which at specific times were in need of data. Both the achievements and the gaps tell stories of their own.
Funding
This research received no external funding.
Institutional Review Board Statement
Not applicable.
Informed Consent Statement
Not applicable.
Data Availability Statement
Data available from the author on request.
Conflicts of Interest
The authors declare no conflict of interest.
References
- Kay, L. A van de Graaff beam as a source of atomic emission spectra. Phys. Lett. 1963, 5, 36–37. [Google Scholar] [CrossRef]
- Bashkin, S.; Meinel, A.B. Laboratory excitation of the emission spectrum of a Nova. Astrophys. J. 1964, 139, 413–415. [Google Scholar] [CrossRef]
- Martinson, I.; Gaupp, A. Atomic physics with ion accelerators—Beam-foil spectroscopy. Phys. Rep. 1974, 15, 113–180. [Google Scholar] [CrossRef]
- Berry, H.G. Beam-foil spectroscopy. Rep. Prog. Phys. 1977, 40, 155–217. [Google Scholar] [CrossRef]
- Kay, L. On the origins of beam-foil spectroscopy—I. Nucl. Instrum. Meth. Phys. Res. B 1985, 9, 544–545. [Google Scholar] [CrossRef]
- Bashkin, S. On the origins of beam-foil spectroscopy—II. Nucl. Instrum. Meth. Phys. Res. B 1985, 9, 546–548. [Google Scholar] [CrossRef]
- Mannervik, S. Optical studies of multiply excited states. Phys. Scr. 1989, 40, 28–52. [Google Scholar] [CrossRef]
- Shafroth, S.M.; Austin, J.C. Accelerator-Based Atomic Physics Techniques and Applications; American Institute of Physics: Washington, DC, USA, 1997. [Google Scholar]
- Mannervik, S. Experimental lifetime studies of metastable levels. Phys. Scr. 2003, T105, 67–75. [Google Scholar] [CrossRef]
- Träbert, E. Beam-foil spectroscopy—Quo vadis? Phys. Scr. 2008, 78, 038103. [Google Scholar] [CrossRef]
- Pinnington, E.H.; Träbert, E. Spectroscopy of ions using fast beams and ion traps. In Springer Handbook of Atomic, Molecular and Optical Physics; Drake, G.W.F., Ed.; Springer: Berlin, Germany, 2005; Chapter 18; pp. 267–276. [Google Scholar]
- Edlén, B.; Tyrén, F. Die optischen L-Spektren der Elemente Kalium bis Chrom K X, K XI, Ca XI, Ca XII, Sc XII, Ti XIII, V XIV und Cr XV. Zeits. Physik 1936, 101, 206–213. (In German) [Google Scholar] [CrossRef]
- Tyrén, F. Die optischen L-Spektren der Elemente Chrom bis Kobalt im extremen Ultraviolett. Zeits. Physik 1938, 111, 314–317. (In German) [Google Scholar] [CrossRef]
- Edlén, B.; Tyrén, F. Atomic energy states of an unusual type. Nature 1939, 143, 940–941. [Google Scholar] [CrossRef]
- Söderqvist, J. Vakuumfunkenspektren der Elemente Natrium, Magnesium, Aluminium und Silicium. Nova Acta Regiae Soc. Sci. Ups. 1934, 9, 1–103. (In German) [Google Scholar]
- Söderqvist, J. Spektren von hochionisiertem Natrium und Magnesium. Ark. Mat. Astron. Fys. 1944, 30, 1–20. (In German) [Google Scholar]
- Ferner, E. Vakuumfunkenspektren von Silicium im extremen Ultraviolett. Ark. Mat. Astron. Fys. 1941, 28, 1–21. (In German) [Google Scholar]
- Ferner, E. Die Spektren von hochionisiertem Aluminium, Silicium und Schwefel. Ark. Mat. Astron. Fys. 1948, 36, 1–65. (In German) [Google Scholar]
- Fawcett, B.C. Classification of highly ionized emission lines due to transitions from singly and doubly excited levels in sodium, magnesium, aluminium, silicon, phosphorus, sulphur and chlorine. J. Phys. B 1970, 3, 1152–1163. [Google Scholar] [CrossRef]
- Fawcett, B.C. Wavelengths and classifications of emission lines due to 2s22p2-2s2pn+1 and 2s2pn-2pn+1 transitions, Z≤28. At. Data Nucl. Data Tables 1975, 16, 135–164. [Google Scholar] [CrossRef]
- Kramida, A. Cowan code: 50 years of growing impact on atomic physics. Atoms 2019, 7, 64. [Google Scholar] [CrossRef] [Green Version]
- Cheng, K.T.; Kim, Y.K.; Desclaux, J.P. Electric dipole, quadrupole, and magnetic dipole transition probabilities of ions isoelectronic to the first-row atoms, Li through F. At. Data Nucl. Data Tables 1979, 24, 111–189. [Google Scholar] [CrossRef]
- Jönsson, P.; Gaigalas, G.; Rynkun, P.; Radžiūtė, L.; Ekman, J.; Gustafsson, S.; Hartman, H.; Wang, K.; Godefroid, M.; Froese Fischer, C.; et al. Multiconfiguration Dirac-Hartree–Fock calculations with spectroscopic accuracy: Applications to astrophysics. Atoms 2017, 5, 16. [Google Scholar] [CrossRef]
- Fawcett, B.C.; Ridgeley, A. Analysis of n = 3 to n = 4 spectra for ions from Mg X to Fe XXIV and P XI, XII. J. Phys. B At. Mol. Phys. 1981, 14, 203–208. [Google Scholar] [CrossRef]
- Edlén, B. Atomic Spectra. In Handbuch der Physik; Flügge, S., Ed.; Springer: Berlin, Germany, 1964; Volume 27, pp. 80–220. [Google Scholar]
- Curtis, L.J. Bengt Edlén’s Handbuch der Physik article—26 years later. Phys. Scr. 1987, 35, 805–810. [Google Scholar] [CrossRef]
- Edlén, B. A critical compilation of energy levels in the configurations 2sm2pk (m = 2,1,0) of F I-, O I- and Be I-like spectra. Phys. Scr. 1981, 22, 593–602. [Google Scholar] [CrossRef]
- Edlén, B. Accurate values of the energy intervals in the configurations 2s22s22pk (k = 1–5). Phys. Scr. 1982, 26, 71–83. [Google Scholar] [CrossRef]
- Edlén, B. Comparison of theoretical and experimental level values of the n = 2 complex in ions isoelectronic with Li, Be, O and F. Phys. Scr. 1983, 28, 51–67. [Google Scholar] [CrossRef]
- Edlén, B. Critical compilation of energy levels of the low configurations in boron-lLike ions. Phys. Scr. 1981, 23, 1079–1086. [Google Scholar] [CrossRef]
- Edlén, B. Comparison of theoretical and experimental level values of the n = 2 configurations in the boron isoelectronic sequence. Phys. Scr. 1983, 28, 483–495. [Google Scholar] [CrossRef]
- Kelly, R.L.; Palumbo, L.J. Atomic and Ionic Emission Lines below 2000 Å, Hydrogen through Krypton; NRL: Washington, DC, USA, 1978. [Google Scholar]
- Kelly, R.L. Atomic and ionic spectrum lines below 2000 Angstroms: Hydrogen through krypton. J. Phys. Chem. Ref. Data 1987, 16. Supplement No. 1. [Google Scholar]
- Kramida, A.; Ralchenko, Y.; Reader, J.; NIST ASD Team. NIST Atomic Spectra Database (Version 5.7.1); National Institute of Standards and Technology: Gaithersburg, MD, USA, 2019. Available online: https://physics.nist.gov/asd (accessed on 1 June 2021).
- Delaunay, B. Heavy-ion stripping. Nucl. Instrum. Meth. 1977, 146, 101–113. [Google Scholar] [CrossRef]
- Sayer, R.O. Semi-empirical formulas for heavy-ion stripping data. Rev. Phys. Appl. 1977, 12, 1543–1546. [Google Scholar] [CrossRef] [Green Version]
- Shima, K.; Kuno, N.; Yamanouchi, M.; Tawara, H. Equilibrium charge fractions of ions of Z = 4–92 emerging from a carbon foil. At. Data Nucl. Data Tab. 1992, 51, 173–241. [Google Scholar] [CrossRef]
- Middleton, R. A Negative-Ion Cookbook; Department of Physics, University of Pennsylvania: Philadelphia, PA, USA, 1990. [Google Scholar]
- Brand, K. Performance of the reflected beam sputter source. Rev. Phys. Appl. 1977, 12, 1453–1457. [Google Scholar] [CrossRef]
- Träbert, E.; Heckmann, P.H.; von Buttlar, H.; Brand, K. Beam-foil spectrum of silicon in the extreme UV. Zeits. Phys. 1976, 279, 127–133. [Google Scholar]
- Träbert, E.; Heckmann, P.H.; von Buttlar, H. Beam-foil lifetimes of highly ionized silicon. Zeits. Phys. 1977, 281, 333–339. [Google Scholar] [CrossRef]
- Träbert, E.; Heckmann, P.H.; von Buttlar, H. Highly resolved EUV beam-foil spectra of silicon. Zeits. Phys. 1979, 290, 7–12. [Google Scholar]
- Träbert, E.; Heckmann, P.H.; Schlagheck, W.; von Buttlar, H. Beam-foil lifetime studies of highly ionized silicon. Phys. Scr. 1980, 21, 27–34. [Google Scholar] [CrossRef]
- Träbert, E.; Heckmann, P.H.; Raith, B.; Sander, U. Beam-foil based efficiency calibration of a grazing-incidence spectrometer. Phys. Scr. 1980, 22, 363–366. [Google Scholar] [CrossRef]
- Träbert, E. Extended relative efficiency calibration of a grazing incidence monochromator and applications in fast-beam spectroscopy. Phys. Scr. 1984, 8, 112–116. [Google Scholar] [CrossRef]
- Buchet, J.-P.; Buchet-Poulizac, M.C. Spectrum and lifetimes of sodium between 150 Å and 400 Å. Phys. Lett. 1973, 1973 46, 273–274. [Google Scholar] [CrossRef]
- Buchet, J.-P.; Buchet-Poulizac, M.C.; Druetta, M. Mean-life measurements of Na V, Na VI and Na VII levels in the extreme ultraviolet region. Phys. Scr. 1978, 18, 496–498. [Google Scholar] [CrossRef]
- Tordoir, X.; Biémont, E.; Garnir, H.P.; Dumont, P.D.; Träbert, E. Atomic lifetimes and transition probabilities in boron-like (Na VII) and beryllium-like (Na VIII) sodium ions. Eur. Phys. J. 1999, 6, 1–7. [Google Scholar]
- Tordoir, X. Atomic Lifetime Measurements in the Pico- to Millisecond Range. Ph.D. Thesis, Université de Liège, Liège, Belgium, 2002. [Google Scholar]
- Martin, W.C.; Zalubas, R. Energy levels of sodium, Na I through Na XI. J. Phys. Chem. Ref. Data 1981, 10, 153–195. [Google Scholar] [CrossRef] [Green Version]
- Sansonetti, J.E. Wavelengths, transition probabilities, and energy levels for the spectra of sodium (Na I–Na XI). J. Phys. Chem. Ref. Data 2008, 37, 1659–1763. [Google Scholar] [CrossRef]
- Kelleher, D.E.; Podobedova, L. Atomic transition probabilities of sodium and magnesium. A critical compilation. J. Phys. Chem. Ref. Data 2008, 37, 267–706. [Google Scholar] [CrossRef]
- Doerfert, J.; Träbert, E. Relative intensities of 2s22p 2P - 2s2p22S, 2P transitions in B-like ions of oxygen through chlorine. Phys. Scr. 1993, 47, 524–530. [Google Scholar] [CrossRef]
- Granzow, J.; Heckmann, P.H.; Träbert, E. Experimental transition probabilities of the intercombination line 1s22s21S0–1s22s3p 3P1o in Be-like ions of Na through Si. Phys. Scr. 1994, 49, 148–153. [Google Scholar] [CrossRef]
- Bickel, W.S. Mean lives of some excited levels of Li I and Li II. J. Opt. Soc. Am. 1969, 59, 830–835. [Google Scholar] [CrossRef]
- Bickel, W.S.; Bergström, I.; Buchta, R.; Lundin, L.; Martinson, I. Mean lives of some doubly excited levels in lithium I. Phys. Rev. 1969, 178, 118–121. [Google Scholar] [CrossRef]
- Buchet, J.P.; Denis, A.; Desesquelles, J.; Dufay, M. Doubly excited states of lithium. Phys. Lett. 1969, 28A, 529–530. [Google Scholar] [CrossRef]
- Berry, H.G. Multiply-excited states in beam-foil spectroscopy. Phys. Scr. 1975, 12, 5–20. [Google Scholar] [CrossRef]
- Jönsson, P.; Ekman, J.; Träbert, E. MCDHF calculations and beam-foil EUV spectra of boron-like sodium ions (Na VII). Atoms 2015, 3, 195–259. [Google Scholar] [CrossRef] [Green Version]
- Martin, W.C.; Zalubas, R. Energy levels of magnesium, Mg I through Mg XII. J. Phys. Chem. Ref. Data 1980, 9, 1–58. [Google Scholar] [CrossRef] [Green Version]
- Träbert, E. New lines in the EUV spectrum of foil-excited magnesium. Phys. Scr. 1980, 21, 146–150. [Google Scholar] [CrossRef]
- Möller, G.; Träbert, E.; Heckmann, P.H. Beam-foil spectroscopy in the 3-6 nm soft-X-ray range—Lifetime of the 2s 3p 3P1o level in Be-like Mg, AI and Si. Zeits. Phys. D At. Mol. Clusters 1988, 9, 5–14. [Google Scholar] [CrossRef]
- Martin, W.C.; Zalubas, R. Energy levels of magnesium, Al I through Al XIII. J. Phys. Chem. Ref. Data 1979, 8, 817–864. [Google Scholar] [CrossRef] [Green Version]
- Kelleher, D.E.; Podobedova, L. Atomic transition probabilities of aluminum. A critical compilation. J. Phys. Chem. Ref. Data 2008, 37, 709–911. [Google Scholar] [CrossRef]
- Khardi, S.; Buchet-Poulizac, M.C.; Buchet, J.P.; Carré, M.; Denis, A.; Désesquelles, J.; Livingston, A.E.; Martin, S.; Ouerdane, Y. Beam-foil spectroscopy in the extreme UV of highly ionized silicon Si XI and the isoelectronic ions AI X, S Xlll and Ar XV. Phys. Scr. 1994, 49, 571–577. [Google Scholar] [CrossRef]
- Kramida, A.E.; Träbert, E. Extended analysis of the spectrum Si XI: Compilation plus new measurements. Phys. Scr. 1995, 51, 209–226. [Google Scholar] [CrossRef]
- Westerlind, M.; Engström, L.; Bengtsson, P.; Curtis, L.J. Experimental lifetimes of the 2p53s 1P1 and 3P1 levels in Ne-like sulfur and chlorine. Phys. Rev. 1992, 45, 6198–6201. [Google Scholar] [CrossRef]
- Träbert, E. Beam-foil Lifetimes of 2p53s 1,3P1o Levels in Ne-like Ions of Na Through S. Phys. Scr. 1996, 53, 167–173. [Google Scholar] [CrossRef]
- Curtis, L.J.; Maniak, S.T.; Ghrist, R.W.; Irving, R.E.; Ellis, D.G.; Henderson, M.; Kacher, M.H.; Träbert, E.; Granzow, J.; Bengtsson, P.; et al. Measurements and data-based predictions for Δn = 1 resonance and intercombination transitions in the Be and Ne sequences. Phys. Rev. 1995, 51, 4575–4582. [Google Scholar] [CrossRef] [PubMed]
- Kirm, M.; Bengtsson, P.; Engström, L. Experimental investigation of atomic lifetimes for the 2p53ℓ levels in Ne-like sulphur. Phys. Scr. 1996, 54, 167–173. [Google Scholar] [CrossRef]
- Träbert, E.; Winter, H.; Heckmann, P.H.; von Buttlar, H. Determination of beam-foil lifetimes <100 ps with a grazing-incidence spectrometer. Nucl. Instrum. Meth. 1976, 135, 353–357. [Google Scholar]
- Kelleher, D.E.; Podobedova, L. Atomic Transition Probabilities of Silicon. A Critical Compilation. J. Phys. Chem. Ref. Data 2008, 37, 1285–1501. [Google Scholar] [CrossRef]
- Träbert, E.; Schneider, G.; Heckmann, P.H. Beam-foil measurements of branching ratios and transition probabilities in boronlike Si X and P XI. Phys. Scr. 1983, 27, 407–412. [Google Scholar] [CrossRef]
- Vilkas, M.J.; Ishikawa, Y.; Träbert, E. Relativistic Many-Body Perturbation Calculations of Boron-Like Silicon, Si X. Phys. Scr. 2005, 72, 181–199. [Google Scholar] [CrossRef]
- White, H.E.; Eliason, A.Y. Relative intensity tables for spectrum lines. Phys. Rev. 1933, 44, 753–756. [Google Scholar] [CrossRef]
- Träbert, E.; Grieser, M.; Hoffmann, J.; Krantz, C.; Repnow, R.; Wolf, A. Heavy-ion storage-ring-lifetime measurement of metastable levels in the C-, N-, and O-like ions of Si, P, and S. Phys. Rev. A 2012, 85, 042508. [Google Scholar] [CrossRef]
- Träbert, E.; Heckmann, P.H. EUV spectrum and lifetimes of foil-excited phosphorus. Phys. Scr. 1980, 21, 35–39. [Google Scholar] [CrossRef]
- Pegg, D.J.; Haselton, H.H.; Griffin, P.M.; Laubert, R.; Mowat, J.R.; Peterson, R.; Sellin, I.A. Lifetime and binding energy of the metastable (1s2s2p) 4P5/2o state in S13+. Phys. Rev. A 1974, 9, 1112–1114. [Google Scholar] [CrossRef]
- Pegg, D.J.; Elston, S.B.; Griffin, P.M.; Hayden, H.C.; Forester, J.P.; Thoe, R.S.; Peterson, R.S.; Sellin, I.A. Dipole oscillator strengths for Δn = 0 transitions in highly ionized sulfur. Phys. Lett. 1976, 58A, 349–351. [Google Scholar] [CrossRef]
- Pegg, D.J.; Elston, S.B.; Griffin, P.M.; Hayden, H.C.; Forester, J.P.; Thoe, R.S.; Peterson, R.S.; Sellin, I.A. Radiative lifetimes and transition probabilities for electric-dipole Δn=0 transitions in highly stripped sulfur ions. Phys. Rev. A 1976, 14, 1036–1041. [Google Scholar] [CrossRef]
- Pegg, D.J.; Forester, J.P.; Elston, S.B.; Griffin, P.M.; Groeneveld, K.-O.; Peterson, R.S.; Thoe, R.S.; Vane, C.R.; Sellin, I.A. The splitting and oscillator strengths for the 2s 2S–2p 2Po doublet in lithium-like sulfur. Astrophys. J. 1977, 214, 331–333. [Google Scholar] [CrossRef]
- Pegg, D.J.; Forester, J.P.; Vane, C.R.; Elston, S.B.; Griffin, P.M.; Groeneveld, K.-O.; Peterson, R.S.; Thoe, R.S.; Sellin, I.A. Oscillator strengths for in-shell (Δn = 0) dipole transitions in Li- and Be-like sulfur. Phys. Rev. A 1977, 15, 1958–1962. [Google Scholar] [CrossRef]
- Forester, J.P.; Pegg, D.J.; Griffin, P.M.; Alton, G.D.; Elston, S.B.; Hayden, H.C.; Thoe, R.S.; Vane, C.R.; Wright, J.J. Radiative lifetimes and oscillator strengths for allowed intra-L-shell transitions in multiply charged chlorine ions. Phys. Rev. A 1978, 18, 1476–1480. [Google Scholar] [CrossRef]
- Thornbury, J.F.; Hibbert, A.; Träbert, E. The lifetimes of the 3s24s 2S states in the aluminium sequence. Phys. Scr. 1989, 40, 472–477. [Google Scholar] [CrossRef]
- Thornbury, J.F.; Träbert, E.; Möller, G.; Heckmann, P.H. Beam-foil lifetime measurements on the 3s24s 2S states in the aluminium sequence, Cl V to Mn XIII. Phys. Scr. 1990, 42, 700–704. [Google Scholar] [CrossRef]
Figure 1.
Beam-foil spectra of (a) Na, (b) Mg, (c) Al, and (d) Si of the vicinity of the 3d–4f transition array in the Li-like ion. The ion beam energies used in the measurements are noted in the plots. Spectra (a) through (c) used a diffraction grating of 600 ℓ/mm, spectrum (d) a diffraction grating of 3600 ℓ/mm. The line width (FWHM) is 0.038 nm in (a,c), 0.030 nm in (b), and 0.020 nm in (d). The 3d–4f and 3p–4d lines are marked.

Figure 2.
Beam-foil spectra of Na recorded at ion beam energies of (a) 7 MeV, (b) 4.5 MeV, (c) 3 MeV, (d) 1.5 MeV. Grating 600 ℓ/mm, line width (FWHM) 0.03 nm in (a) and 0.024 nm in (b–d). The strongest lines are identified by the spectrum number. There are few suitable reference lines in this section of the spectra. In (b), a blue marker indicates a suspected noise burst. In (c), a blue bar indicates a suspect data record. The peculiar spectrum (c) is discussed in the text.

Figure 3.
Beam-foil spectra of Na recorded at ion beam energies of (a) 7 MeV, (b) 4.5 MeV, (c) 3 MeV, (d) 1.5 MeV. Continuation of the spectra in Figure 2. The strongest lines are identified by the spectrum number. Question marks in (a,b) indicate a reasonably intense, reproducible line near 27.4 nm that has not yet been identified. The peculiar spectrum (c) is discussed in the text.

Figure 4.
Beam-foil spectra of Na recorded at ion beam energies of (a) 7 MeV, (b) 4.5 MeV, (c) 3 MeV, (d) 1.5 MeV. Continuation of the spectra in Figure 3. The strongest lines are identified by the spectrum number. Near a wavelength of 33.7 nm an unresolved line group (tagged by question marks) shows in (a,b) that has not yet been identified.

Figure 5.
Beam-foil spectra of Na recorded at ion beam energies of (a) 7 MeV, (b) 4.5 MeV, (c) 3 MeV. Continuation of the spectra in Figure 4. The strongest lines are identified by the spectrum number. The blue marker in (b) shows where a Na VII line is missing. The peculiar spectrum (c) is discussed in the text. The blue bars in (c) indicate a range with suspect data features.

Figure 6.
Beam-foil spectrum of Mg recorded at an ion beam energy of 15 MeV. Grating 600 ℓ/mm, line width (FWHM) 0.024 nm. The strongest lines are identified by the spectrum number. In the wavelength sections marked by blue bars, the dwell time per data channel was significantly reduced in order to cover the lines of interest within the lifetime of a single exciter foil. The topic of interest were line intensities in the n = 2 level manifold in B-like ions (here Mg VIII) [53].

Figure 7.
Beam-foil spectra of Mg recorded at an ion beam energy of 19 MeV. Diffraction grating 300 ℓ/mm, line width (FWHM) 0.35 nm. (a) Measurement at the foil, (b) measurement 2 mm downstream of the foil. The strongest lines are identified by the (Roman) spectrum number and (Arabic) diffraction order.

Figure 8.
Beam-foil spectrum of the vicinity of the Mg X 3d–4f transition recorded at an ion beam energy of 19 MeV. Diffraction grating 600 ℓ/mm, line width (FWHM) 0.03 nm.
Figure 8.
Beam-foil spectrum of the vicinity of the Mg X 3d–4f transition recorded at an ion beam energy of 19 MeV. Diffraction grating 600 ℓ/mm, line width (FWHM) 0.03 nm.

Figure 9.
Beam-foil spectrum of Al recorded at an ion beam energy of 24 MeV. Diffraction grating 600 ℓ/mm, line width (FWHM) 0.045 nm. The 3d–4f transition arrays in the Li-, Be- and B-like ion of Na are identified by the spectrum number.
Figure 9.
Beam-foil spectrum of Al recorded at an ion beam energy of 24 MeV. Diffraction grating 600 ℓ/mm, line width (FWHM) 0.045 nm. The 3d–4f transition arrays in the Li-, Be- and B-like ion of Na are identified by the spectrum number.

Figure 10.
Beam-foil spectrum of Al recorded at an ion beam energy of 1.5 MeV. Diffraction grating 600 ℓ/mm, line width (FWHM) 0.035 nm. The strongest lines are identified by the spectrum number, as far as literature data are available.
Figure 10.
Beam-foil spectrum of Al recorded at an ion beam energy of 1.5 MeV. Diffraction grating 600 ℓ/mm, line width (FWHM) 0.035 nm. The strongest lines are identified by the spectrum number, as far as literature data are available.

Figure 11.
Beam-foil spectra of (a) Na, (b) Mg, (c) Al, (d) Si, (e) P, (f) S recorded at the ion beam energies indicated. Diffraction grating 600 l/mm. (a–d) observation in the first diffraction order, (e,f) in the second diffraction order. The strongest lines are identified by the Roman spectrum number; second-diffraction order lines are denoted by an Arabic “2”. The principal features are the resonance and intercombination lines in the respective Ne-like ions.

Figure 12.
Beam-foil spectra of Si recorded at an ion beam energy of 28 MeV. Diffraction grating 600 ℓ/mm, line width (FWHM) 0.045 nm. (a) Measurement at the foil, (b) measurement at a position 5 mm downstream (delay 350 ps). The strong lines arise from the Si XII 2s S–2p P transitions, the line in between from the Si XII 5g–6h yrast transitions.

Figure 13.
Beam-foil spectra of Si. Diffraction grating 600 l/mm, line width (FWHM) 0.03 nm in (a) recorded at an ion beam energy of 13 MeV, (b) at 8 MeV, (c) at 5 MeV. The strongest lines are identified by the spectrum number. Question marks indicate examples of reproducible, statistically reliable lines that have not been identified yet.

Figure 14.
Beam-foil spectra of Si. Continuation of the spectra in Figure 13. Diffraction grating 600 ℓ/mm, line width (FWHM) 0.03 nm in (a) recorded at an ion beam energy of 13 MeV, (b) at 8 MeV, (c) at 5 MeV. The strongest lines are identified by the spectrum number. The green colour field comprises lines of Si VII, Si VIII and Si X. At the highest ion beam energy, the Si VII lines are almost absent, and the Si VIII lines that dominates at a low ion beam energy has been replaced by an Si X line of almost identical wavelength.

Figure 15.
Beam-foil spectra of Si. Continuation of the spectra in Figure 14. Diffraction grating 600 ℓ/mm, line width (FWHM) 0.03 nm. Spectrum (a) recorded at an ion beam energy of 13 MeV, (b) at 8 MeV, (c) at 5 MeV. The strongest lines are identified by the spectrum number. The green colour field near 32 nm comprises a Si VIII line multiplet that helps with the visual orientation is such spectra. The green colour field near 35 nm points to a group of lines of Si IX and Si X and their relative line intensity variation with the variation of the ion beam energy.

Figure 16.
Beam-foil spectrum of Cl recorded at an ion beam energies of 1.4 MeV. Diffraction grating 600 ℓ/mm, line width (FWHM) 0.06 nm. The strongest lines are identified by the spectrum number. Many more lines can be recognized by eye (fiducial markers), but have not yet been identified.
Figure 16.
Beam-foil spectrum of Cl recorded at an ion beam energies of 1.4 MeV. Diffraction grating 600 ℓ/mm, line width (FWHM) 0.06 nm. The strongest lines are identified by the spectrum number. Many more lines can be recognized by eye (fiducial markers), but have not yet been identified.

Figure 17.
Beam-foil spectrum of Cl recorded at an ion beam energy of 28 MeV. Diffraction grating 600 ℓ/mm, line width (FWHM) 0.025 nm. The strongest lines are identified by the spectrum number.
Figure 17.
Beam-foil spectrum of Cl recorded at an ion beam energy of 28 MeV. Diffraction grating 600 ℓ/mm, line width (FWHM) 0.025 nm. The strongest lines are identified by the spectrum number.

Figure 18.
Beam-foil spectrum of Cl recorded at an ion beam energy of 28 MeV, 5 mm downstream of the exciter foil (delay 400 ps). Diffraction grating 600 ℓ/mm, line width (FWHM) 0.06 nm. The strongest lines are identified by the spectrum number.
Figure 18.
Beam-foil spectrum of Cl recorded at an ion beam energy of 28 MeV, 5 mm downstream of the exciter foil (delay 400 ps). Diffraction grating 600 ℓ/mm, line width (FWHM) 0.06 nm. The strongest lines are identified by the spectrum number.


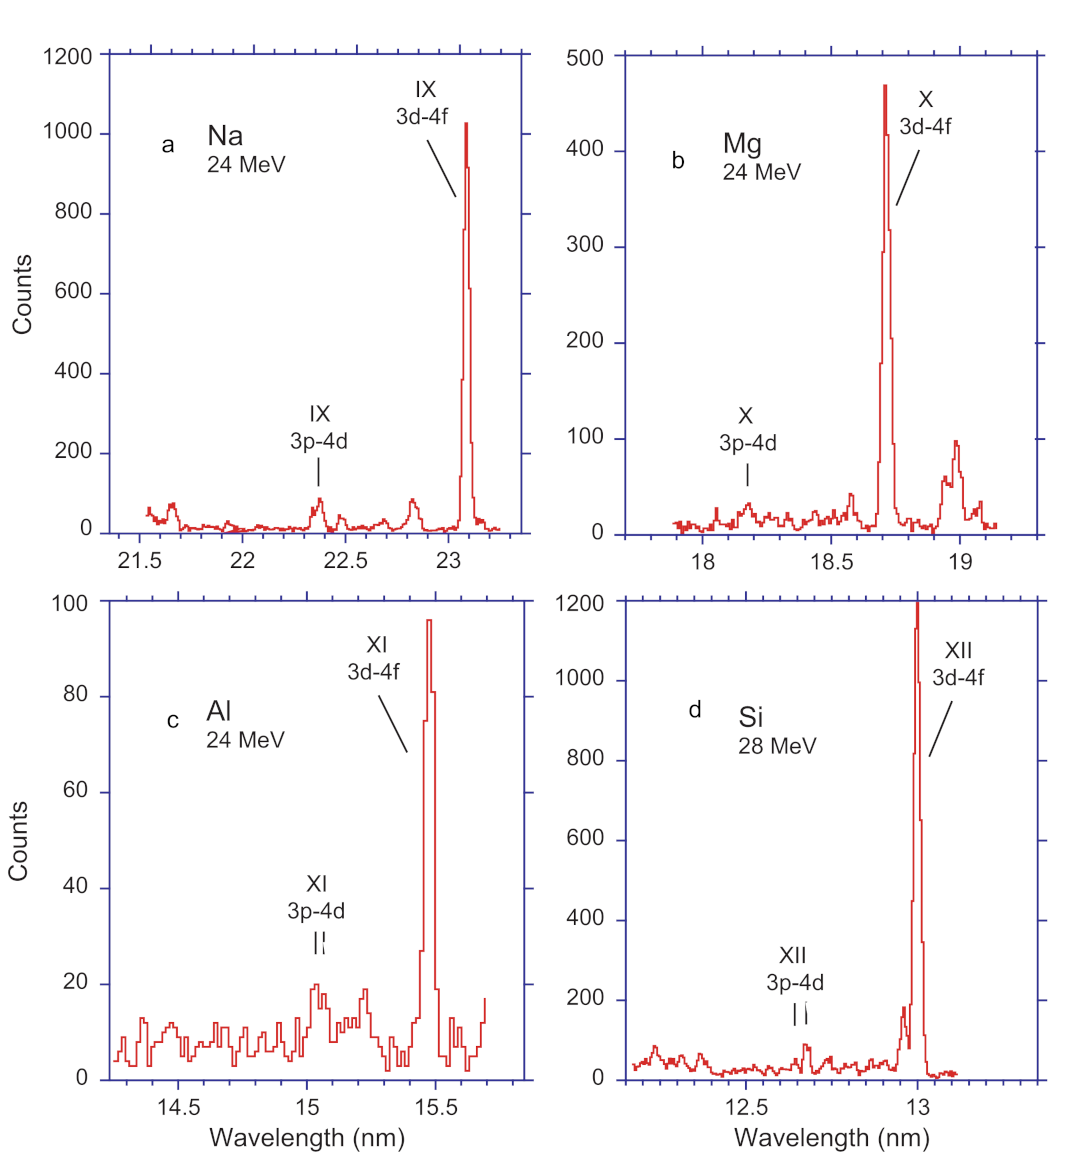
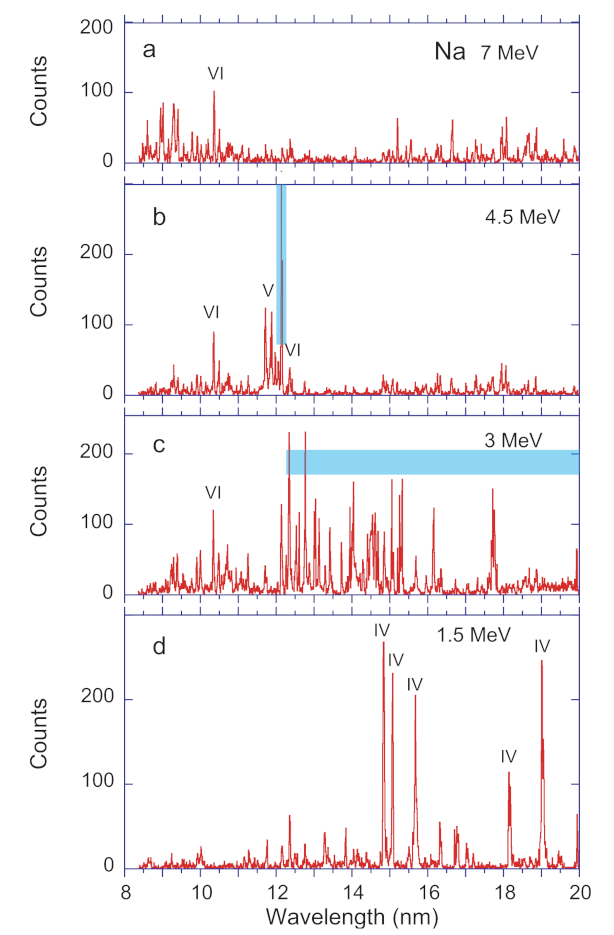
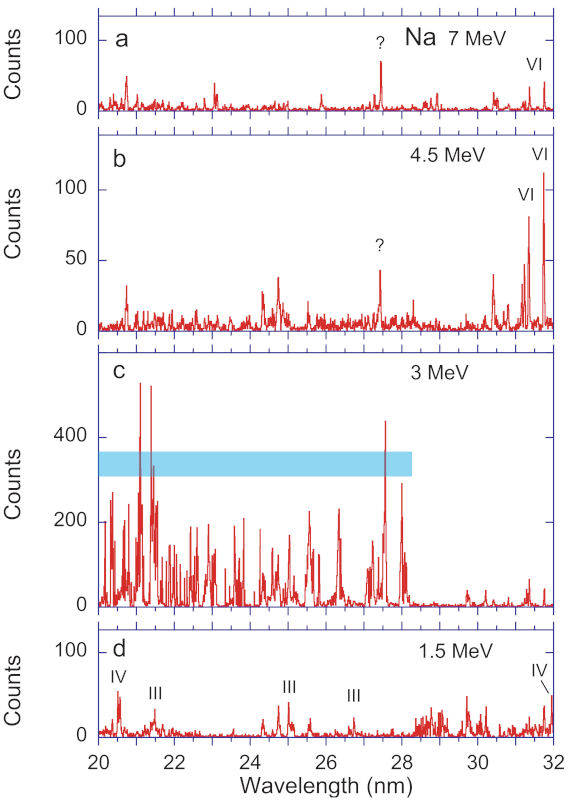
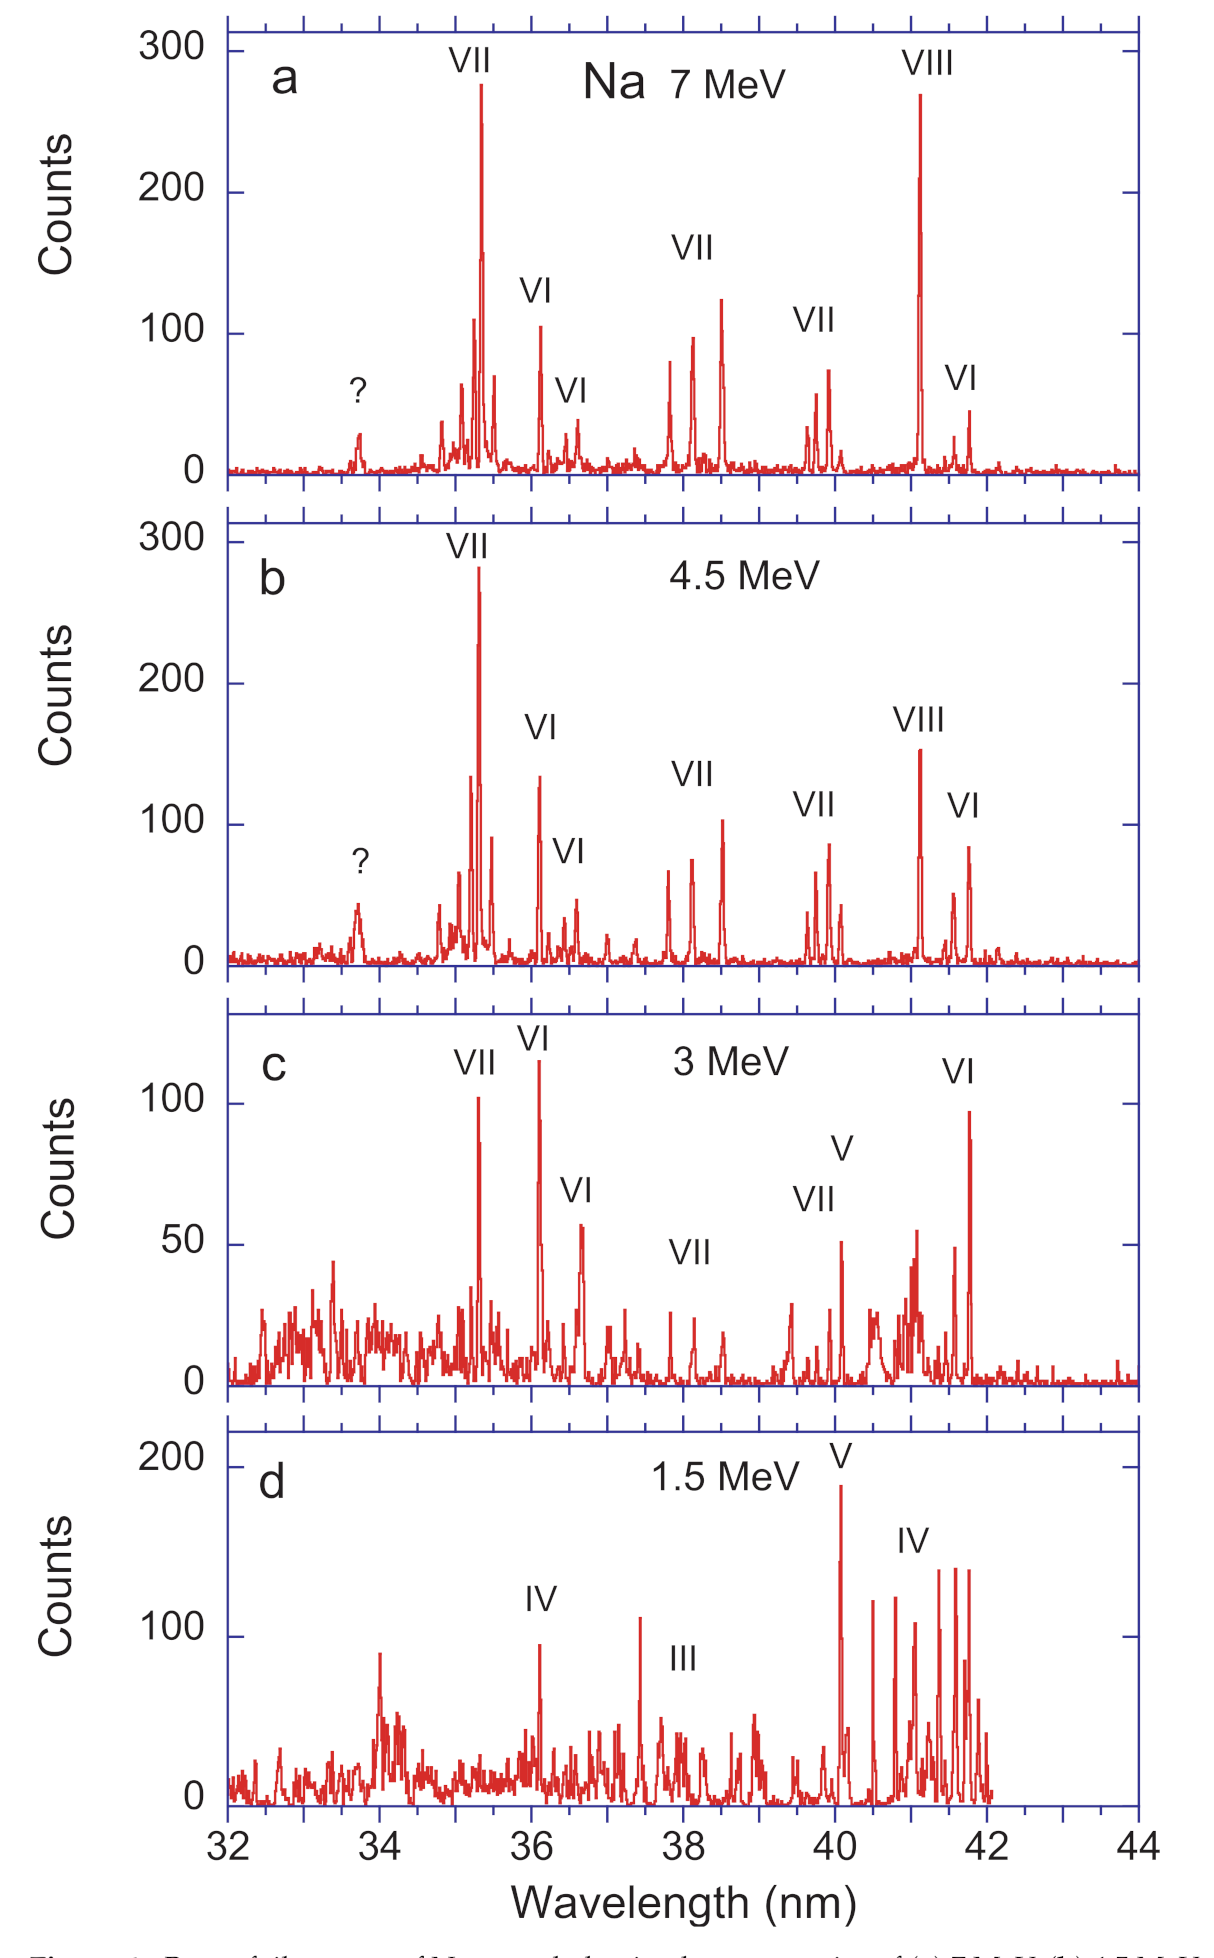
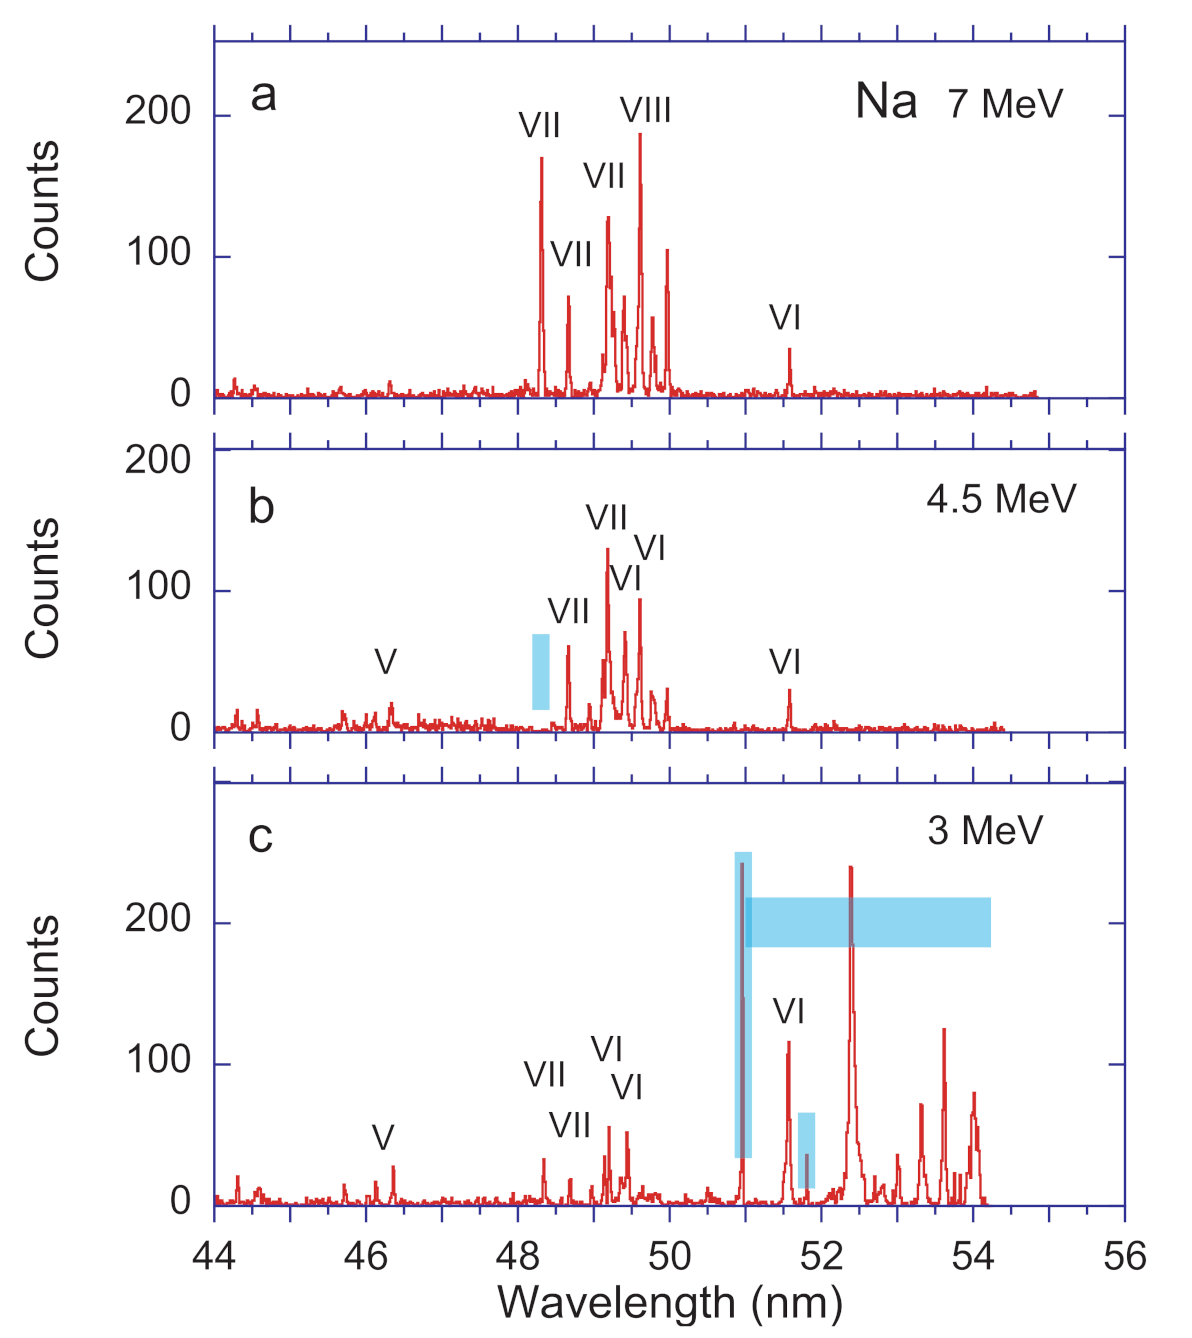
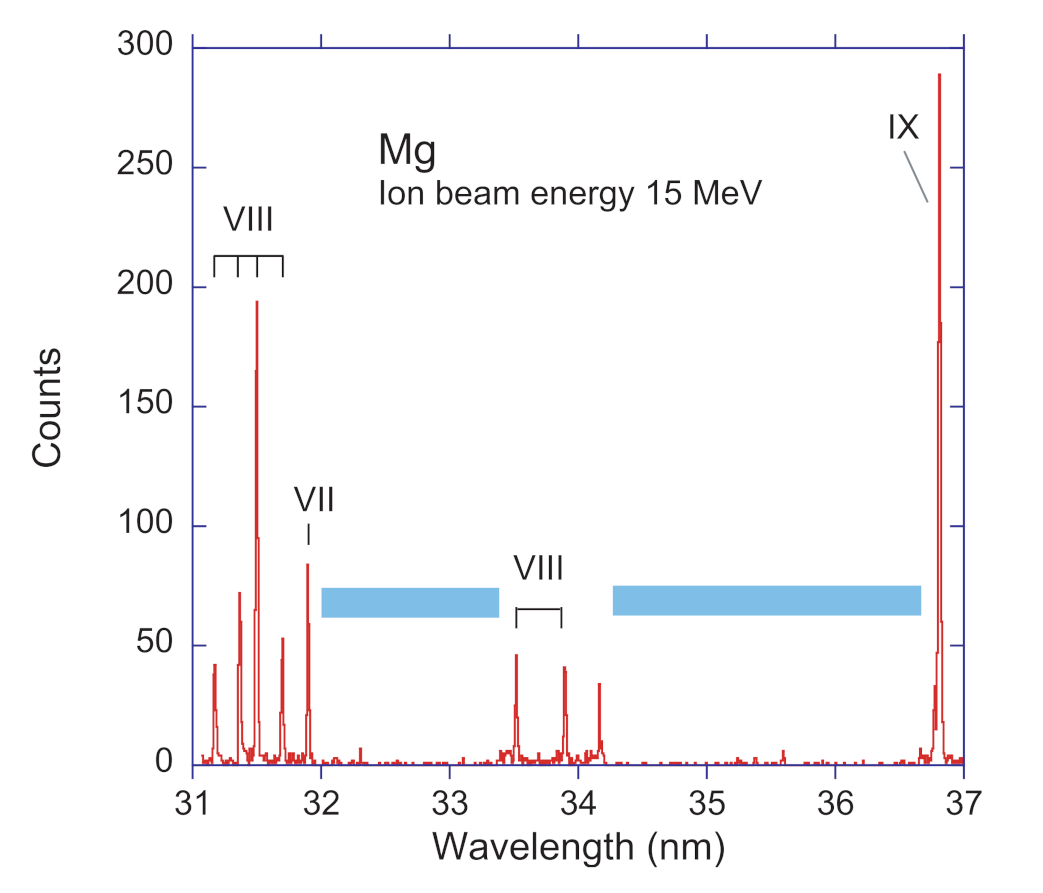
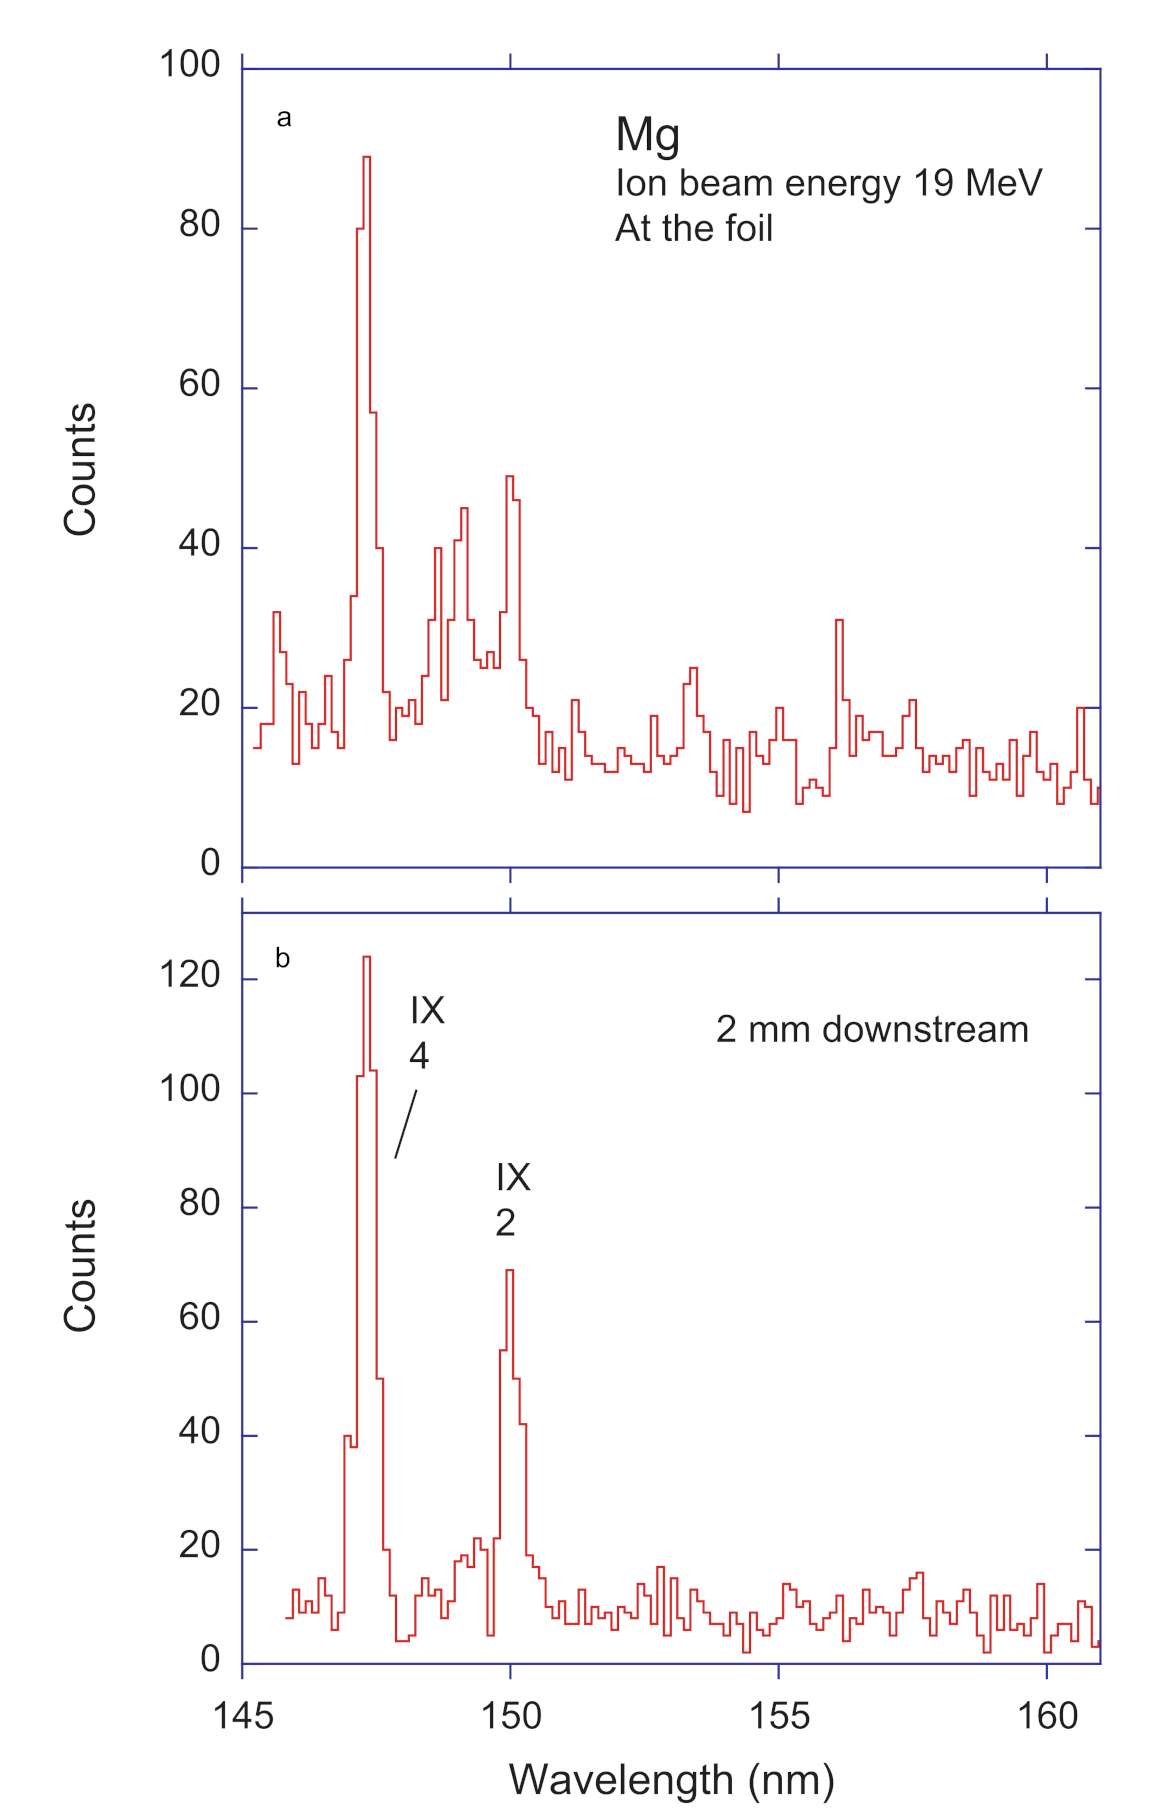
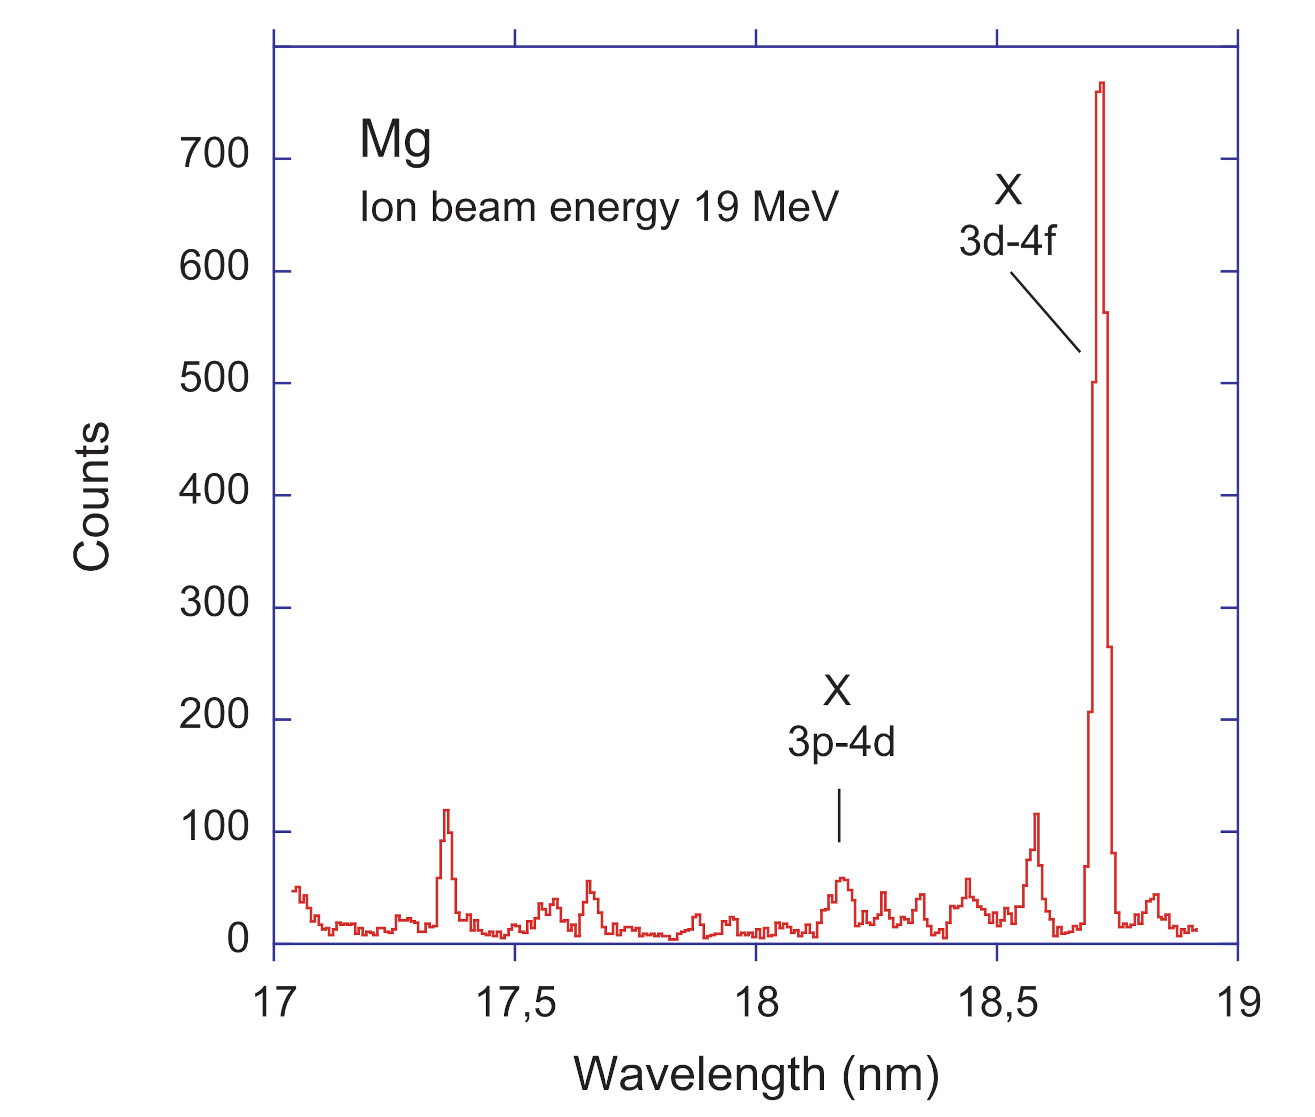
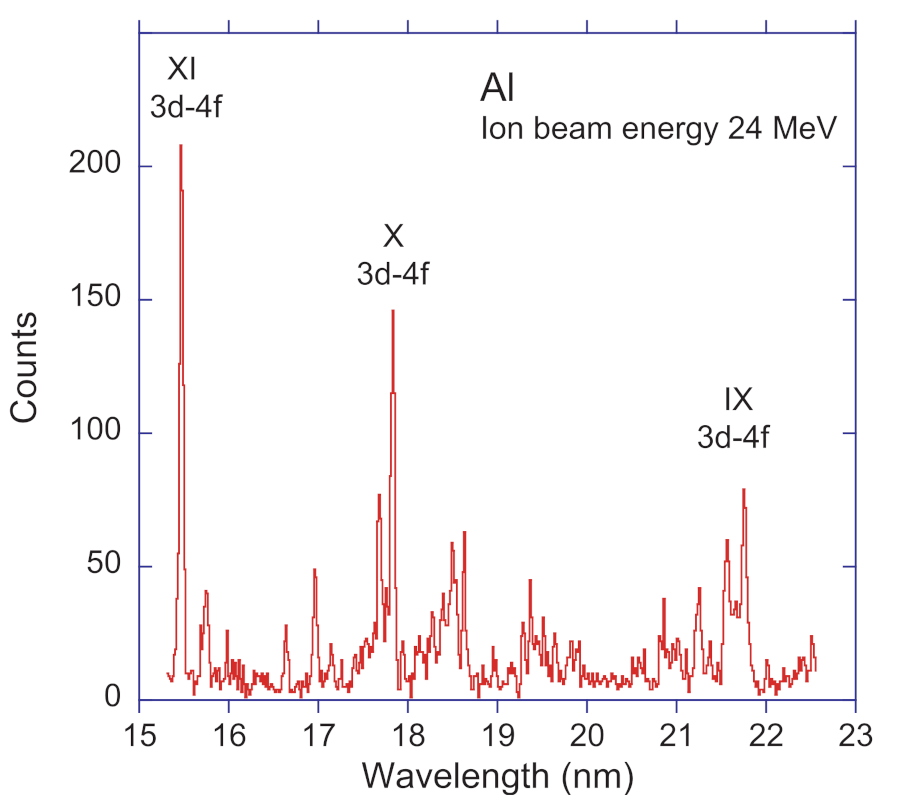
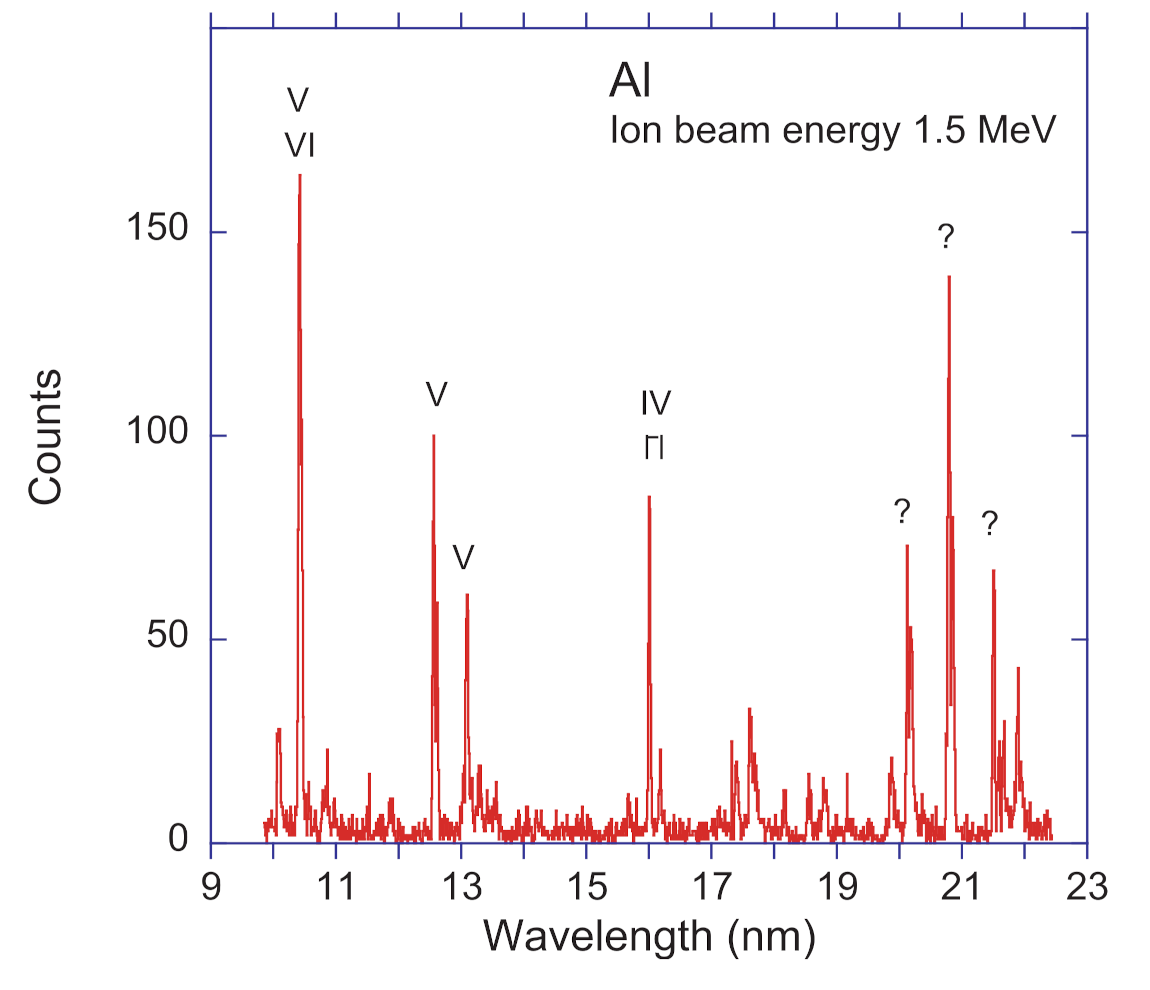
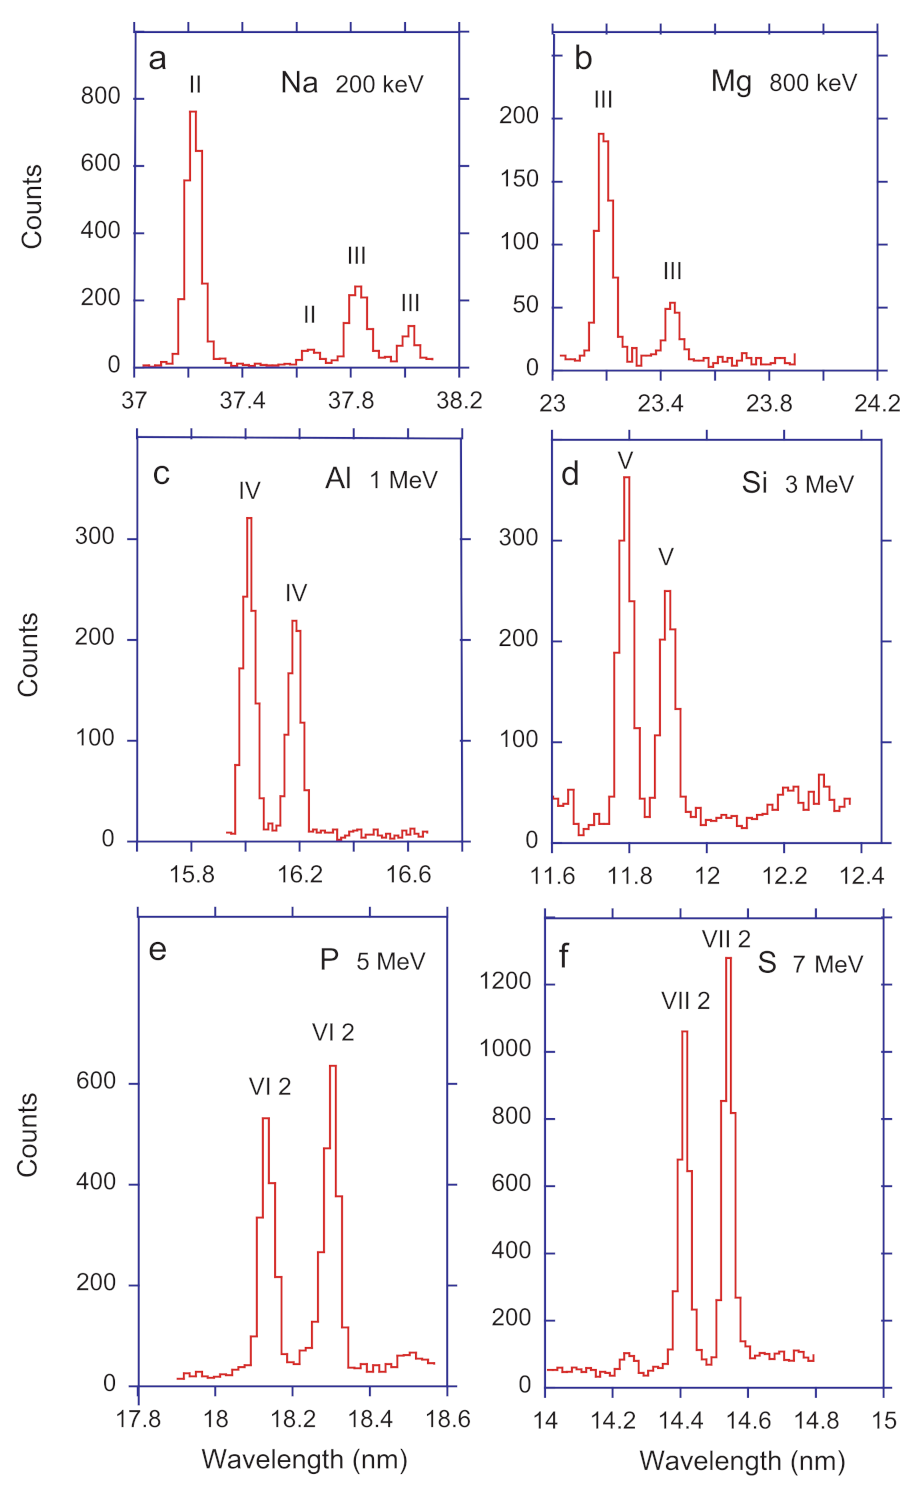
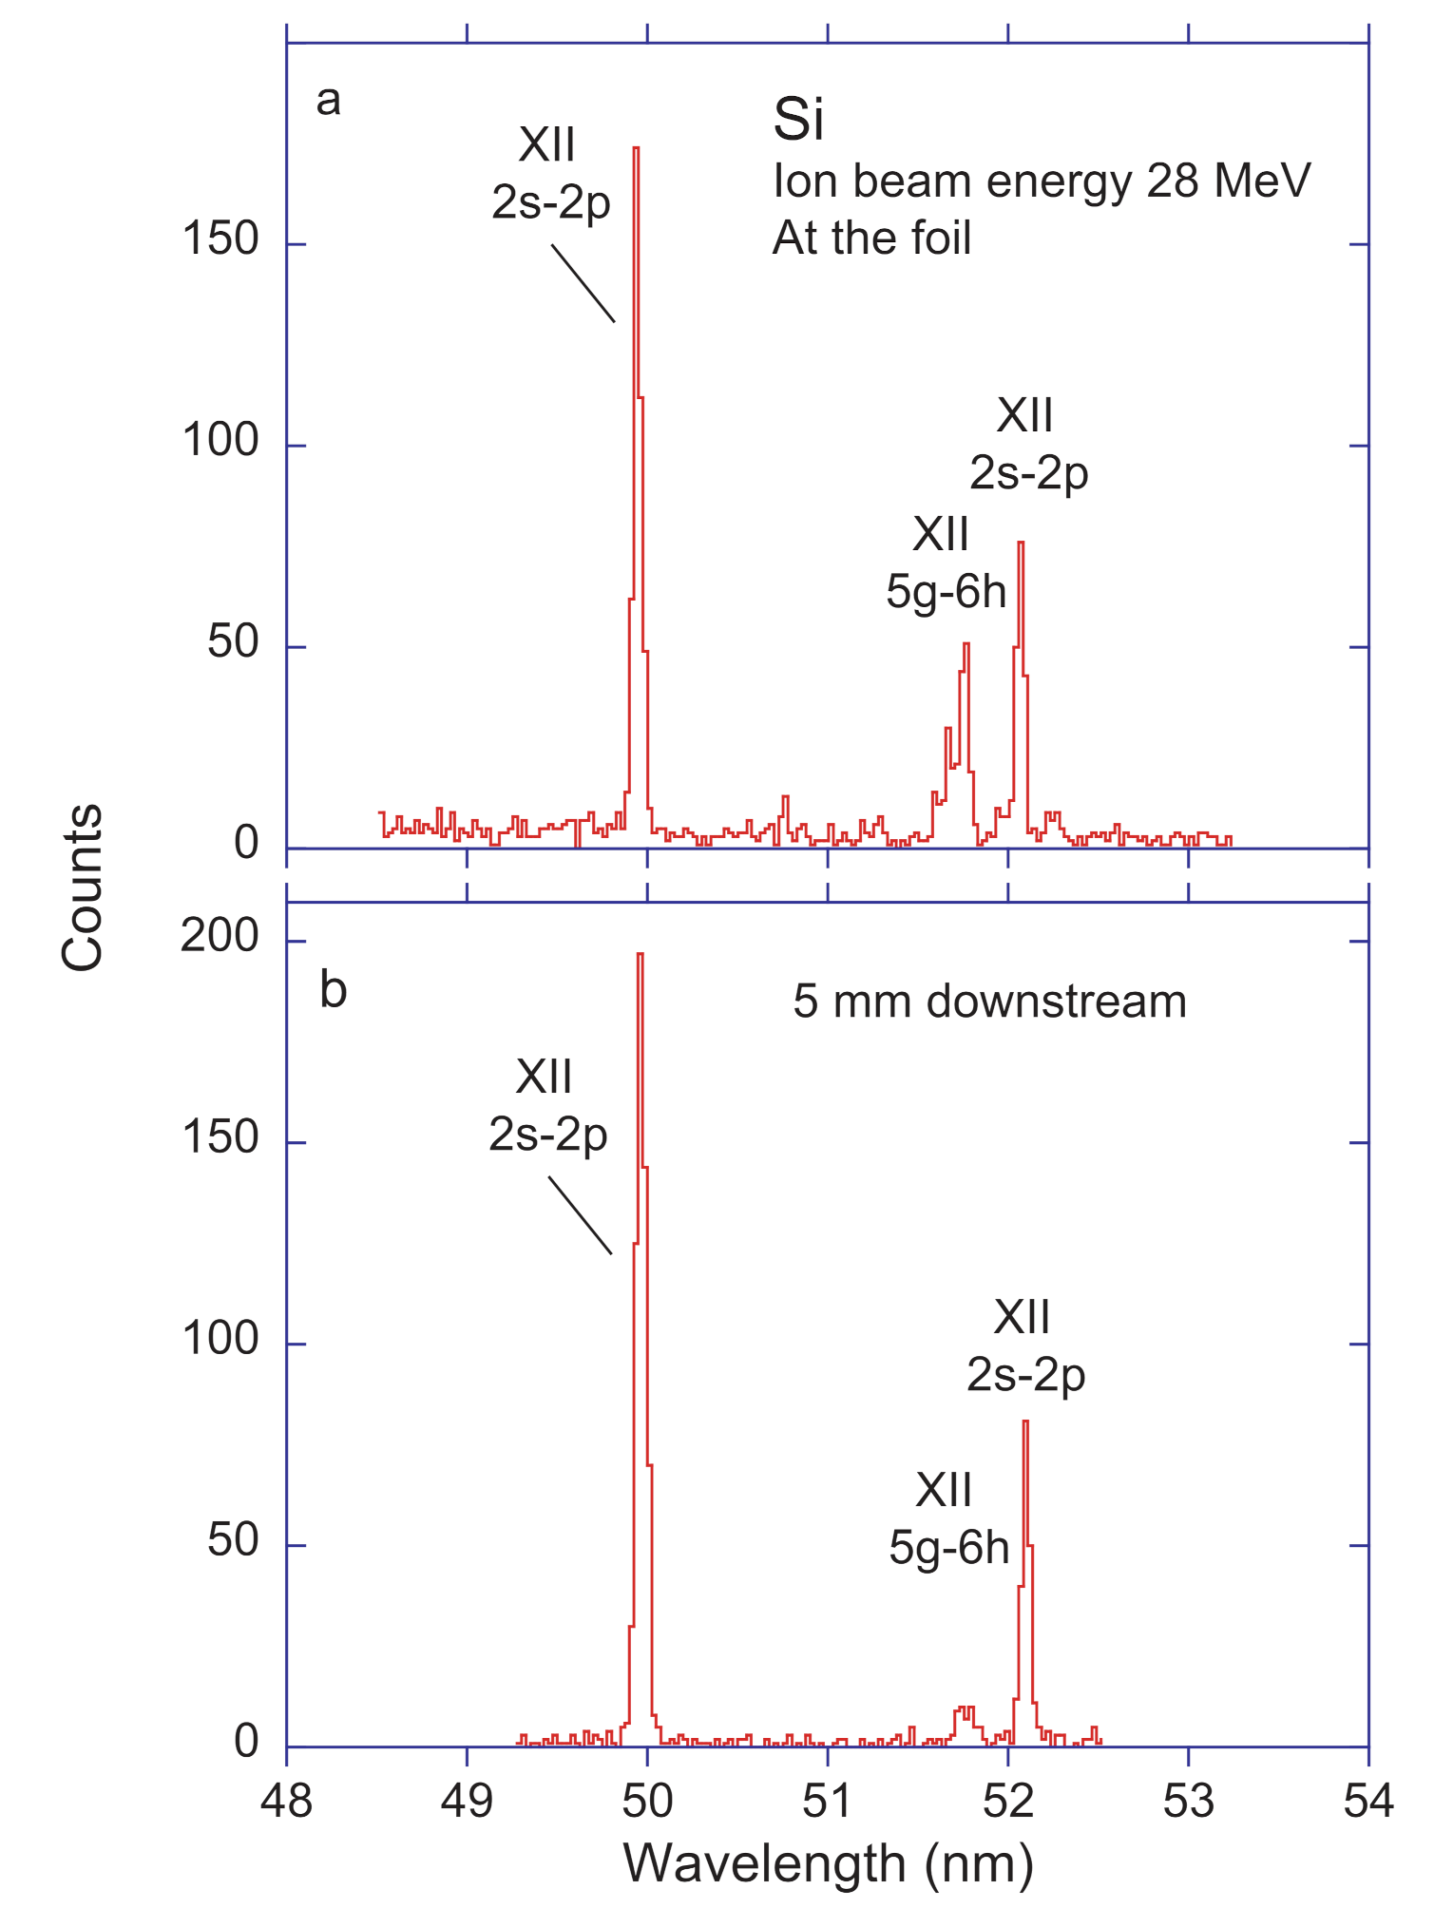
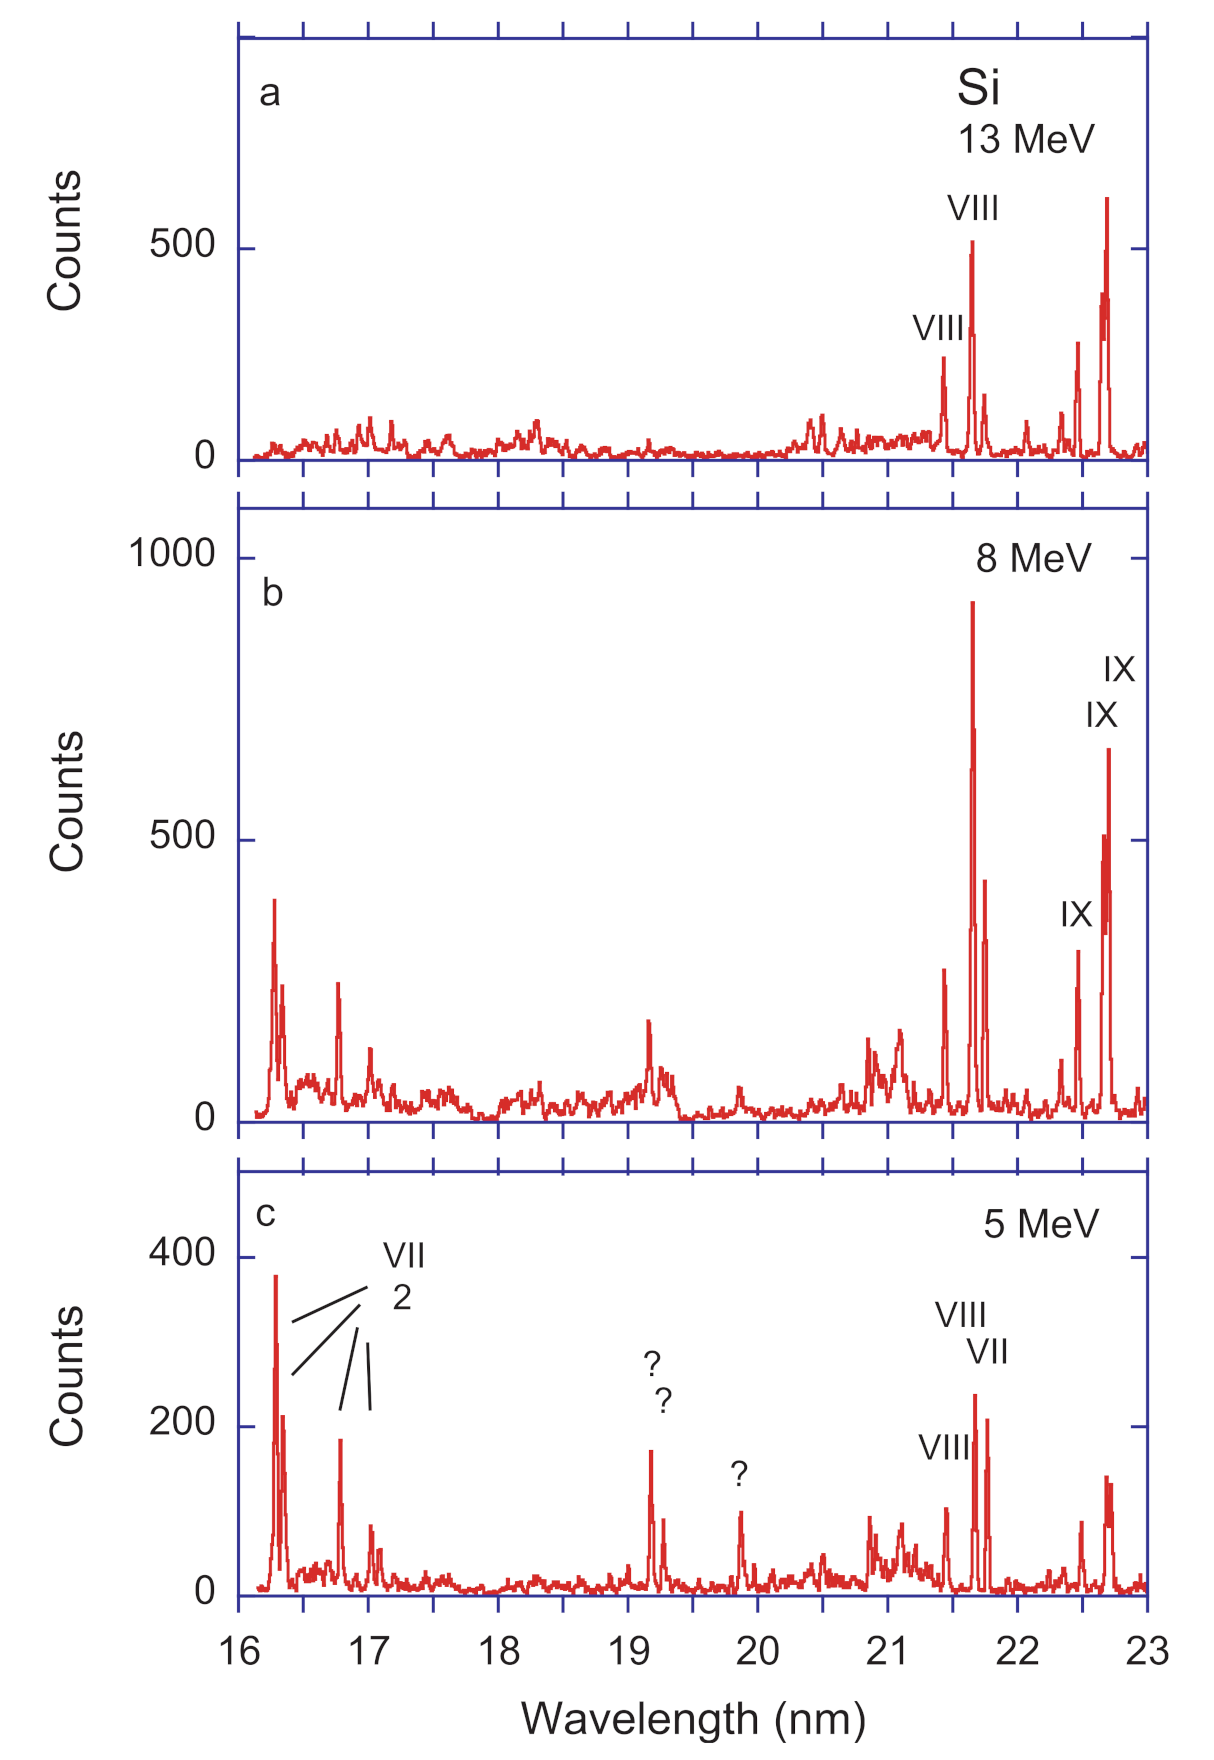
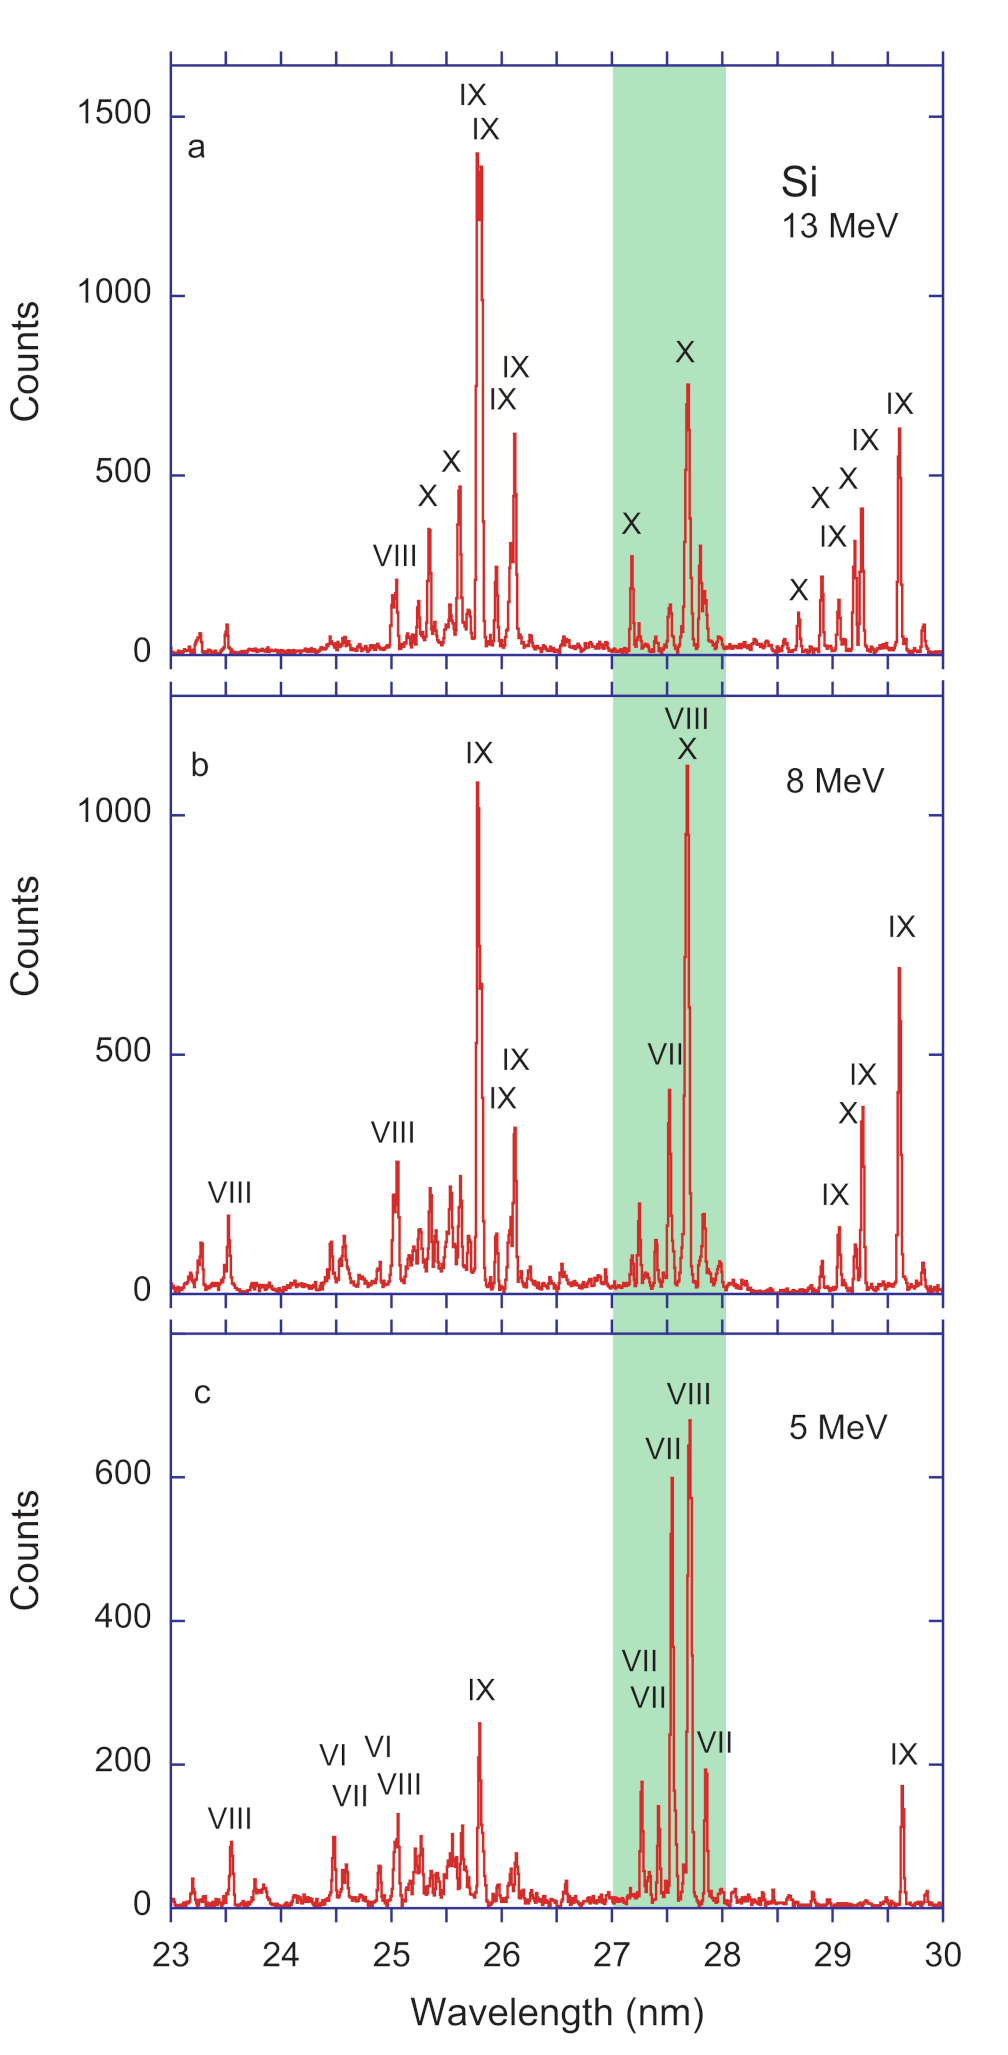
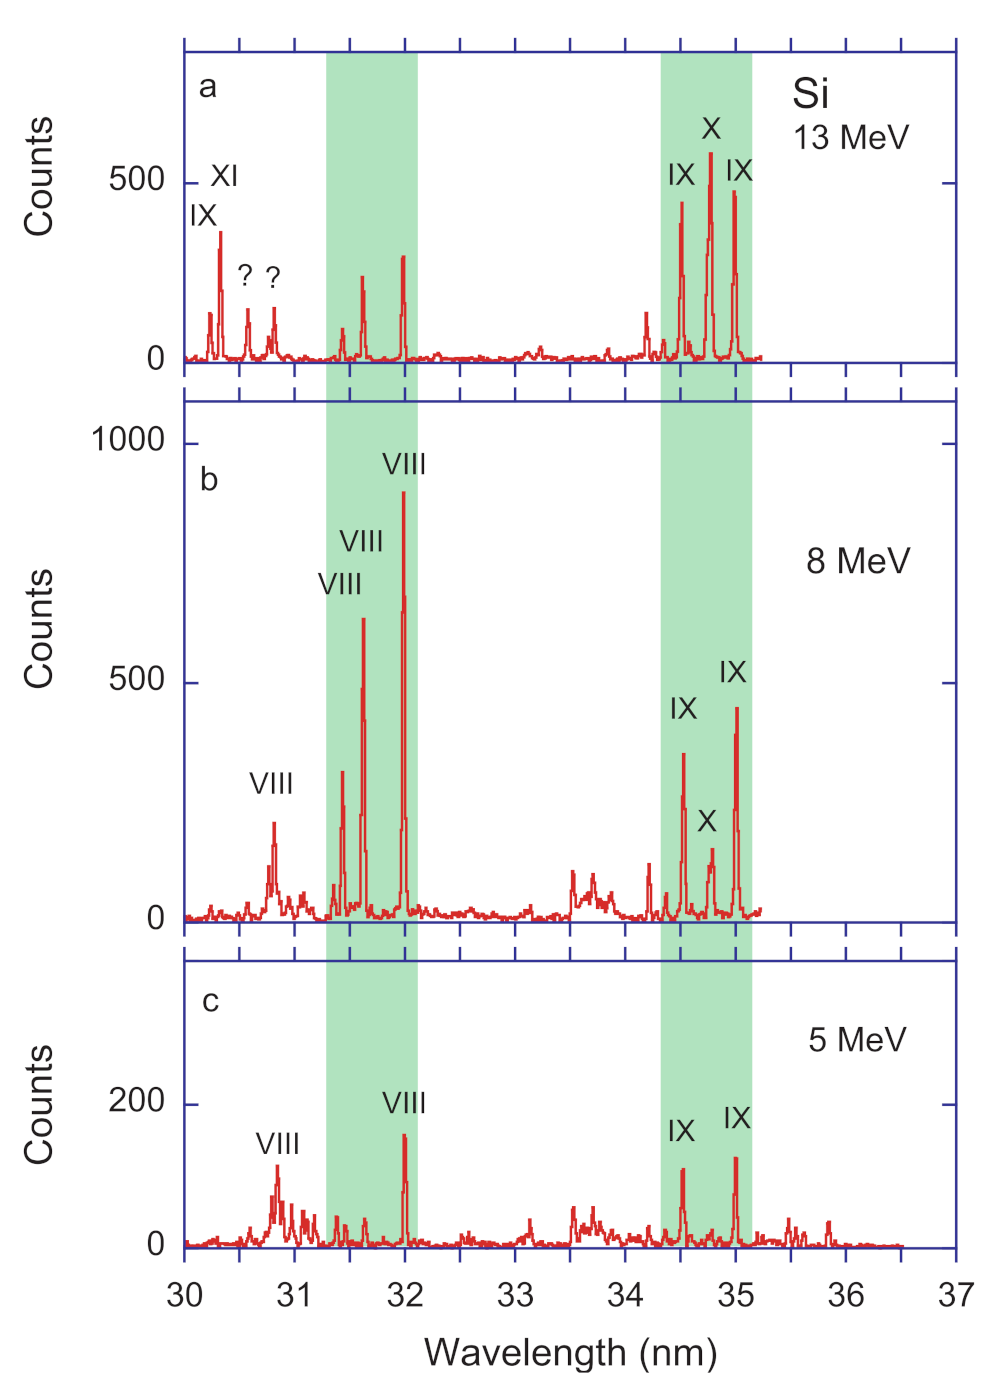
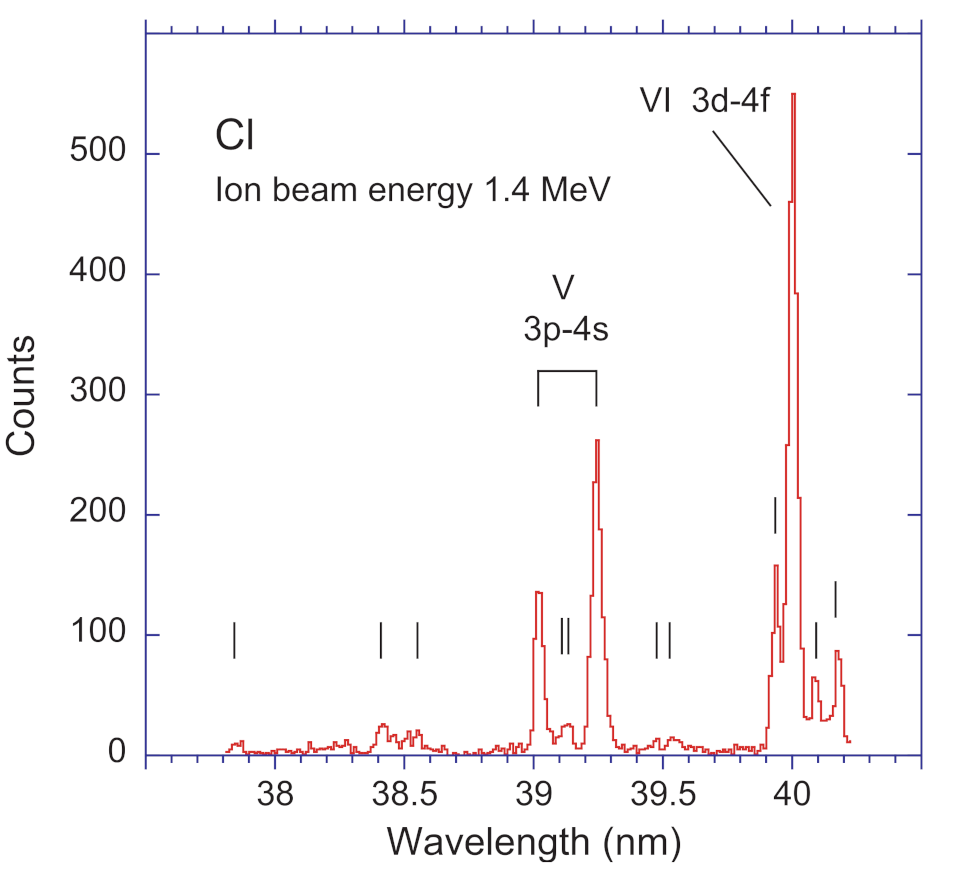
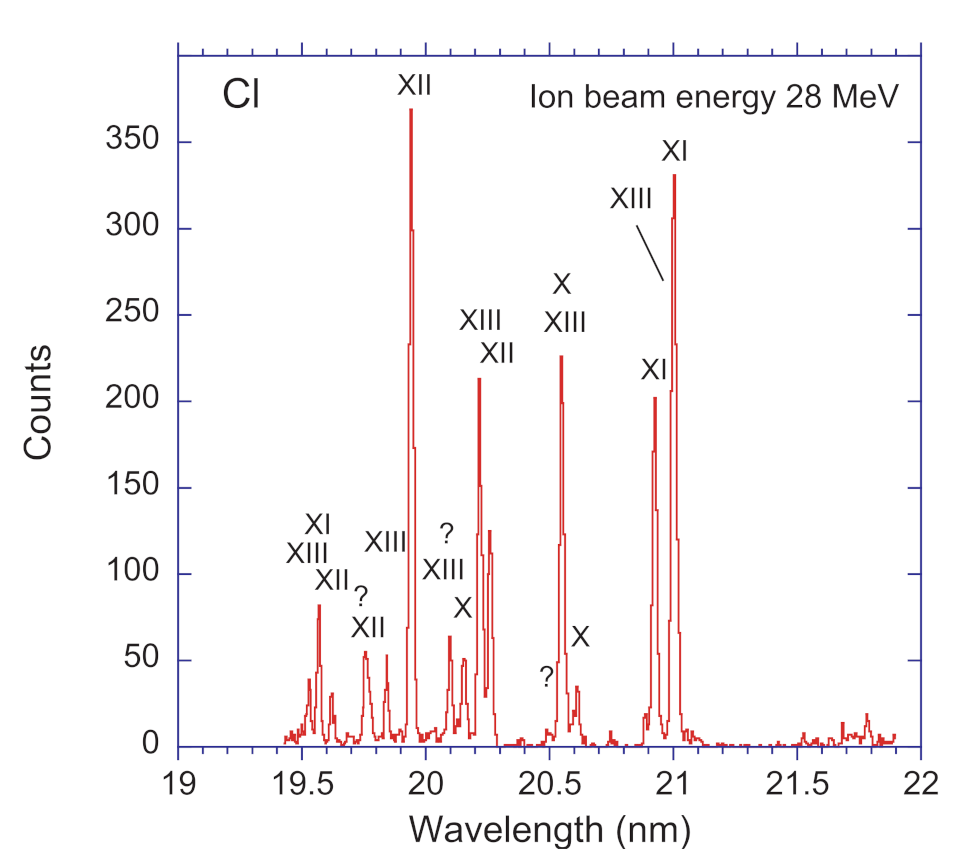
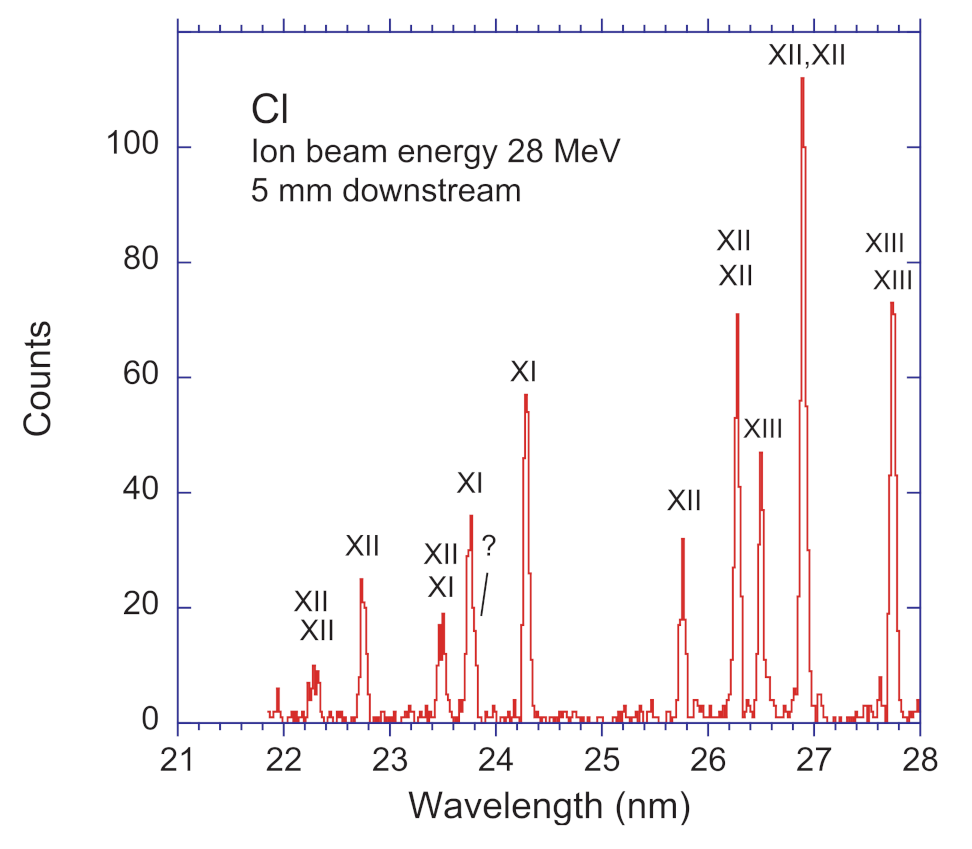
Table 1.
EUV wavelengths (in nm) of 1s3d–4f yrast transitions in Li-like spectra measured by Fawcett and Ridgeley [24]) or estimated in hydrogenic approximation. The real – (with and ) transition arrays are expected on the short-wavelength side of the Bohr formula estimate.
Table 1.
EUV wavelengths (in nm) of 1s3d–4f yrast transitions in Li-like spectra measured by Fawcett and Ridgeley [24]) or estimated in hydrogenic approximation. The real – (with and ) transition arrays are expected on the short-wavelength side of the Bohr formula estimate.
| Measurement [24] | Hydrogenic | ||
|---|---|---|---|
| Spectrum | J = 3/2 − J = 5/2 | J = 5/2 − J = 7/2 | Estimate |
| Na IX | — | — | 23.14 |
| Mg X | 18.707 | 18.718 | 18.75 |
| Al XI | 15.460 | 15.469 | 15.49 |
| Si XII | 12.989 | 12.998 | 13.02 |
Publisher’s Note: MDPI stays neutral with regard to jurisdictional claims in published maps and institutional affiliations. |
© 2021 by the author. Licensee MDPI, Basel, Switzerland. This article is an open access article distributed under the terms and conditions of the Creative Commons Attribution (CC BY) license (https://creativecommons.org/licenses/by/4.0/).
Share and Cite
MDPI and ACS Style
Träbert, E. Extreme-Ultraviolet Beam-Foil Spectra of Na through Cl. Atoms 2021, 9, 93. https://0-doi-org.brum.beds.ac.uk/10.3390/atoms9040093
AMA Style
Träbert E. Extreme-Ultraviolet Beam-Foil Spectra of Na through Cl. Atoms. 2021; 9(4):93. https://0-doi-org.brum.beds.ac.uk/10.3390/atoms9040093
Chicago/Turabian StyleTräbert, Elmar. 2021. "Extreme-Ultraviolet Beam-Foil Spectra of Na through Cl" Atoms 9, no. 4: 93. https://0-doi-org.brum.beds.ac.uk/10.3390/atoms9040093
Note that from the first issue of 2016, this journal uses article numbers instead of page numbers. See further details here.